

Shadowfax Technologies Ltd (SHADOWFAX)
Stock Analysis Report
Stock Journey
Key Positives and Key Risks
Pros
- Revenue growth of 65.5% quarterly demonstrates strong top-line expansion.
- Robust cash balance of INR 5.58 billion provides liquidity for operations and growth.
- Low debt-to-equity ratio of 21.26% indicates conservative leverage and financial stability.
Cons
- Extremely high trailing P/E ratio of 442.57 suggests stretched valuation relative to earnings.
- Negative operating cash flow of INR -957.7 million indicates ongoing cash burn.
- Client concentration risks raise concerns about revenue stability and diversification.
Disclosure: This information is for general awareness and does not constitute investment advice
Report Summary
Shadowfax Technologies Ltd operates as a technology-driven third-party logistics (3PL) company in India, providing comprehensive end-to-end logistics solutions. Its services span e-commerce, quick commerce, food marketplaces, hyperlocal services, and on-demand mobility platforms. Listed on the NSE under the Industrials sector, Shadowfax leverages an asset-light model supported by a vast network of over 205,000 delivery partners and proprietary technology tools such as AI-based routing and real-time tracking. The company serves prominent clients including Meesho, Flipkart, Swiggy, and Zomato, operating across more than 14,700 pin codes and 2,200 cities and towns.
Financially, Shadowfax reported trailing twelve months (TTM) revenue of INR 36.78 billion with a modest net profit margin of 1.25% and an operating margin of 2.95%, reflecting early-stage profitability in a capital-intensive sector. The return on equity (ROE) stands at 0.97%, and return on assets (ROA) is 0.51%, indicating limited efficiency in asset utilization and equity returns. Despite positive net income of INR 460 million, the company’s operating cash flow remains negative at INR -957.7 million, though levered free cash flow is slightly positive at INR 64.26 million, highlighting ongoing investment and operational cash demands.
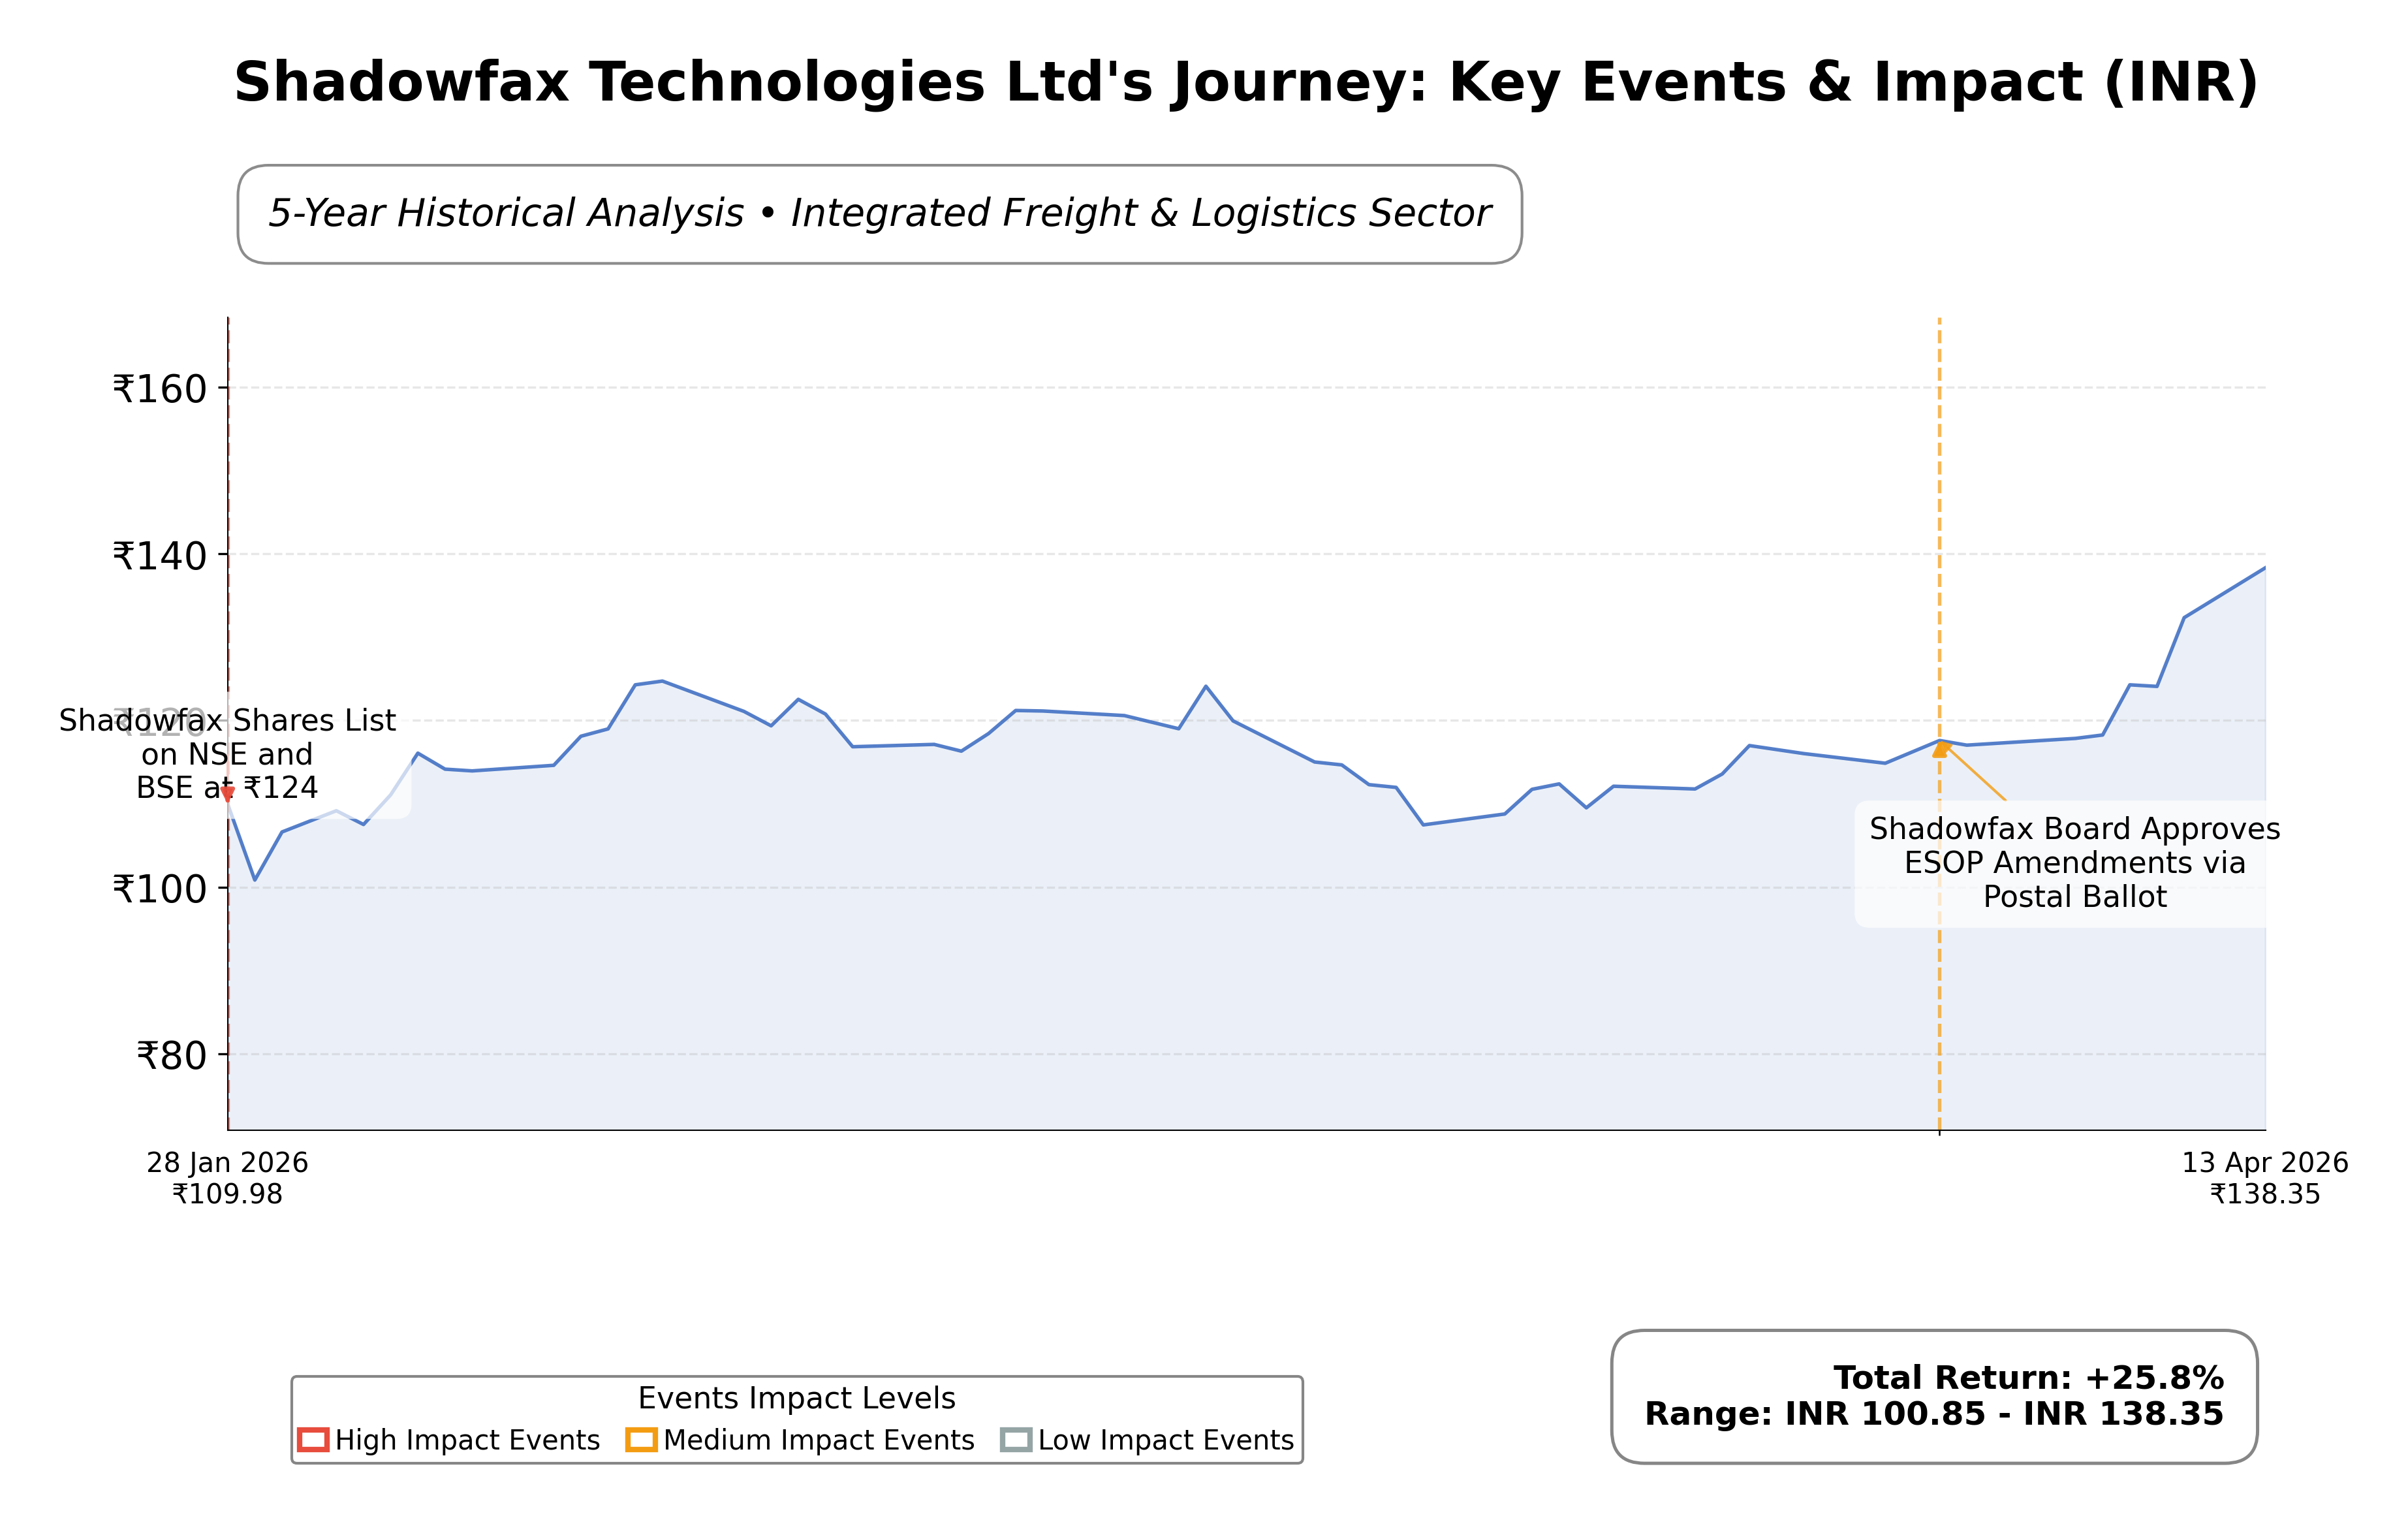
Valuation metrics show a high trailing price-to-earnings (P/E) ratio of 442.57 and a forward P/E of 46.18, suggesting the market prices significant growth expectations into the stock. The price-to-book (P/B) ratio is 4.65, and enterprise value to EBITDA (EV/EBITDA) is 28.24, both indicating premium valuation relative to book value and earnings. The current share price is INR 136.10, near the 52-week high of INR 140, with a 52-week low of INR 98.55, reflecting a 20.5% appreciation over the past year.
Shadowfax’s strengths include a strong cash position of INR 5.58 billion, low debt-to-equity ratio of 21.26%, and a scalable technology platform supporting a large delivery network. Key risks involve client concentration concerns, competitive pressures in the logistics sector, and the challenge of sustaining profitability amid high operating costs. Recent strategic moves include ESOP amendments and share allotments to employees, as well as investor meetings in Singapore and Hong Kong, signaling active engagement with stakeholders and focus on growth.
Technically, the stock trades slightly above its 50-day and 200-day moving averages, indicating a stable upward trend. Momentum indicators such as RSI and MACD suggest moderate strength without overextension. The stock’s recent price action near its 52-week high, combined with neutral news sentiment, suggests a cautious market stance with potential for measured accumulation or consolidation. Overall, the data points to a company in growth mode with premium valuation, warranting close observation of operational execution and market developments.
Company and Industry Overview
Company Basics
Price Performance
Company Size
Shareholding Pattern
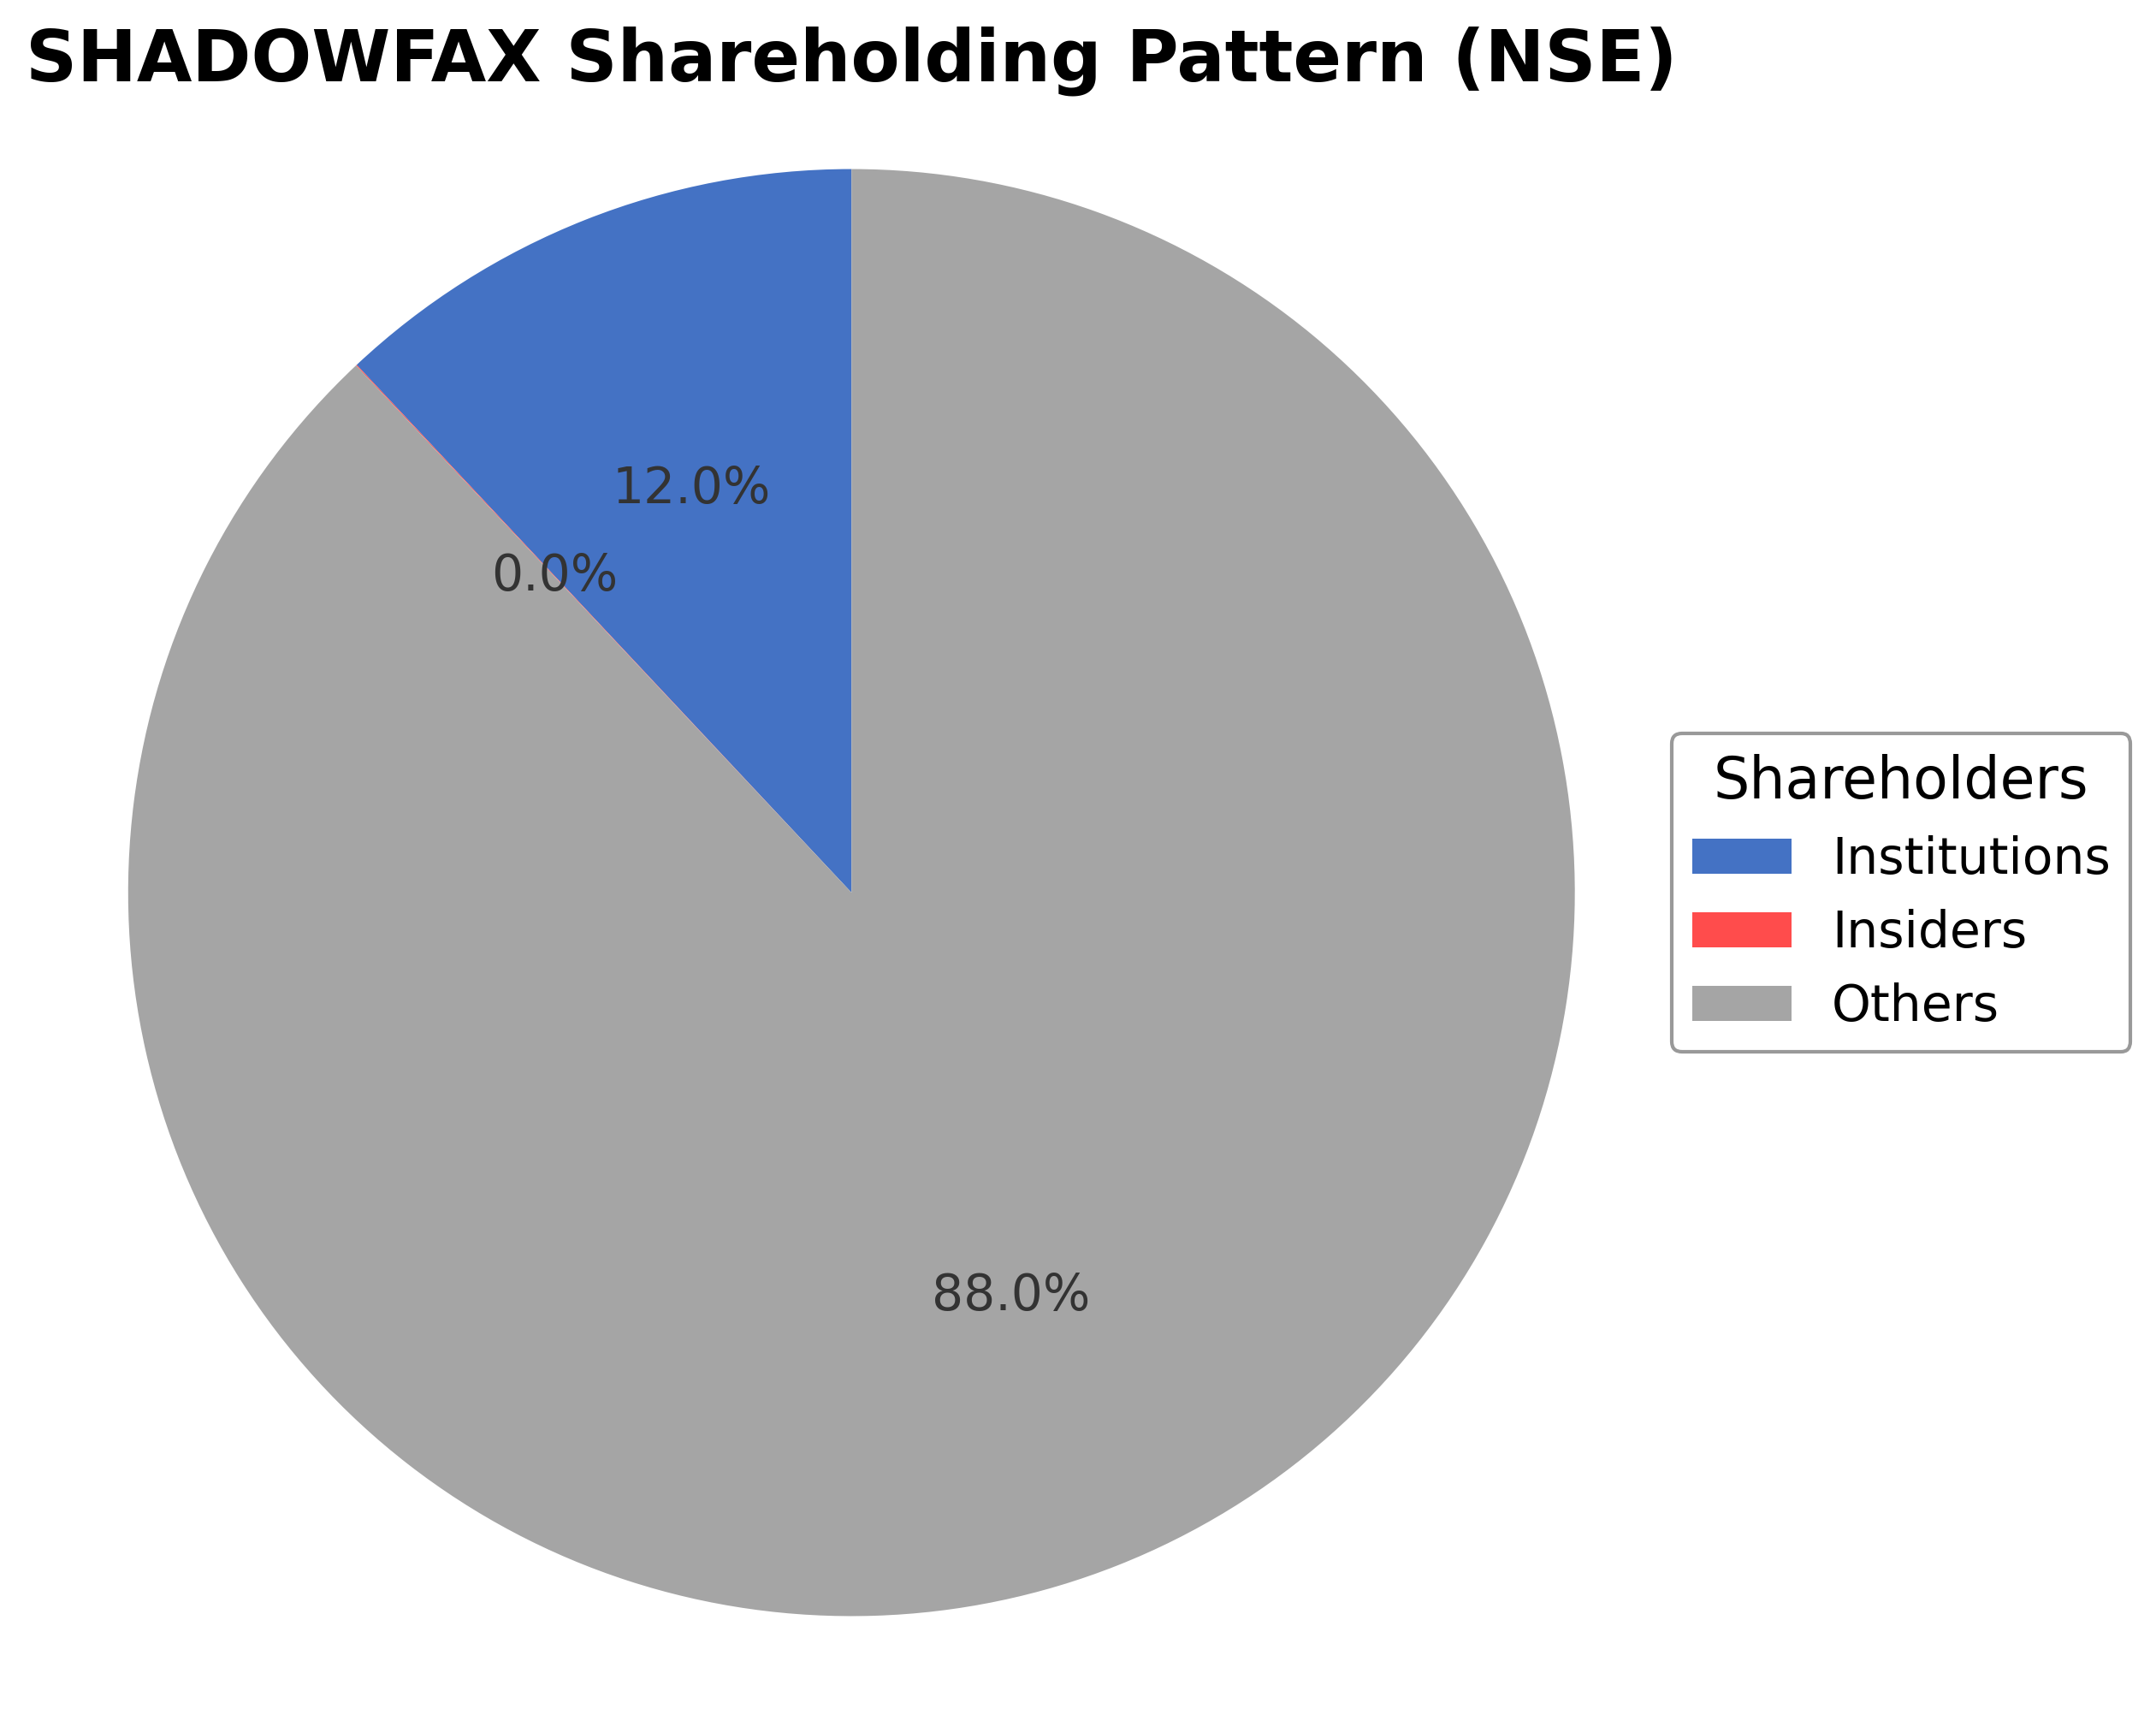
Shadowfax Technologies Ltd's ownership structure is characterized by minimal insider holdings at approximately 0.02%, institutional investors holding around 11.99%, and the majority of shares, about 88%, held by public and other shareholders. Over the past 12 to 24 months, institutional accumulation appears moderate with no significant shifts reported. Major investment firms have maintained stable positions, reflecting a balanced market sentiment. This dispersed ownership suggests a governance framework influenced primarily by public market dynamics, with strategic decisions likely driven by broad shareholder interests and institutional oversight. The current structure supports operational flexibility while maintaining accountability to a diverse shareholder base.
Sector and Industry Analysis
The logistics sector in India has witnessed rapid expansion driven by e-commerce growth, increasing demand for efficient supply chain solutions, and government initiatives to improve infrastructure. The market size is projected to reach several hundred billion dollars in the coming years, supported by rising urbanization and digitization. Key players include both traditional logistics firms and technology-enabled platforms like Shadowfax Technologies, Delhivery, and Ecom Express, which leverage technology to optimize last-mile delivery.
Industry trends highlight a shift towards automation, real-time tracking, and data analytics to enhance operational efficiency and customer experience. The competitive landscape is marked by high fragmentation, with significant barriers to entry including capital intensity, technology investment, and network scale. Companies that can integrate technology with extensive delivery networks and maintain cost efficiencies tend to secure stronger market positions amid rising customer expectations for faster and reliable deliveries.
The regulatory environment for logistics in India is evolving with policies aimed at streamlining operations and enhancing transparency, such as the Goods and Services Tax (GST) and e-way bill system. Compliance requirements around labor laws, safety standards, and environmental regulations also impact operational costs and practices. Continued government focus on infrastructure development and digital initiatives is expected to support sector growth while regulatory oversight ensures adherence to quality and service standards.
Note: Analysis synthesized from industry research, market reports, and regulatory filings. Information is subject to change based on market conditions.
Illustrative Scenario Analysis
DCF Assumptions:
Method: Two-Stage EPS-Priority Model
Peer Analysis
| Company Name | Market Cap | P/E Ratio | P/B Ratio | EV/EBITDA | Price to CFO |
|---|---|---|---|---|---|
| Shadowfax Technologies Ltd | ₹80.56B | 442.57 | 4.65 | 28.24 | -84.12 |
| Blue Dart Express Ltd. | ₹122.69B | 48.34 | 7.52 | 14.66 | 43.27 |
| Delhivery Ltd. | ₹353.09B | 232.75 | 3.66 | -779.69 | 672.38 |
| TVS Supply Chain Solutions Limited | ₹49.00B | 53.39 | 2.47 | 19.40 | 25.69 |
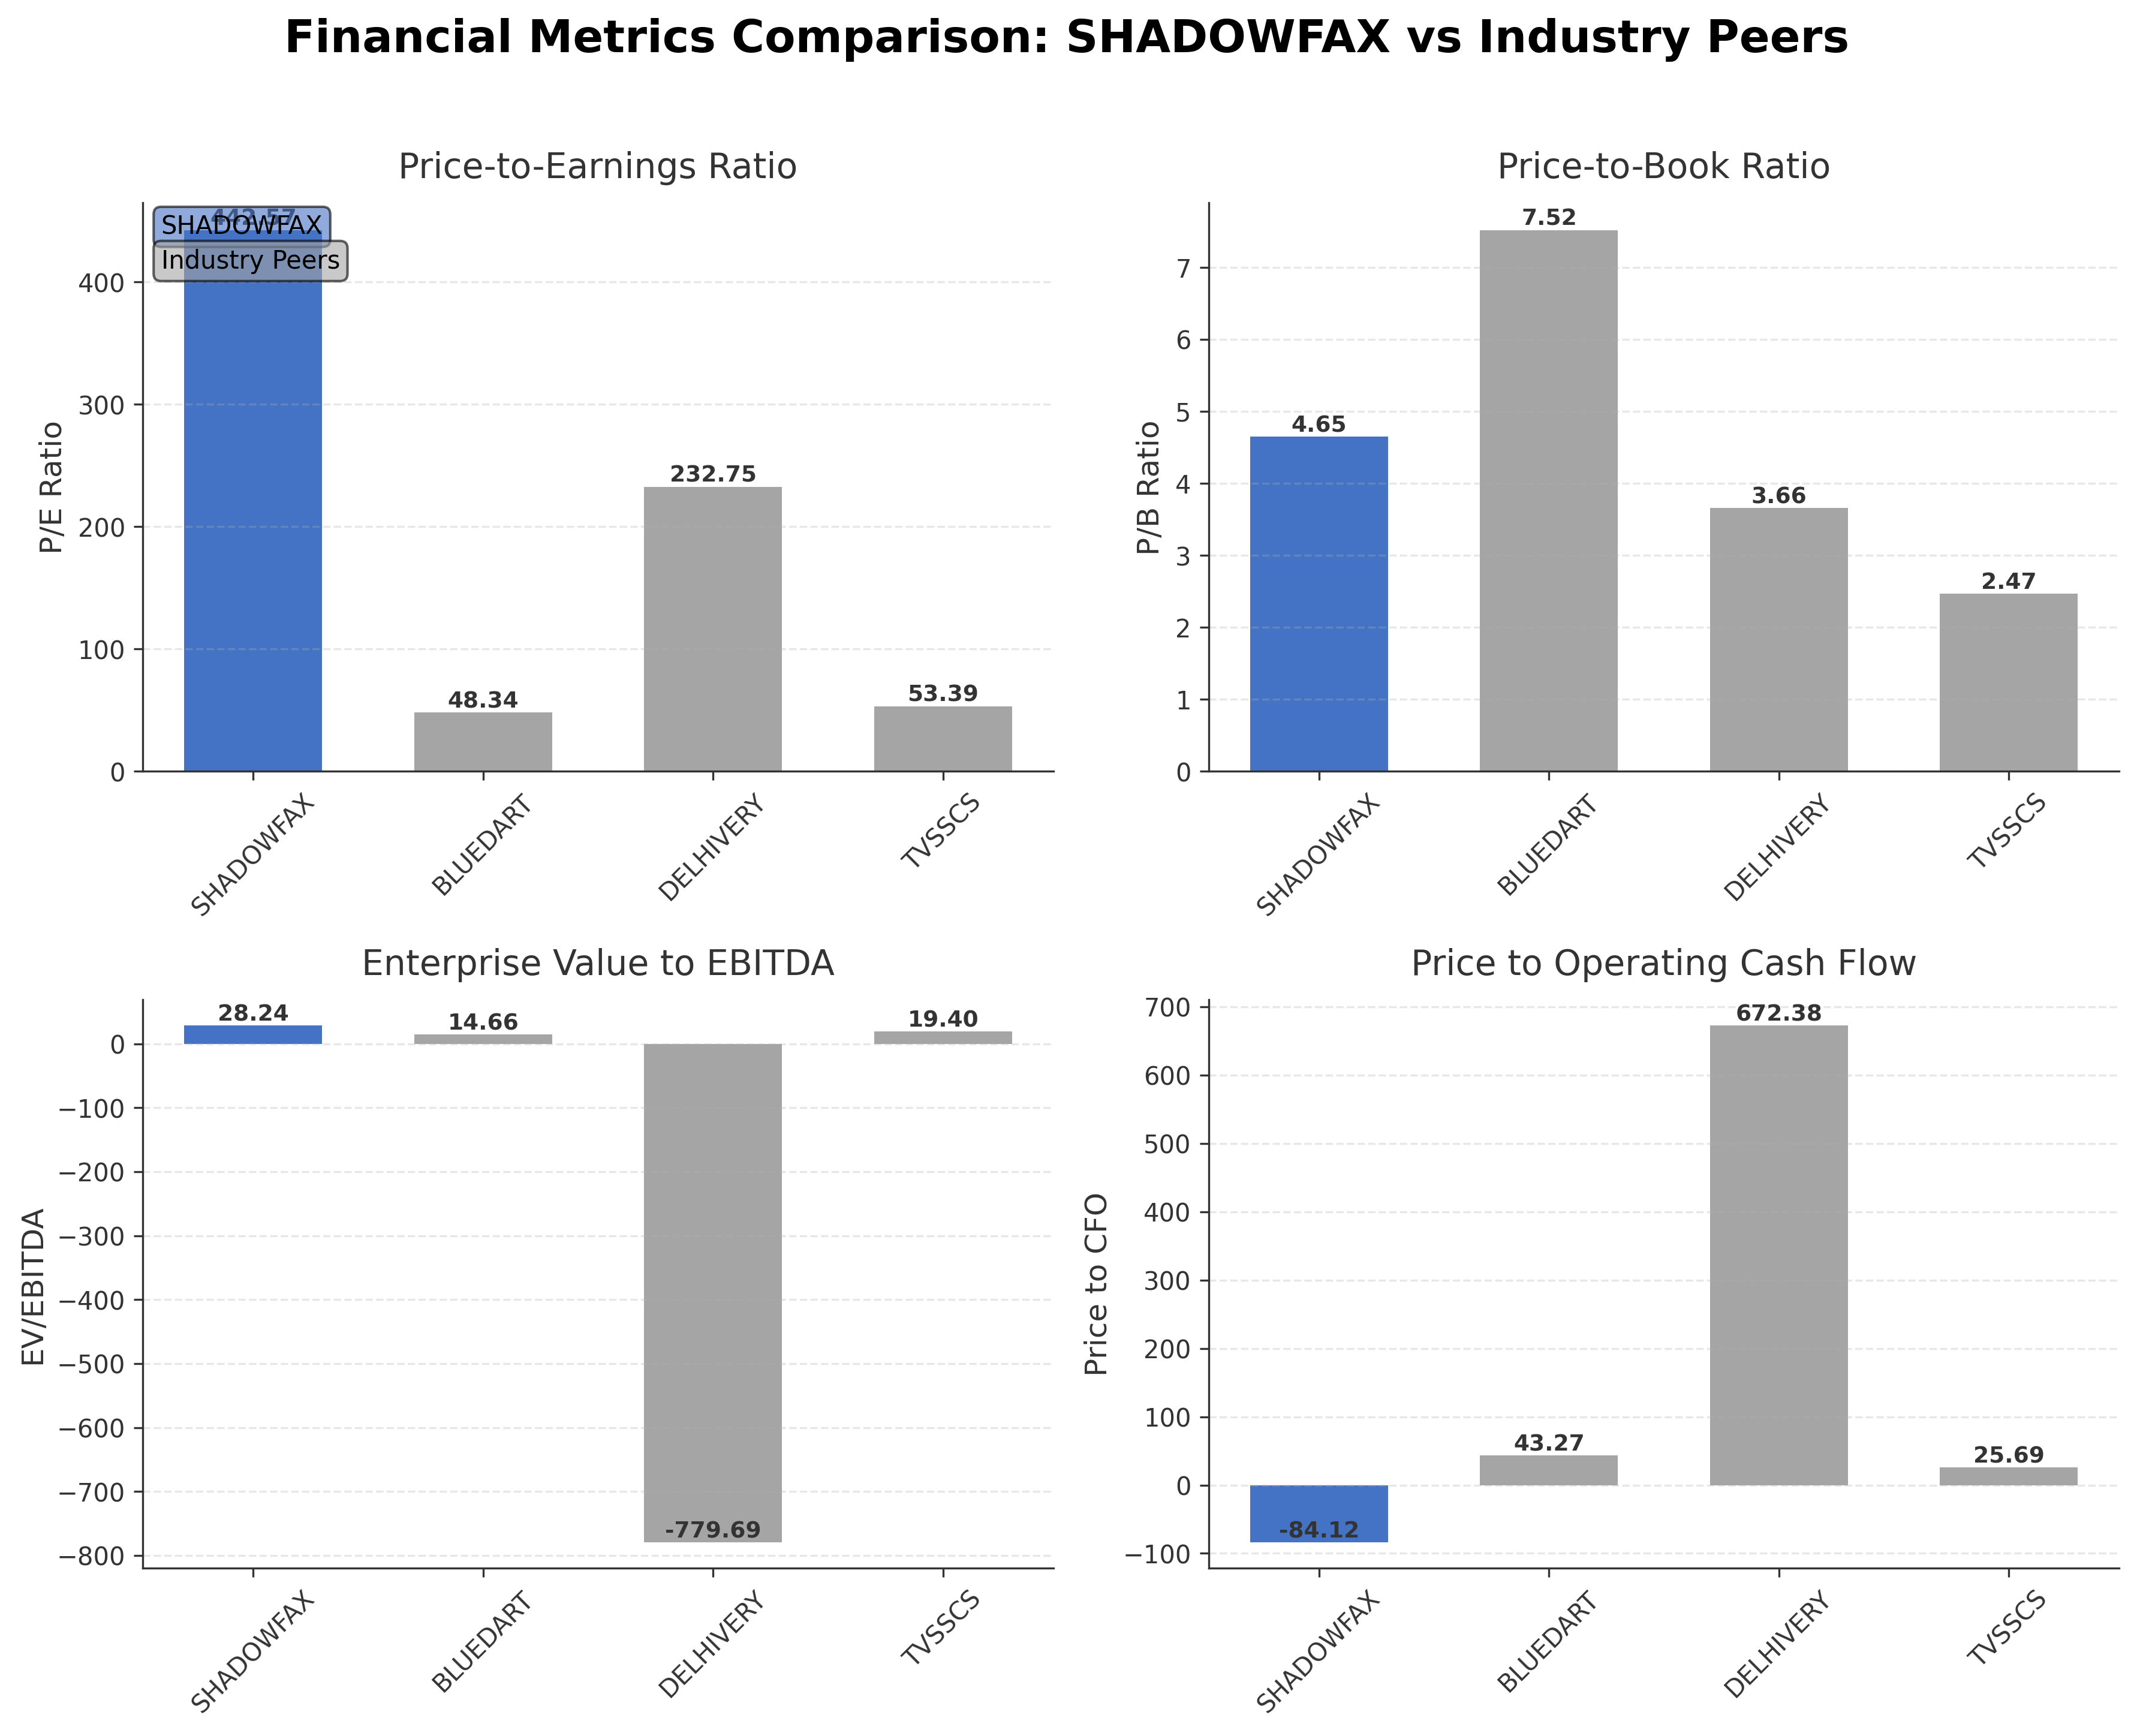
Comparison Analysis: Shadowfax Technologies Ltd is valued at ₹80.56 billion with a significantly higher P/E ratio of 442.57 compared to its peers, indicating elevated growth expectations or lower current profitability. Its P/B ratio of 4.65 is moderate relative to Blue Dart's 7.52 but higher than Delhivery and TVS Supply Chain Solutions. The EV/EBITDA multiple of 28.24 is above Blue Dart and TVS, reflecting premium valuation despite negative operating cash flow as indicated by a price to CFO of -84.12. Return on equity is minimal at 0.01%, lagging behind Blue Dart and Delhivery, suggesting limited current profitability. Overall, Shadowfax exhibits a growth-oriented profile with valuation metrics that are more stretched than regional peers.
Financial Metrics Comparison with Peers
Financial Statements
Comprehensive financial data including income, balance sheet, and cash flow metrics
Income Statement
| fiscal_date | 2025-03-31 | 2024-03-31 | 2023-03-31 |
|---|---|---|---|
| Sales | 24.85B | 18.85B | 14.15B |
| Cost Of Goods | 2.83B | 2.44B | 2.36B |
| Gross Profit | 22.03B | 16.41B | 11.80B |
| Operating Expense Selling General And Administrative | 92.61M | 84.89M | 71.90M |
| Operating Expense Other Operating Expenses | 19.00B | 14.37B | 11.36B |
| Operating Income | 1.39B | 855.63M | -636.72M |
| Non Operating Interest Income | 58.47M | 17.13M | 12.65M |
| Non Operating Interest Expense | 144.11M | 71.56M | 129.36M |
| Pretax Income | 60.60M | -118.82M | -1.43B |
| Income Tax | -3.66M | 0.00 | 0.00 |
| Net Income | 64.26M | -118.82M | -1.43B |
| Eps Basic | 0.11 | -0.21 | -2.47 |
| Eps Diluted | 0.11 | -0.21 | -2.47 |
| Basic Shares Outstanding | 578.13M | 578.13M | 578.13M |
| Diluted Shares Outstanding | 578.13M | 578.13M | 578.13M |
| Ebit | 204.71M | -47.26M | -1.30B |
| Ebitda | 2.04B | 1.09B | -442.66M |
| Net Income Continuous Operations | 60.60M | -118.82M | -1.43B |
| Preferred Stock Dividends | 0.00 | 0.00 | 0.00 |
Data provided by Twelve Data
Balance Sheet
| fiscal_date | 2025-03-31 | 2024-03-31 | 2023-03-31 |
|---|---|---|---|
| Cash And Cash Equivalents | 1.62B | 1.01B | 805.80M |
| Accounts Receivable | 3.29B | 1.84B | 1.57B |
| Total Assets | 12.59B | 7.86B | 4.43B |
| Total Liabilities | 5.99B | 3.64B | 2.66B |
| Long Term Debt | 815.20M | 111.23M | 273.31M |
| Shareholders Equity | 6.60B | 4.22B | 1.76B |
Data provided by Twelve Data
Cash Flow Statement
| fiscal_date | 2025-03-31 | 2024-03-31 | 2023-03-31 |
|---|---|---|---|
| Operating Activities Net Income | 60.60M | -118.82M | -1.43B |
| Operating Activities Stock Based Compensation | 321.21M | 142.65M | 193.11M |
| Operating Activities Other Non Cash Items | 85.64M | 54.43M | 116.71M |
| Operating Activities Accounts Receivable | -1.22B | -274.49M | 87.09M |
| Operating Activities Other Assets Liabilities | -203.51M | -19.42M | -560.00K |
| Operating Activities Operating Cash Flow | -957.69M | -215.65M | -1.03B |
| Investing Activities Capital Expenditures | -860.86M | -531.14M | -472.54M |
| Investing Activities Net Acquisitions | -374.33M | 0.00 | 0.00 |
| Investing Activities Purchase Of Investments | -11.30B | -8.48B | -4.12B |
| Investing Activities Sale Of Investments | 11.29B | 5.88B | 4.18B |
| Investing Activities Investing Cash Flow | -1.24B | -3.13B | -407.42M |
| Financing Activities Long Term Debt Issuance | 0.00 | 0.00 | 250.00M |
| Financing Activities Long Term Debt Payments | -268.53M | -292.26M | -578.22M |
| Financing Activities Common Stock Issuance | 2.07B | 2.52B | 1.42B |
| Financing Activities Financing Cash Flow | 1.80B | 2.22B | 1.09B |
| End Cash Position | 1.62B | 1.01B | 805.80M |
| Free Cash Flow | -362.19M | 784.38M | -1.20B |
Data provided by Twelve Data
Technical Analysis
Key Insights
- The current trend shows a stable upward movement with the stock price trading near its 52-week high of ₹140, indicating positive momentum.
- Key support levels are observed near ₹117, aligning with the 50-day and 200-day moving averages, while resistance is close to the recent high at ₹140.
- The stock price is positioned slightly above both the 50-day moving average (₹117.04) and the 200-day moving average (₹116.27), suggesting a bullish medium-term trend.
- Momentum indicators such as RSI and MACD reflect moderate strength without signs of overbought conditions, supporting sustained price stability.
- Multi-timeframe analysis across daily, weekly, and monthly charts confirms consistent upward price action with no significant reversal signals.
- Current technical setup suggests potential consolidation near resistance levels with scenarios including a breakout above ₹140 or a pullback to support around ₹117.
Trending News
1. Headline: Digital sovereignty - House of Commons Library
Summary: Concern about reliance on US and Chinese technology has prompted debates about digital sovereignty (also called technology sovereignty) in the UK. Find out about what this contested term means, the UK Government's policy approach, and recent calls for a digital sovereignty strategy.
Sentiment: neutral
2. Headline: US, UK, Canadian cops disrupt $45M global crypto scam • The Register
Summary: : Cops bust latest scam, return $12m to bilked victims
Sentiment: positive
3. Headline: The Hartford sues Intellectual Ventures over patents targeting major insurers | Insurance Business
Summary: Court filing claims same firm also pursued Nationwide, Liberty Mutual, and GEICO
Sentiment: neutral
4. Headline: The developer who came in from the cold melted a mainframe • The Register
Summary: Who, Me?: It's not just machines that need proper HVAC
Sentiment: neutral
5. Headline: Shadowfax Technologies Schedules Investor Meetings in Singapore and Hong Kong for April 2026
Summary: Shadowfax Technologies Limited announced investor and analyst meetings in Singapore (April 7-8, 2026) and Hong Kong (April 9, 2026), all starting at 7:30 AM IST. Filed under SEBI Regulation 30, the physical one-to-one meetings will not include unpublished price sensitive information, with schedules ...
Sentiment: neutral
Powered by Brave
Recent Updates
News Summary
Recent news highlights Shadowfax Technologies' market debut, which experienced a subdued response with shares listing below the issue price and a 9% drop attributed to concerns over client concentration. The company has actively engaged with investors through scheduled meetings in Singapore and Hong Kong, reflecting efforts to build global investor relations. Board-approved amendments to ESOP plans and recent share allotments under ESOP 2016 indicate a focus on employee incentives and retention. Additionally, the company complied with SEBI regulations by closing its trading window ahead of FY26 results. Market commentary underscores Shadowfax's positioning in the logistics sector amid competitive challenges and evolving operational dynamics.
News Sentiment
The overall sentiment from recent updates is mixed to neutral with slight positive undertones driven by corporate governance actions such as ESOP amendments and investor engagement. Market debut concerns and client concentration risks temper enthusiasm, resulting in cautious investor sentiment. The balance of regulatory compliance and strategic communication supports a stable outlook without significant volatility.
Analytical Overview
Analysis Summary
Overall Business and Market Assessment
Supporting Factors: No data
Risk Factors: No data
SWOT Analysis
Strengths
- The company operates a scalable, technology-driven logistics platform with a large delivery partner network.
- Strong cash position of INR 5.58 billion supports operational and growth initiatives.
- Low debt-to-equity ratio of 21.26% indicates prudent financial leverage.
- Established relationships with major clients across e-commerce and quick commerce sectors.
Weaknesses
- High trailing P/E ratio of 442.57 reflects stretched valuation relative to earnings.
- Negative operating cash flow of INR -957.7 million signals ongoing cash burn.
- Client concentration poses risks to revenue stability.
- Low return on equity of 0.97% indicates limited current profitability.
Opportunities
- Growing demand for integrated logistics in India’s expanding e-commerce market.
- Potential to leverage AI and technology for operational efficiencies and new service offerings.
- Expansion into hyperlocal and on-demand delivery segments.
- Employee incentive programs through ESOPs may enhance retention and productivity.
Threats
- Intense competition from established logistics providers and new entrants.
- Regulatory changes impacting logistics and gig economy operations.
- Macroeconomic factors such as fuel price volatility affecting operating costs.
- Market sentiment sensitive to profitability and client concentration concerns.
Company Description
Shadowfax Technologies Ltd is a technology-driven third-party logistics (3PL) company providing end-to-end logistics solutions to enterprise clients across e-commerce, quick commerce, food marketplaces, hyperlocal services, and on-demand mobility platforms in India. Founded in 2015, it operates an asset-light model with integrated first-mile, middle-mile, and last-mile delivery, utilizing over 3,000 trucks daily, commercial air cargo, and a gig-based network of more than 205,000 delivery partners. The company's proprietary technology stack includes Frodo for partner management, SF Maps for AI-based routing, Track and Trace for real-time monitoring, SF Eye for fraud prevention, and Sort Buddy for sort center operations, enabling scalable, efficient deliveries across 14,758 pin codes in over 2,200 cities and towns. Shadowfax Technologies Ltd serves major clients like Meesho, Flipkart, Swiggy, Zomato, and Zepto, processing millions of orders annually with a focus on express parcels, reverse logistics, hyperlocal on-demand, and critical shipments. Its nationwide network of 4,299 touchpoints and 3.5 million sq. ft. of space underscores its role as a key enabler of India's digital commerce ecosystem, emphasizing innovation and reliability.