


SG Finserve Ltd (SGFIN)
Stock Analysis Report
Stock Journey
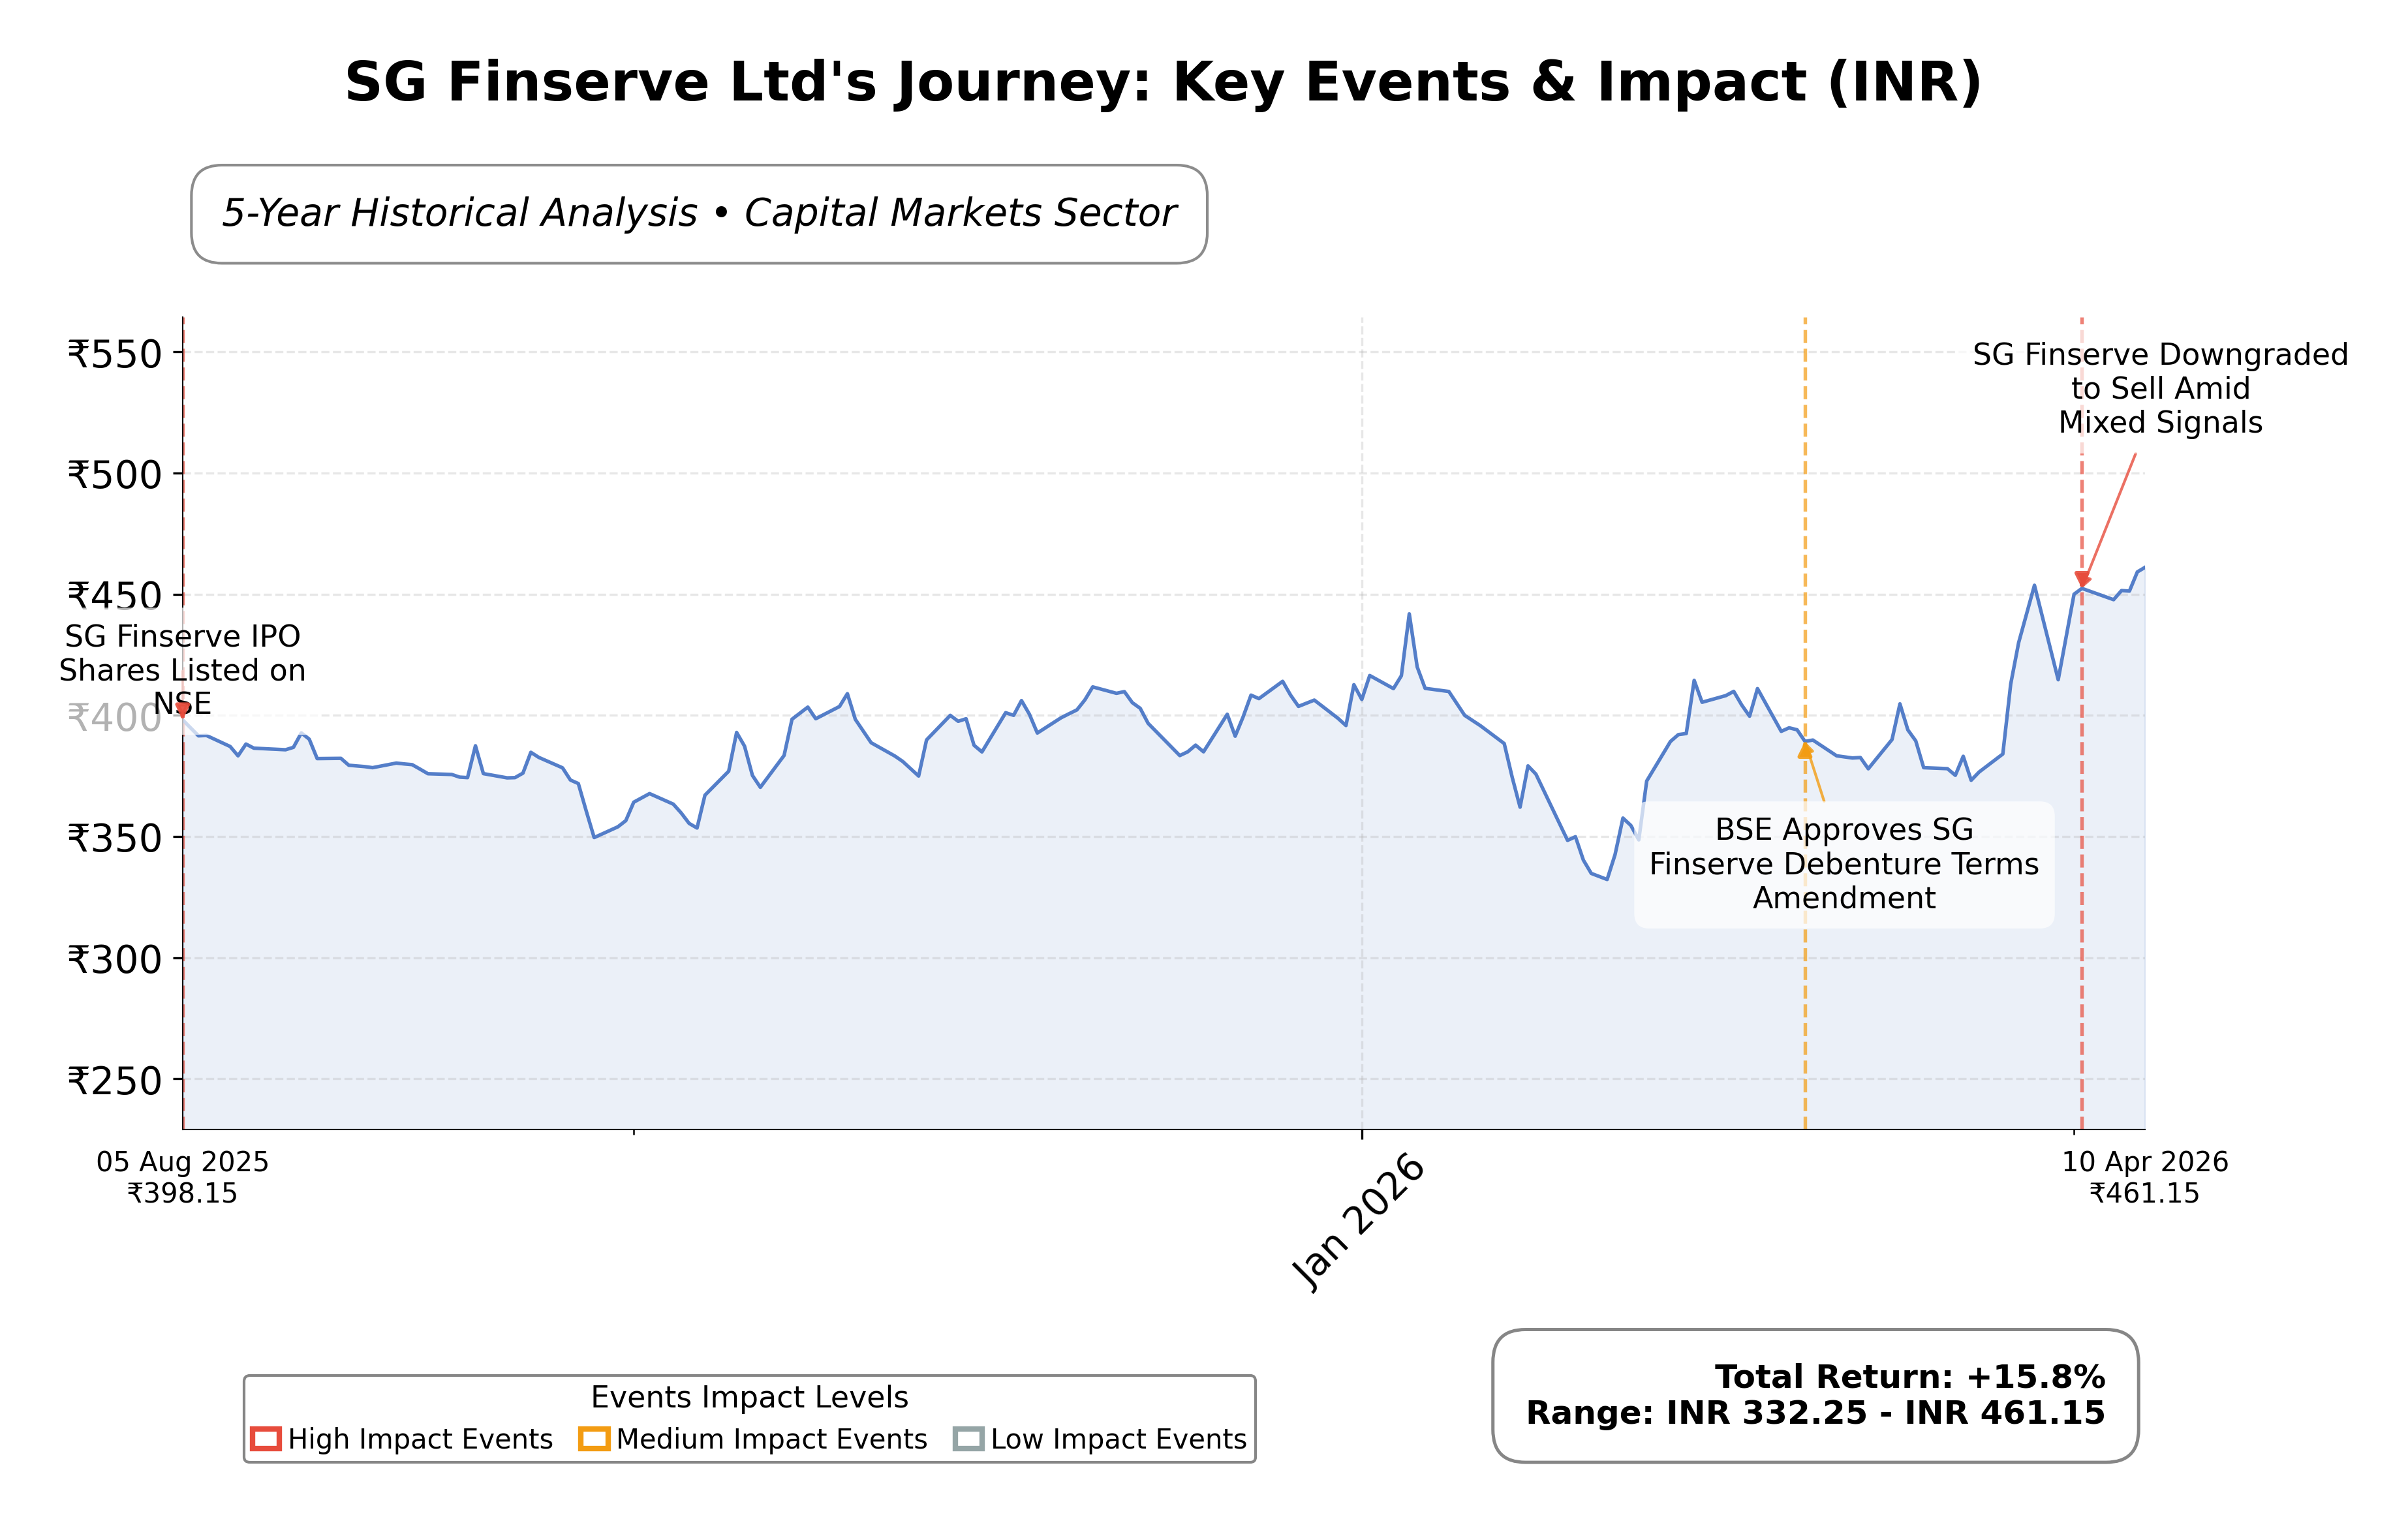
Key Positives and Key Risks
Pros
- Strong profitability with a net profit margin of 38.62% and operating margin of 92.09%, indicating efficient operations.
- Recent insider accumulation and stake increase by notable investor Ashish Kacholia reflect confidence in company prospects.
- Formation of a golden cross and positive momentum indicators support potential upward price movement.
Cons
- High debt-to-equity ratio of 172.38 raises concerns about financial leverage and risk exposure.
- Negative operating cash flow of INR -4.69 billion over the trailing twelve months indicates operational cash challenges.
- Limited institutional ownership at 1.42% may affect liquidity and external oversight.
Disclosure: This information is for general awareness and does not constitute investment advice
Report Summary
SG Finserve Ltd operates as a Non-Banking Finance Company (NBFC) registered with the Reserve Bank of India, specializing in inclusive business financing solutions tailored for channel partners across India. The company focuses on supply chain financing products for dealers, distributors, retailers, buyers, and logistics partners of Indian corporations. Listed on the National Stock Exchange of India (NSE) under the financial services sector, SG Finserve has positioned itself as a key financial intermediary within India's supply chain ecosystem, facilitating working capital management for major corporate channel partners.
Financially, SG Finserve reported trailing twelve months (TTM) revenue of approximately INR 2.83 billion with a gross margin of 97.63%, indicating strong cost control and profitability at the gross level. The operating margin stands at an impressive 92.09%, while the net profit margin is 38.62%, reflecting efficient operations and solid bottom-line performance. Return on equity (ROE) and return on assets (ROA) are 7.98% and 3.35% respectively, suggesting moderate returns relative to equity and asset base. The company’s return on invested capital (ROIC) is not explicitly stated but can be inferred as positive given the profitability metrics.
Valuation metrics show a trailing price-to-earnings (P/E) ratio of 26.01, aligning closely with the industry average P/E of 26.01, and a price-to-book (P/B) ratio of 2.41, indicating the stock trades at a premium to its book value. The enterprise value to EBITDA (EV/EBITDA) ratio is 16.90, suggesting a moderate valuation relative to earnings before interest, taxes, depreciation, and amortization. The market capitalization is approximately INR 30.11 billion. The stock price currently stands at INR 461.15, near its 52-week high of INR 473 and well above the 52-week low of INR 323, reflecting a 13.66% appreciation over the past year.
SG Finserve’s strengths include a strong gross and operating margin profile, a robust current ratio of 1.63 indicating liquidity, and a strategic focus on supply chain financing within India’s capital markets sector. However, the company carries a high debt-to-equity ratio of 172.38, which poses financial leverage risks. Recent strategic developments include warrant conversions raising INR 21 crore and increased insider and institutional buying, notably by prominent investor Ashish Kacholia. Regulatory compliance is maintained with scheduled board meetings and trading window closures.
Technically, the stock has recently formed a golden cross with the 50-day moving average crossing above the 200-day moving average, signaling potential upward momentum. Momentum indicators suggest a mildly bullish outlook, supported by recent positive price action and volume trends. Given the mixed financial leverage and valuation metrics alongside improving technical signals, the current market environment appears conducive to cautious accumulation and monitoring for further confirmation.
Company and Industry Overview
Company Basics
Price Performance
Company Size
Shareholding Pattern
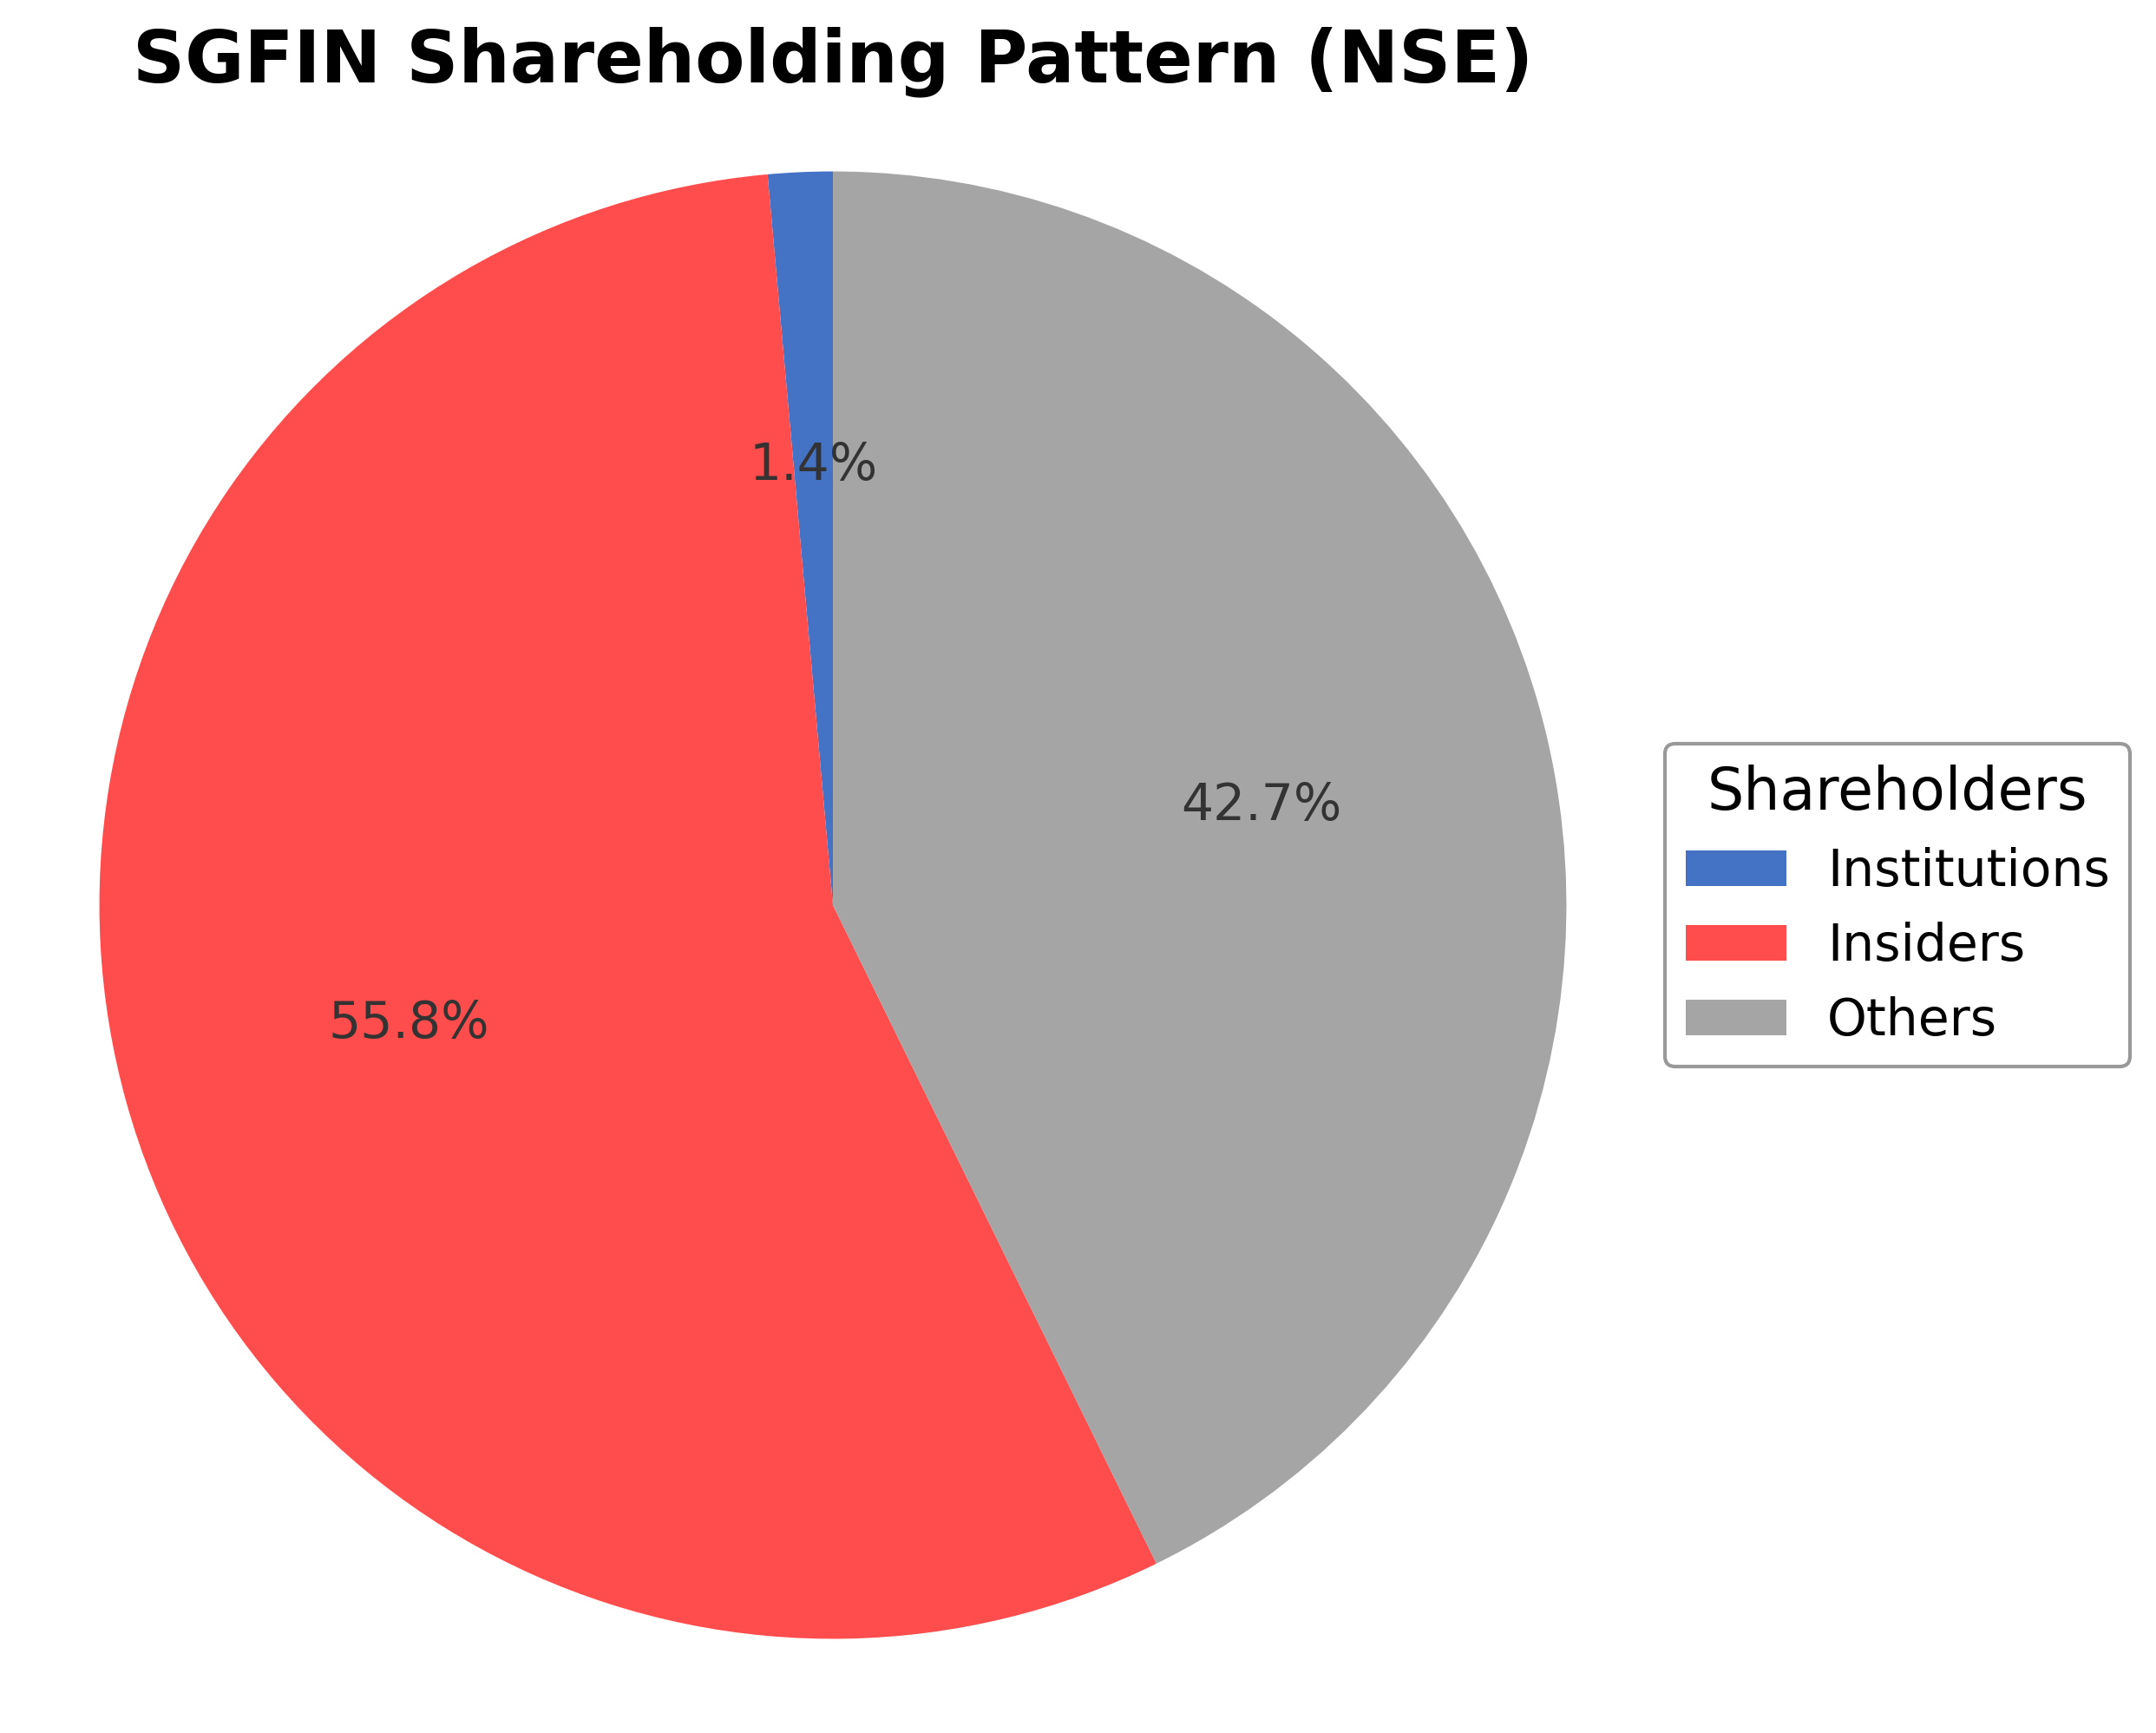
The shareholding structure of SG Finserve Ltd is dominated by insiders, including executives and board members, who hold approximately 55.85% of the shares. Institutional investors maintain a modest stake of 1.42%, while public shareholders account for roughly 42.73%. Over the past 12-24 months, insider ownership has remained relatively stable, with notable recent accumulation by key investors such as Ashish Kacholia, reflecting increased confidence. Institutional participation remains limited but shows selective interest, with some funds increasing positions amid the company's strategic focus on supply chain financing. This ownership distribution suggests a governance structure strongly influenced by insiders, with moderate external institutional oversight, potentially affecting strategic decisions and market sentiment toward the company.
Sector and Industry Analysis
The financial services sector, encompassing banking, asset management, and financial technology, represents a substantial portion of the global economy with a market size valued in the trillions of dollars. It is characterized by steady growth driven by increasing demand for digital financial solutions and expanding emerging markets. Key players include multinational banks, insurance firms, and fintech innovators, which compete to capture market share through technology integration and customer-centric services.
Within the financial services industry, trends such as the rise of institutional ownership and insider trading activity influence stock liquidity and volatility, impacting company valuations and investor confidence. Competitive dynamics are shaped by technological advancements, regulatory compliance costs, and the strategic positioning of firms to leverage data analytics and digital platforms. Barriers to entry remain high due to capital requirements, regulatory scrutiny, and the need for robust risk management frameworks.
The regulatory environment in financial services is stringent, with oversight from bodies such as the SEC in the U.S. and equivalent authorities worldwide, enforcing disclosure requirements like Schedule 13D and 13G filings for significant shareholders. These regulations aim to enhance transparency around institutional and insider ownership, thereby protecting investors and maintaining market integrity. Ongoing regulatory developments continue to influence corporate governance practices and market behavior within the sector.
Note: Analysis synthesized from industry research, market reports, and regulatory filings. Information is subject to change based on market conditions.
Financial Ratios Dashboard
Illustrative Scenario Analysis
DCF Assumptions:
Method: Two-Stage EPS-Priority Model
Financials
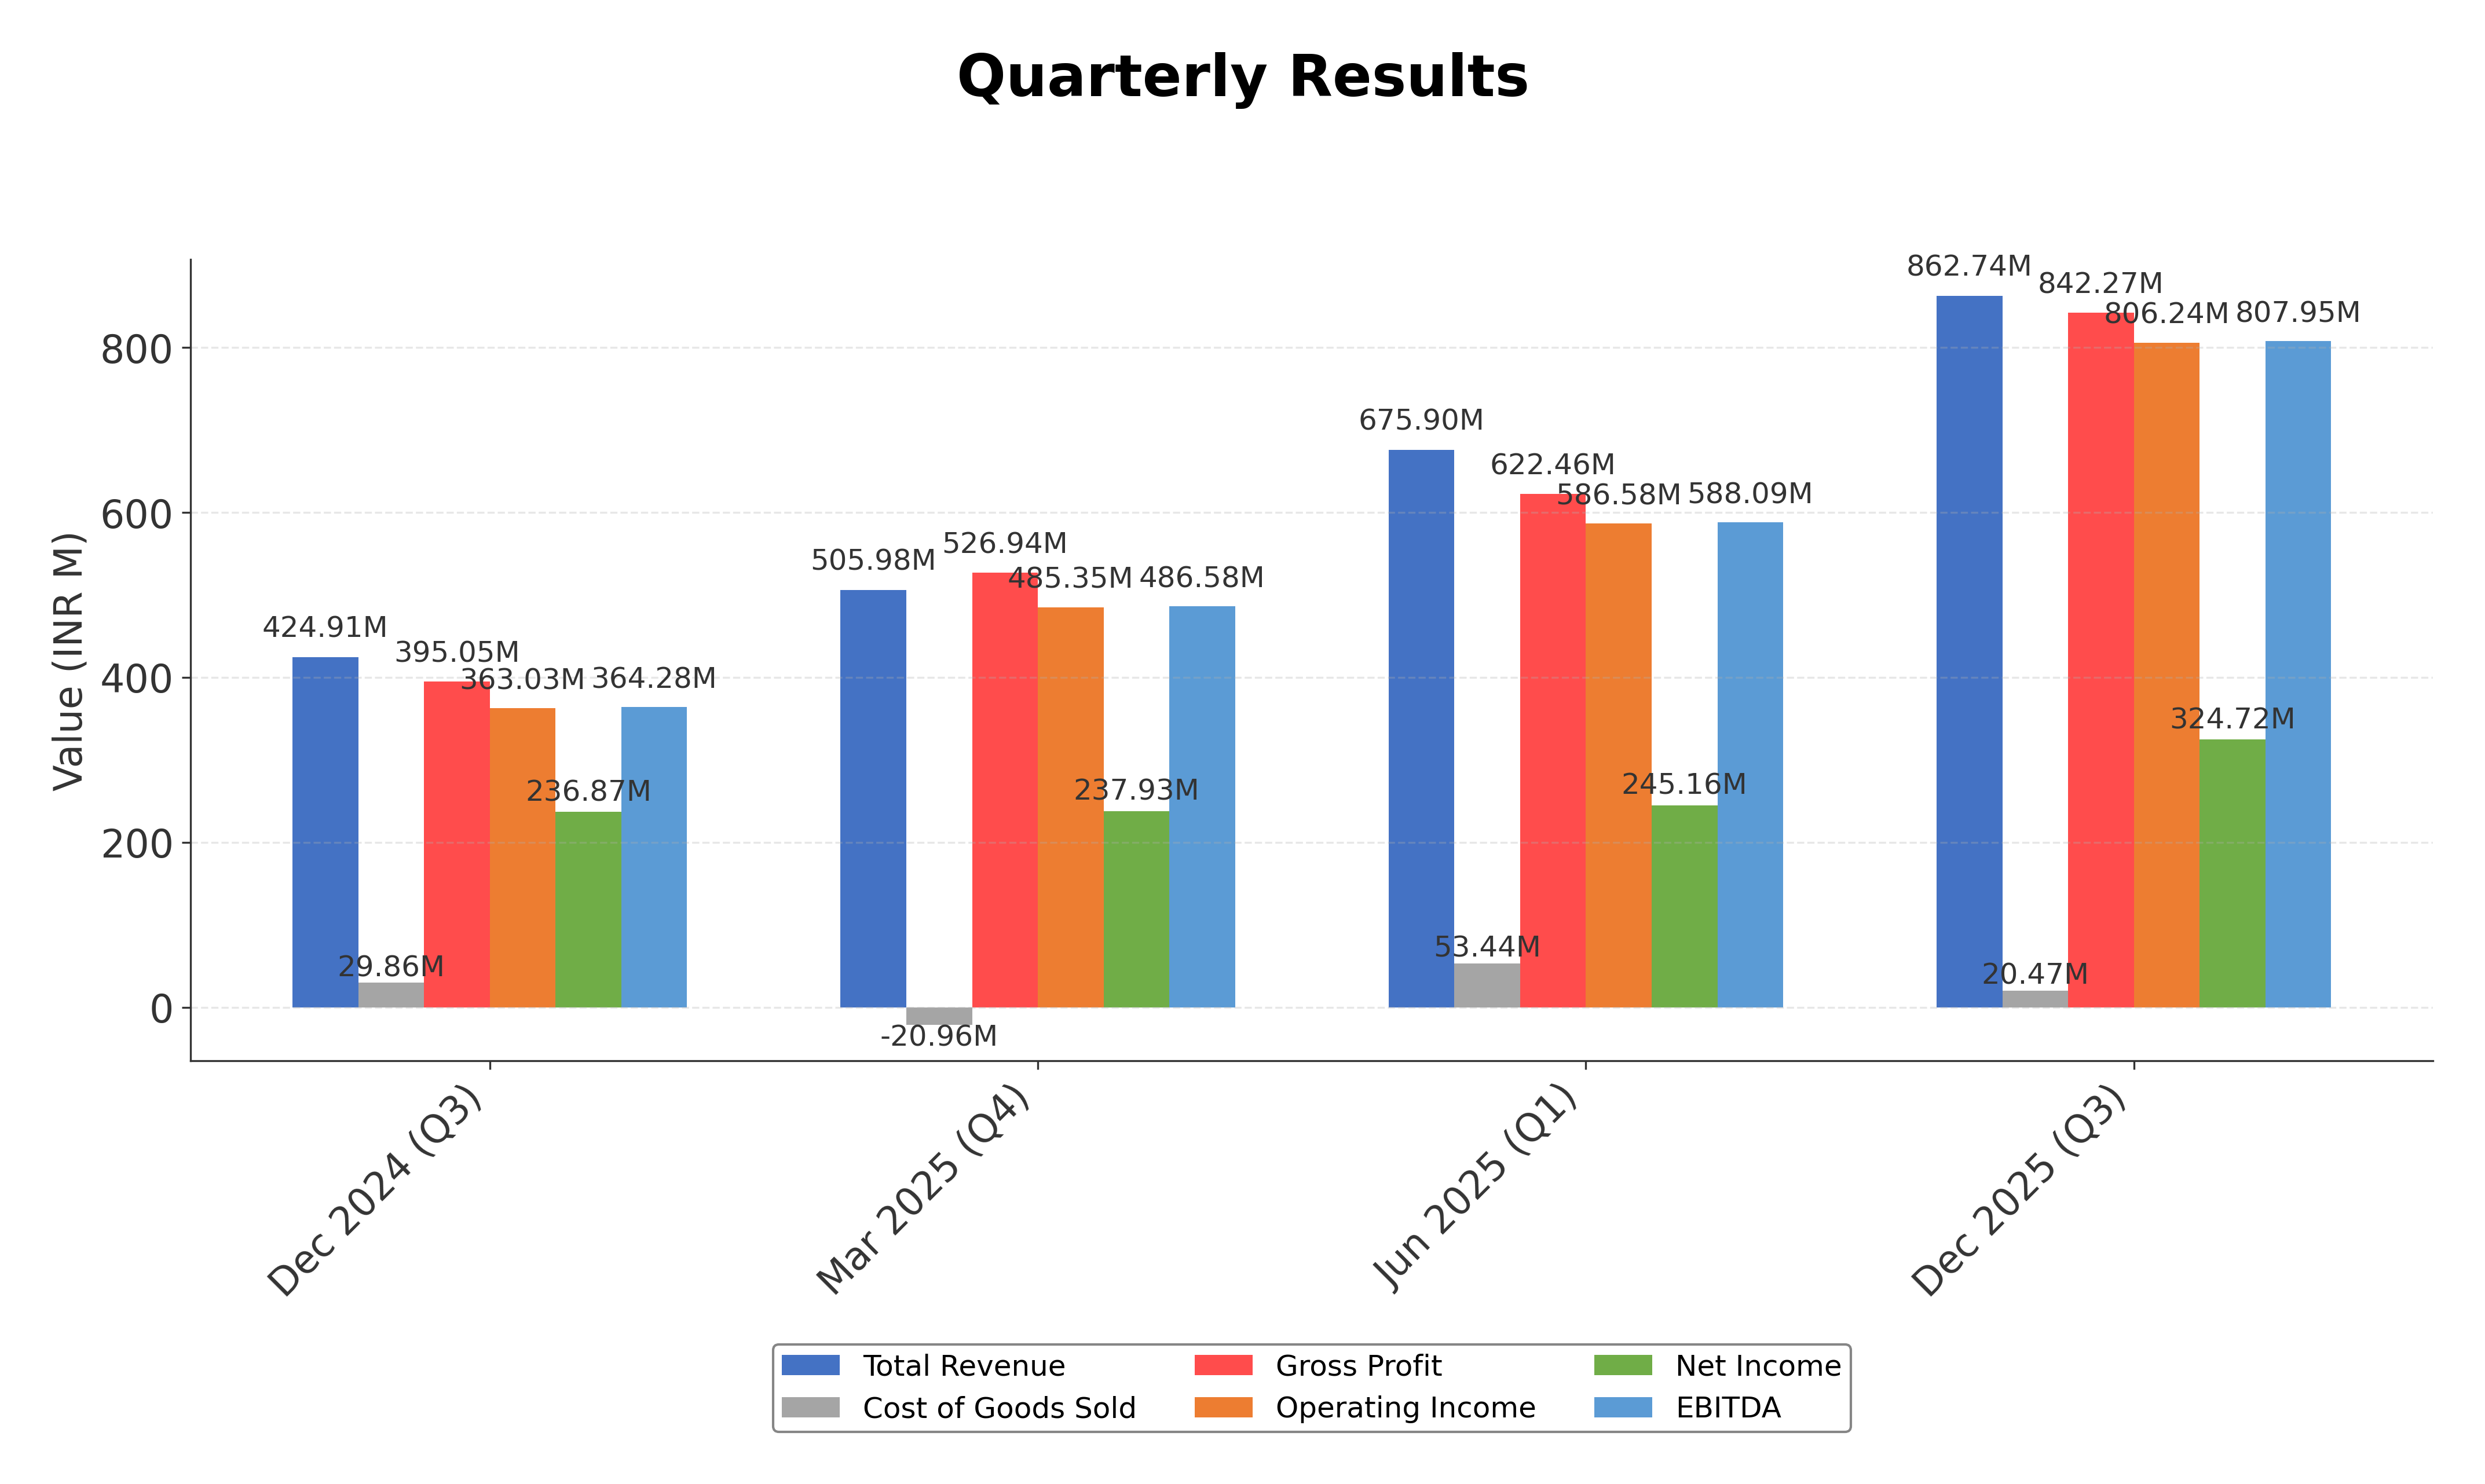
Peer Analysis
| Company Name | Market Cap | P/E Ratio | P/B Ratio | EV/EBITDA | Price to CFO |
|---|---|---|---|---|---|
| SG Finserve Ltd | ₹30.11B | 26.01 | 2.41 | 16.90 | -6.43 |
| Tata Investment Corporation Limited | ₹336.79B | 82.69 | 1.06 | -5.28 | 113.37 |
| JM Financial Ltd. | ₹128.19B | 10.46 | 1.25 | N/A | 2.32 |
| Motilal Oswal Financial Services Ltd. | ₹469.14B | 23.70 | 3.63 | 16.62 | 144.61 |
| Central Depository Services (India) Ltd. | ₹272.41B | 57.14 | 15.63 | 39.22 | 39.47 |
| Angel One Ltd. | ₹255.96B | 34.27 | 4.38 | 9.95 | -15.38 |
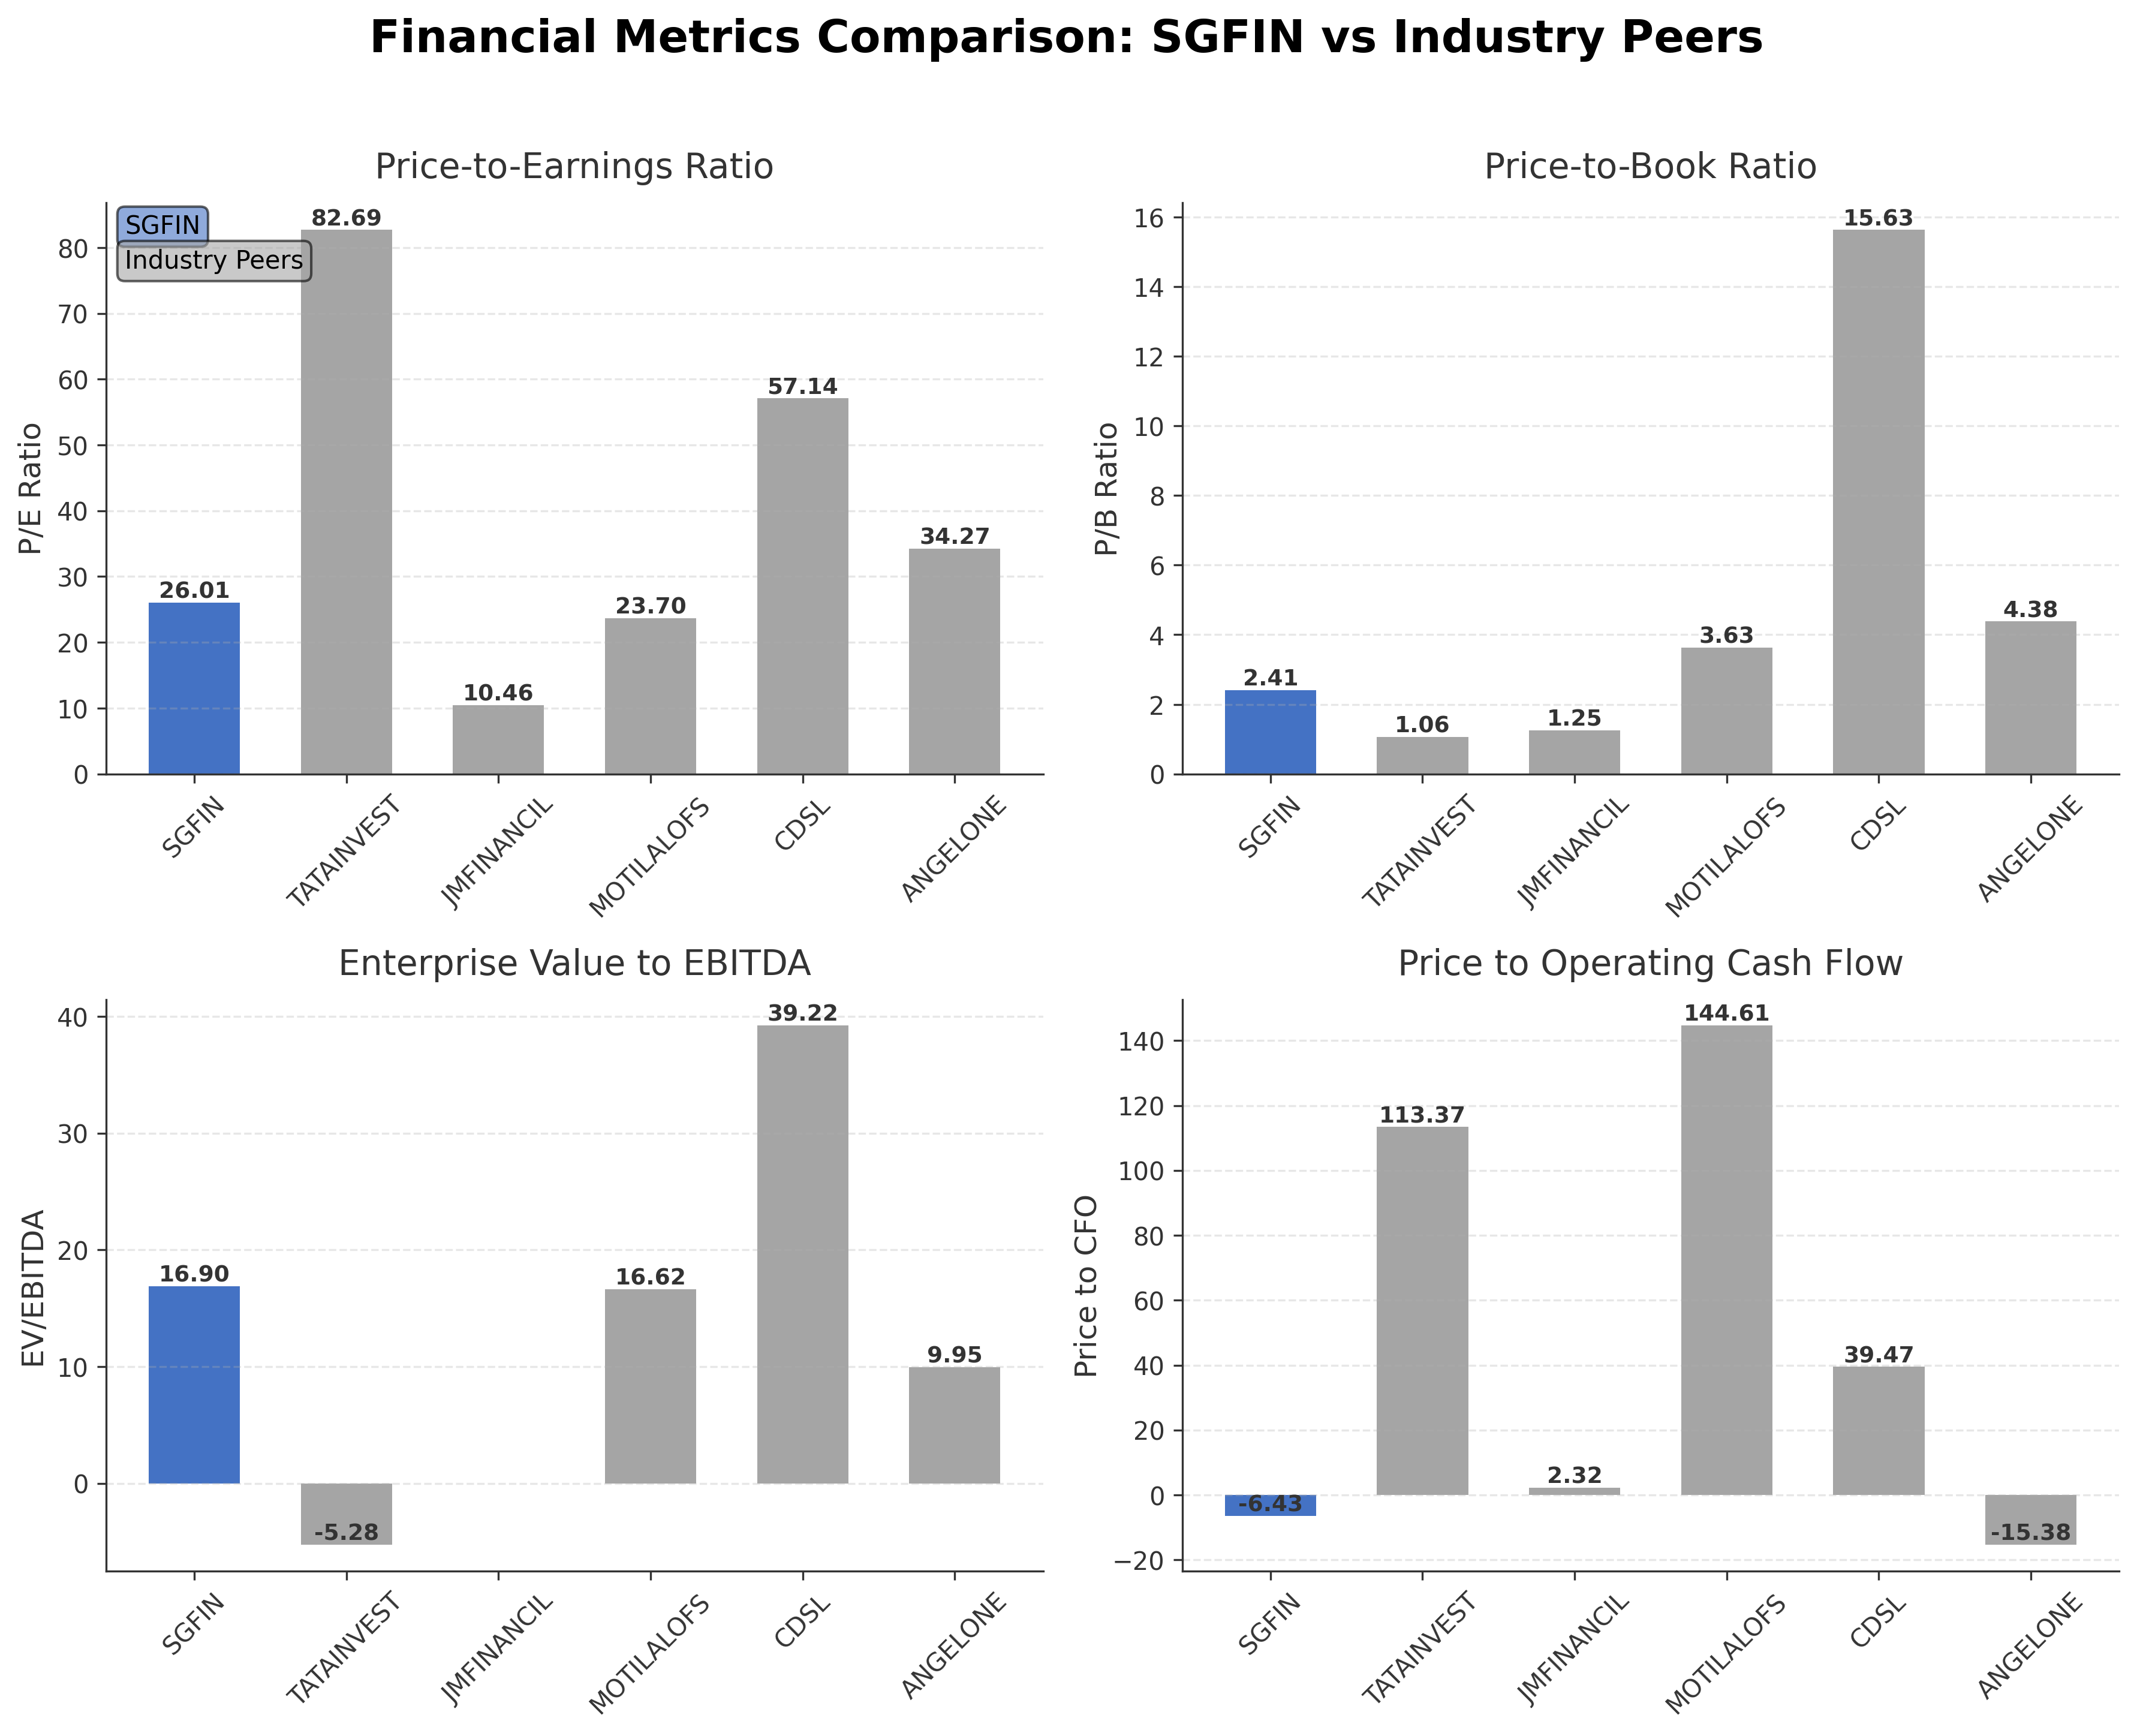
Comparison Analysis: SG Finserve Ltd, with a market capitalization of ₹30.11 billion, is smaller compared to its peers such as Motilal Oswal Financial Services and Tata Investment Corporation. Its P/E ratio of 26.01 is moderate, lower than Tata Investment's 82.69 but higher than JM Financial's 10.46, indicating a mid-range valuation. The P/B ratio of 2.41 is below several peers like Central Depository Services and Angel One, suggesting a relatively more conservative book value premium. The EV/EBITDA of 16.90 aligns closely with Motilal Oswal's 16.62 but is significantly lower than CDSL's 39.22, reflecting moderate enterprise valuation. SG Finserve's negative price to CFO ratio contrasts with most peers, indicating potential cash flow challenges. Return on equity at 7.98% is modest compared to higher ROEs in the peer group, highlighting room for operational improvement.
Financial Metrics Comparison with Peers
Financial Statements
Comprehensive financial data including income, balance sheet, and cash flow metrics
Income Statement
| fiscal_date | 2025-03-31 |
|---|---|
| Sales | 1.68B |
| Cost Of Goods | 81.20M |
| Gross Profit | 1.59B |
| Operating Expense Selling General And Administrative | 44.50M |
| Operating Expense Other Operating Expenses | 40.50M |
| Operating Income | 1.46B |
| Non Operating Interest Income | 34.80M |
| Non Operating Interest Expense | 284.78M |
| Pretax Income | 1.10B |
| Income Tax | 291.69M |
| Net Income | 809.90M |
| Eps Basic | 14.54 |
| Eps Diluted | 13.45 |
| Basic Shares Outstanding | 55.72M |
| Diluted Shares Outstanding | 55.72M |
| Ebit | 1.39B |
| Ebitda | 1.47B |
| Net Income Continuous Operations | 1.10B |
| Preferred Stock Dividends | 0.00 |
Data provided by Twelve Data
Balance Sheet
| fiscal_date | 2025-03-31 |
|---|---|
| Cash And Cash Equivalents | 301.69M |
| Accounts Receivable | N/A |
| Total Assets | 24.16B |
| Total Liabilities | 14.02B |
| Long Term Debt | 500.00M |
| Shareholders Equity | 10.15B |
Data provided by Twelve Data
Cash Flow Statement
| fiscal_date | 2025-03-31 |
|---|---|
| Operating Activities Net Income | 1.10B |
| Operating Activities Stock Based Compensation | 11.63M |
| Operating Activities Other Non Cash Items | 8.98M |
| Operating Activities Accounts Receivable | -5.78B |
| Operating Activities Other Assets Liabilities | -23.50M |
| Operating Activities Operating Cash Flow | -4.69B |
| Investing Activities Purchase Of Investments | -802.19M |
| Investing Activities Sale Of Investments | 234.20M |
| Investing Activities Investing Cash Flow | -567.99M |
| Financing Activities Long Term Debt Issuance | 4.28B |
| Financing Activities Common Stock Issuance | 1.26B |
| Financing Activities Financing Cash Flow | 5.54B |
| End Cash Position | 310.79M |
| Free Cash Flow | -4.90B |
Data provided by Twelve Data
Technical Analysis
Key Insights
- The stock exhibits a recent upward trend with a golden cross formation where the 50-day moving average has crossed above the 200-day moving average, indicating potential bullish momentum.
- Key support levels are observed near ₹390, aligning with the 200-day moving average, while resistance is proximate to the 52-week high of ₹473.
- The current price of ₹461.15 is above both the 50-day (₹392.93) and 200-day (₹390.31) moving averages, suggesting positive medium- to long-term price action.
- Momentum indicators show a mildly bullish stance with RSI and MACD reflecting upward momentum, while stochastic oscillators indicate potential continuation of the current trend.
- Across daily, weekly, and monthly timeframes, the stock has shifted from sideways consolidation to a mild uptrend, supported by increasing volume and positive momentum signals.
- Market scenarios based on the technical setup include a potential breakout above resistance if momentum sustains, or a retracement to support levels if selling pressure increases.
Trending News
1. Headline: Q4 Results Next Week: HDFC Bank, Wipro, Yes Bank Among 50 Companies To Declare Earnings; Check Full List
Summary: April 16: Alok Industries Ltd., Angel One Ltd., CRISIL Ltd., Ganesh Holdings Ltd., HDFC Asset Management Company Ltd., HDFC Life Insurance Company Ltd., PAE Ltd., SG Finserve Ltd., VST Industries Ltd., Wipro Ltd, Waaree Renewable Technologies Ltd.
Sentiment: neutral
Summary: Ace investor Ashish Kacholia increased his stakes in smallcaps SG Finserv and Aeroflex Industries during the March quarter. Both stocks have delivered strong returns, outperforming weak broader markets, with Aeroflex posting particularly sharp gains.
Sentiment: positive
3. Headline: Insider Purchase: 10% owner at $SG Buys 566,000 Shares | Quiver Quantitative
Summary: SACHS GROUP INC GOLDMAN, a 10% owner of $SG, bought 566,000 shares of the company on 04-07-2026 for an estimated $3,220,540. This trade was reported by Quiver Quantitative using data from a recent SEC filing. This increased their holdings of this class of stock by approximately 5.0%. Following ...
Sentiment: positive
4. Headline: SG Finserve Limited Board Meeting Scheduled for April 16, 2026 to Review Q4FY26 and FY26 Audited Financial Results
Summary: SG Finserve Limited has scheduled a Board of Directors meeting for April 16, 2026, to consider and approve audited financial results for Q4FY26 and FY26 ending March 31, 2026. The company has implemented a trading window closure from April 1-19, 2026, in compliance with insider trading regulations.
Sentiment: neutral
5. Headline: SG Finserve Warrant Conversion Lifts Shares 1.66%
Summary: SG Finserve converts warrants into equity shares, raising ₹21 crore, with shares gaining 1.66% in early trade April 8, 2026.
Sentiment: positive
Powered by Brave
Recent Updates
News Summary
Recent developments for SG Finserve Ltd include a technical milestone with the formation of a golden cross as the 50-day moving average surpassed the 200-day moving average on April 10, 2026, signaling potential bullish momentum. The company has scheduled a board meeting on April 16, 2026, to review and approve audited financial results for Q4FY26 and FY26, reflecting ongoing regulatory compliance. Insider activity includes a notable purchase by a 10% owner increasing holdings by approximately 5%, indicating confidence from significant shareholders. Market sentiment is mixed with recent positive technical momentum offset by some insider selling at prior price levels. Overall, these updates suggest a phase of cautious optimism with attention focused on upcoming financial disclosures and technical trends.
News Sentiment
Sentiment across recent news is predominantly positive, driven by technical momentum shifts, insider accumulation, and capital raising activities. Neutral sentiments are observed around scheduled board meetings and regulatory compliance events. Negative sentiment is limited and relates primarily to prior insider selling and mixed financial signals. The overall trend indicates improving investor confidence tempered by vigilance on financial performance and leverage metrics.
Analytical Overview
Analysis Summary
Overall Business and Market Assessment
Supporting Factors: Primary supporting factors include strong gross and operating margins, a strategic niche in supply chain financing, and recent insider accumulation signaling confidence. Main risks involve elevated debt levels, negative operating cash flow, and limited institutional ownership which may impact liquidity and governance. The appropriate investment timeframe is medium to long-term, contingent on improvements in cash flow and deleveraging. Overall, SG Finserve presents a stable but leveraged financial profile with growth potential balanced by operational and financial risks.
Risk Factors: No data
SWOT Analysis
Strengths
- The company maintains exceptionally high gross and operating profit margins.
- Strong market positioning in India's supply chain financing segment.
- Robust current ratio of 1.63 indicates good short-term liquidity.
- Significant insider ownership aligns management interests with shareholders.
Weaknesses
- High debt-to-equity ratio of 172.38 poses financial leverage risks.
- Negative operating cash flow over the trailing twelve months.
- Limited institutional investor participation at 1.42%.
- Absence of dividend payouts reduces income appeal for investors.
Opportunities
- Growing demand for supply chain financing in the expanding Indian economy.
- Potential to improve cash flow through operational efficiencies.
- Recent capital infusion via warrant conversion enhances liquidity.
- Increased insider and selective institutional buying may support stock stability.
Threats
- Regulatory changes in NBFC sector could impact operational flexibility.
- Competitive pressures from larger financial services firms.
- Macroeconomic volatility affecting credit risk and funding costs.
- Market sentiment sensitive to high leverage and cash flow concerns.
Company Description
SG Finserve Limited is a Non-Banking Finance Company registered with the Reserve Bank of India that specializes in providing inclusive business financing solutions to channel partners across India. The company offers supply chain financing products tailored to dealers, distributors, retailers, buyers, and logistics partners of Indian corporations. SG Finserve extends credit facilities at competitive interest rates to enable these business partners to grow their operations and support their own growth objectives. Since restarting operations in September 2022, following a period of ceasing previous business activities, the company has focused exclusively on its core financing business. Founded in 1994 and headquartered in Ghaziabad, Uttar Pradesh, SG Finserve serves as a financial intermediary in India's supply chain ecosystem, facilitating working capital management for channel partners of major corporations.