
ServiceNow, Inc (NOW)
Stock Analysis Report
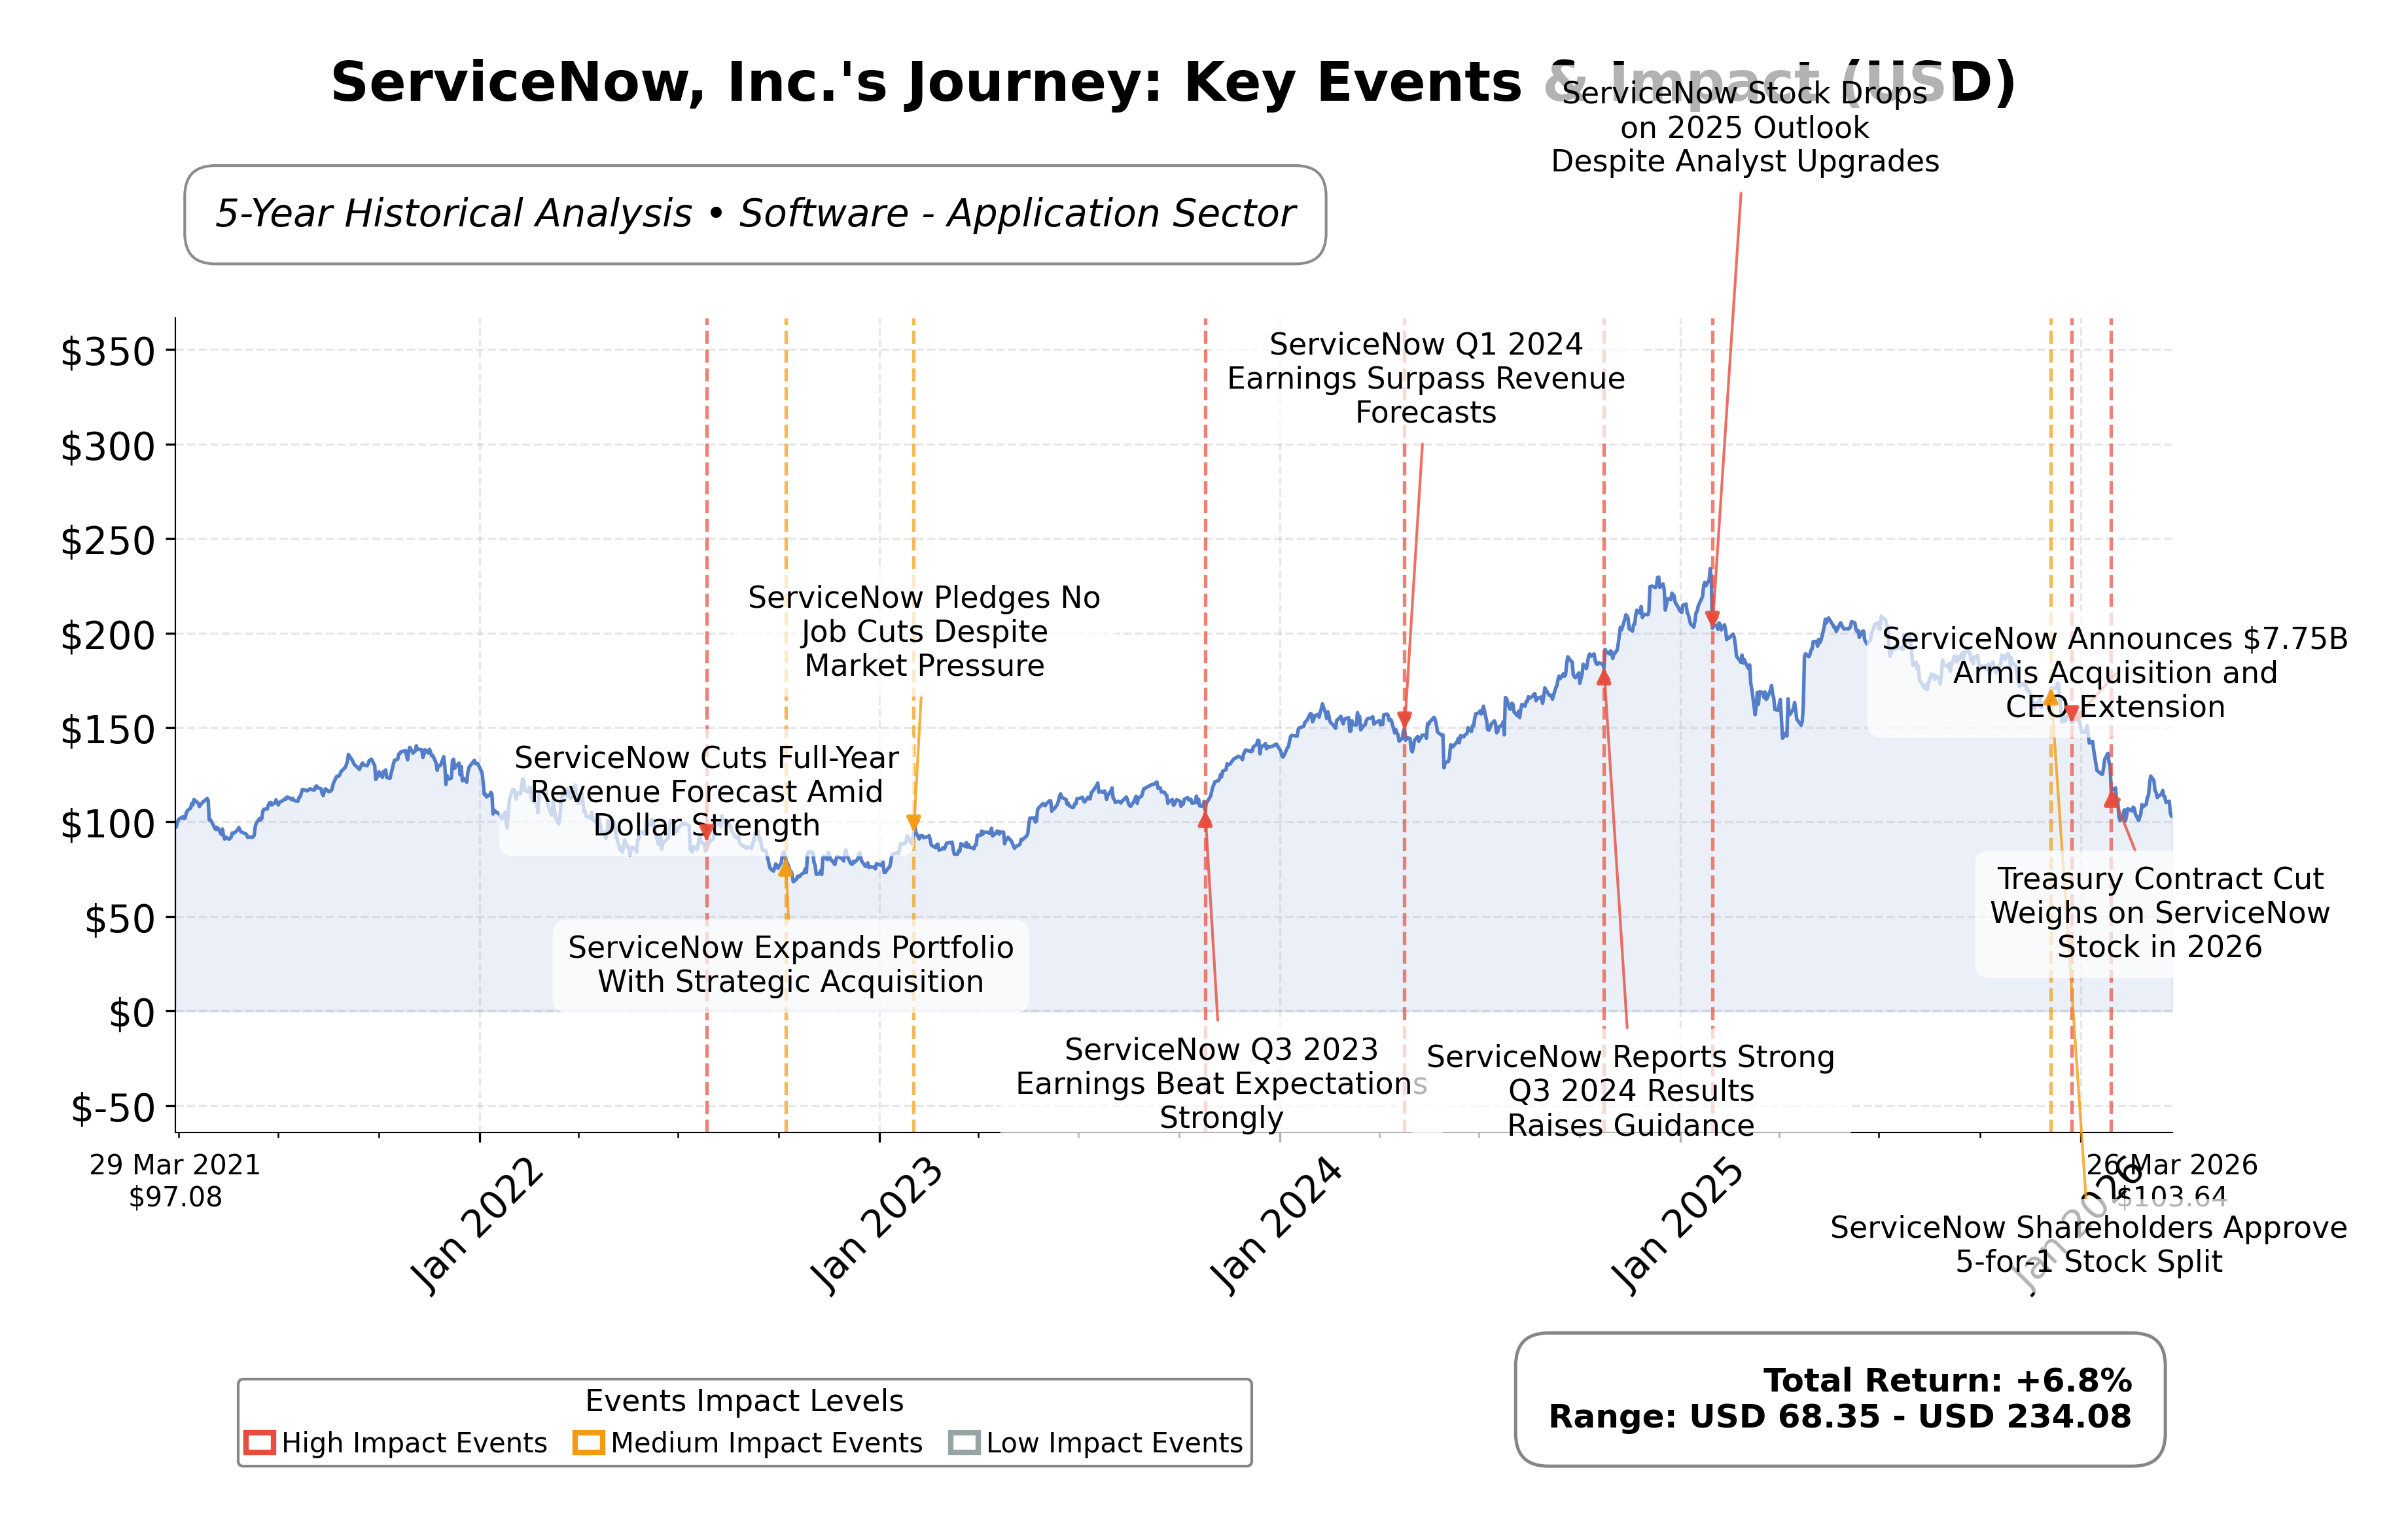
Stock Journey
Key Positives and Key Risks
Pros
- Revenue growth of 20.7% quarter-over-quarter indicates strong business expansion.
- High institutional ownership at 90.04% reflects significant market confidence.
- Robust cash reserves of over $6.28 billion support financial stability and operational flexibility.
Cons
- Elevated trailing P/E ratio of 67.83 suggests premium valuation with associated risk.
- Stock trading near 52-week low with downside risk of 53.96% indicates recent price weakness.
- Minimal insider ownership at 0.20% may limit internal alignment with shareholder interests.
Disclosure: This information is for general awareness and does not constitute investment advice
Report Summary
ServiceNow, Inc. operates as a leading cloud-based software company specializing in an AI-first platform, the Now platform, which automates and manages enterprise workflows across IT service management, customer service, HR, security, finance, and field service. Positioned within the technology sector and the software application industry, ServiceNow serves a broad range of industries including financial services, manufacturing, retail, telecom, government, and nonprofits. The company is recognized for its focus on predictive intelligence, hyperautomation, and workflow orchestration, powering digital transformation for over 85% of Fortune 500 companies.
Financially, ServiceNow reported a trailing twelve months (TTM) revenue of approximately $13.28 billion with a strong gross margin of 76.6% and a profit margin of 13.2%. The companyâs market capitalization stands at about $116.55 billion, with a trailing P/E ratio of 67.83 and a forward P/E of 22.56, reflecting high valuation multiples relative to earnings. The enterprise value to EBITDA ratio is elevated at 41.86, indicating premium valuation consistent with growth expectations. ServiceNow maintains a solid balance sheet with total assets of $26.04 billion, cash reserves exceeding $6.28 billion, and a manageable debt level of $2.40 billion, supporting operational liquidity and financial stability.
From a technical and strategic perspective, ServiceNow has recently advanced its AI-powered workflow ecosystem with new product launches and integrations, including a native integration with Vonage for automated voice workflows. Institutional ownership is high at 90%, indicating strong institutional interest and confidence, while insider ownership remains minimal. Notable risks include the companyâs high valuation multiples and recent share price volatility, with a 52-week range from $98 to $211.48 and current trading near the lower end. Strengths include robust revenue growth of 20.7% quarter-over-quarter and a diversified product portfolio supporting multiple industries.
Peer comparison within the software application industry in the United States reveals that ServiceNowâs valuation metrics are significantly higher than many peers such as Roper Technologies, SAP, and Salesforce, which have lower P/E ratios and EV/EBITDA multiples. While ServiceNowâs return on equity (15.5%) is competitive, its premium valuation suggests expectations of sustained growth. Some peers like Adobe and Autodesk also exhibit strong profitability but trade at lower multiples. This positioning underscores ServiceNowâs status as a growth-oriented leader but also highlights valuation risks relative to regional competitors.
ServiceNow navigates a dynamic industry landscape marked by rapid technological innovation and competitive pressures. Recent achievements include expanding AI capabilities and strategic partnerships, while ongoing challenges involve managing valuation expectations and market volatility. The company stands at a pivotal moment where execution on AI-driven growth initiatives and operational efficiency will determine its ability to sustain market leadership and justify premium valuations. Given the current financial and market data, a balanced perspective may be appropriate, recognizing both the companyâs growth potential and valuation considerations, suggesting a stance that remains observant of evolving market conditions and company performance.
Company and Industry Overview
Company Basics
Price Performance
Company Size
Shareholding Pattern
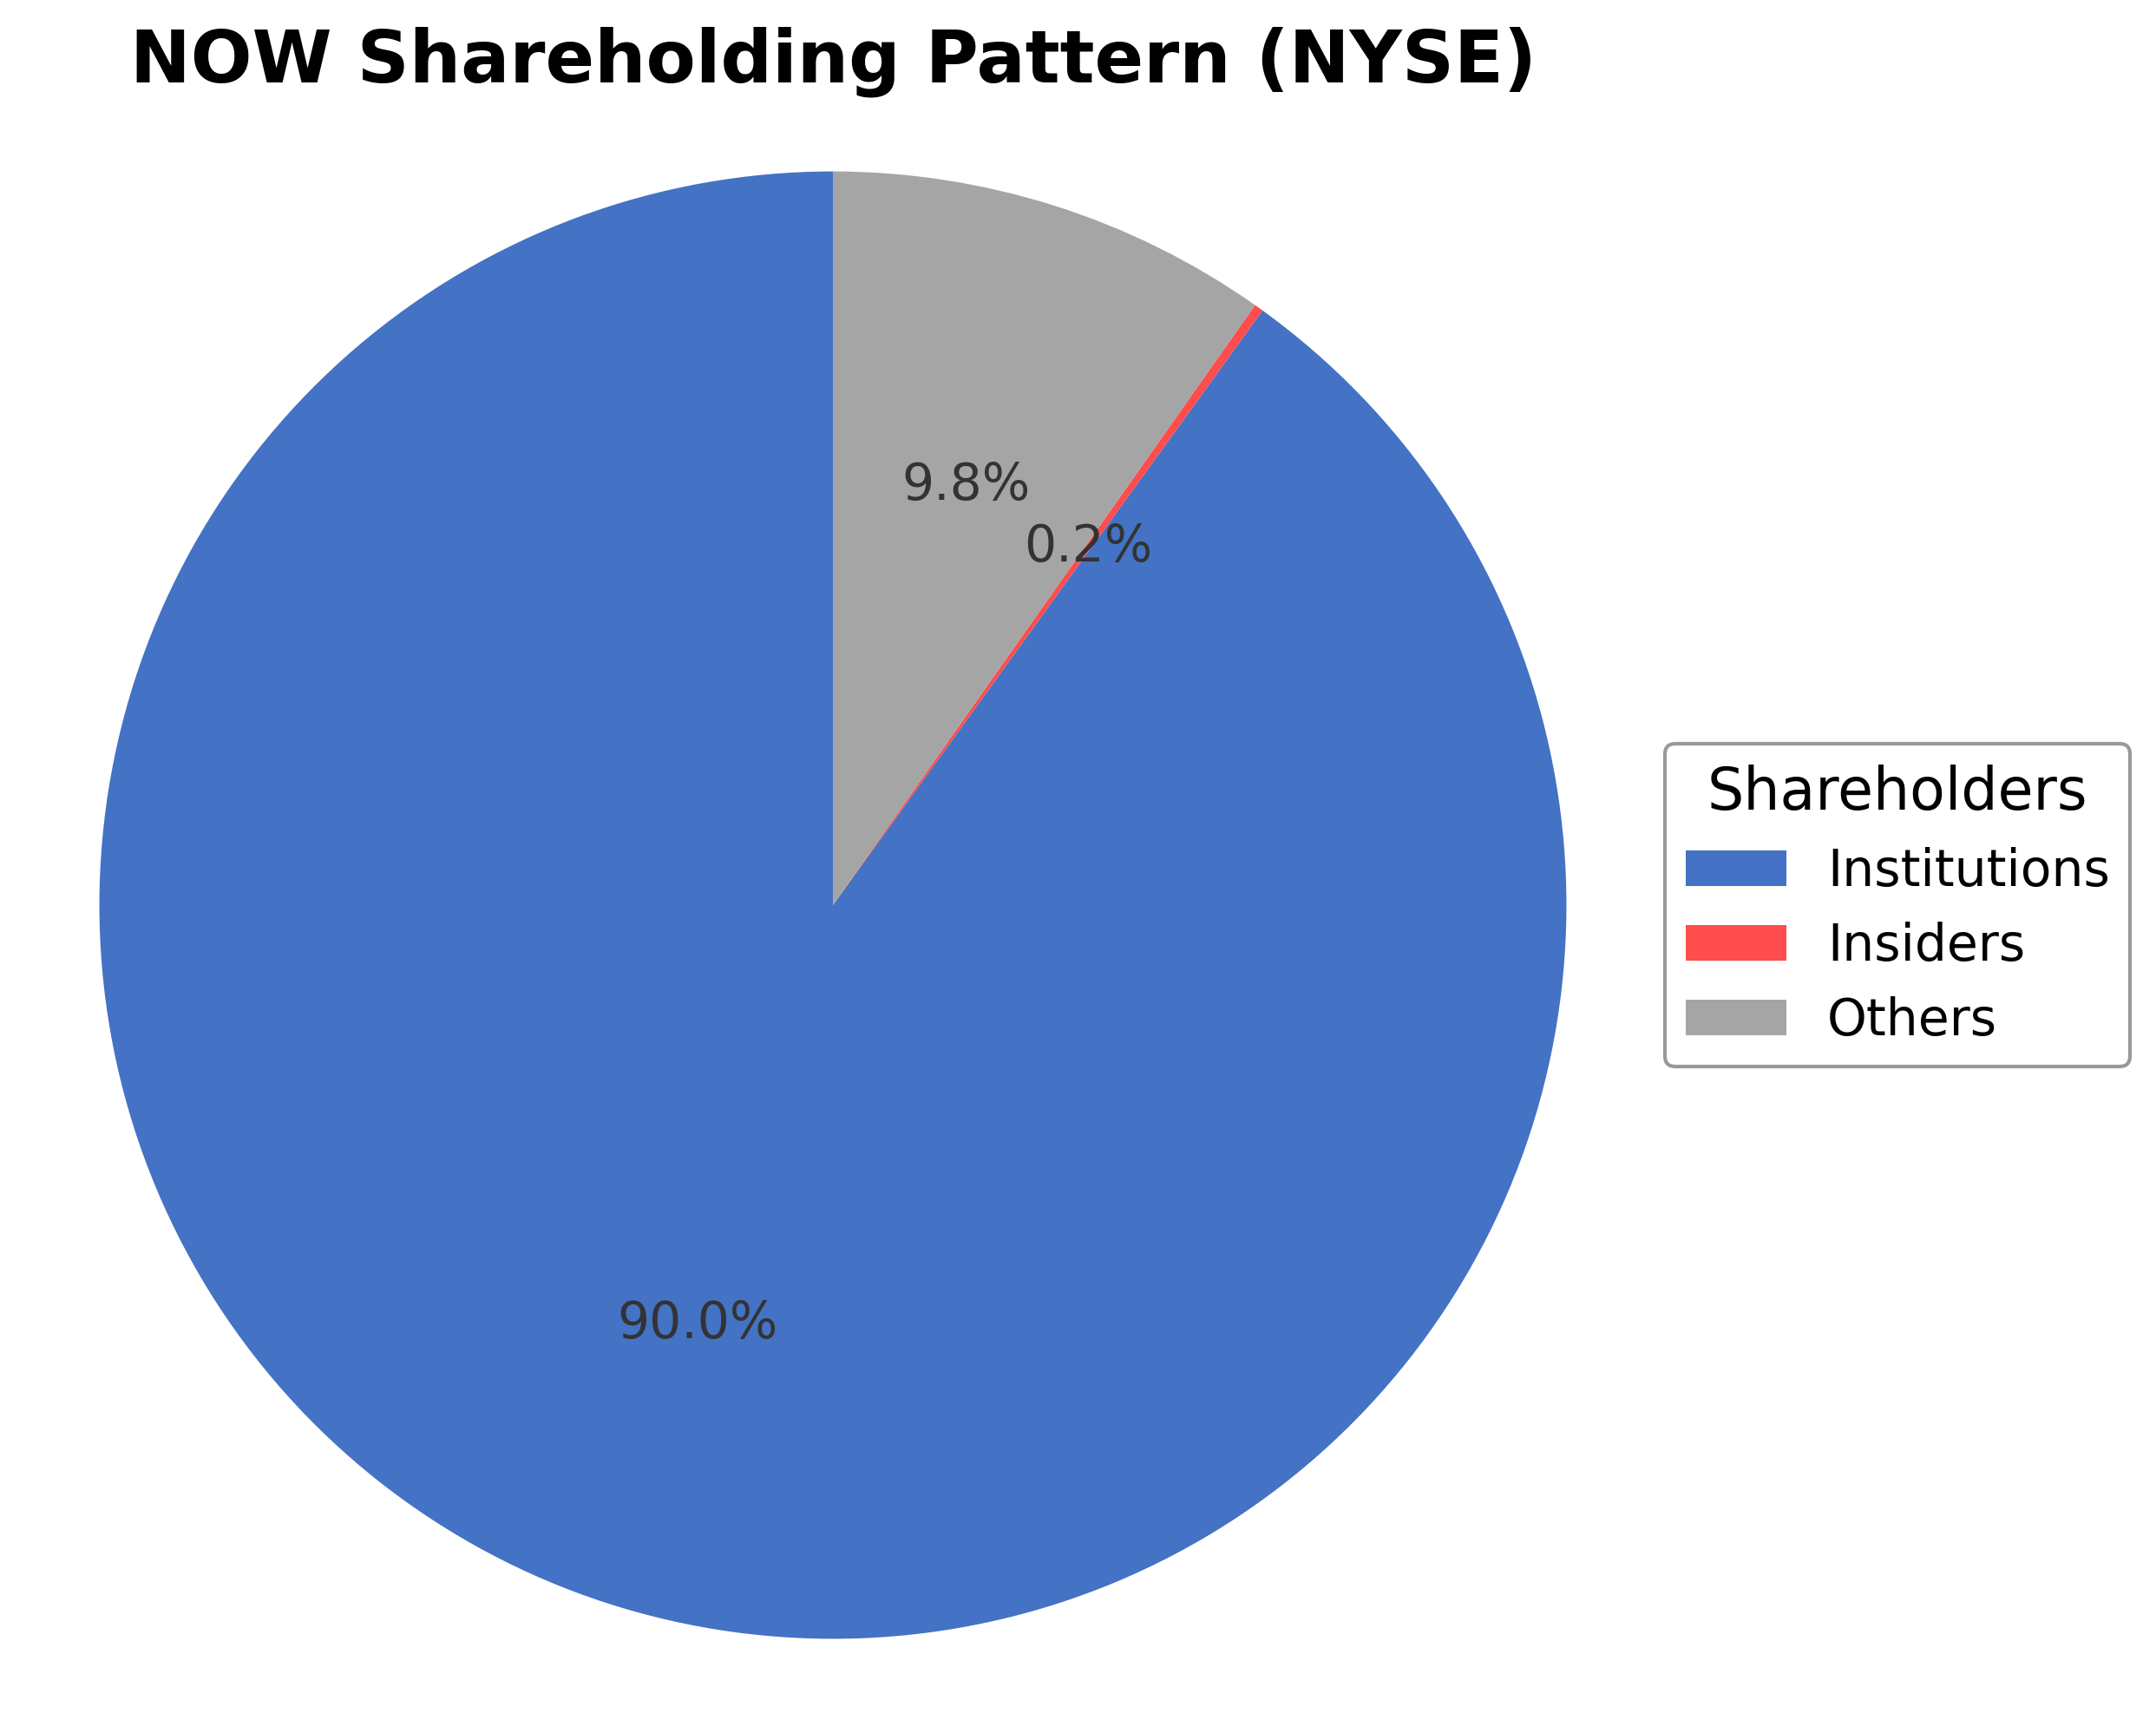
ServiceNow, Inc.'s ownership structure is dominated by institutional investors holding approximately 90.04% of shares, reflecting significant confidence from mutual funds, pension funds, and asset managers. Insider ownership remains minimal at 0.20%, indicating limited holdings by executives and board members. The remaining 9.76% is held by public shareholders and other retail investors. Over the past 12-24 months, institutional accumulation has been notable, with several funds increasing their stakes substantially, including Global X Japan Co. Ltd. and CMH Wealth Management LLC. These patterns suggest strong institutional endorsement of ServiceNow's strategic direction and governance, potentially supporting continued corporate initiatives and market positioning within the software application industry.
Sector and Industry Analysis
Sector and Industry Analysis: Enterprise Software & IT Services – Focus on ServiceNow, Inc. (NOW)
1. Sector Overview ServiceNow operates within the broader Information Technology sector, specifically in the enterprise software and IT services industry. This sector is characterized by large market size and robust growth driven by digital transformation initiatives across industries. The global enterprise software market is estimated to exceed $500 billion, with a compound annual growth rate (CAGR) around 10-12% over the next five years. Key players include ServiceNow, Salesforce, Microsoft, Oracle, and SAP, each offering cloud-based platforms that streamline business workflows, IT service management (ITSM), and automation. ServiceNow’s focus on cloud-native platforms for IT operations, customer service, and HR workflows positions it as a leader in the fast-growing ITSM and workflow automation sub-segments.
2. Industry Trends The enterprise software industry is undergoing rapid evolution driven by several technology shifts. Cloud adoption remains the dominant trend, with organizations migrating legacy systems to SaaS platforms to enhance scalability and reduce costs. Artificial intelligence (AI) and machine learning (ML) integration into workflow automation is creating new opportunities for predictive analytics and intelligent process automation. Additionally, the rise of low-code/no-code development platforms is empowering business users to customize workflows without heavy IT involvement. Consumer behavior within enterprises is shifting towards demand for seamless, user-friendly digital experiences, pushing vendors to innovate on UI/UX and mobile accessibility. Emerging opportunities include expansion into adjacent markets such as customer experience management, security operations, and industry-specific workflow solutions.
3. Regulatory Landscape The enterprise software industry operates under a complex regulatory environment that varies by geography and application. Key regulations impacting the sector include data privacy laws such as GDPR in Europe, CCPA in California, and other regional data protection frameworks that mandate stringent controls on personal data handling and cross-border data transfers. Compliance with cybersecurity standards (e.g., ISO 27001, SOC 2) is critical for vendors to maintain trust and meet customer requirements. Additionally, software vendors must navigate export controls and intellectual property protections. Increasing regulatory scrutiny on AI ethics and transparency may also influence product development and deployment. ServiceNow and peers invest heavily in compliance infrastructure to align with these evolving requirements, which can act as both a barrier and a differentiator.
4. Competitive Dynamics The enterprise software market is moderately concentrated with a few large incumbents and numerous specialized niche players. Barriers to entry are high due to the need for significant R&D investment, established customer relationships, and the complexity of integrating with existing enterprise IT ecosystems. ServiceNow’s competitive positioning benefits from its cloud-native architecture, strong brand recognition in ITSM, and expanding portfolio into enterprise-wide workflow automation. The company competes on innovation, platform extensibility, and ecosystem partnerships. Pricing models are typically subscription-based with tiered offerings, creating recurring revenue streams but also necessitating continuous product enhancement to reduce churn. Competitive pressures include rapid technological change, customer demands for customization, and the threat of large cloud providers bundling similar capabilities into broader cloud service offerings.
In summary, ServiceNow operates in a high-growth, innovation-driven segment of the IT sector marked by strong cloud adoption, AI integration, and increasing regulatory complexity. The competitive landscape rewards scale, technological leadership, and compliance rigor, positioning established players to capitalize on expanding enterprise digital transformation budgets.
Note: Analysis synthesized from industry research, market reports, and regulatory filings. Information is subject to change based on market conditions.
Illustrative Scenario Analysis
DCF Assumptions:
Method: Two-Stage EPS-Priority Model
Financials
Peer Analysis
| Company Name | Market Cap | P/E Ratio | P/B Ratio | EV/EBITDA | Price to CFO |
|---|---|---|---|---|---|
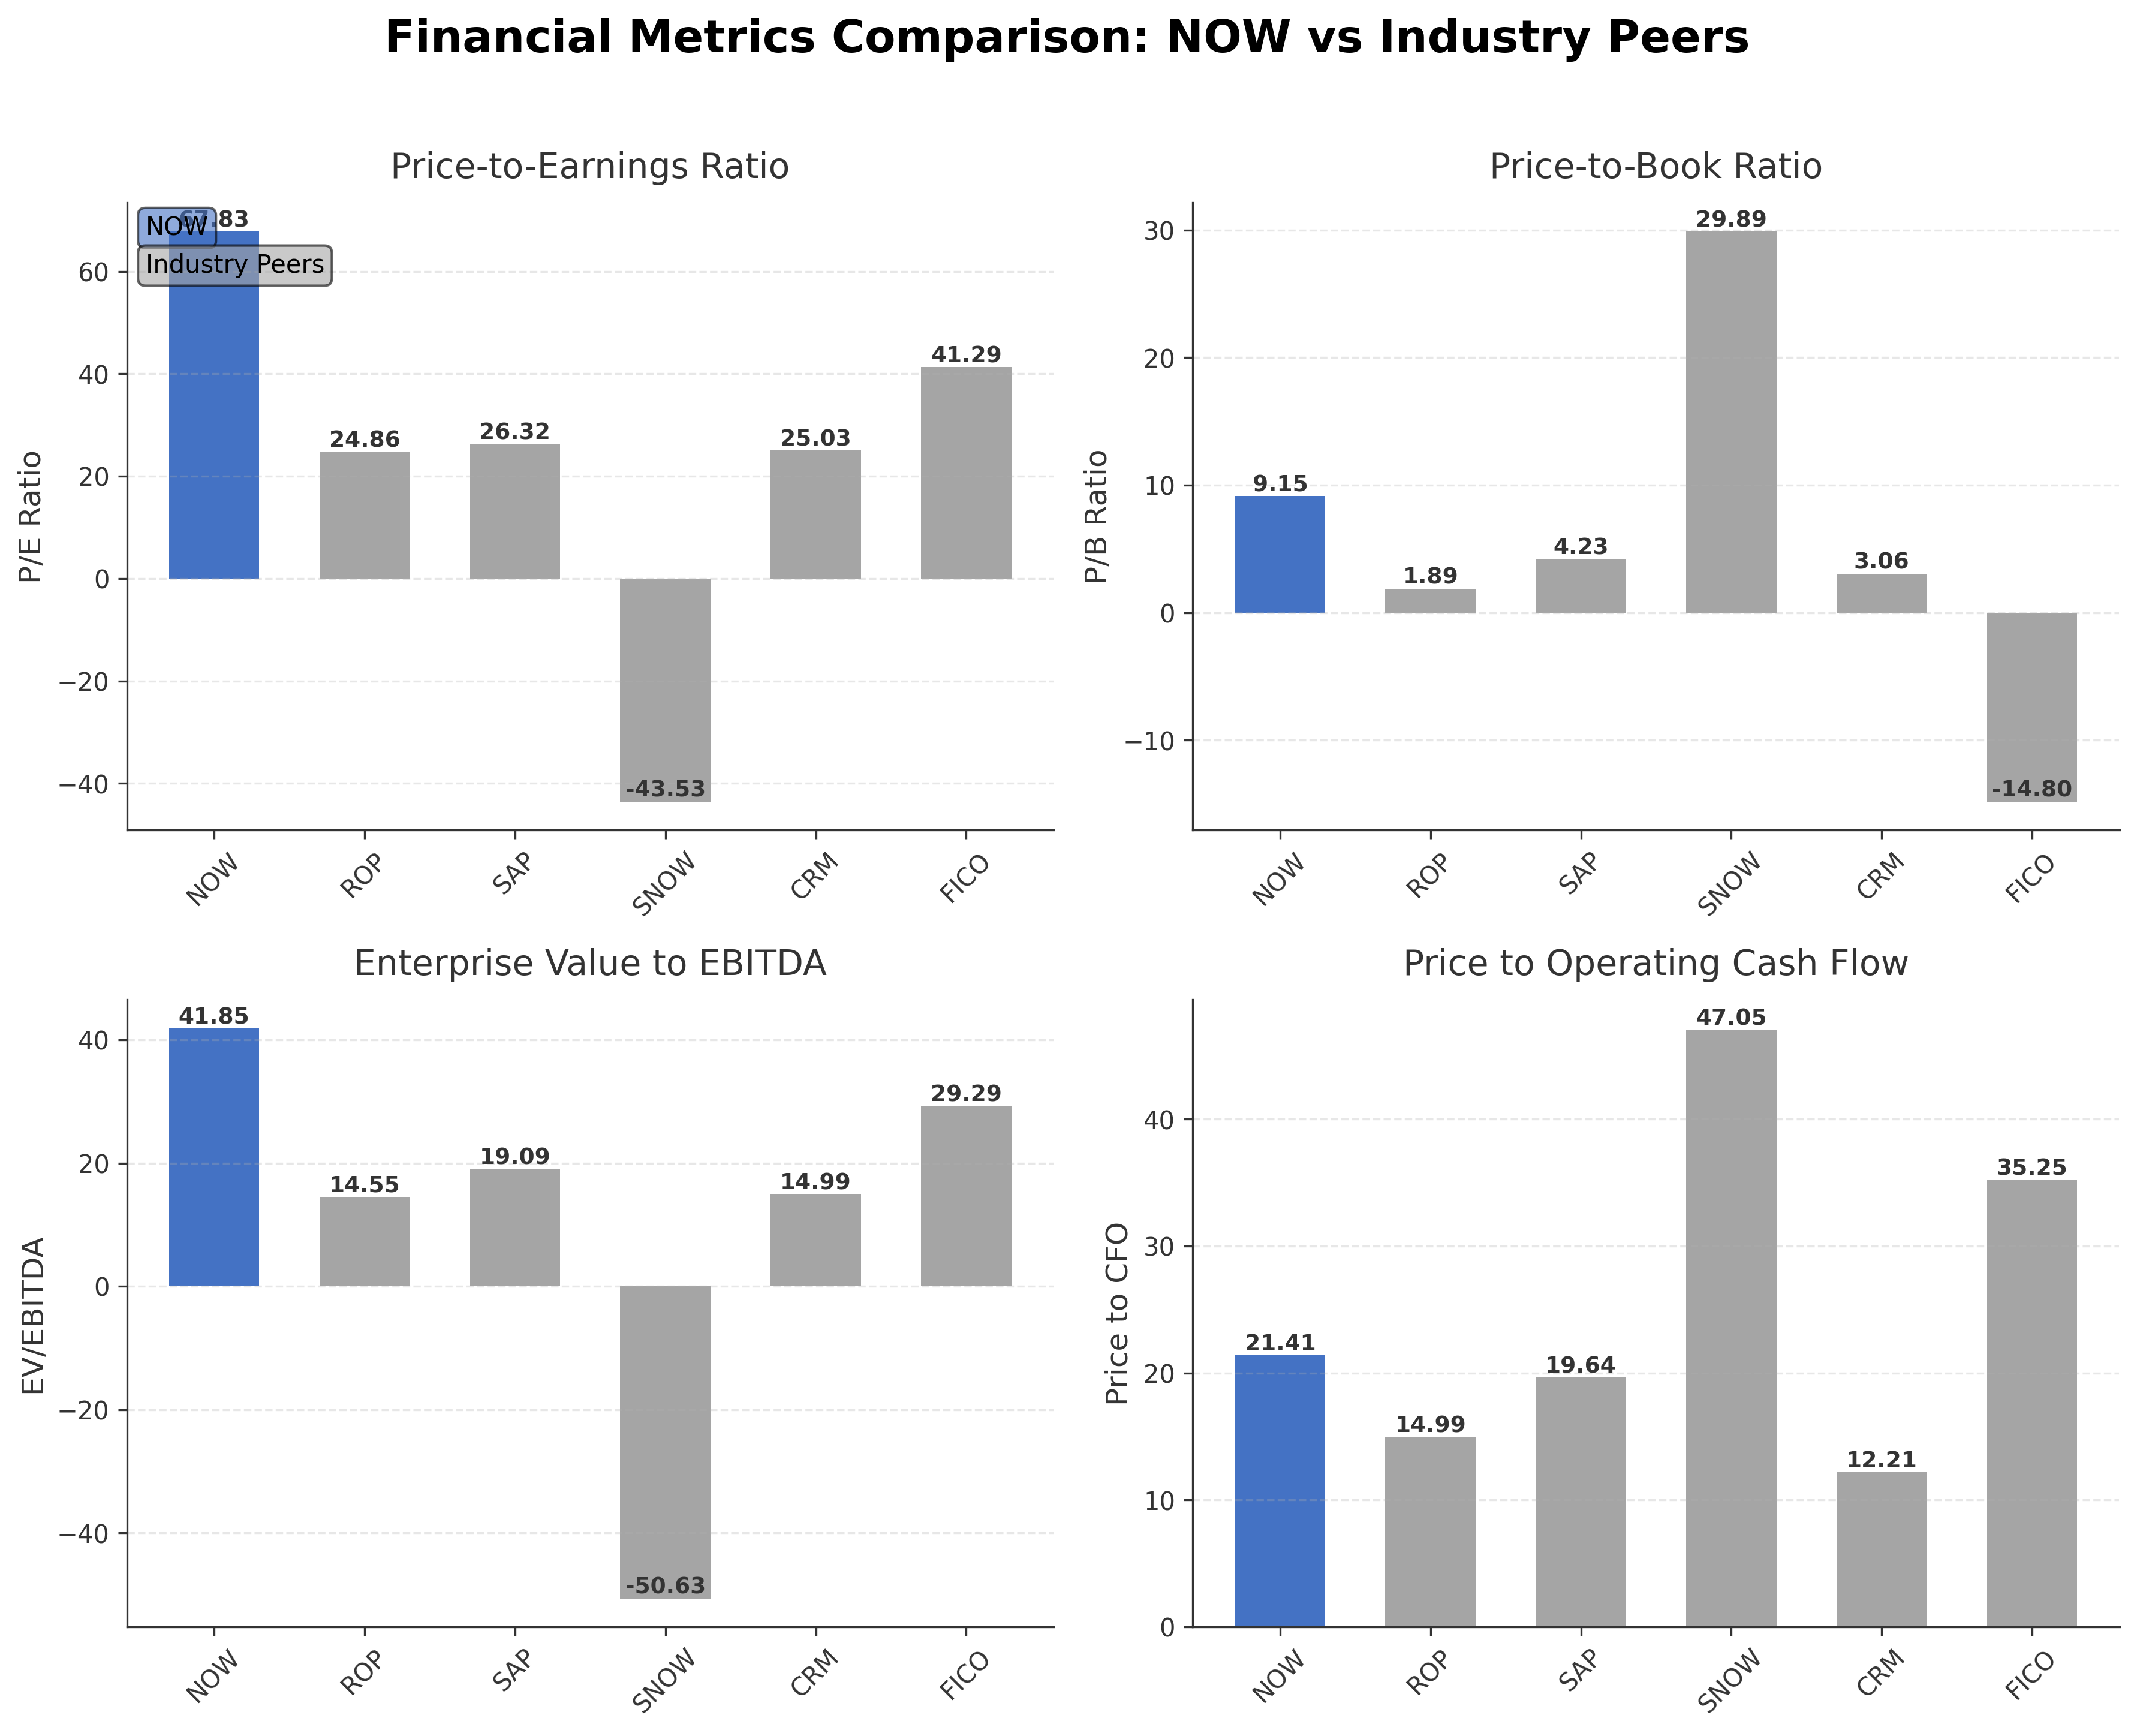
| ServiceNow, Inc. | $116.55B | 67.83 | 9.15 | 41.85 | 21.41 |
| Roper Technologies Inc. | $38.07B | 24.86 | 1.89 | 14.55 | 14.99 |
| SAP SE Sponsored ADR | $206.72B | 26.32 | 4.23 | 19.09 | 19.64 |
| Snowflake Inc. | $57.50B | -43.53 | 29.89 | -50.63 | 47.05 |
| Salesforce Inc | $183.07B | 25.03 | 3.06 | 14.99 | 12.21 |
| Fair Isaac Corporation | $26.75B | 41.29 | -14.80 | 29.29 | 35.25 |
Comparison Analysis: ServiceNow, Inc. exhibits significantly higher valuation multiples compared to its regional industry peers, with a trailing P/E ratio of 67.83 and EV/EBITDA of 41.85, reflecting market expectations for robust growth. Its return on equity at approximately 15.5% is competitive within the peer group, surpassing companies like Roper Technologies and Salesforce. However, peers such as SAP and Salesforce trade at more moderate multiples with solid profitability metrics. Some peers, including Snowflake and Fair Isaac, show negative earnings metrics, highlighting ServiceNow's relative earnings strength. Overall, ServiceNow's premium valuation underscores its leadership and growth orientation in the software application sector, albeit with elevated valuation risk compared to peers.
Financial Metrics Comparison with Peers
Financial Statements
Comprehensive financial data including income, balance sheet, and cash flow metrics
Income Statement
| fiscal_date | 2025-12-31 | 2024-12-31 | 2023-12-31 | 2022-12-31 | 2021-12-31 |
|---|---|---|---|---|---|
| Sales | 13.28B | 10.98B | 8.97B | 7.25B | 5.90B |
| Cost Of Goods | 2.98B | 2.29B | 1.92B | 1.57B | 1.35B |
| Gross Profit | 10.29B | 8.70B | 7.05B | 5.67B | 4.54B |
| Operating Expense Research And Development | 2.96B | 2.54B | 2.12B | 1.77B | 1.40B |
| Operating Expense Selling General And Administrative | 5.51B | 4.79B | 4.16B | 3.55B | 2.89B |
| Operating Income | 1.82B | 1.36B | 762.00M | 355.00M | 257.00M |
| Non Operating Interest Income | 451.00M | 419.00M | 302.00M | 82.00M | 20.00M |
| Non Operating Interest Expense | 23.00M | 23.00M | 24.00M | 27.00M | 28.00M |
| Other Income Expense | 9.00M | -22.00M | -32.00M | -38.00M | -28.00M |
| Pretax Income | 2.26B | 1.74B | 1.01B | 399.00M | 249.00M |
| Income Tax | 513.00M | 313.00M | -723.00M | 74.00M | 19.00M |
| Net Income | 1.75B | 1.43B | 1.73B | 325.00M | 230.00M |
| Eps Basic | 1.69 | 1.38 | 8.48 | 1.61 | 1.16 |
| Eps Diluted | 1.67 | 1.37 | 8.42 | 1.60 | 1.13 |
| Basic Shares Outstanding | 1.04B | 1.03B | 204.00M | 201.00M | 198.00M |
| Diluted Shares Outstanding | 1.04B | 1.03B | 204.00M | 201.00M | 198.00M |
| Ebit | 2.28B | 1.76B | 1.03B | 355.00M | 257.00M |
| Ebitda | 3.02B | 2.33B | 1.59B | 788.00M | 729.00M |
| Net Income Continuous Operations | 1.75B | 1.43B | 1.73B | 325.00M | 230.00M |
Source: Financial statements and regulatory filings
Balance Sheet
| fiscal_date | 2025-12-31 | 2024-12-31 | 2023-12-31 | 2022-12-31 | 2021-12-31 |
|---|---|---|---|---|---|
| Cash And Cash Equivalents | 3.73B | 2.30B | 1.90B | 1.47B | 1.73B |
| Accounts Receivable | 2.63B | 2.24B | 2.04B | 1.73B | 1.39B |
| Total Assets | 26.04B | 20.38B | 17.39B | 13.30B | 10.80B |
| Total Liabilities | 13.07B | 10.77B | 9.76B | 8.27B | 7.10B |
| Long Term Debt | 2.29B | 2.18B | 2.19B | 2.14B | 2.04B |
| Shareholders Equity | 12.96B | 9.61B | 7.63B | 5.03B | 3.69B |
Source: Financial statements and regulatory filings
Cash Flow Statement
| fiscal_date | 2025-12-31 | 2024-12-31 | 2023-12-31 | 2022-12-31 | 2021-12-31 |
|---|---|---|---|---|---|
| Operating Activities Net Income | 1.75B | 1.43B | 1.73B | 325.00M | 230.00M |
| Operating Activities Depreciation | 738.00M | 564.00M | 562.00M | 433.00M | 472.00M |
| Operating Activities Deferred Taxes | 249.00M | 98.00M | -857.00M | 15.00M | -34.00M |
| Operating Activities Stock Based Compensation | 1.96B | 1.75B | 1.60B | 1.40B | 1.13B |
| Operating Activities Other Non Cash Items | 725.00M | 499.00M | 459.00M | 375.00M | 334.00M |
| Operating Activities Accounts Receivable | -312.00M | -254.00M | -300.00M | -340.00M | -401.00M |
| Operating Activities Accounts Payable | 55.00M | -52.00M | -142.00M | 172.00M | 55.00M |
| Operating Activities Other Assets Liabilities | 421.00M | 466.00M | 368.00M | 338.00M | 395.00M |
| Operating Activities Operating Cash Flow | 5.58B | 4.49B | 3.42B | 2.72B | 2.18B |
| Investing Activities Capital Expenditures | -868.00M | -852.00M | -694.00M | -550.00M | -392.00M |
| Investing Activities Net Intangibles | -43.00M | -40.00M | -3.00M | 0.00 | -7.00M |
| Investing Activities Net Acquisitions | -1.08B | -113.00M | -279.00M | -91.00M | -785.00M |
| Investing Activities Purchase Of Investments | -3.87B | -5.21B | -4.71B | -4.21B | -2.56B |
| Investing Activities Sale Of Investments | 4.14B | 3.75B | 3.52B | 2.25B | 2.12B |
| Investing Activities Other Investing Activity | 38.00M | -36.00M | -4.00M | 18.00M | 7.00M |
| Investing Activities Investing Cash Flow | -1.65B | -2.46B | -2.16B | -2.58B | -1.61B |
| Financing Activities Common Stock Repurchase | -1.84B | -696.00M | -538.00M | 0.00 | 0.00 |
| Financing Activities Other Financing Charges | -770.00M | -884.00M | -459.00M | -427.00M | -612.00M |
| Financing Activities Financing Cash Flow | -2.61B | -1.58B | -997.00M | -521.00M | -673.00M |
| End Cash Position | 3.73B | 2.31B | 1.90B | 1.48B | 1.73B |
| Income Tax Paid | 283.00M | 230.00M | 127.00M | 45.00M | 36.00M |
| Interest Paid | 22.00M | 23.00M | 23.00M | 24.00M | 41.00M |
| Free Cash Flow | 4.53B | 3.38B | 2.70B | 2.17B | 1.80B |
| Financing Activities Long Term Debt Payments | N/A | 0.00 | 0.00 | -94.00M | -61.00M |
| Financing Activities Long Term Debt Issuance | N/A | N/A | N/A | 0.00 | 0.00 |
Source: Financial statements and regulatory filings
Technical Analysis
Key Insights
- The current trend shows a downward price movement with the stock trading near its 52-week low of $98, indicating bearish momentum over the past year.
- Key support levels are identified around $98, while resistance is observed near the 50-day moving average at approximately $118.53 and the 200-day moving average near $165.90.
- The stock price is below both the 50-day and 200-day moving averages, suggesting a bearish intermediate and long-term trend.
- Momentum indicators show the Relative Strength Index (RSI) in a lower range, indicating potential oversold conditions; MACD signals bearish momentum but with signs of possible convergence.
- Multi-timeframe analysis reveals consistent weakness on daily and weekly charts, with monthly charts confirming a longer-term downtrend.
- Potential market scenarios include continued consolidation near support levels or a reversal if price breaks above the 50-day moving average, contingent on broader market and sector dynamics.
Trending News
1. Headline: ServiceNow (NOW) Products See Growth Amid Transformation into AI-Powered Enterprise Platform - Insider Monkey
Summary: In its fourth-quarter 2025 investor letter, Columbia Global Technology Growth Fund highlighted ServiceNow, Inc. (NYSE:NOW). ServiceNow, Inc. (NYSE:NOW) is a cloud-based software company that provides a platform for automating and managing digital workflows. On March 26, 2026, ServiceNow, Inc.
Sentiment: positive
2. Headline: -4.46% for ServiceNow stock as technicals confirm strong downside pressure
Summary: The company finalized a native integration with Vonage to enable automated voice-driven workflows in its Customer Service Management and IT Service Management offerings. ServiceNow also advanced its AI-powered workflow ecosystem with new product launches, including the EmployeeWorks helpdesk ...
Sentiment: positive
3. Headline: Global X Japan Co. Ltd. Increases Stock Position in ServiceNow, Inc. $NOW
Summary: Global X Japan Co. Ltd. increased its position in ServiceNow, Inc. (NYSE:NOW - Free Report) by 2,433.5% in the 4th quarter, according to its most recent filing with the SEC. The fund owned 41,980 shares of the information technology services provider's stock after purchasing an additional 40,323 sh
Sentiment: positive
4. Headline: ServiceNow, Inc. $NOW Stock Position Raised by CMH Wealth Management LLC
Summary: CMH Wealth Management LLC increased its stake in ServiceNow, Inc. (NYSE:NOW - Free Report) by 401.7% during the fourth quarter, according to its most recent filing with the Securities & Exchange Commission. The fund owned 58,167 shares of the information technology services provider's stock aft
Sentiment: positive
5. Headline: inMorphis Named as ServiceNow Partner of the Year 2026 - Risk & Security - Asia Pacific | Morningstar
Summary: ServiceNow, the ServiceNow logo, Now, Now Platform, and other ServiceNow marks are trademarks and/or registered trademarks of ServiceNow, Inc.
Sentiment: neutral
6. Headline: ServiceNow Expands Through New Strategic Partnerships
Summary: ServiceNow Inc.’s stocks have been trading up by 2.3 percent, reflecting bullish sentiment following strategic growth initiatives. Key Takeaways ServiceNo
Sentiment: positive
7. Headline: SeaCrest Wealth Management LLC Raises Stake in ServiceNow, Inc. $NOW
Summary: SeaCrest Wealth Management LLC raised its holdings in ServiceNow, Inc. (NYSE:NOW - Free Report) by 411.8% during the fourth quarter, according to the company in its most recent Form 13F filing with the SEC. The firm owned 15,927 shares of the information technology services provider's stock after p
Sentiment: positive
Summary: ServiceNow, Inc. (NYSE:NOW) is featured in Mad Money’s latest recap as Jim Cramer shared his buy, sell, or hold verdict. Answering a caller’s query about the stock during the episode, Cramer said: Okay, now what we’re dealing with here is stock sells at 26 times earnings.
Sentiment: neutral
9. Headline: ServiceNow (NOW) Sold Off on AI Fears but Long-Term Competitive Edge Remains Intact - Insider Monkey
Summary: In its fourth-quarter 2025 investor letter, Montaka Global Investments highlighted stocks like ServiceNow, Inc. (NYSE:NOW). ServiceNow, Inc. (NYSE:NOW) provides cloud-based software that helps enterprises automate IT services, workflows, and digital operations across organizations.
Sentiment: positive
10. Headline: Is ServiceNow, Inc. (NOW) A Good Stock To Buy Now? - Insider Monkey
Summary: Is NOW a good stock to buy? We came across a bullish thesis on ServiceNow, Inc. on CapexAndChill’s Substack. In this article, we will summarize the bulls’ thesis on NOW.
Sentiment: positive
Recent Updates
News Summary
Recent news highlights ServiceNow's strong earnings growth and strategic positioning within the technology sector. Citizens reaffirmed a bullish stance on the company citing its robust earnings growth in 2026. Institutional ownership changes include Vanguard's realignment resulting in zero ownership, contrasting with increased stakes by Norden Group LLC and other wealth management firms, indicating mixed institutional sentiment. Earnings previews emphasize ServiceNow's leadership in cloud-based workflow automation, while product growth and AI transformation remain key themes. The company’s strategic partnerships and AI-driven platform enhancements continue to shape its market positioning amid evolving industry dynamics.
News Sentiment
Overall sentiment is predominantly positive, driven by strong earnings growth and institutional accumulation, tempered by isolated negative developments such as Vanguard's divestment. Positive coverage focuses on AI transformation and strategic partnerships, while neutral and negative sentiments reflect market volatility and ownership shifts. This mixed sentiment suggests cautious optimism in the market's view of ServiceNow's near-term prospects.
Analytical Overview
Analysis Summary
ServiceNow’s valuation metrics, including a trailing P/E of 67.83 and forward P/E of 22.56, are substantially higher than industry averages, reflecting premium pricing consistent with growth expectations in the software application sector. This contrasts with peers trading at lower multiples, indicating market anticipation of sustained earnings expansion.
The company demonstrates a strong growth trajectory with quarterly revenue growth of 20.7% and positive earnings growth year-over-year, supported by expanding AI-driven product offerings and strategic partnerships. Operating and free cash flows are robust, enhancing financial flexibility.
Financial health appears solid with a current ratio near 1.0, manageable debt-to-equity ratio of 18.5%, and significant cash reserves exceeding $6.28 billion, supporting liquidity and operational needs. The company’s return on equity of approximately 15.5% indicates effective capital utilization.
Sector-specific opportunities include increasing adoption of AI and automation in enterprise workflows, while challenges encompass high valuation multiples and competitive pressures in the cloud software market. Market positioning as a leader in workflow automation supports growth potential.
Consider market positioning and competitive advantages in the U.S. technology sector, where ServiceNow benefits from a broad customer base and strong institutional ownership, though valuation sensitivity remains a factor amid evolving economic conditions.
Investment Conclusion
Supporting Factors: Primary supporting factors include strong revenue and earnings growth, robust cash flow generation, and a leading position in AI-powered enterprise workflow automation.
Risk Factors: Main risk factors to monitor are elevated valuation multiples, recent share price volatility, and potential competitive challenges in the software application industry.
SWOT Analysis
Strengths
- Leading cloud-based AI-first platform with broad enterprise workflow automation capabilities.
- Strong revenue growth of 20.7% quarter-over-quarter and robust profit margins.
- High institutional ownership at 90.04%, indicating strong market confidence.
- Diverse industry customer base including Fortune 500 companies.
Weaknesses
- Elevated valuation multiples with a trailing P/E of 67.83 and EV/EBITDA of 41.85.
- Minimal insider ownership potentially limiting internal alignment incentives.
- Stock trading near 52-week low with significant downside risk of 53.96%.
- Current ratio near 1.0, indicating tight short-term liquidity.
Opportunities
- Expansion of AI-powered workflow products and strategic integrations.
- Growing demand for digital transformation and automation across industries.
- Potential to increase market share through new partnerships and acquisitions.
- Advancements in low-code/no-code development tools to attract broader user base.
Threats
- Intense competition in the cloud software and enterprise automation market.
- Market volatility impacting valuation and investor sentiment.
- Regulatory changes affecting data security and compliance requirements.
- Economic uncertainties potentially slowing enterprise IT spending.
Company Description
ServiceNow, Inc. is a leading software company offering a cloud-based, AI-first platform known as the Now platform for automating and managing enterprise workflows. It unifies AI, data, and processes across IT service management, customer service, HR service delivery, security operations, finance, and field service, enabling organizations to streamline operations, reduce silos, and enhance productivity. Key features include AI agents for complex automation, low-code/no-code app development tools, real-time analytics, self-service portals, and seamless integrations with tools like Salesforce, Microsoft Teams, and Slack. The platform supports industries such as financial services, manufacturing, retail, telecom, government, and nonprofits, providing enterprise-grade security with encryption, role-based access, and compliance tools. Founded in 2004 with over 26,000 employees, ServiceNow powers digital transformation for more than 85% of Fortune 500 companies, focusing on predictive intelligence, hyperautomation, and workflow orchestration to make work flow efficiently and securely across global operations.