


Sepc Ltd (SEPC)
Stock Analysis Report
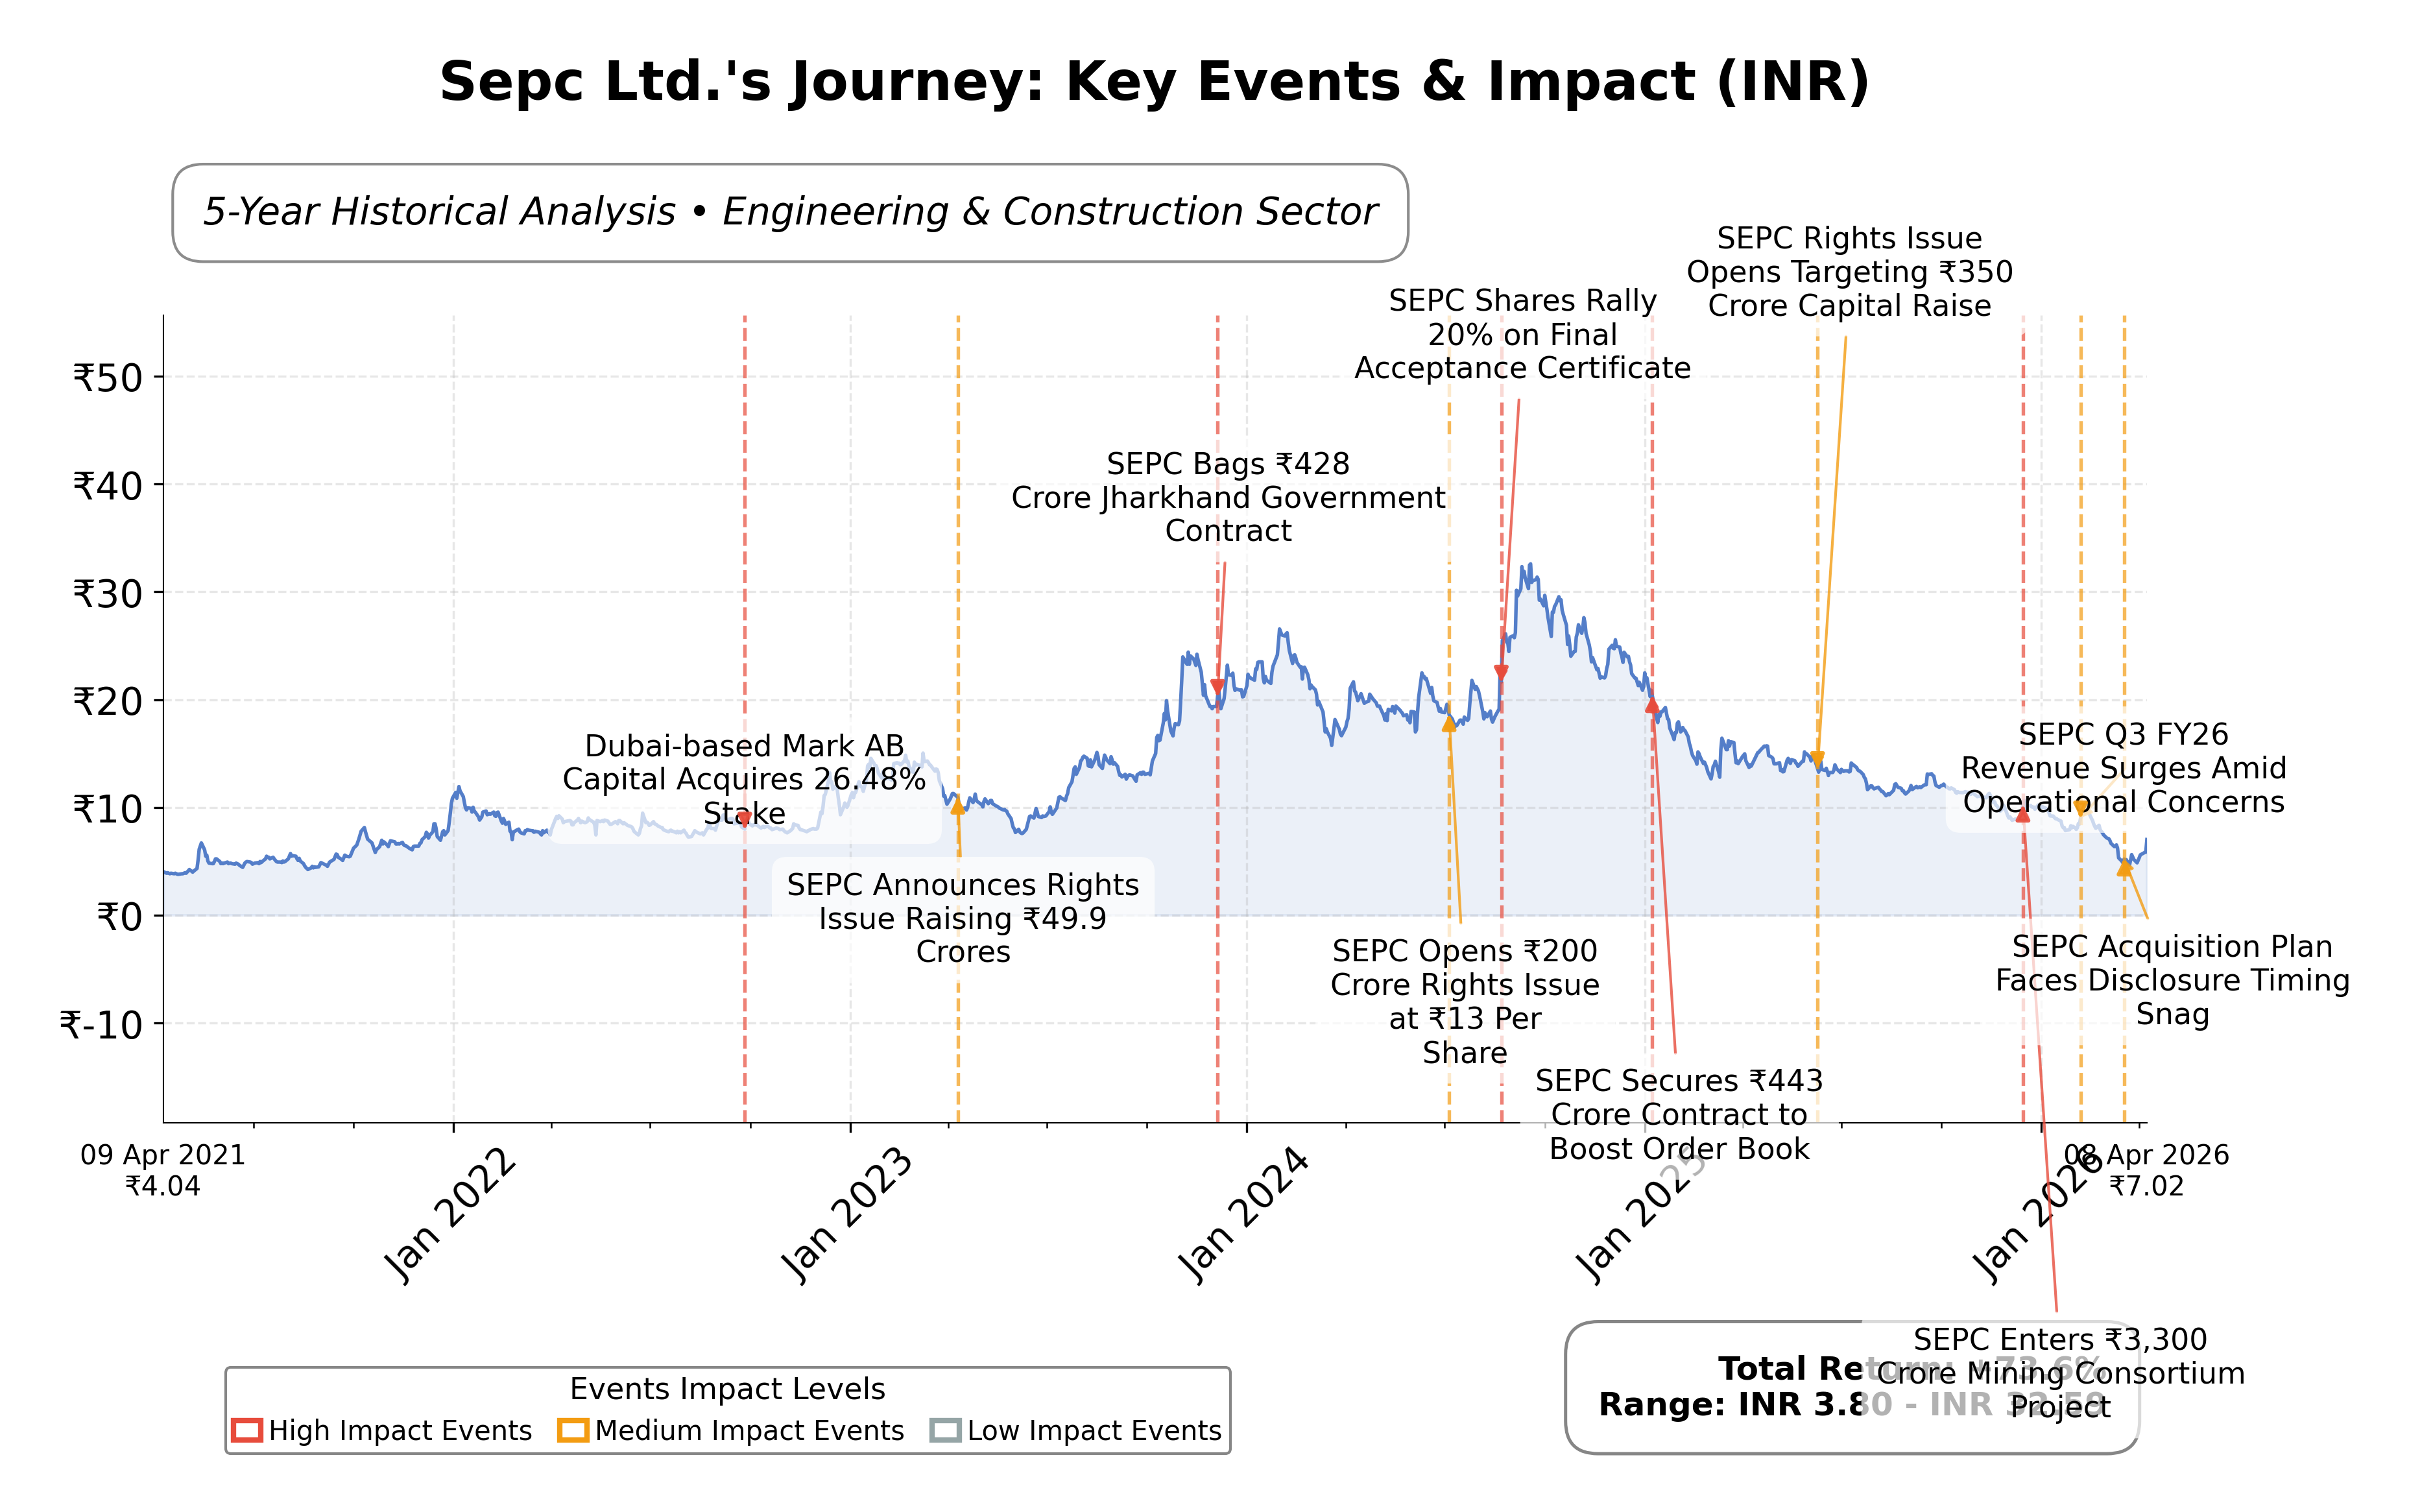
Stock Journey
Key Positives and Key Risks
Pros
- Market capitalization of ₹13.64B positions Sepc Ltd. as a notable player within its sector.
- Current ratio of 2.92 indicates strong liquidity and short-term financial stability.
- Strategic acquisition of 90% stake in Abu Dhabi-based Avenir International expands global footprint.
Cons
- Negative operating cash flow of approximately ₹-2.65B raises concerns about cash generation.
- High debt-to-equity ratio of 19.36 suggests elevated financial leverage and potential risk.
- Return on equity is low at 0.02%, reflecting limited profitability relative to shareholder equity.
Disclosure: This information is for general awareness and does not constitute investment advice
Report Summary
Sepc Ltd. operates within the Engineering & Construction industry in India, focusing on delivering large-scale infrastructure projects across sectors such as energy, water, metal, and transportation. The company is recognized for its comprehensive engineering solutions, spanning from conceptual design to commissioning, and serves both emerging and mature markets with a commitment to quality and sustainability.
Financially, Sepc Ltd. reports a market capitalization of approximately â¹13.64 billion with a trailing P/E ratio of 26.00, aligning with the industry average. The companyâs revenue stands near â¹8.98 billion with a modest profit margin of 5.55% and an operating margin of 7.99%. Despite positive net income of roughly â¹498 million, operating cash flow is negative at around â¹-2.65 billion, while free cash flow remains positive at â¹248 million. The price-to-book ratio is below 1 at 0.77, indicating valuation below book value.
Technically, Sepc Ltd. exhibits a current price of â¹7.02, trading below its 200-day moving average of â¹10.07, suggesting a bearish trend over the longer term. Recent strategic moves include the approved acquisition of a 90% stake in Abu Dhabi-based Avenir International, signaling expansion efforts. Leadership changes include the appointment of an independent director, Dr. Ashutosh Karnatak. Strengths include a strong current ratio of 2.92, while risks involve negative operating cash flow and relatively low returns on equity and assets.
Peer analysis within the Indian Engineering & Construction sector shows Sepc Ltd. has a smaller market cap compared to peers like Rail Vikas Nigam Ltd. (â¹543.63B) and Kec International Ltd. (â¹140.95B). Its P/E ratio is moderate relative to peers, with some competitors exhibiting higher valuations and returns on equity. Sepcâs price-to-CFO ratio is negative, contrasting with positive ratios in some peers, indicating operational cash flow challenges relative to the sector.
Sepc Ltd. navigates a competitive and capital-intensive industry landscape marked by infrastructure demand and evolving market dynamics. Recent achievements include strategic acquisitions and leadership appointments aimed at strengthening its global footprint. Ongoing challenges include managing cash flow and improving profitability metrics amid sector volatility. The companyâs current strategies and market conditions present pivotal moments that could influence its financial and operational trajectory. Observers may find a balanced perspective appropriate, considering both growth initiatives and financial constraints.
Company and Industry Overview
Company Basics
Price Performance
Company Size
Shareholding Pattern
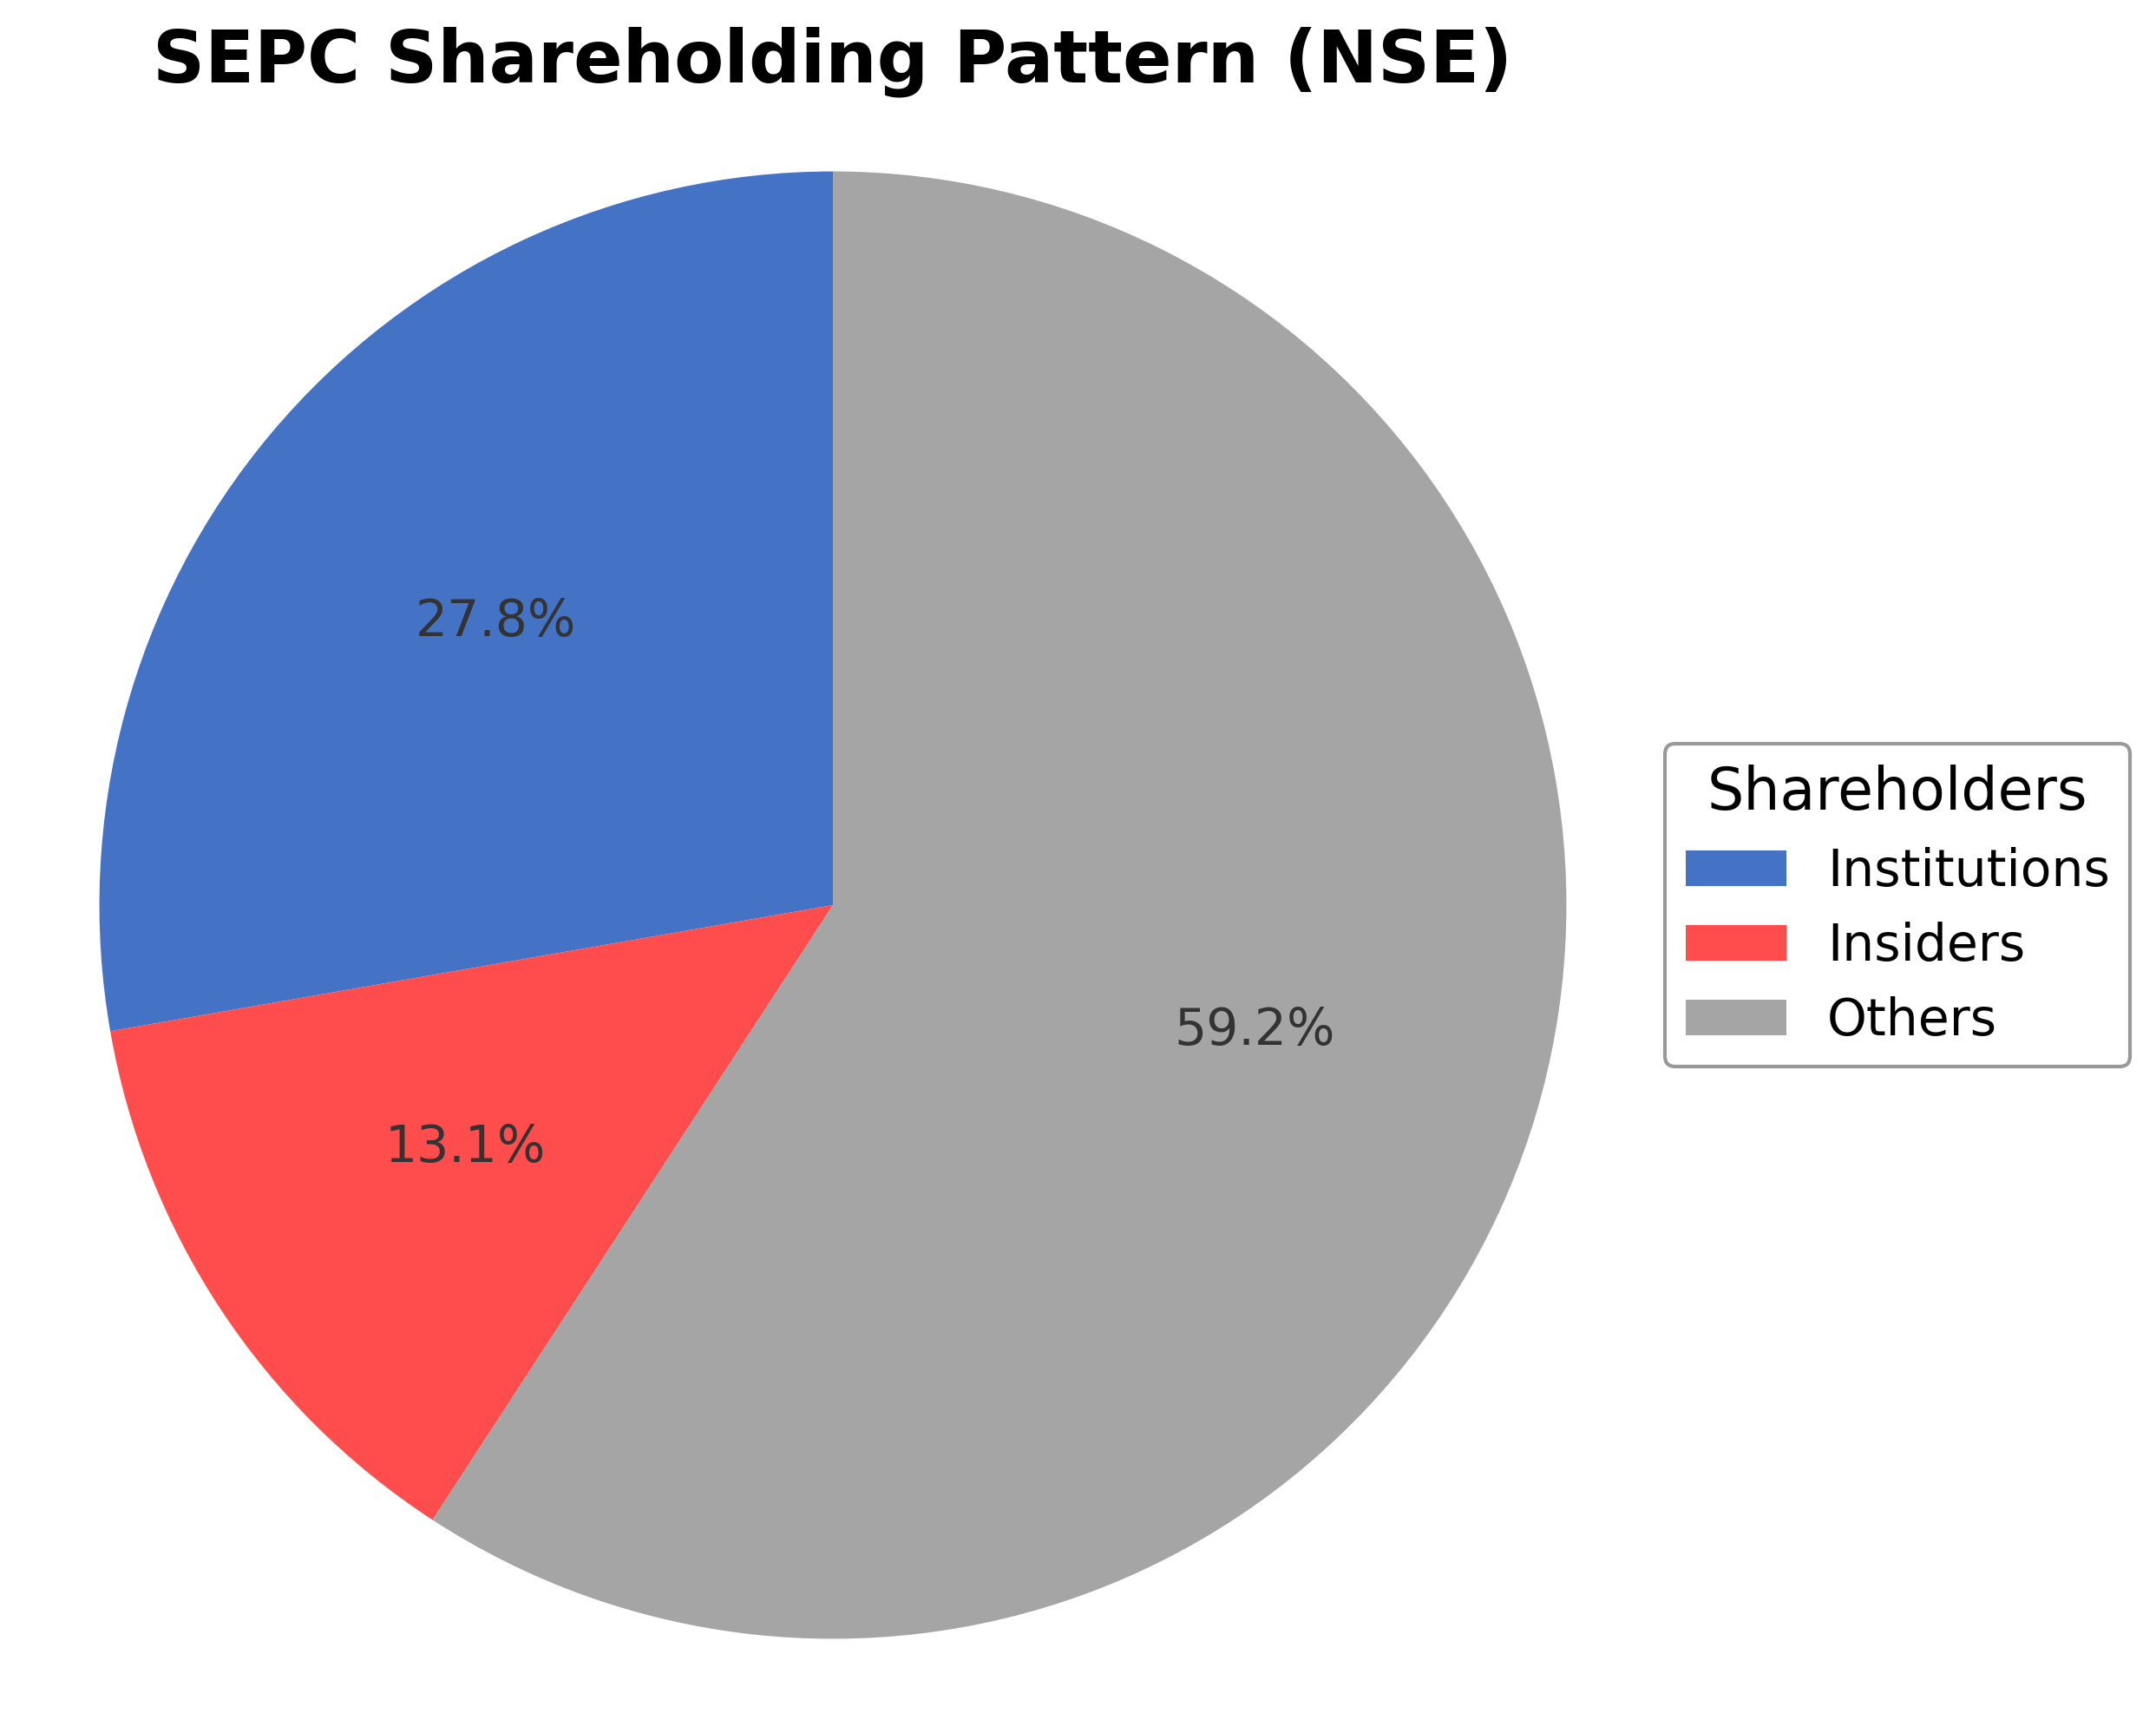
Sepc Ltd.'s ownership structure comprises approximately 13.06% held by insiders including executives and board members, 27.75% by institutional investors such as mutual funds and asset managers, and the remaining 59.19% by public shareholders including retail investors and employee stock plans. Over the past 12-24 months, institutional ownership has shown moderate activity with no significant large-scale accumulation or distribution reported. This shareholding pattern reflects a diversified investor base, suggesting balanced market sentiment and governance dynamics that may influence the company's strategic decisions and operational direction within the competitive engineering and construction sector.
Sector and Industry Analysis
Sepc Ltd. (SEPC) operates within the broader technology sector, a dynamic and rapidly evolving segment characterized by significant market size and robust growth prospects. The global technology sector encompasses sub-industries such as software, hardware, semiconductors, and IT services, with market valuations running into trillions of dollars. Growth trajectories remain strong, driven by digital transformation initiatives, cloud computing adoption, and increasing demand for automation and data analytics. Key players in this sector include multinational corporations like Microsoft, Apple, and Intel, alongside numerous specialized firms that drive innovation and competitive differentiation.
Within the technology sector, the specific industry segment relevant to SEPC is likely aligned with software or IT services, given the emphasis on valuation metrics such as EBIT and EBITDA yields for assessing company performance. Industry trends are heavily influenced by rapid technological shifts including artificial intelligence, machine learning, and edge computing. Consumer behavior is shifting towards cloud-based solutions, subscription models, and integrated platforms that offer scalability and flexibility. Emerging opportunities are abundant in cybersecurity, Internet of Things (IoT), and big data analytics, which are reshaping enterprise IT architectures and creating new revenue streams.
The regulatory landscape for the technology sector is complex and evolving, with significant implications for compliance and operational risk. Key regulations include data privacy laws such as GDPR in Europe and CCPA in California, which impose stringent requirements on data handling and user consent. Additionally, export controls and intellectual property protections are critical, especially for companies engaged in software development and hardware manufacturing. Policy impacts also arise from antitrust scrutiny and government initiatives promoting digital infrastructure, which can influence market access and competitive dynamics.
Competitive dynamics in the technology industry are characterized by high innovation intensity and rapid product life cycles, creating substantial barriers to entry related to capital investment, talent acquisition, and intellectual property development. Market structure tends to be oligopolistic at the top tier, with dominant firms leveraging scale and ecosystem integration, while numerous niche players compete on specialized capabilities and agility. Competitive positioning depends on technological differentiation, strategic partnerships, and the ability to adapt to shifting customer demands and regulatory requirements. Overall, the sector demands continuous innovation and strategic foresight to maintain and grow market share.
Note: Analysis synthesized from industry research, market reports, and regulatory filings. Information is subject to change based on market conditions.
Illustrative Scenario Analysis
DCF Assumptions:
Method: Two-Stage EPS-Priority Model
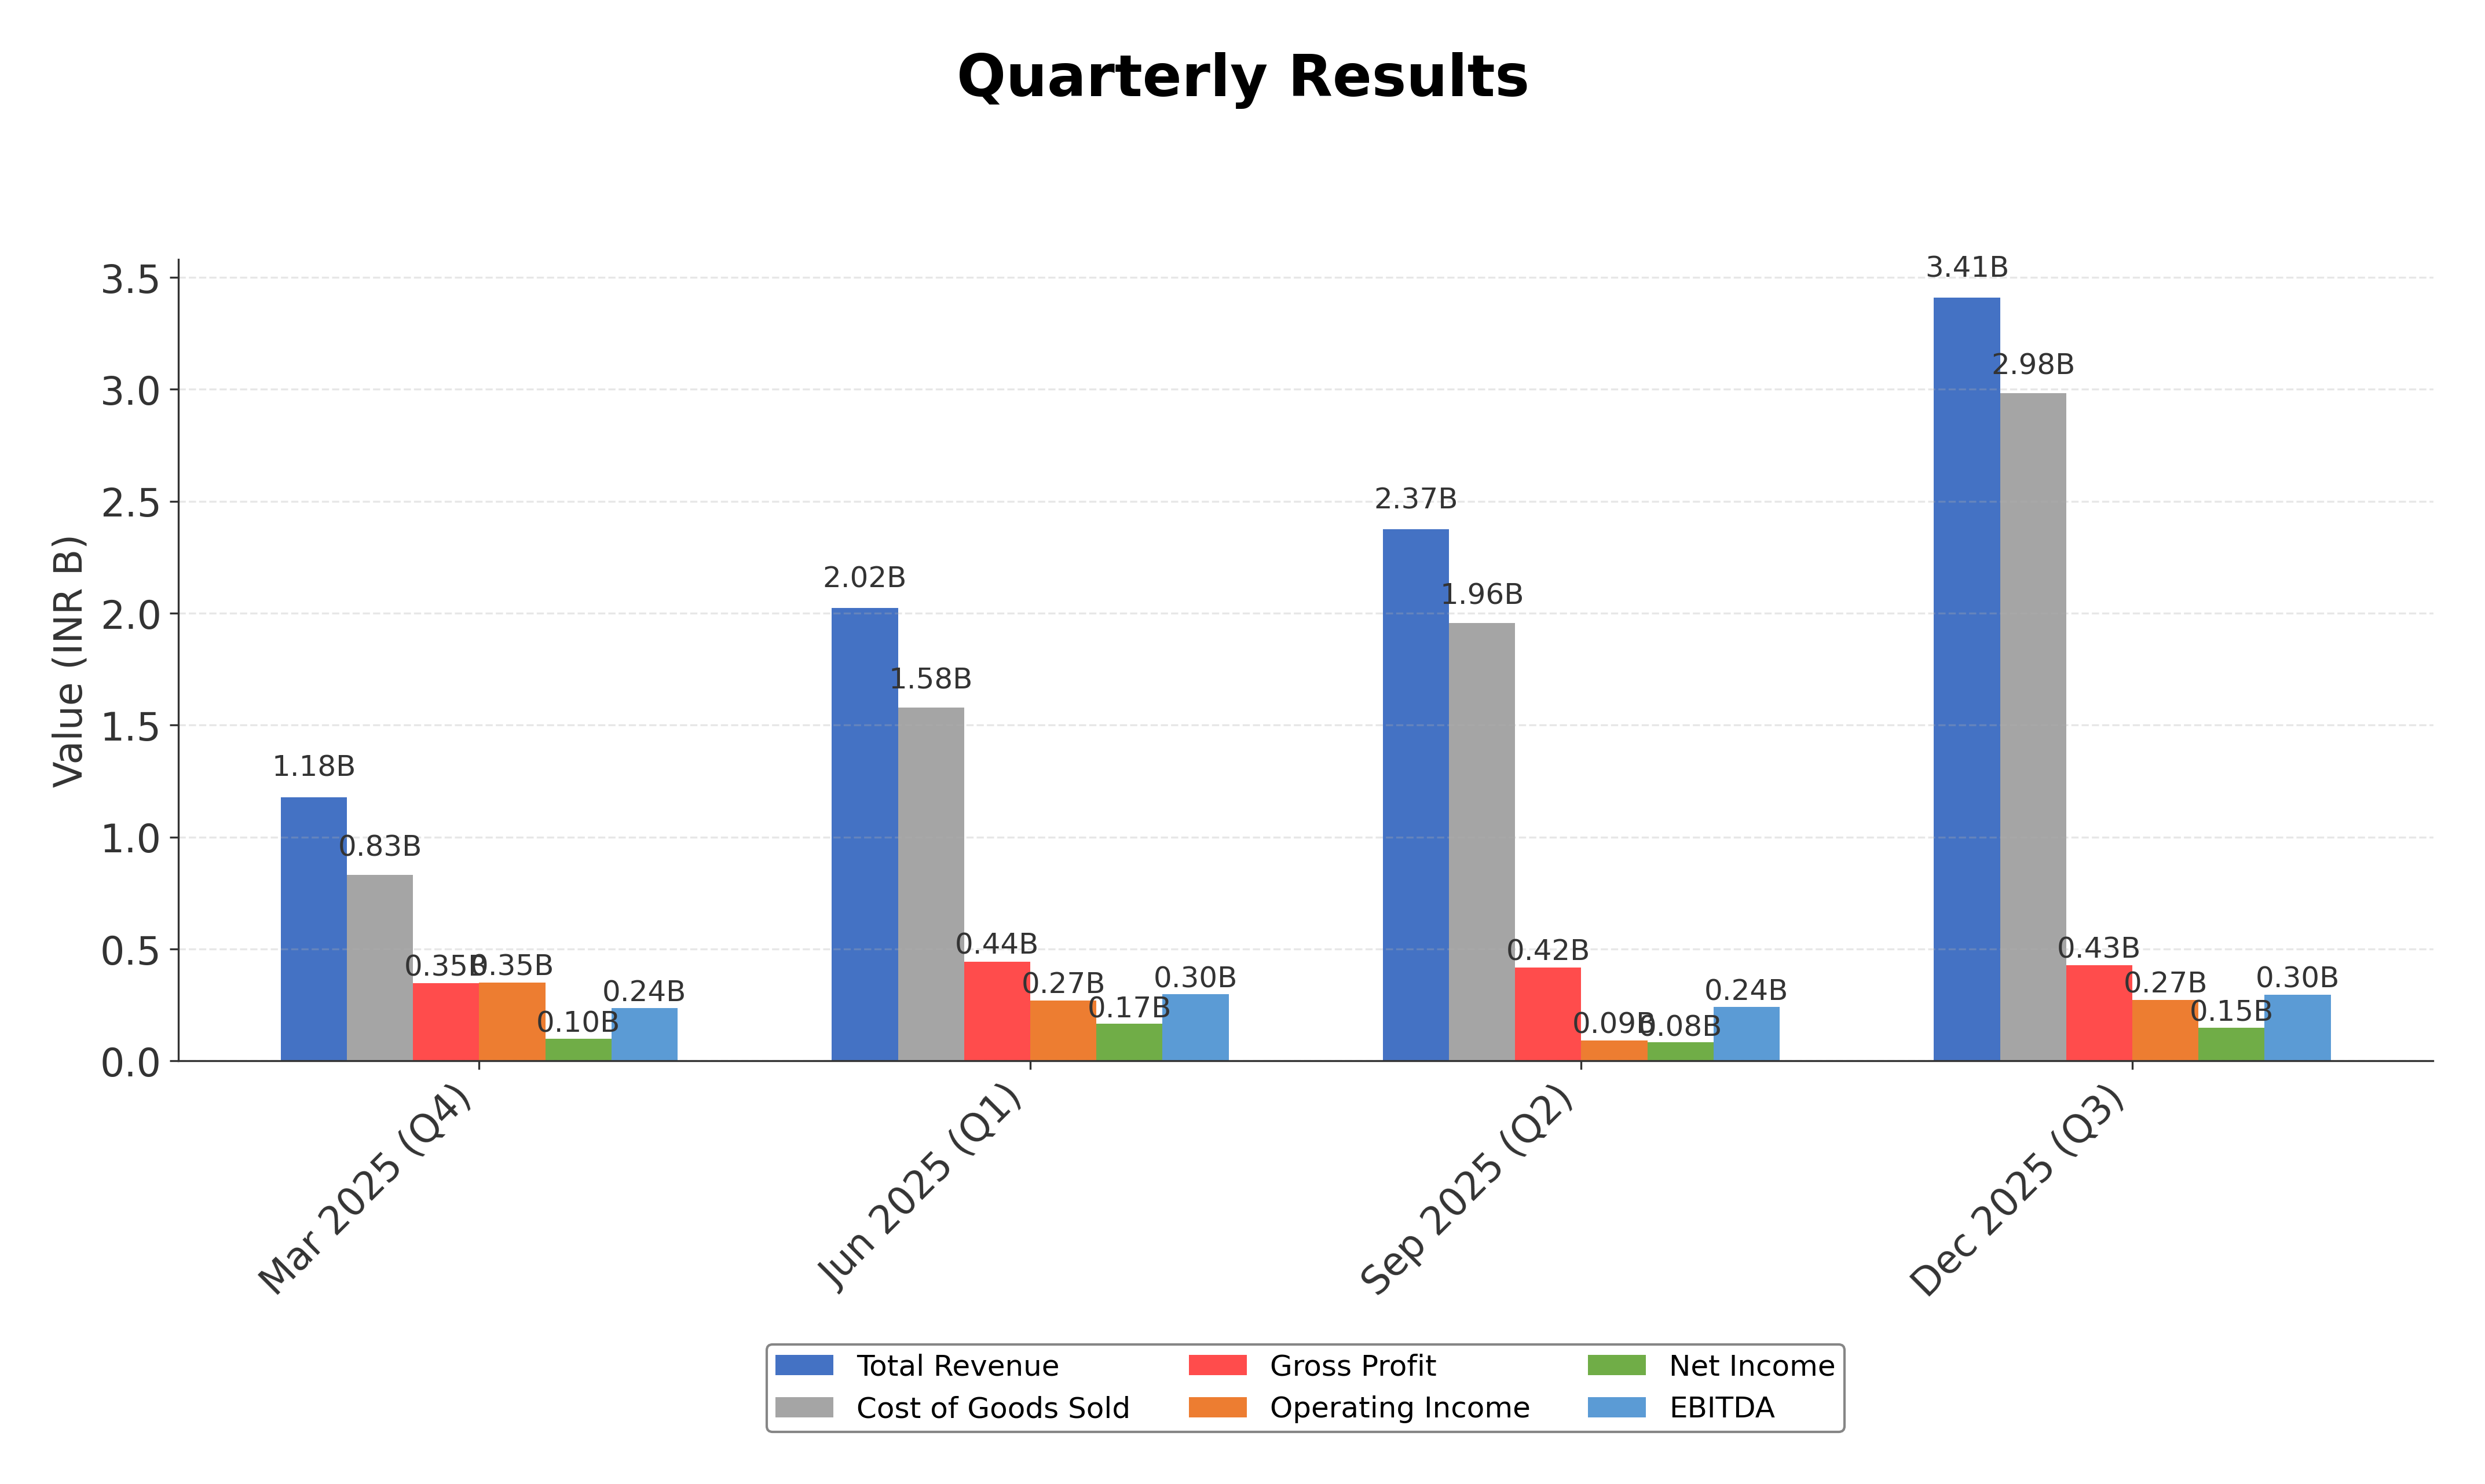
Financials
Peer Analysis
| Company Name | Market Cap | P/E Ratio | P/B Ratio | EV/EBITDA | Price to CFO |
|---|---|---|---|---|---|
| Sepc Ltd. | ₹13.64B | 26.0 | 0.77 | 17.19 | -5.14 |
| Rites Ltd. | ₹91.68B | 22.23 | 3.49 | 14.93 | 14.84 |
| Rail Vikas Nigam Ltd. | ₹543.63B | 47.39 | 5.71 | 61.35 | 24.42 |
| Kec International Ltd. | ₹140.95B | 20.4 | 2.5 | 11.24 | -8.88 |
| KNR Constructions Ltd. | ₹34.06B | 7.25 | 0.72 | 4.59 | -8.61 |
| Kalpataru Projects International Limited | ₹188.89B | 22.62 | 2.71 | 11.21 | -13.99 |
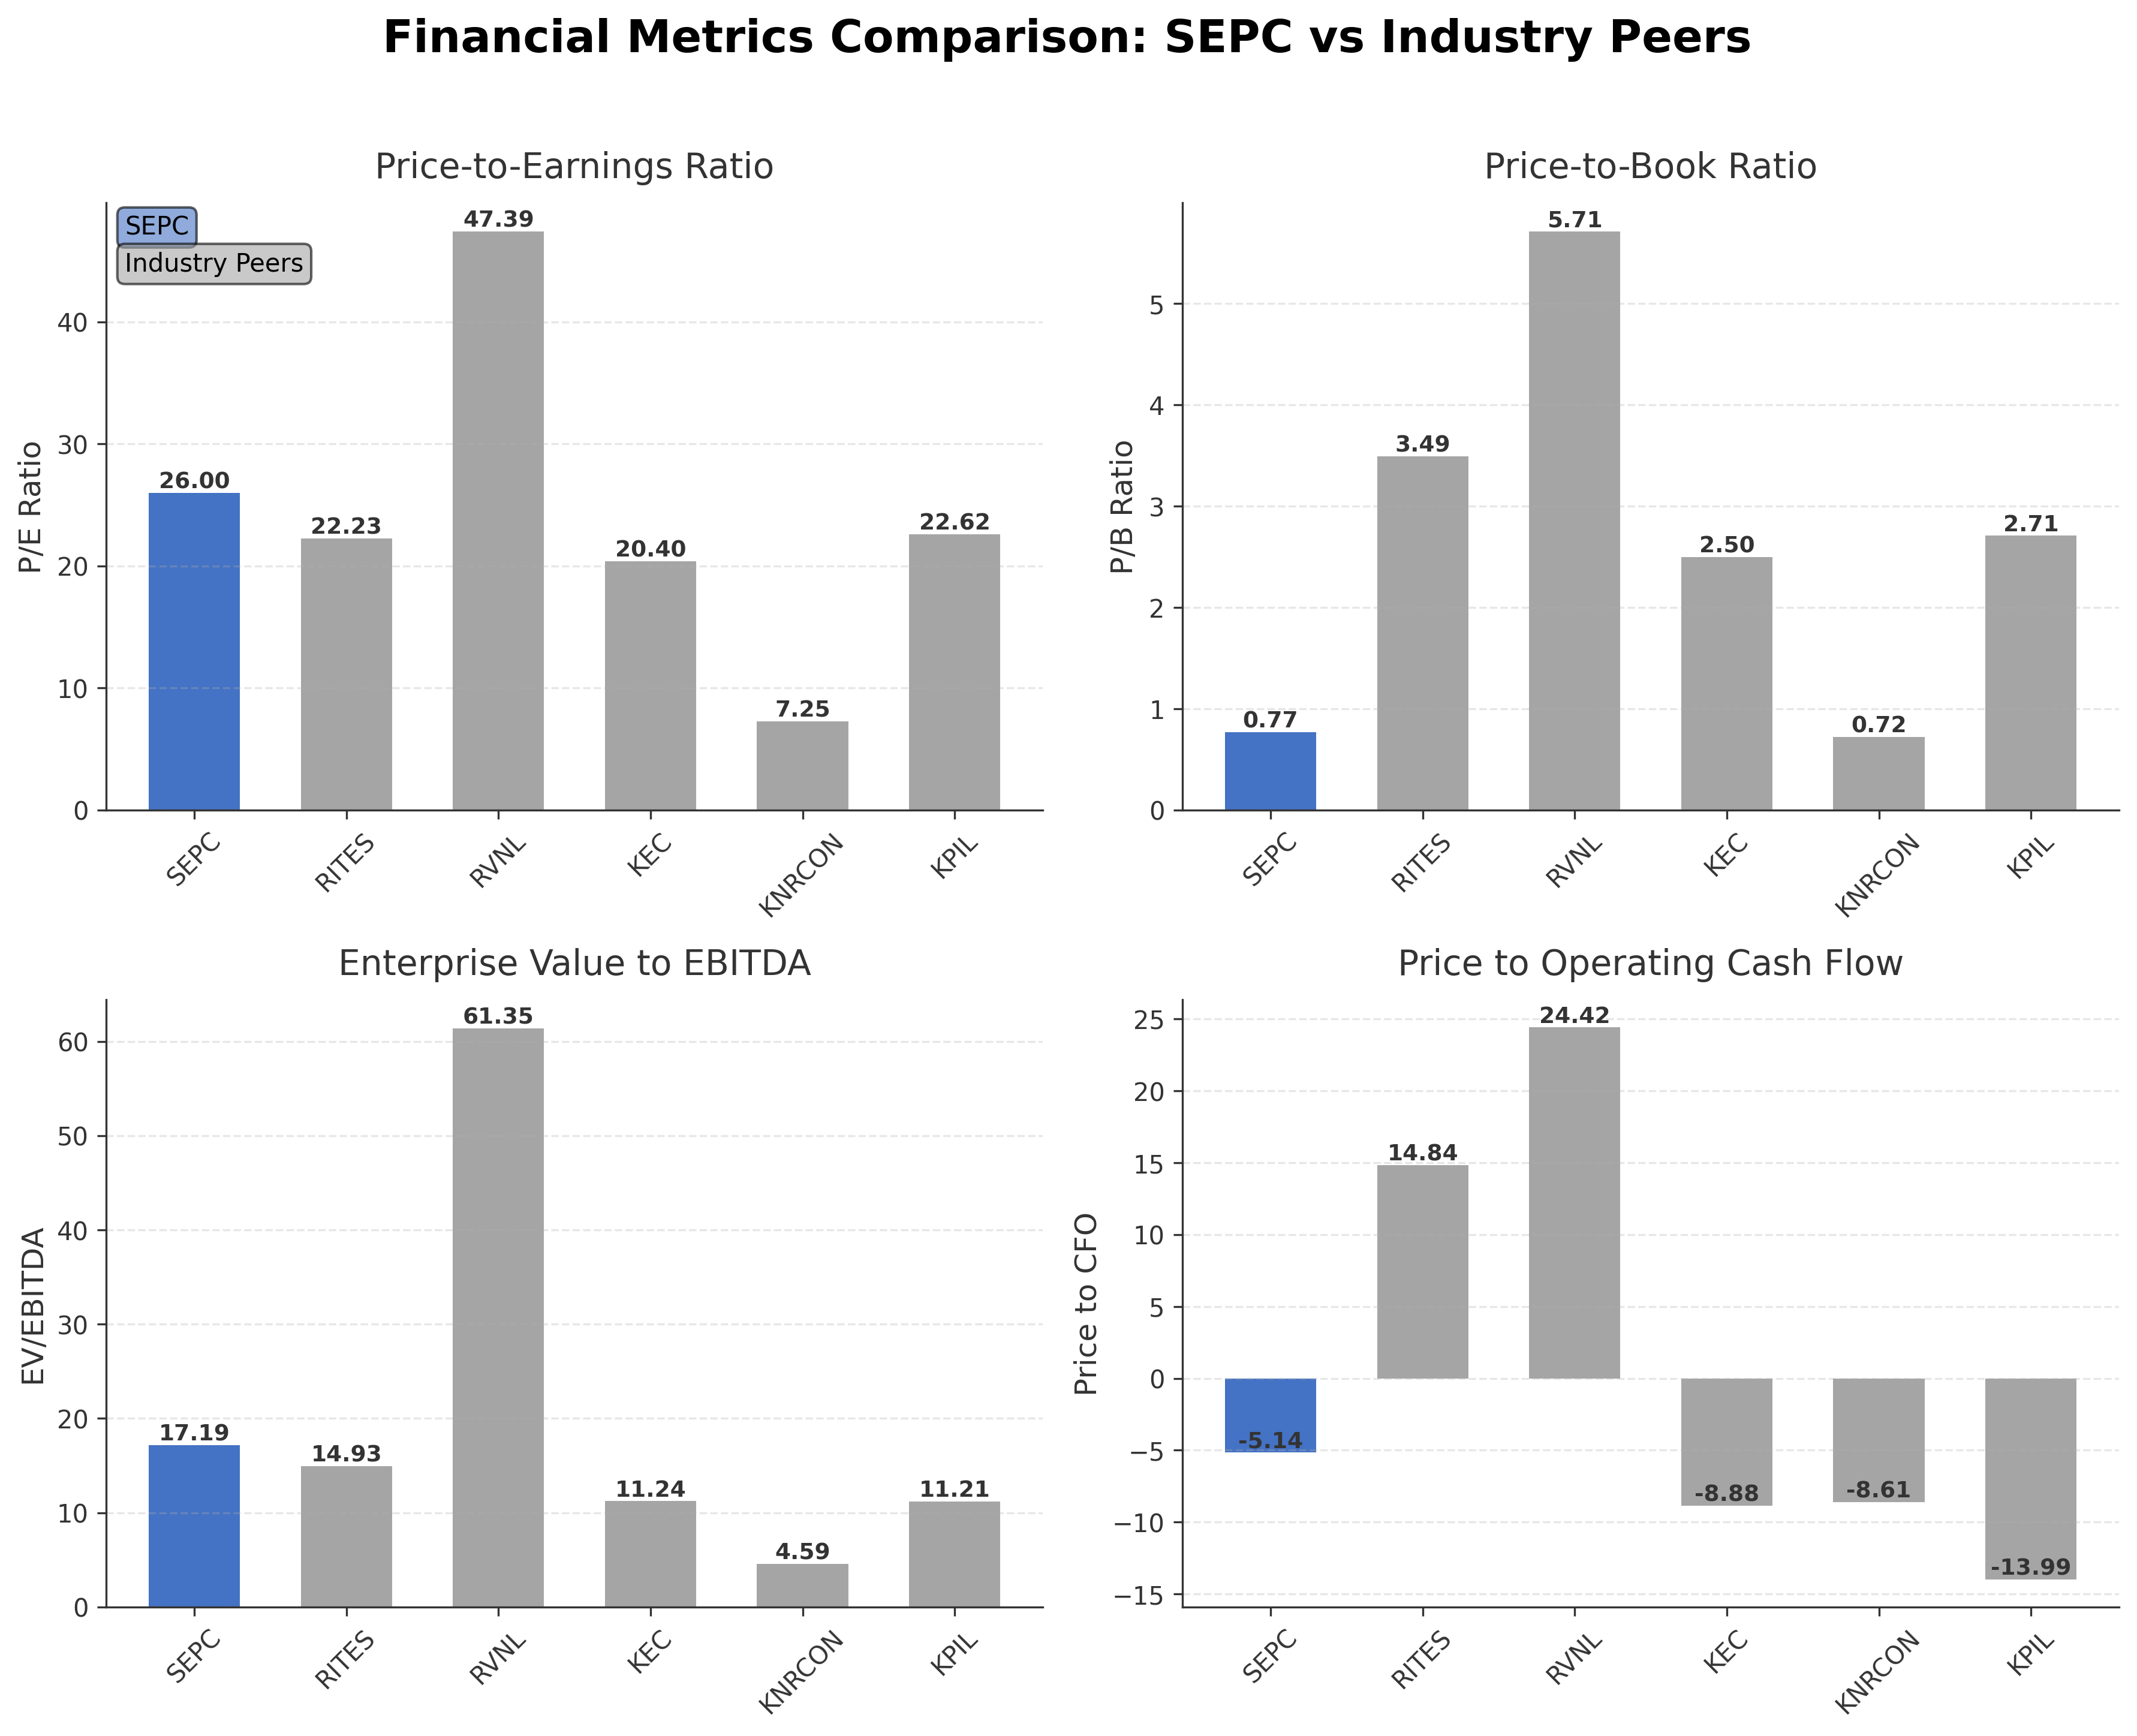
Comparison Analysis: Sepc Ltd. presents a smaller market capitalization and lower price-to-book ratio compared to its regional peers, indicating a more modest valuation relative to book value. Its trailing P/E ratio aligns closely with the industry average, though it is higher than some peers such as KNR Constructions Ltd. Sepc's EV/EBITDA ratio is elevated relative to many peers, suggesting higher enterprise valuation per earnings before interest, taxes, depreciation, and amortization. The company’s negative price-to-CFO ratio contrasts with positive values in several peers, highlighting operational cash flow challenges. Return on equity is notably lower than most peers, reflecting limited profitability relative to shareholder equity.
Financial Metrics Comparison with Peers
Financial Statements
Comprehensive financial data including income, balance sheet, and cash flow metrics
Income Statement
| fiscal_date | 2025-03-31 | 2024-03-31 | 2023-03-31 | 2022-03-31 | 2021-03-31 |
|---|---|---|---|---|---|
| Sales | 5.98B | 5.61B | 3.79B | 3.29B | 5.80B |
| Cost Of Goods | 4.73B | 4.67B | 3.19B | 2.93B | 5.57B |
| Gross Profit | 1.25B | 942.65M | 597.96M | 369.37M | 224.40M |
| Operating Expense Selling General And Administrative | 132.81M | 108.06M | 82.48M | 77.55M | 107.17M |
| Operating Expense Other Operating Expenses | 66.89M | 167.94M | 731.80M | 899.26M | 447.72M |
| Operating Income | 665.79M | 283.02M | -619.87M | -1.05B | -779.62M |
| Non Operating Interest Income | 28.34M | 20.23M | 31.27M | 59.69M | 163.81M |
| Non Operating Interest Expense | 447.78M | 443.86M | 603.98M | 1.16B | 1.07B |
| Pretax Income | 351.80M | 227.84M | 253.16M | -2.21B | -1.78B |
| Income Tax | 103.39M | 0.00 | 302.19M | 427.80M | 12.22M |
| Net Income | 248.40M | 227.84M | -49.04M | -2.64B | -1.79B |
| Eps Basic | 0.15 | 0.16 | -0.04 | -2.59 | -0.18 |
| Eps Diluted | 0.15 | 0.16 | -0.04 | -2.59 | -0.18 |
| Basic Shares Outstanding | 1.62B | 1.43B | 1.27B | 1.02B | 10.22B |
| Diluted Shares Outstanding | 1.62B | 1.43B | 1.27B | 1.02B | 10.22B |
| Ebit | 799.58M | 671.69M | 857.13M | -1.05B | -716.62M |
| Ebitda | 989.38M | 724.49M | -429.12M | -973.88M | -660.84M |
| Net Income Continuous Operations | 351.80M | 227.84M | 253.16M | -2.21B | -1.78B |
| Preferred Stock Dividends | 0.00 | 0.00 | 0.00 | 0.00 | 0.00 |
Data provided by Twelve Data
Balance Sheet
| fiscal_date | 2025-03-31 | 2024-03-31 | 2023-03-31 | 2022-03-31 | 2021-03-31 |
|---|---|---|---|---|---|
| Cash And Cash Equivalents | 73.46M | 161.54M | 238.66M | 50.69M | 30.00M |
| Accounts Receivable | 3.68B | 3.00B | 2.92B | 3.73B | 4.02B |
| Total Assets | 23.87B | 22.09B | 20.02B | 22.23B | 24.16B |
| Total Liabilities | 8.79B | 9.97B | 9.14B | 14.84B | 14.11B |
| Long Term Debt | 2.64B | 3.00B | 2.69B | 1.56B | 2.01B |
| Shareholders Equity | 15.08B | 12.12B | 10.88B | 7.39B | 10.05B |
Data provided by Twelve Data
Cash Flow Statement
| fiscal_date | 2025-03-31 | 2024-03-31 | 2023-03-31 | 2022-03-31 | 2021-03-31 |
|---|---|---|---|---|---|
| Operating Activities Net Income | 351.80M | 227.84M | 253.16M | -2.21B | -1.78B |
| Operating Activities Other Non Cash Items | 202.07M | 12.89M | 420.19M | 1.14B | 1.03B |
| Operating Activities Accounts Receivable | -2.44B | -2.41B | -388.26M | 263.37M | 1.13B |
| Operating Activities Other Assets Liabilities | -767.97M | 1.21B | -200.86M | -628.16M | -392.40M |
| Operating Activities Operating Cash Flow | -2.65B | -961.38M | 84.22M | -1.43B | -10.28M |
| Investing Activities Capital Expenditures | -1.23M | -72.00K | 27.82M | 339.00K | -2.95M |
| Investing Activities Investing Cash Flow | -1.23M | -72.00K | 27.82M | -47.60M | 198.90M |
| Financing Activities Long Term Debt Issuance | 32.52M | 400.00M | 1.65B | 0.00 | N/A |
| Financing Activities Long Term Debt Payments | -629.84M | -42.45M | -4.82B | 0.00 | -54.99M |
| Financing Activities Short Term Debt Issuance | -598.82M | 140.71M | 35.92M | 687.53M | 1.36B |
| Financing Activities Common Stock Issuance | 2.00B | 998.00M | 3.50B | 0.00 | N/A |
| Financing Activities Financing Cash Flow | 803.86M | 1.50B | 360.00M | 687.53M | 1.31B |
| End Cash Position | 73.46M | 183.50M | 330.70M | 58.27M | 84.09M |
| Free Cash Flow | -1.33B | -1.21B | 207.66M | -720.05M | -562.07M |
| Investing Activities Other Investing Activity | N/A | N/A | -1.00K | -47.94M | 201.85M |
| Financing Activities Other Financing Charges | N/A | N/A | N/A | 3.00K | 1.00K |
Data provided by Twelve Data
Technical Analysis
Key Insights
- The current trend for Sepc Ltd. shows a bearish momentum with the stock price trading below the 200-day moving average of ₹10.07, indicating longer-term downward pressure.
- Key support levels are observed near the 52-week low of ₹4.65, while resistance is noted around the 50-day moving average at ₹7.07 and the 200-day moving average at ₹10.07.
- The stock price is currently below the 10-day, 50-day, and 200-day moving averages, suggesting weak short to long-term momentum.
- Momentum indicators such as RSI, MACD, and Stochastic are consistent with bearish signals, reflecting subdued buying interest and potential oversold conditions.
- Multi-timeframe analysis across daily, weekly, and monthly charts confirms a prevailing downtrend with occasional volume surges indicating intermittent trading interest.
- Potential market scenarios include continued consolidation near support levels or a possible rebound if volume sustains, though prevailing technicals favor cautious observation.
Trending News
1. Headline: La UAB borra el histórico mural de la izquierda independentista
Summary: El rectorado justifica la retirada de la pintada porque las cautelares son firmes
Sentiment: neutral
2. Headline: SEPC Ltd Sees Exceptional Volume Surge Amid Construction Sector Outperformance
Summary: SEPC Ltd, a small-cap player in the construction sector, has witnessed a remarkable surge in trading volume, emerging as one of the most actively traded stocks by volume on 6 April 2026. The stock outperformed its sector and broader market indices, signalling renewed investor interest despite ...
Sentiment: positive
3. Headline: Southeast Produce Council's STEP-UPP Foodservice Class Gains Invaluable Insights During Spring Tour - Perishable News
Summary: The program is specifically designed to provide rising leaders in the retail and foodservice sectors with a 360-degree view of the industry through a blend of strategic leadership development and hands-on, field-based training.
Sentiment: positive
4. Headline: SEPC Ltd Sees Exceptional Volume Surge Amid Mixed Market Sentiment
Summary: SEPC Ltd, a small-cap player in the construction sector, emerged as one of the most actively traded stocks on 2 April 2026, registering a remarkable volume surge that outpaced its sector and benchmark indices despite a modest price decline. This heightened activity reflects a complex interplay ...
Sentiment: positive
Summary: GTL Infrastructure, SEPC, Unitech, Confidence Petroleum India, Ashok Leyland, Amir Chand Jagdish Kumar (Exports), and HDFC Bank were also among the most traded stocks on the NSE. Also Read | How long can Nifty 50 stay in bull trend as US-Iran war de-escalates? Vodafone Idea: More than 37 crore shares changed hands as the stock fell 6% during the session amid the stock market crash. According to a Mint report, Vodafone Idea and Bharat Sanchar Nigam Ltd ...
Sentiment: negative
6. Headline: SEPC STEP-UPP tours 4 major Florida supply chain sites - FreshFruitPortal.com
Summary: The Southeast Produce Council (SEPC) brought its 2026 STEP-UPP Foodservice class to Florida in mid-March for a multi-day tour, the entity shared.
Sentiment: neutral
Summary: SEPC Limited has announced that its Board of Directors has approved the acquisition of a 90 percent equity stake in Avenir International Engineers and Consultants LLC. The transaction represents a strategic move to expand SEPC’s global footprint and strengthen its presence in the oil and ...
Sentiment: positive
8. Headline: SEPC Ltd Surges 9.98% to Day's High — Outperforms Sector by 7.13 Percentage Points
Summary: The Sensex advanced 1.24% on 25 Mar 2026, yet SEPC Ltd surged 9.98%, outperforming its construction sector peers by over 7 percentage points. This sharp single-session gain stands out amid a broader market rally led by mega caps, signalling a stock-specific move rather than a general market lift.
Sentiment: positive
9. Headline: Mark AB Capital-backed SEPC to acquire Abu Dhabi engineering firm
Summary: SEPC Ltd, an Indian engineering, procurement, and construction company backed by the UAE-based investment firm Mark AB Capital, has agreed to buy a...
Sentiment: positive
10. Headline: SEPC Ltd Sees Exceptional Volume Amid Sharp Price Decline and Negative Momentum
Summary: SEPC Ltd, a small-cap player in the construction sector, witnessed one of the highest trading volumes on 16 Mar 2026, with over 2.52 crore shares changing hands. Despite this surge in activity, the stock continued its downward trajectory, hitting a fresh 52-week low of ₹4.90 and underperforming ...
Sentiment: negative
Powered by Brave
Recent Updates
News Summary
Recent news highlights a significant surge in trading volume for Sepc Ltd., coinciding with a rally in the construction sector, reflecting renewed market interest and sector outperformance. The company has approved a strategic acquisition of a 90% stake in Abu Dhabi-based Avenir International, signaling expansion into international markets and strengthening its presence in oil and gas infrastructure. Leadership developments include the appointment of Dr. Ashutosh Karnatak as an independent director, enhancing governance. Historical price data remains neutral, providing context for recent volatility. These developments collectively indicate active corporate strategies aimed at growth and market positioning amid evolving industry conditions.
News Sentiment
Sentiment across recent updates is predominantly positive, driven by strategic acquisitions and volume surges, with neutral tones surrounding leadership appointments and historical data. Negative sentiment is limited, primarily related to price declines amid high trading volumes, suggesting mixed market reactions. Overall, the sentiment reflects cautious optimism with recognition of operational challenges and growth initiatives.
Analytical Overview
Analysis Summary
Valuation Metrics: Sepc Ltd.'s trailing P/E ratio of 26.00 aligns with the industry average, while the price-to-book ratio of 0.77 suggests the stock is valued below its book value, indicating potential undervaluation relative to assets.
Growth Trajectory: Revenue growth is modest at 1.56% quarterly, with positive quarterly earnings growth of 2.37%, though operating cash flow remains negative, highlighting challenges in converting revenue into cash.
Financial Health: The company maintains a strong current ratio of 2.92, indicating liquidity strength, but a high debt-to-equity ratio of 19.36 signals significant leverage that may affect financial flexibility.
Sector Specific Factors: The engineering and construction sector in India faces regulatory complexities and competitive pressures, but also benefits from government infrastructure initiatives and growing demand for sustainable projects.
Market Positioning: Sepc Ltd. leverages its engineering expertise and recent strategic acquisitions to enhance competitive positioning, though operational cash flow challenges and low returns on equity warrant attention.
Overall Business and Market Assessment
Supporting Factors: Alignment of valuation metrics with industry averages suggests fair market pricing.
Risk Factors: Negative operating cash flow raises concerns about cash generation efficiency.
SWOT Analysis
Strengths
- Strong current ratio of 2.92 indicating good liquidity.
- Diverse project portfolio across multiple infrastructure sectors.
- Strategic acquisition enhances global presence and market reach.
- Experienced management with recent leadership appointments.
Weaknesses
- Negative operating cash flow impacting financial flexibility.
- High debt-to-equity ratio of 19.36 indicating significant leverage.
- Low return on equity at 0.02% reflecting limited profitability.
- Price-to-CFO ratio is negative, signaling cash flow challenges.
Opportunities
- Growing infrastructure demand in India supported by government initiatives.
- Expansion into Middle East markets via acquisition of Avenir International.
- Potential for technological innovation to improve project efficiency.
- Increasing focus on sustainable and green infrastructure projects.
Threats
- Regulatory complexities and policy changes in the construction sector.
- Intense competition from larger and more diversified peers.
- Volatility in raw material prices affecting project costs.
- Economic fluctuations impacting infrastructure investment cycles.
Company Description
SEPC Ltd. is an innovative engineering and construction company that specializes in delivering large-scale infrastructure projects around the globe. The company's primary function is to provide comprehensive engineering solutions across various sectors, including energy, water, metal, and transportation infrastructures. SEPC Ltd. is renowned for its expertise in handling complex projects, from conceptual design to commissioning, ensuring each project meets rigorous quality and safety standards. SEPC Ltd. makes a significant impact in both emerging and mature markets by helping to develop essential infrastructure. This includes power plants, water treatment facilities, and oil and gas pipelines, facilitating economic growth and enhancing living standards. The company's distinctive approach involves leveraging advanced technology, sustainable practices, and innovative project management techniques to deliver optimum results. Operating in a highly competitive industry, SEPC Ltd. plays a crucial role in addressing the growing global demand for efficient and sustainable infrastructure solutions. Its contributions are vital for national growth initiatives and often align with broader governmental and international developmental goals. The company's commitment to excellence and adaptability in a dynamic market environment underscores its market significance and long-standing industry presence.