


Sandhar Technologies Ltd (SANDHAR)
Stock Analysis Report
Stock Journey
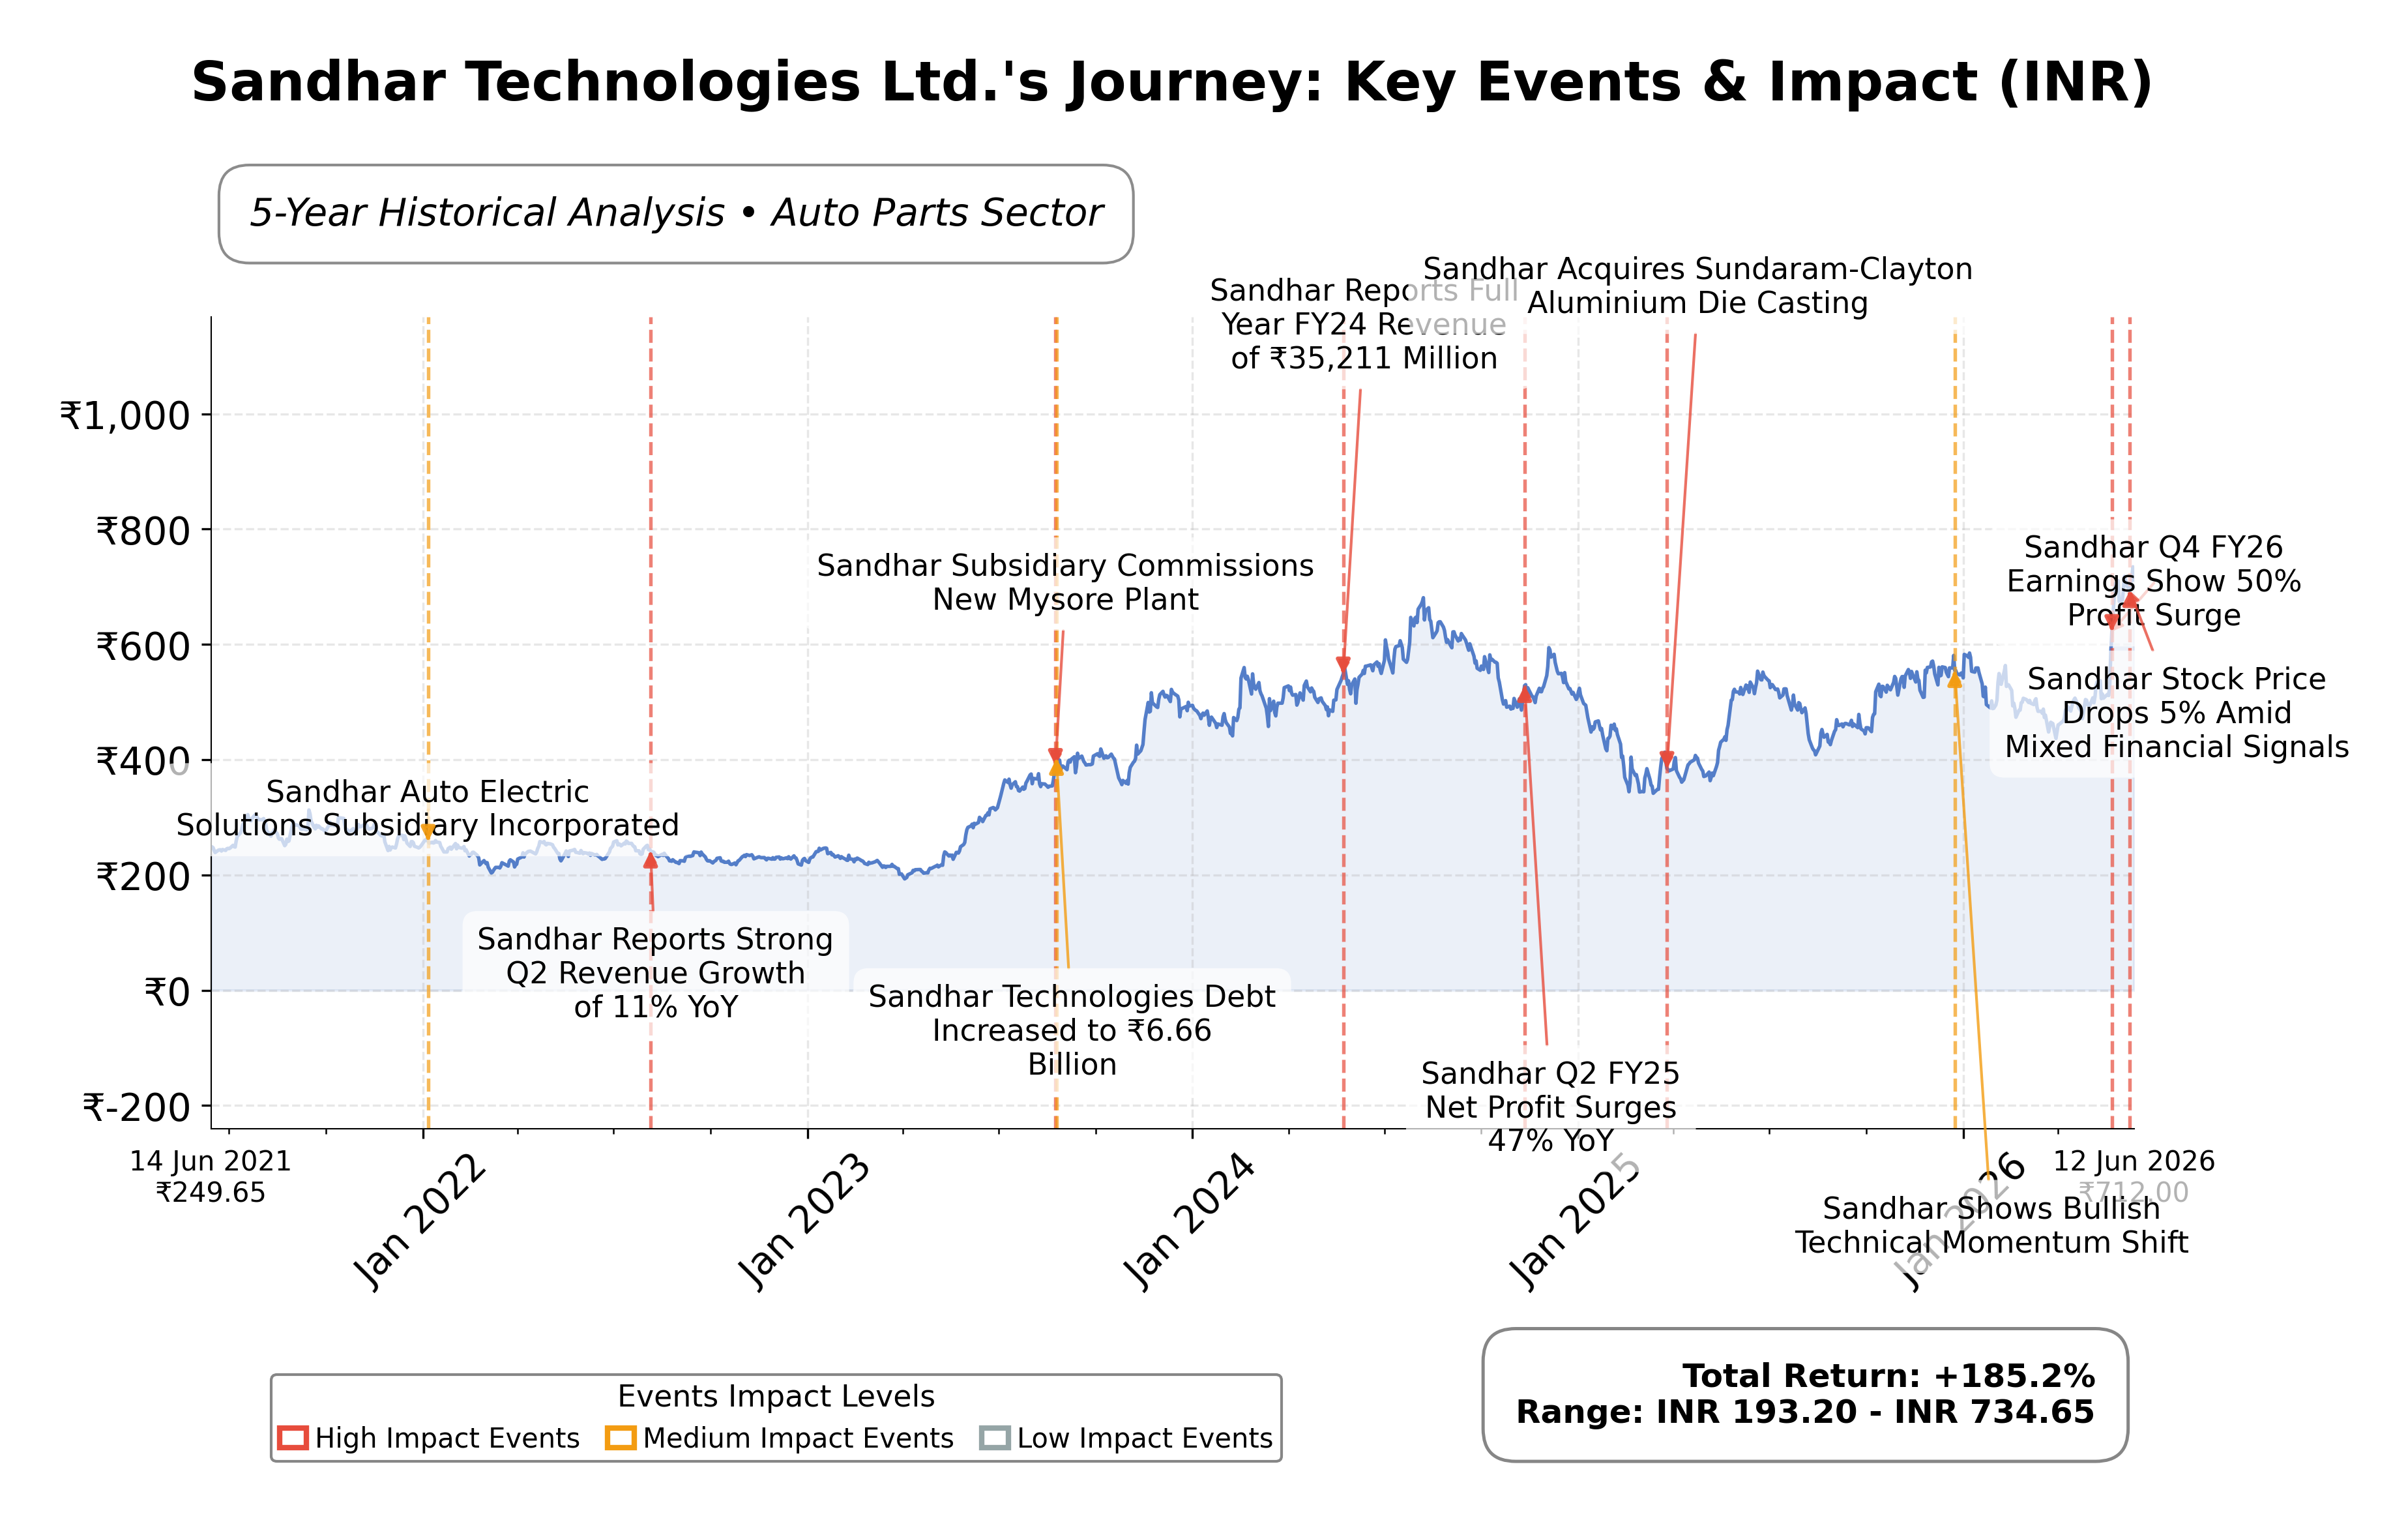
Key Positives and Key Risks
Pros
- Strong revenue growth with a quarterly increase of 28.9% and year-over-year earnings growth of 49.8%, indicating robust operational performance.
- Competitive valuation metrics with a trailing P/E of 22.28 and forward P/E of 17.02, lower than many industry peers.
- Reaffirmed strong credit profile by India Ratings, supporting financial stability and borrowing capacity.
Cons
- High debt-to-equity ratio of 86.08% raises concerns about leverage and financial risk.
- Negative free cash flow of INR -1.42 billion reflects investment pressures and potential liquidity constraints.
- Current ratio below 1 at 0.944 indicates limited short-term liquidity, which may affect operational flexibility.
Disclosure: This information is for general awareness and does not constitute investment advice
Report Summary
Sandhar Technologies Ltd. is a prominent Indian automotive components manufacturer specializing in safety and security systems for vehicles, including lock assemblies, mirrors, and handles. Operating primarily in the Consumer Cyclical sector on the NSE, the company serves a diverse range of automotive segments such as passenger vehicles, commercial vehicles, and two-wheelers. With a focus on innovation and research and development, Sandhar maintains a significant presence in both domestic and international markets, supporting major automotive manufacturers globally.
Financially, Sandhar reported trailing twelve months (TTM) revenue of approximately INR 48.52 billion, with a gross margin of 36.11%, operating margin of 6.04%, and a net profit margin of 4.09%. The return on equity (ROE) stands at 16.07%, and return on assets (ROA) at 4.87%, indicating moderate profitability and efficient asset utilization. The company’s operating cash flow was INR 2.10 billion TTM, though free cash flow was negative at INR -1.42 billion, reflecting investments and working capital dynamics.
Valuation metrics show a trailing P/E ratio of 22.28 and a forward P/E of 17.02, with a price-to-book ratio of 3.32 and an EV/EBITDA multiple of 12.61. The current stock price is INR 712, trading near its 52-week high of INR 763.20 and well above the 52-week low of INR 405.20, reflecting strong market performance. The market capitalization is approximately INR 42.96 billion, positioning Sandhar as a mid-cap player within the automotive parts industry.
Key strengths include a solid market position with a diversified product portfolio, a strong credit profile reaffirmed by rating agencies, and ongoing strategic initiatives targeting INR 10,000 crores revenue with 15% growth. Risks involve margin pressures from new project ramp-ups, overseas operational challenges, and a relatively high debt-to-equity ratio of 86.08%. Recent leadership changes and participation in investor conferences indicate active governance and communication with stakeholders.
Technically, the stock has shown strong momentum, reaching new all-time highs with positive multi-timeframe trends and supportive moving averages. Market sentiment appears constructive, supported by recent news of growth targets and credit reaffirmations. Overall, the data suggests a cautious yet optimistic environment for monitoring the stock’s performance and strategic developments.
Company and Industry Overview
Company Basics
Price Performance
Company Size
Shareholding Pattern
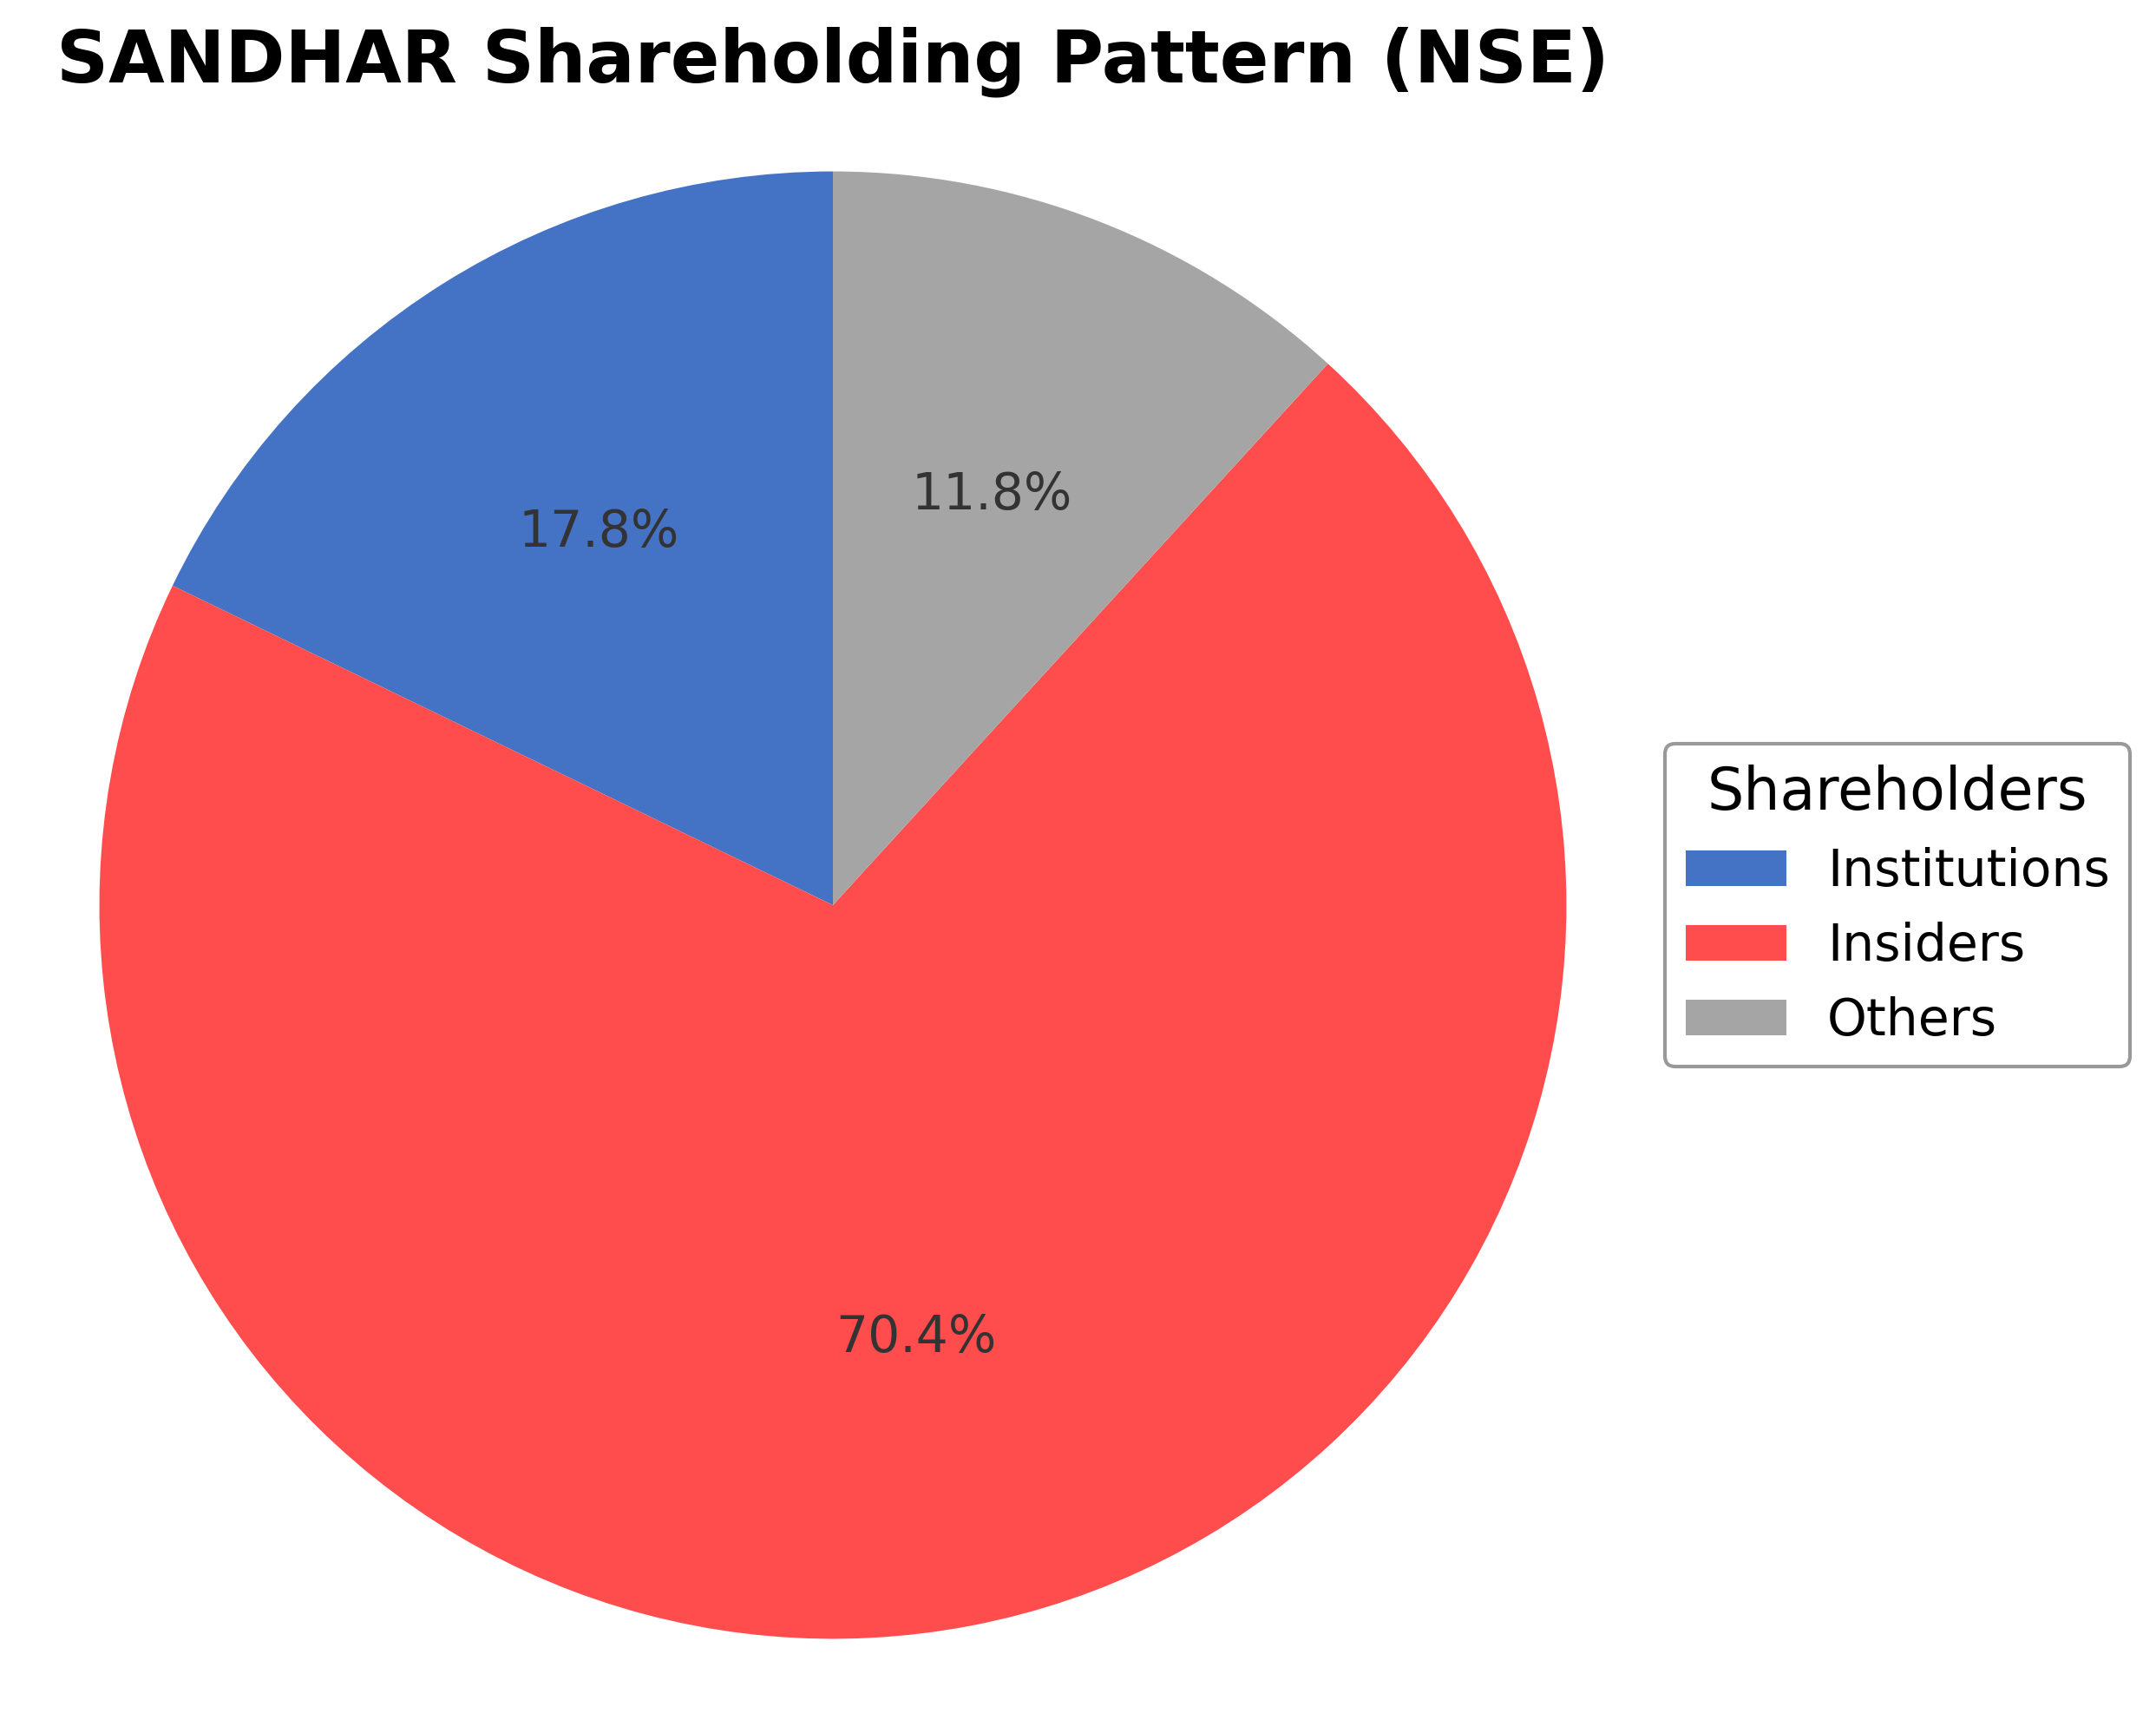
Sandhar Technologies Ltd.'s ownership structure is dominated by insiders, including executives and board members, holding approximately 70.38% of shares, reflecting strong promoter control. Institutional investors, such as mutual funds and pension funds, hold 17.83%, indicating moderate institutional interest and confidence. The remaining 11.79% is held by public shareholders, including retail investors and employee stock plans. Over the past 12-24 months, there has been stable promoter holding with gradual institutional accumulation, suggesting positive market sentiment towards the company. This ownership pattern supports robust governance and strategic continuity, positioning Sandhar well for future corporate initiatives and expansion within the automotive parts industry.
Sector and Industry Analysis
The automotive components sector in India is a significant contributor to the country's manufacturing output, with a market size estimated to be over $50 billion and expected to grow at a CAGR of around 10% over the next five years. This growth is driven by rising vehicle production, increasing demand for electric vehicles, and expanding export opportunities. Key players in this sector include established firms like Sandhar Technologies, Motherson Sumi, and Bharat Forge, which cater primarily to OEMs with a diverse product portfolio.
Industry trends highlight a shift towards advanced automotive technologies such as electric mobility components, lightweight materials, and smart safety systems. The competitive landscape is marked by intense rivalry among domestic and international suppliers, with barriers to entry including high capital investment, stringent quality standards, and the need for technological innovation. Companies like Sandhar Technologies leverage integrated manufacturing capabilities and product diversification to maintain their market position amid evolving customer demands.
The regulatory environment for automotive components in India is shaped by government policies promoting electric vehicles, safety norms, and emission standards such as BS-VI. Compliance with these regulations necessitates continuous product development and quality enhancements, impacting cost structures and operational strategies. Additionally, initiatives like the Automotive Mission Plan and Make in India support sector growth by encouraging domestic manufacturing and exports, creating a favorable outlook for component suppliers.
Note: Analysis synthesized from industry research, market reports, and regulatory filings. Information is subject to change based on market conditions.
Financial Ratios Dashboard
Illustrative Scenario Analysis
DCF Assumptions:
Method: Two-Stage EPS-Priority Model
Financials
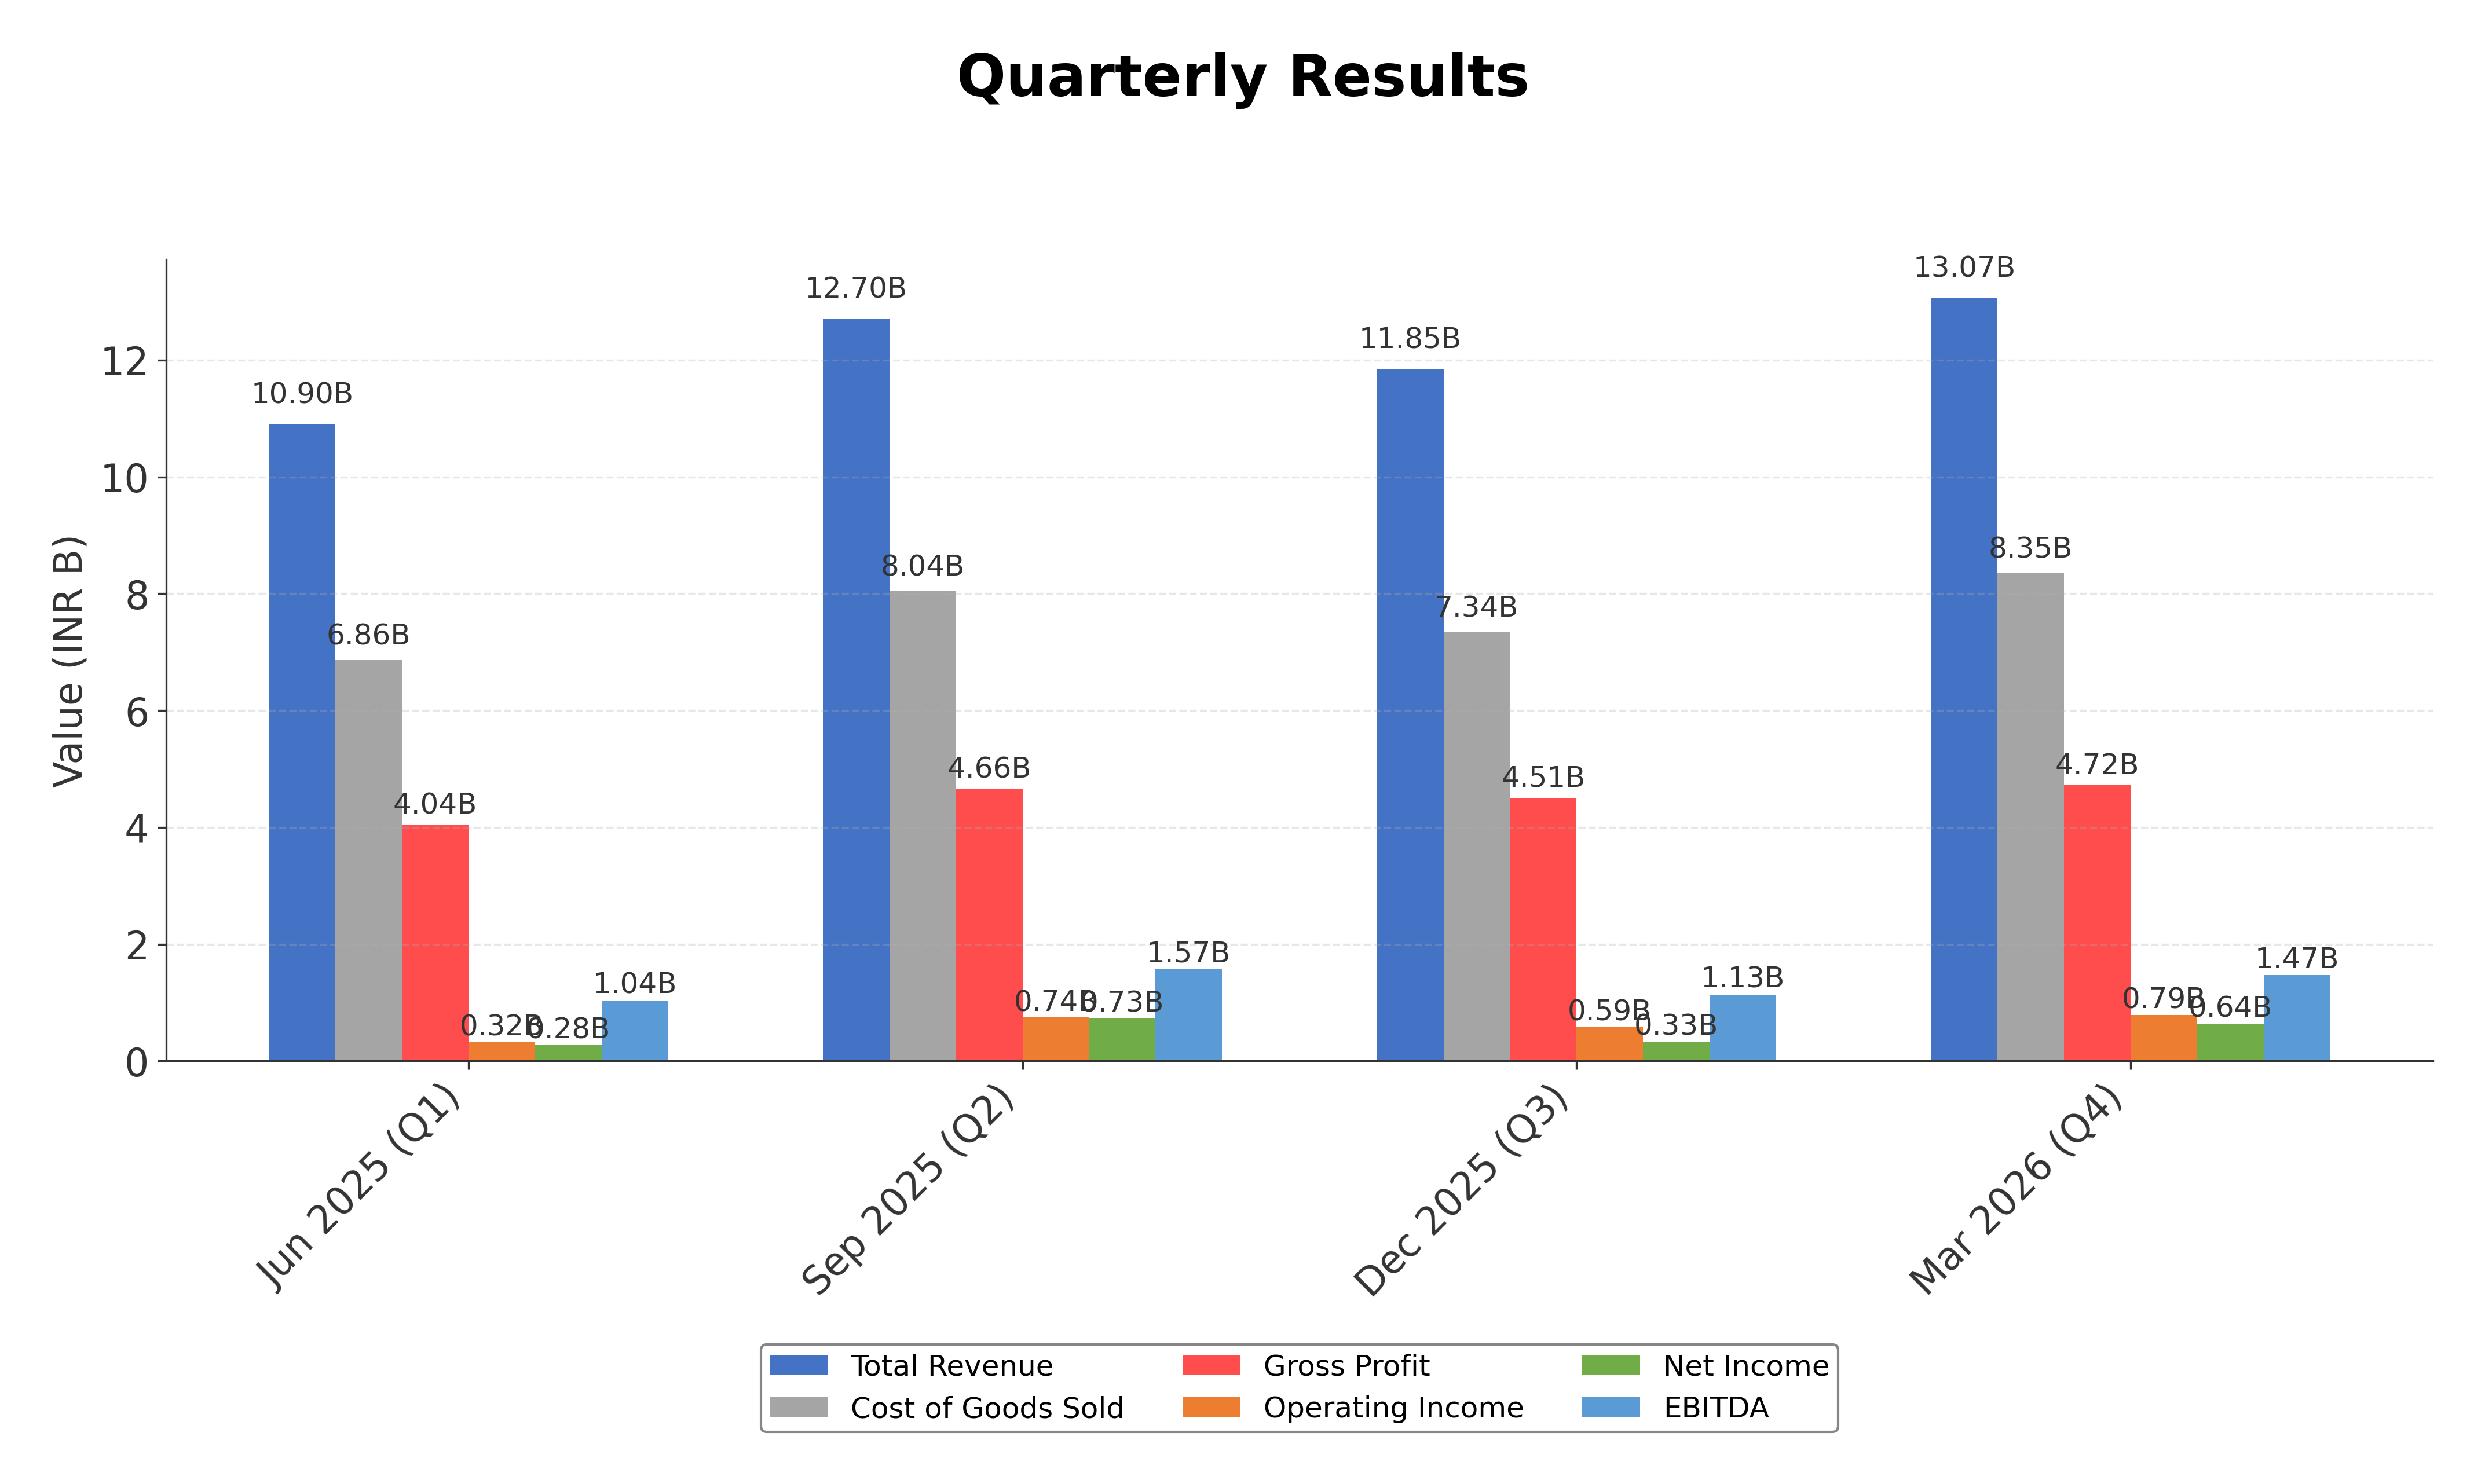
Peer Analysis
| Company Name | Market Cap | P/E Ratio | P/B Ratio | EV/EBITDA | Price to CFO |
|---|---|---|---|---|---|
| Sandhar Technologies Ltd. | ₹42.96B | 22.28 | 3.32 | 12.61 | 20.47 |
| Sona BLW Precision Forgings Ltd. | ₹374.65B | 58.59 | 6.55 | 34.36 | 56.85 |
| Varroc Engineering Ltd. | ₹89.59B | 40.07 | 5.07 | 11.84 | 16.69 |
| Endurance Technologies Ltd. | ₹359.44B | 37.71 | 5.25 | 18.12 | 19.42 |
| Sundram Fasteners Ltd. | ₹176.54B | 29.89 | 4.36 | 18.14 | 21.09 |
| Exide Industries Ltd. | ₹339.62B | 39.68 | 2.44 | 18.45 | 14.07 |
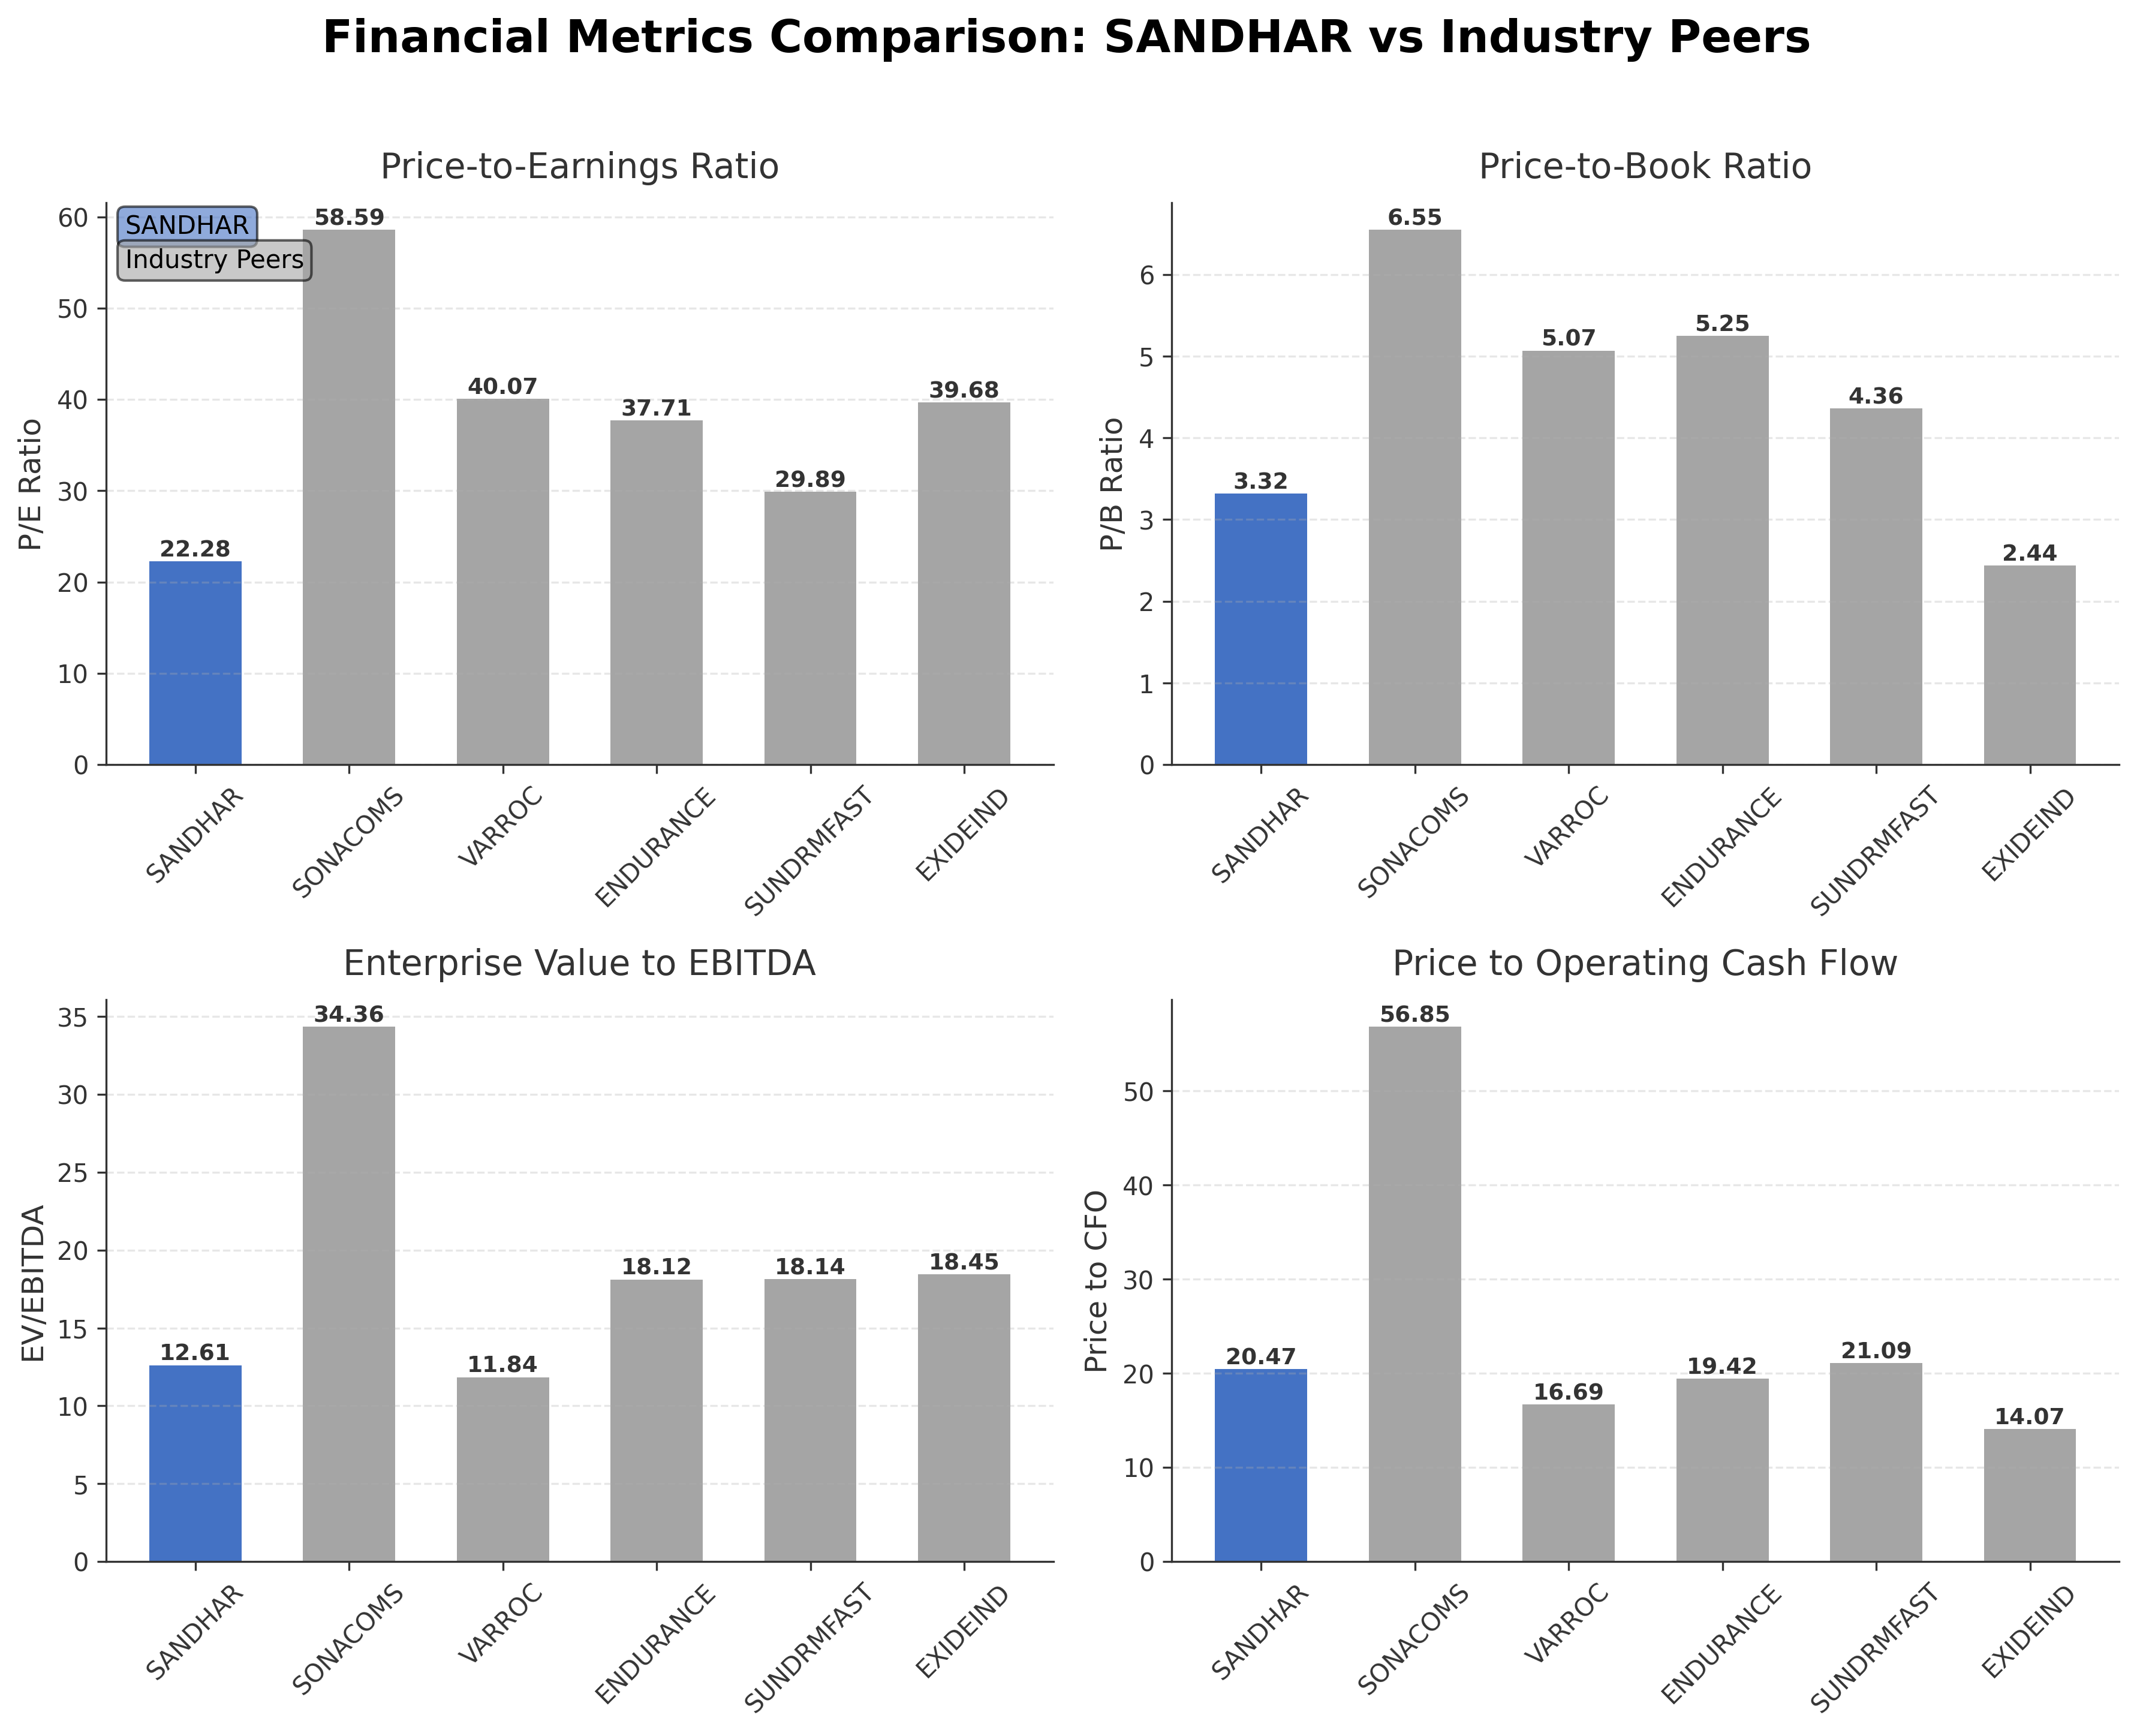
Comparison Analysis: Sandhar Technologies Ltd. exhibits a lower P/E ratio of 22.28 compared to its larger peers, whose P/E ratios range from approximately 29.89 to 58.59, indicating relatively more attractive valuation. Its price-to-book ratio of 3.32 is moderate, below some peers like Sona BLW Precision Forgings and Varroc Engineering but higher than Exide Industries. The EV/EBITDA multiple of 12.61 is competitive, suggesting efficient earnings relative to enterprise value. Sandhar’s return on equity at 16.07% is among the higher levels in the peer group, reflecting solid profitability. Overall, Sandhar presents a balanced profile with favorable valuation metrics and strong profitability relative to its regional industry peers.
Financial Metrics Comparison with Peers
Financial Statements
Comprehensive financial data including income, balance sheet, and cash flow metrics
Income Statement
| fiscal_date | 2026-03-31 | 2025-03-31 | 2024-03-31 | 2023-03-31 | 2022-03-31 |
|---|---|---|---|---|---|
| Sales | 48.52B | 38.38B | 34.72B | 28.66B | 22.92B |
| Cost Of Goods | 30.59B | 25.64B | 23.48B | 19.87B | 15.66B |
| Gross Profit | 17.93B | 12.75B | 11.23B | 8.79B | 7.25B |
| Operating Expense Other Operating Expenses | 7.41B | 3.15B | 2.76B | 2.29B | 1.86B |
| Operating Income | 2.44B | 2.18B | 1.89B | 1.29B | 1.06B |
| Non Operating Interest Expense | 687.68M | 539.59M | 491.35M | 340.47M | 160.38M |
| Pretax Income | 2.56B | 1.85B | 1.50B | 1.00B | 814.42M |
| Income Tax | 570.88M | 429.51M | 399.45M | 268.07M | 255.13M |
| Net Income | 1.99B | 1.42B | 1.10B | 735.57M | 559.29M |
| Eps Basic | 33.00 | 23.53 | 18.24 | 12.12 | 9.26 |
| Eps Diluted | 33.00 | 23.53 | 18.24 | 12.12 | 9.26 |
| Basic Shares Outstanding | 60.20M | 60.19M | 60.19M | 60.19M | 60.19M |
| Diluted Shares Outstanding | 60.20M | 60.19M | 60.19M | 60.19M | 60.19M |
| Ebit | 3.25B | 2.39B | 1.99B | 1.34B | 974.80M |
| Ebitda | 5.21B | 4.03B | 3.50B | 2.53B | 1.97B |
| Net Income Continuous Operations | 2.56B | 1.85B | 1.50B | 1.00B | 814.42M |
| Minority Interests | 0.00 | 0.00 | -4.83M | -5.88M | -2.01M |
| Preferred Stock Dividends | 0.00 | 0.00 | 0.00 | 0.00 | 0.00 |
| Operating Expense Research And Development | N/A | 13.62M | 11.60M | 9.12M | 6.73M |
| Operating Expense Selling General And Administrative | N/A | 712.17M | 618.40M | 495.69M | 406.20M |
| Non Operating Interest Income | N/A | 37.04M | 22.43M | 11.32M | 11.28M |
Data provided by Twelve Data
Balance Sheet
| fiscal_date | 2026-03-31 | 2025-03-31 | 2024-03-31 | 2023-03-31 | 2022-03-31 |
|---|---|---|---|---|---|
| Cash And Cash Equivalents | 510.86M | 810.92M | 331.44M | 65.12M | 41.04M |
| Accounts Receivable | 8.23B | 5.47B | 4.48B | 3.41B | 4.11B |
| Total Assets | 34.76B | 27.90B | 24.27B | 21.55B | 19.78B |
| Total Liabilities | 21.43B | 16.51B | 14.11B | 12.30B | 11.15B |
| Long Term Debt | 4.38B | 3.54B | 3.82B | 4.06B | 3.30B |
| Shareholders Equity | 13.33B | 11.39B | 10.17B | 9.25B | 8.63B |
Data provided by Twelve Data
Cash Flow Statement
| fiscal_date | 2026-03-31 | 2025-03-31 | 2024-03-31 | 2023-03-31 | 2022-03-31 |
|---|---|---|---|---|---|
| Operating Activities Net Income | 2.56B | 1.85B | 1.50B | 1.00B | 814.42M |
| Operating Activities Other Non Cash Items | 668.77M | 529.05M | 492.74M | 341.76M | 165.83M |
| Operating Activities Accounts Receivable | -2.67B | -1.00B | -1.02B | 898.60M | -501.57M |
| Operating Activities Other Assets Liabilities | -1.93B | -311.43M | -50.13M | -271.34M | -877.33M |
| Operating Activities Operating Cash Flow | -1.37B | 1.06B | 922.80M | 1.97B | -398.64M |
| Investing Activities Capital Expenditures | -2.81B | -3.06B | -2.33B | -2.50B | -2.96B |
| Investing Activities Net Acquisitions | 6.69M | 0.00 | -49.47M | 7.29M | -152.37M |
| Investing Activities Purchase Of Investments | -40.72M | N/A | -30.07M | -2.13M | -37.35M |
| Investing Activities Sale Of Investments | 610.00M | 114.91M | N/A | 8.94M | 26.32M |
| Investing Activities Investing Cash Flow | -2.23B | -2.94B | -2.41B | -2.49B | -3.12B |
| Financing Activities Long Term Debt Issuance | 1.09B | 1.10B | 908.88M | 1.24B | 1.67B |
| Financing Activities Long Term Debt Payments | -1.16B | -1.11B | -906.48M | -47.41M | -1.85M |
| Financing Activities Short Term Debt Issuance | 1.34B | 1.97B | 770.10M | -918.65M | 1.29B |
| Financing Activities Common Dividends | -210.67M | -195.62M | -150.78M | -135.73M | -60.79M |
| Financing Activities Financing Cash Flow | 1.06B | 1.77B | 621.72M | 133.69M | 2.89B |
| End Cash Position | 510.86M | 810.92M | 331.44M | 65.12M | 41.04M |
| Free Cash Flow | -889.43M | -692.08M | 375.91M | 512.52M | -2.48B |
Data provided by Twelve Data
Technical Analysis
Key Insights
- The current trend direction is strongly bullish, with the stock price recently reaching a new 52-week high near ₹764, indicating strong upward momentum.
- Key support levels are identified around ₹555 (50-day moving average) and ₹525 (200-day moving average), while resistance is near the recent high of ₹763.
- The stock is trading above its major moving averages: 10-day, 50-day (₹555.10), and 200-day (₹524.62), confirming a positive trend across short and long-term frames.
- Momentum indicators show the RSI in a moderately overbought zone, MACD remains positive with bullish crossover signals, and stochastic oscillators indicate sustained buying pressure.
- Multi-timeframe analysis (daily, weekly, monthly) consistently shows upward price action with increasing volume, supporting the strength of the current rally.
- Potential market scenarios include continuation of the uptrend if support levels hold, while a break below the 50-day moving average could signal consolidation or correction phases.
Trending News
1. Headline: Broad-Based Technical Strength Lifts Sandhar Technologies Limited to 52-Week High of Rs 764.1
Summary: With a decisive surge to Rs 764.1 on 12 Jun 2026, Sandhar Technologies Limited has reached a fresh 52-week and all-time high, marking a remarkable 98% rally from its low of Rs 386.25 over the past year. This milestone underscores the stock’s strong price momentum and technical alignment amid ...
Sentiment: positive
2. Headline: Sandhar Technologies Limited Hits All-Time High of Rs 764.1 as Momentum Builds Across Timeframes
Summary: Extending its winning streak to four sessions, Sandhar Technologies Limited surged to a fresh all-time high of Rs 764.1 on 12 Jun 2026, outperforming both it...
Sentiment: positive
Summary: Regarding stocks to buy today, ... Pharmaceuticals Ltd, Hindustan Unilever Ltd (HUL), Mahindra & Mahindra Ltd (M&M), AU Small Finance Bank Ltd, and Sandhar Technologies Ltd....
Sentiment: positive
4. Headline: Sandisk Stock Rips Higher As AI Memory Upcycle Accelerates - StocksToTrade
Summary: Sandisk Corporation stocks have been trading up by 14.55 percent after upbeat earnings and strong flash-memory demand projections. Key Takeaways For SNDK Traders Morgan Stanley now sees Sandisk riding a prolonged AI‑driven memory upcycle, lifting earnings estimates and sharply raising its ...
Sentiment: positive
5. Headline: SNDK Stock Jumps As Wall Street Backs AI Memory Boom - StocksToTrade
Summary: Sandisk Corporation stocks have been trading up by 10.88 percent after upbeat demand forecasts signaled stronger future revenue growth. Key Takeaways Morgan Stanley flagged Sandisk and Micron as major winners from a prolonged AI‑driven memory upcycle and sharply raised earnings estimates ...
Sentiment: positive
Powered by Brave
Recent Updates
News Summary
As of 2026-06-13. Sandhar Technologies has articulated ambitious growth targets, aiming for INR 10,000 crores in revenue with 15% growth in the current fiscal year, supported by new projects worth INR 342 crores expected to generate INR 700-750 crores by FY 2027. The company anticipates profitability milestones including the Sundaram-Clayton unit turning profitable by Q3 FY27 and the electric vehicle business achieving profitability by FY28, while maintaining an EBITDA margin target of 11% and a post-tax ROCE of 18-20%. Additionally, Sandhar filed its Q4 FY26 earnings call transcript, providing detailed insights into its recent financial performance and strategic outlook. Leadership changes include the completion of the tenure of independent director Arjun Sharma, potentially impacting board composition and governance. India Ratings reaffirmed Sandhar’s strong credit profile despite overseas operational challenges, underscoring financial stability and resilience.
News Sentiment
The overall sentiment from recent updates is positive to neutral, driven by the company’s clear growth targets and strategic project investments that signal confidence in future expansion. The reaffirmation of credit ratings supports financial strength, while leadership changes introduce a neutral governance dynamic. The detailed earnings call transcript provides transparency but does not indicate significant surprises. This balanced sentiment reflects cautious optimism grounded in concrete business developments and financial metrics.
Source List
- https://scanx.trade/stock-market-news/companies/sandhar-technologies-targets-inr-10-000-crores-revenue-with-15-growth-and-new-project-pipeline/41311840
- https://www.tipranks.com/news/company-announcements/sandhar-technologies-files-q4-fy26-earnings-call-transcript-with-exchanges
- https://www.tipranks.com/news/company-announcements/sandhar-technologies-announces-completion-of-independent-director-arjun-sharmas-tenure
- https://www.tipranks.com/news/company-announcements/india-ratings-reaffirms-sandhar-technologies-strong-credit-profile-despite-overseas-drag
Analytical Overview
Analysis Summary
Sandhar Technologies’ valuation metrics, including a trailing P/E of 22.28 and forward P/E of 17.02, are lower than many industry peers, suggesting relatively attractive pricing compared to sector averages. The company exhibits a strong growth trajectory with a quarterly revenue growth rate of 28.9% and a quarterly earnings growth of 49.8% year-over-year, supported by new project pipelines and expansion plans. Financial health shows moderate leverage with a debt-to-equity ratio of 86.08%, positive operating cash flow of INR 2.10 billion TTM, but negative free cash flow reflecting ongoing investments. Sector-specific opportunities include increasing demand for automotive safety components and electric vehicle parts, while challenges involve margin pressures from new projects and global supply chain risks. Considering India-specific factors, the company benefits from a growing domestic automotive market and supportive regulatory environment, though it faces competition and macroeconomic uncertainties.
Overall Business and Market Assessment
Supporting Factors: No data
Risk Factors: elevated debt levels and margin compression from new project ramp-ups
SWOT Analysis
Strengths
- Strong market position in automotive safety and security components.
- Robust revenue growth with a 28.9% quarterly increase and 49.8% earnings growth year-over-year.
- Reaffirmed credit profile indicating financial stability.
- Diverse product portfolio serving multiple vehicle segments.
Weaknesses
- Relatively high debt-to-equity ratio of 86.08% indicating leverage concerns.
- Negative free cash flow of INR -1.42 billion reflecting investment pressures.
- Current ratio below 1 at 0.944 suggesting liquidity constraints.
- Margin pressures expected from new project ramp-ups.
Opportunities
- Expansion into electric vehicle components with profitability targeted by FY28.
- New projects worth INR 342 crores aiming to boost revenue significantly by FY27.
- Growing domestic automotive market and increasing safety regulations.
- Potential for international market growth through strategic partnerships.
Threats
- Global supply chain disruptions impacting production and costs.
- Competitive pressures from larger and more diversified industry players.
- Regulatory changes and macroeconomic uncertainties in key markets.
- Risks associated with overseas operations and expansion.
Company Description
Sandhar Technologies Ltd. is an automotive components manufacturing company primarily focused on safety and security systems. Established in India, the company specializes in the production of components like lock assemblies, mirrors, and handles for vehicles, addressing the critical needs for enhanced safety across various vehicular categories, including passenger vehicles, commercial vehicles, and two-wheelers. Sandhar Technologies plays a pivotal role in the automotive supply chain by delivering top-tier products to major automotive manufacturers globally. The company's emphasis on research and development ensures it stays at the forefront of technological advancements, adapting to the industry's shift towards smarter and more secure automotive solutions. Its extensive manufacturing footprint and strategic partnerships enable Sandhar Technologies to leverage economies of scale, making it a significant player in both domestic and international markets. By focusing on quality and innovation, the company supports the automotive industry's evolution towards more robust and comprehensive safety solutions.