


Salzer Electronics Ltd (SALZERELEC)
Stock Analysis Report
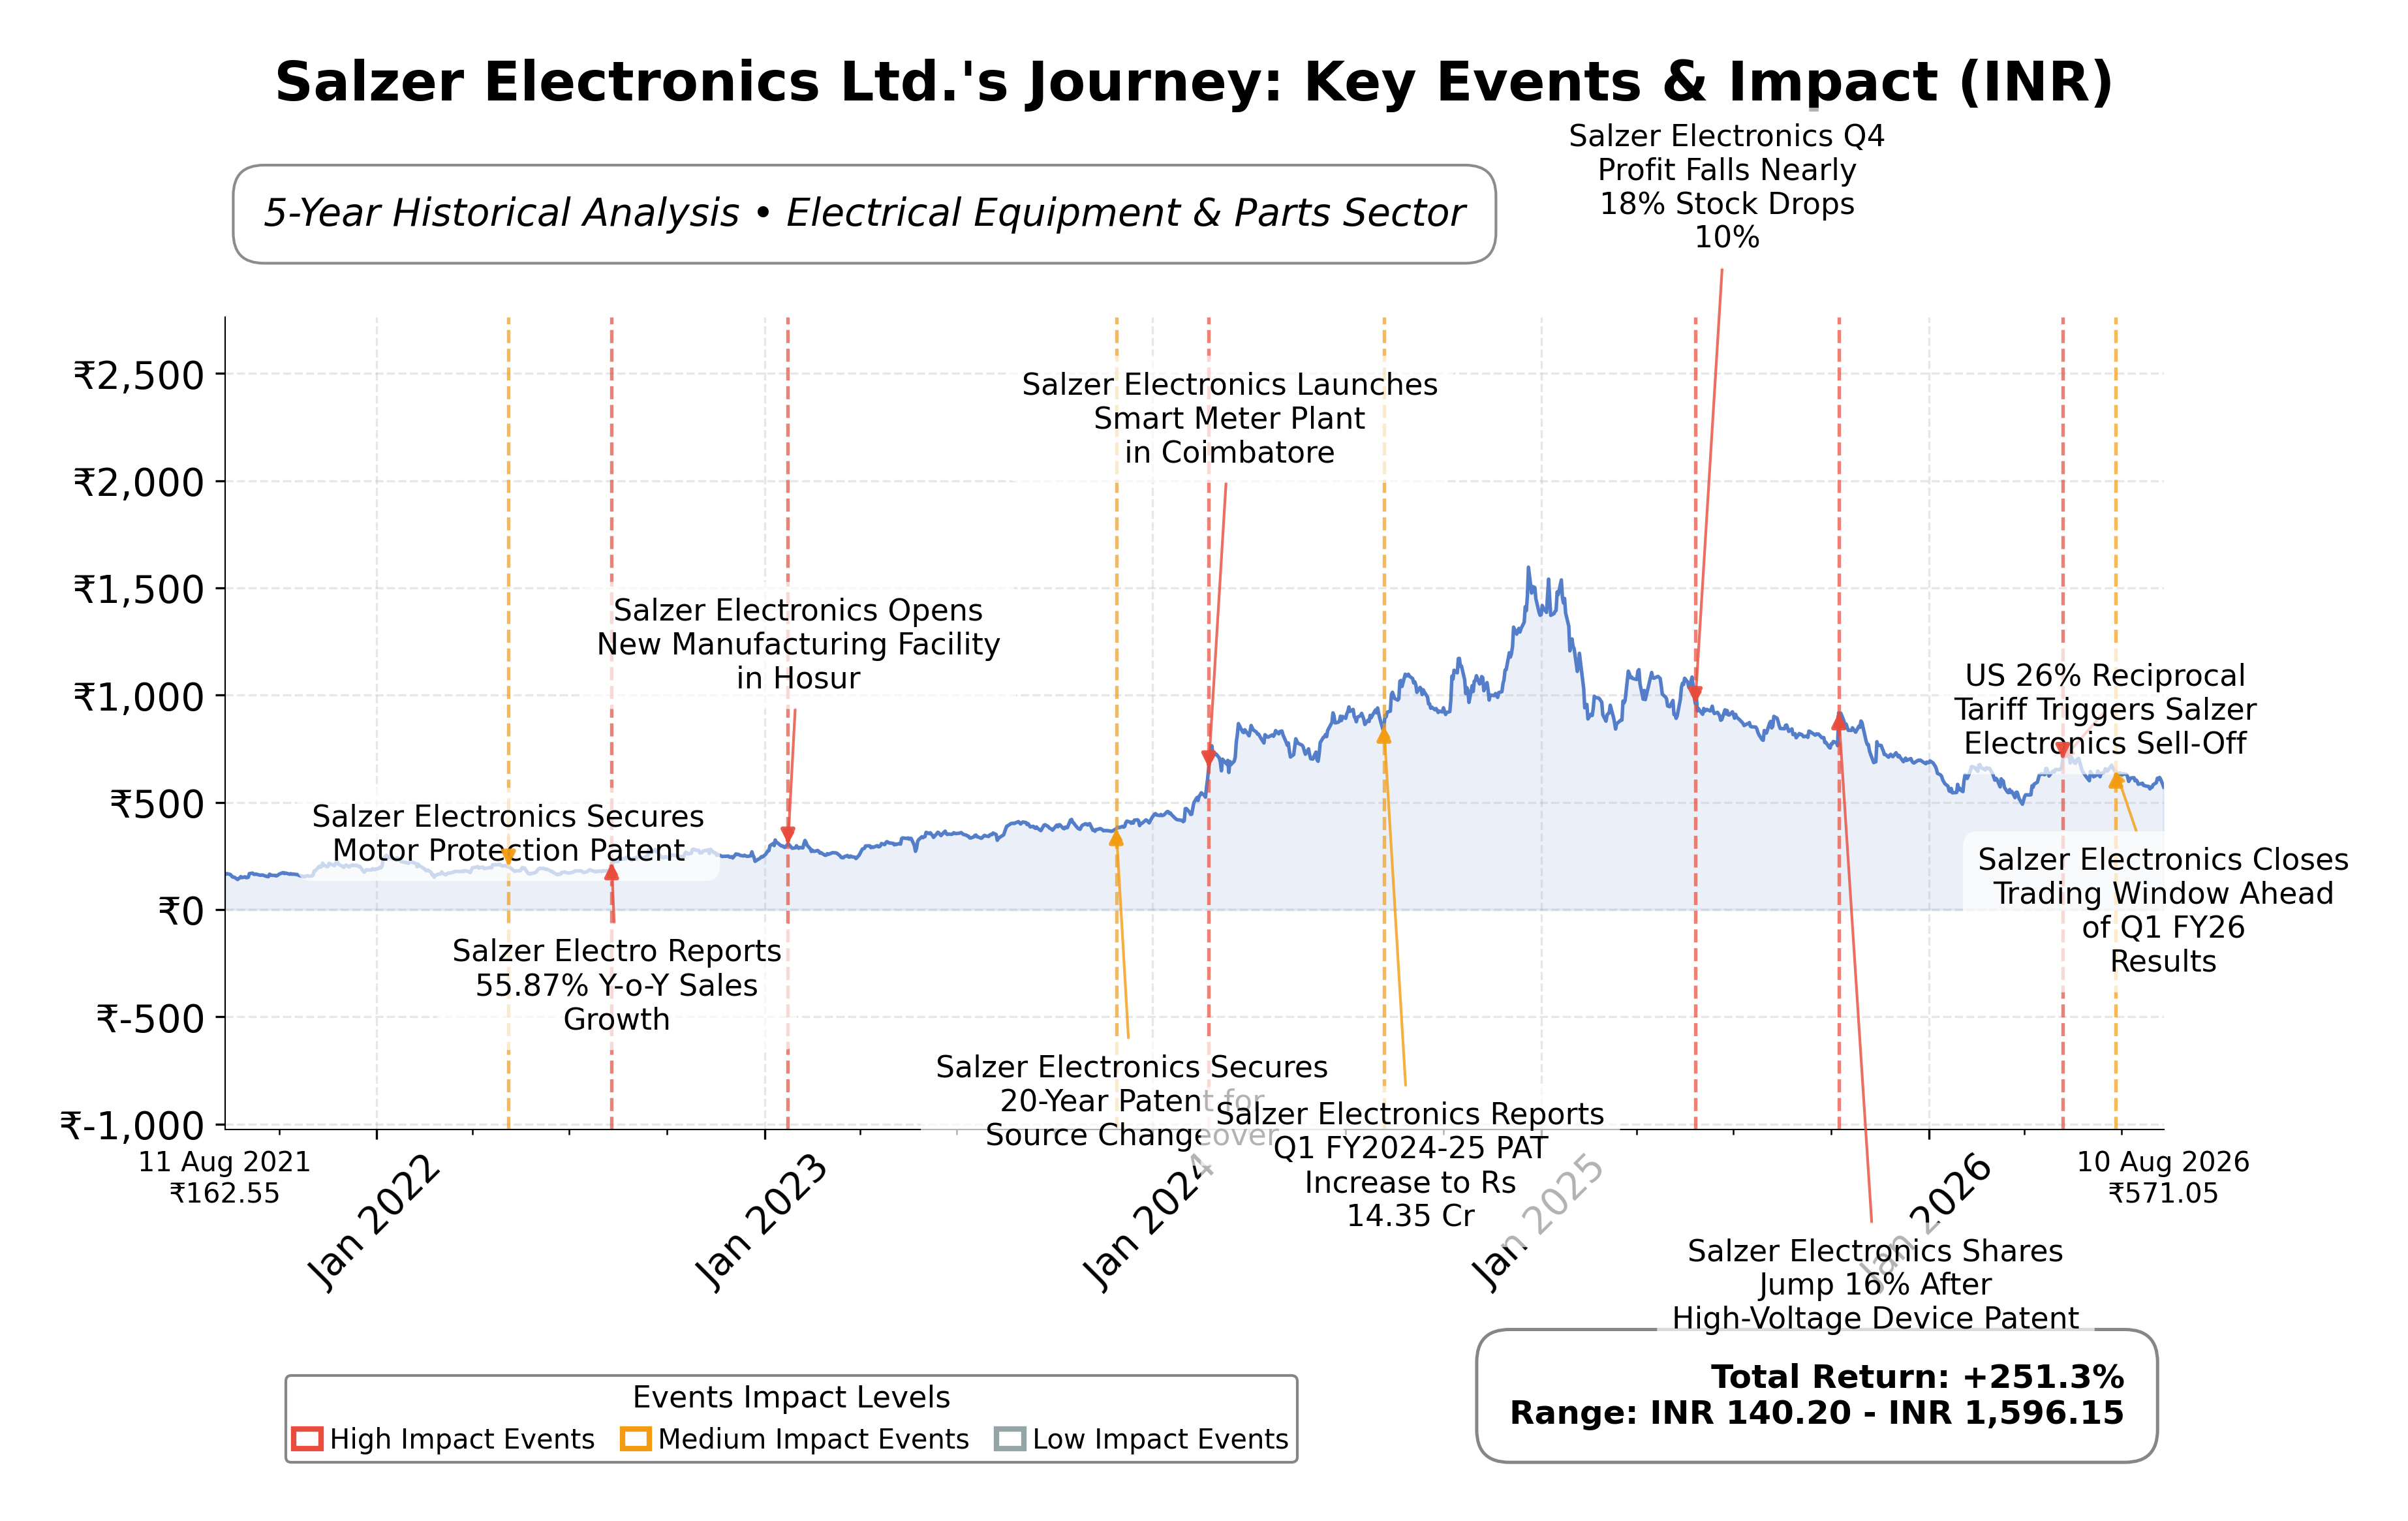
Stock Journey
Key Positives and Key Risks
Pros
- Trailing P/E ratio of 19.06 is below many industry peers, suggesting relatively attractive valuation.
- Revenue growth of 26.2% quarterly and 12.4% year-over-year indicates positive top-line momentum.
Cons
- Net profit declined by over 52% year-over-year in Q1 FY27, reflecting margin pressures.
- High debt-to-equity ratio of 88.78% indicates elevated financial leverage and potential risk.
- Negative free cash flow of ₹-118.25 crore signals challenges in cash generation.
Disclosure: This information is for general awareness and does not constitute investment advice
Report Summary
Salzer Electronics Ltd. is an Indian company listed on the NSE, operating in the Industrials sector with a focus on electrical equipment and parts. The company manufactures a diverse range of electrical installation components such as wiring ducts, cable channels, and industrial switches, serving industries including automotive, renewable energy, real estate, and infrastructure development. Salzer Electronics is recognized for integrating advanced technology into its manufacturing processes, which supports its strong market presence domestically and internationally. Its business model centers on supplying essential electrical components that enhance operational efficiency and safety in industrial automation.
Financially, Salzer Electronics reported trailing twelve months revenue of approximately ₹1,758 crore with a gross margin of 21.43%, operating margin of 5.17%, and net profit margin of 3.01%. The company’s return on equity (ROE) stands at 9.31%, and return on assets (ROA) at 5.87%, indicating moderate profitability and asset efficiency. The operating cash flow for the trailing twelve months was ₹46.48 crore, though free cash flow was negative at about ₹-118.25 crore, reflecting some cash flow challenges. The company maintains a current ratio of 1.41, suggesting reasonable short-term liquidity, while its debt-to-equity ratio is elevated at 88.78%, indicating a relatively high leverage position.
Valuation metrics show a trailing price-to-earnings (P/E) ratio of 19.06, a price-to-book (P/B) ratio of 1.70, and an enterprise value to EBITDA (EV/EBITDA) multiple of 10.89. The market capitalization is approximately ₹1,009.77 crore. The stock price currently trades around ₹571, which is closer to the 52-week low of ₹488.80 than the high of ₹952.50, reflecting a downside risk of about 40.3% from the 52-week high. These valuation ratios suggest the stock is priced moderately relative to its earnings and book value but has experienced significant price volatility over the past year.
Salzer Electronics benefits from a strong brand reputation, technological integration, and a diversified product portfolio that supports industrial automation. The company’s key risks include rising material costs impacting margins, high leverage, and competitive pressures within the electrical components industry. Recent strategic actions include board re-appointments of key executives and a focus on expanding revenue streams through industrial switchgear and smart meter businesses. The company also maintains a dividend payout with a forward yield of approximately 1.75%, supporting shareholder returns.
Technically, the stock has shown a downward trend from its 52-week high and currently trades below its 50-day and 200-day moving averages, suggesting some resistance to upward momentum. Momentum indicators reflect mixed signals with moderate volatility. Recent news highlights a significant decline in quarterly net profit despite revenue growth, which has influenced investor sentiment. Overall, the data suggests a cautious stance with attention to operational performance and market conditions before considering further positioning.
Company and Industry Overview
Company Basics
Price Performance
Company Size
Shareholding Pattern
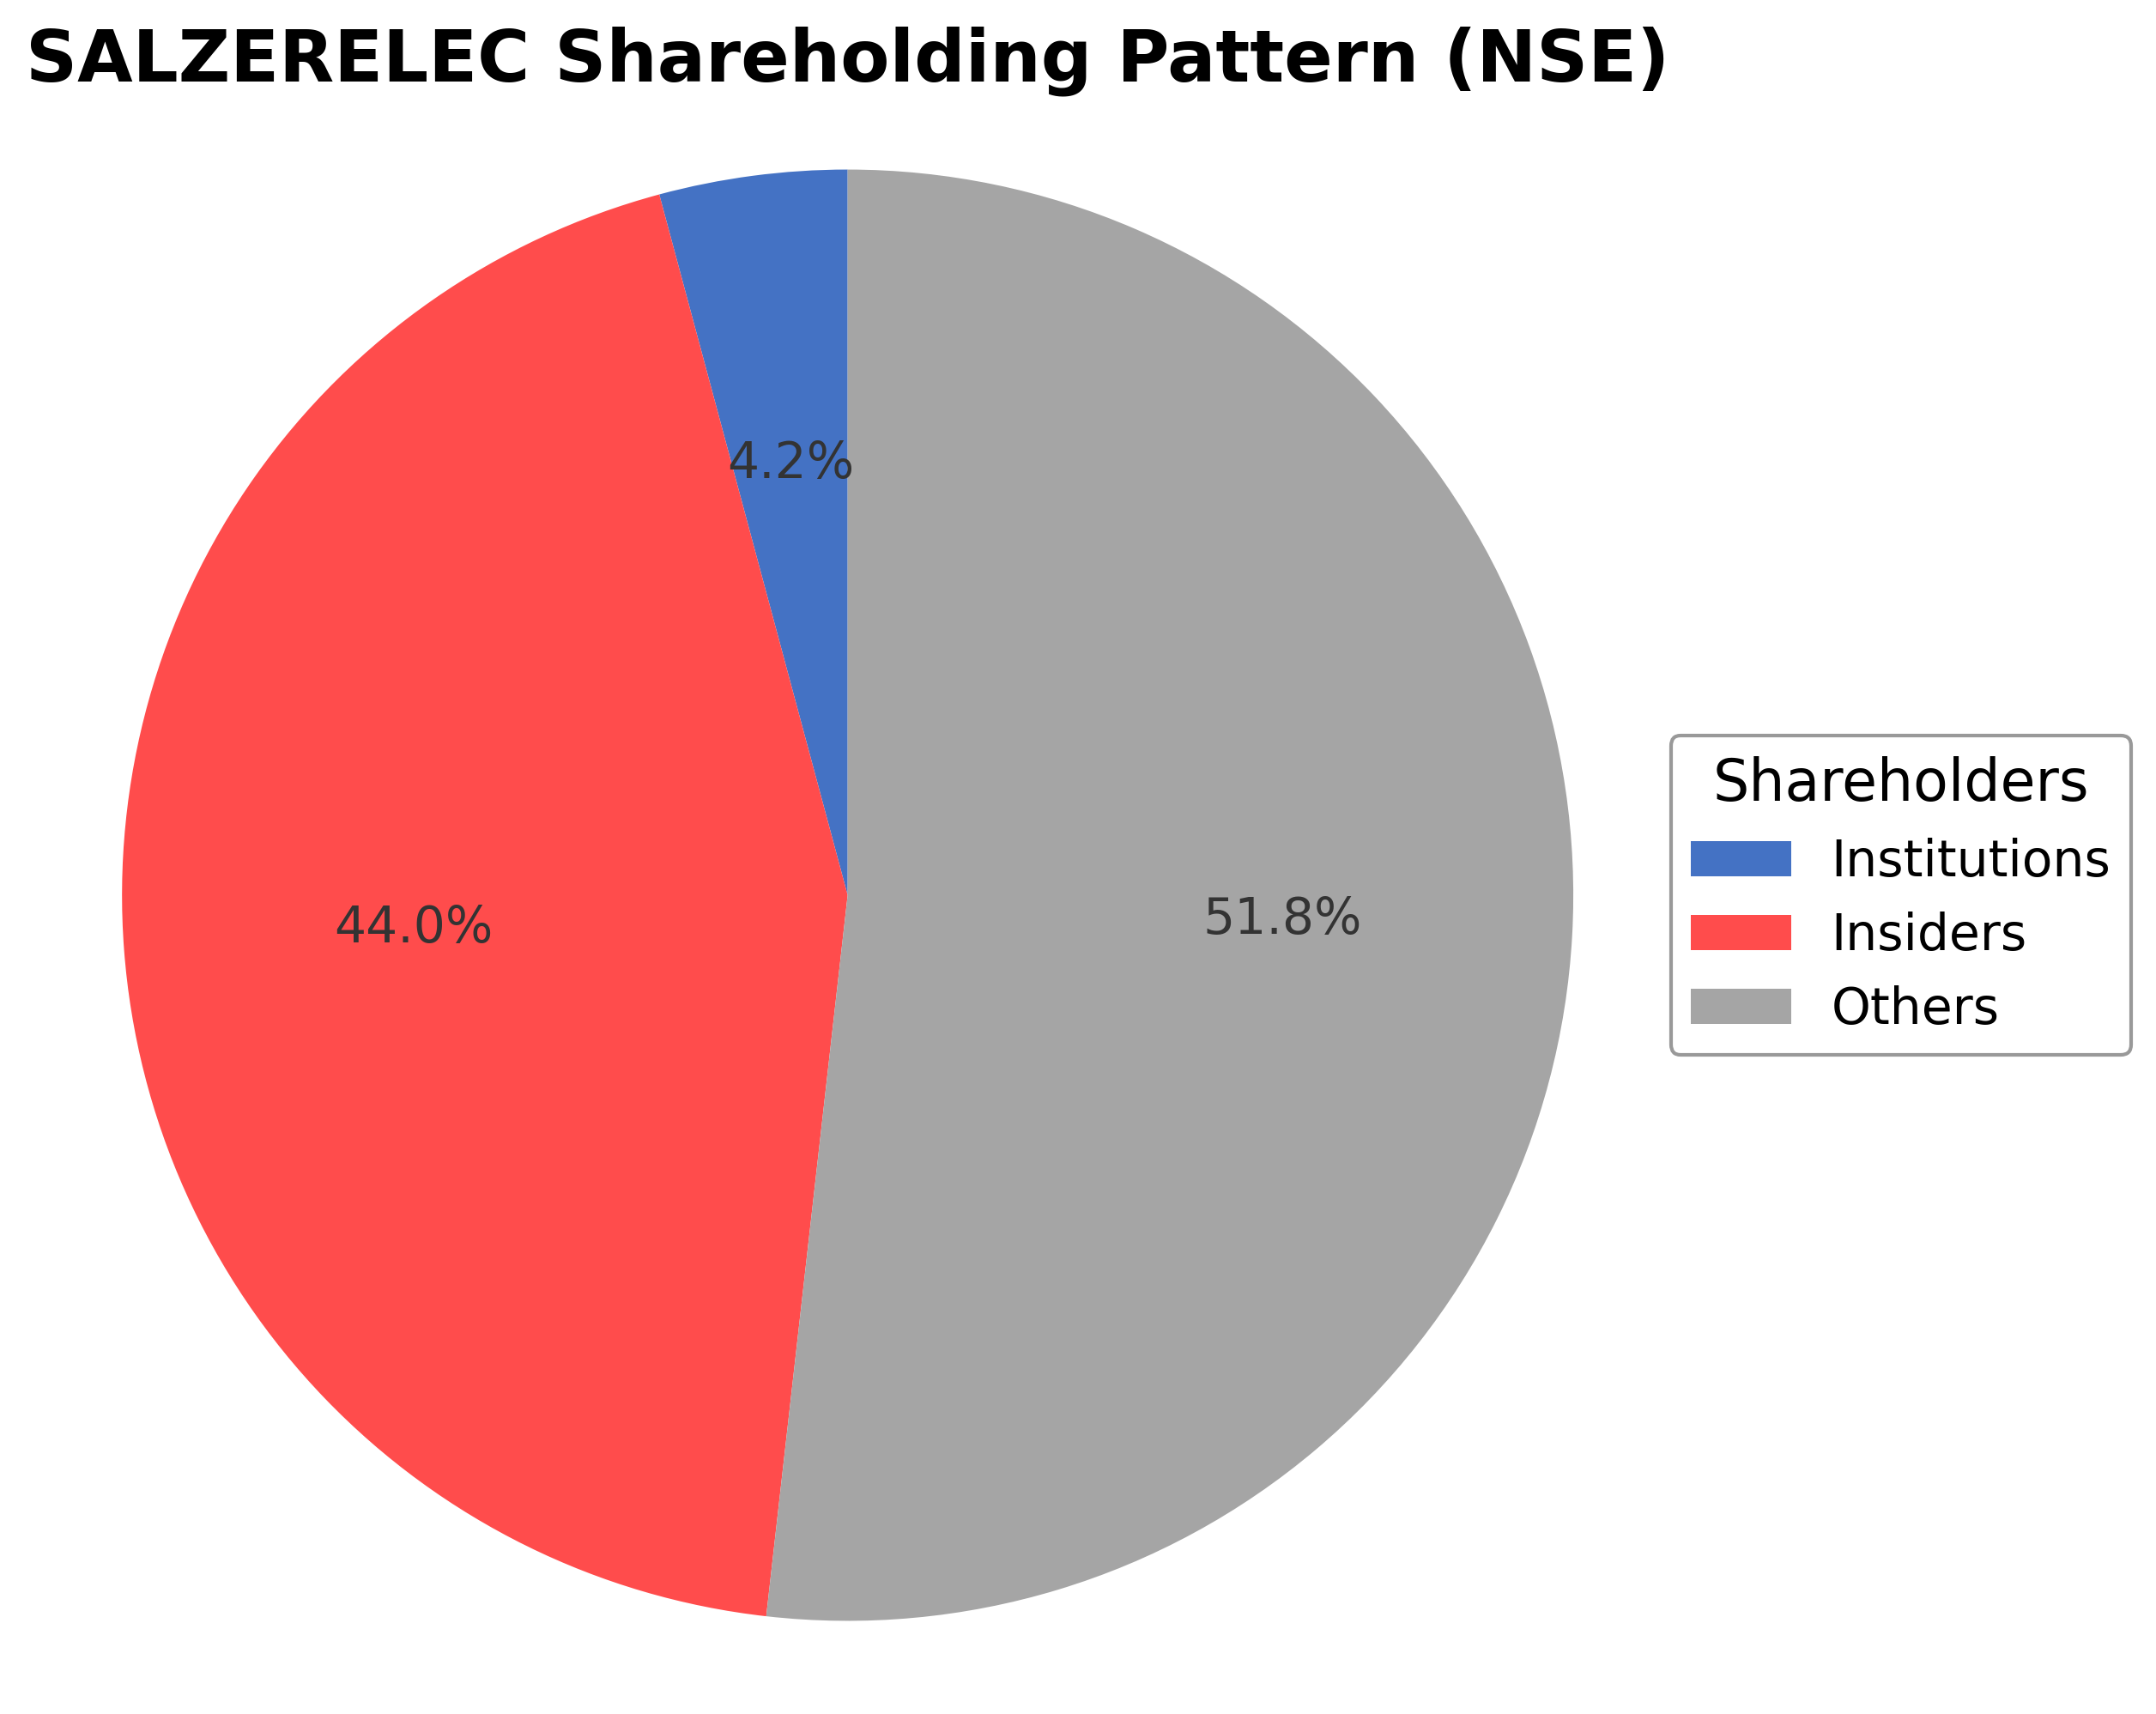
Salzer Electronics Ltd.'s ownership structure comprises approximately 44.03% held by insiders including executives and board members, 4.18% by institutional investors such as mutual funds and asset managers, and the remaining 51.79% by public shareholders including retail investors and employee stock plans. Over the past 12-24 months, insider holdings have remained relatively stable, while institutional participation is modest, indicating limited recent accumulation or distribution by major funds. This shareholding pattern suggests a governance framework with significant promoter control and a broad public float, which may influence strategic decisions and market sentiment. The relatively low institutional ownership could reflect cautious positioning by large investors, while the stable insider stake underscores confidence in the company’s long-term direction. Overall, the ownership mix supports continuity in management while maintaining exposure to market dynamics within the electrical equipment industry.
Sector and Industry Analysis
The Electrical Switchgear sector in India is a significant component of the broader electrical equipment market, driven by increasing infrastructure development and industrialization. The market has been experiencing steady growth supported by government capital expenditure and rising domestic consumption. Key players in this sector include established manufacturers like Salzer Electronics Ltd., along with other regional and multinational companies competing for market share.
Industry trends highlight a focus on enhanced execution capabilities and margin improvement amid cost pressures and competitive pricing. Seasonal demand fluctuations and order book conversion remain critical for revenue growth, while companies emphasize operational efficiency to sustain margins. Barriers to entry include technological expertise, established distribution networks, and compliance with stringent quality standards, positioning incumbents like Salzer Electronics favorably against new entrants.
The regulatory environment for the Electrical Switchgear industry involves evolving compliance requirements that can affect cost structures and competitive dynamics. Supportive government policies and initiatives aimed at infrastructure expansion provide tailwinds, while regulatory changes may introduce additional compliance costs. The sector also benefits from macroeconomic factors such as interest rate cuts, which reduce borrowing costs and enhance profitability prospects.
Note: Analysis synthesized from industry research, market reports, and regulatory filings. Information is subject to change based on market conditions.
Financial Ratios Dashboard
Illustrative Scenario Analysis
DCF Assumptions:
Method: Two-Stage EPS-Priority Model
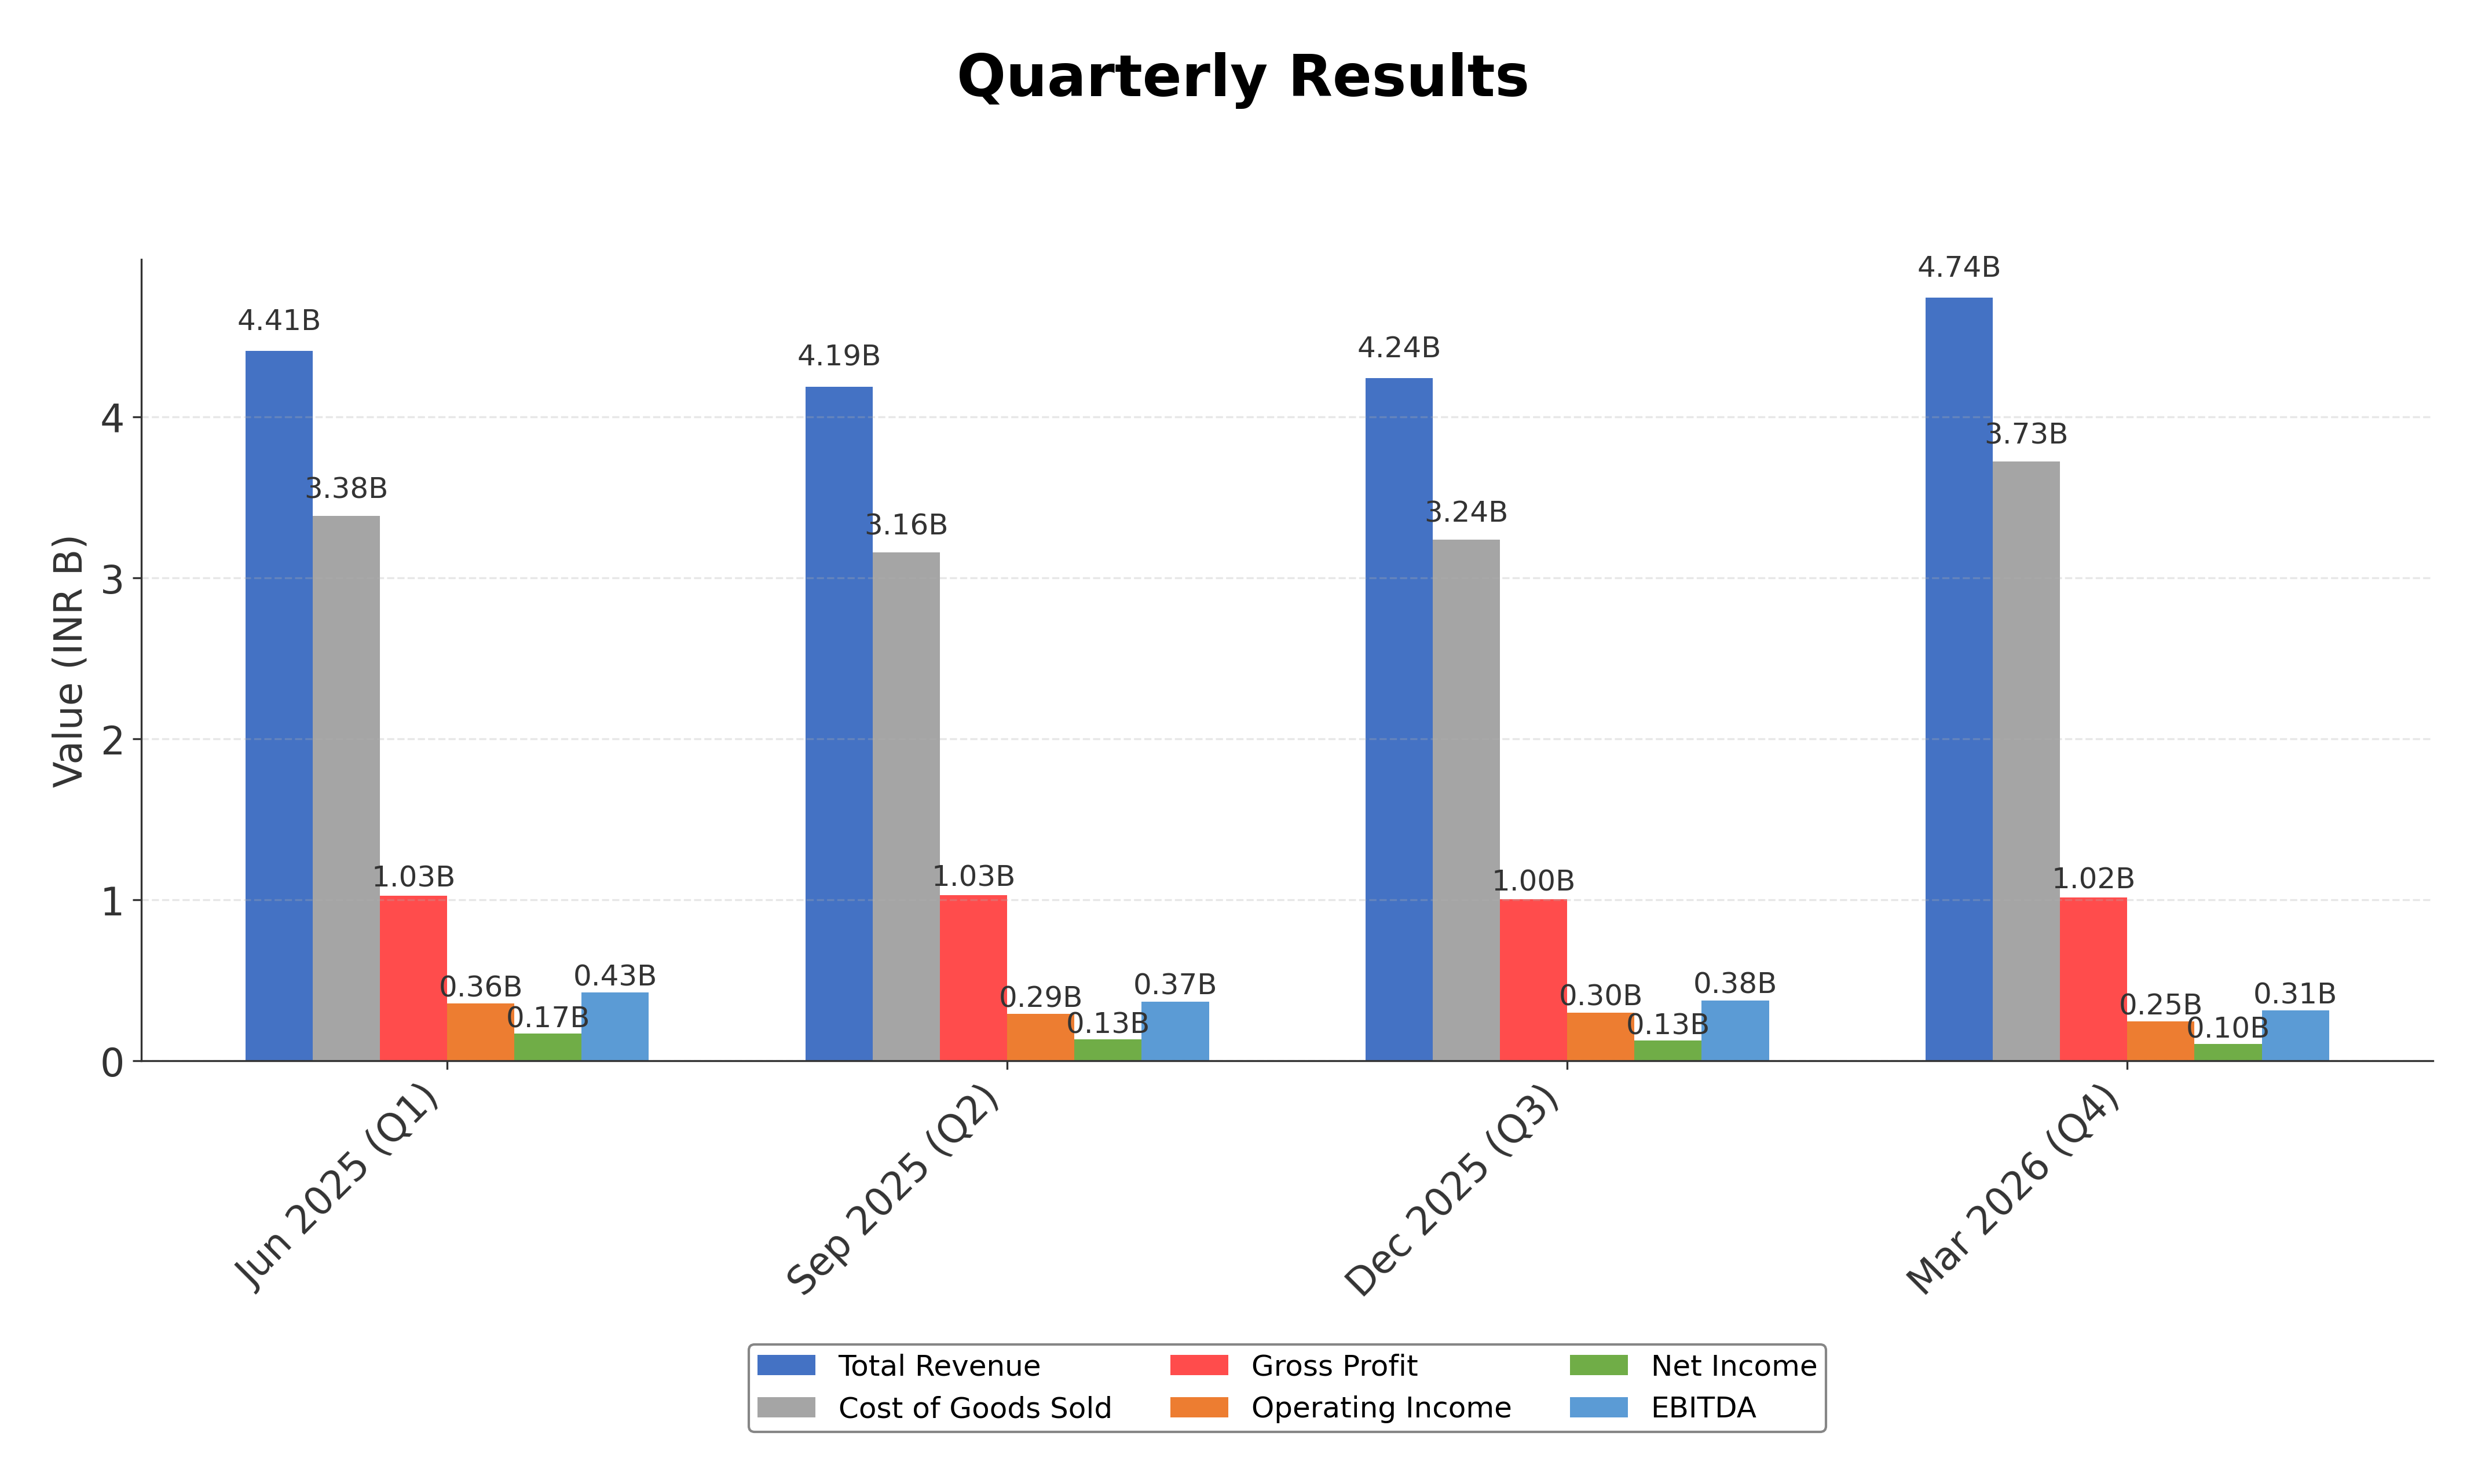
Financials
Peer Analysis
| Company Name | Market Cap | P/E Ratio | P/B Ratio | EV/EBITDA | Price to CFO |
|---|---|---|---|---|---|
| Salzer Electronics Ltd. | ₹10.10B | 19.06 | 1.70 | 10.89 | 21.72 |
| Hindustan Electro Graphite Limited | ₹124.11B | 33.40 | 2.53 | 22.34 | 58.22 |
| Finolex Cables Ltd. | ₹152.77B | 20.94 | 2.46 | 20.84 | 311.27 |
| Apar Industries Ltd. | ₹557.98B | 57.17 | 10.34 | 29.84 | 57.67 |
| Amara Raja Energy & Mobility Ltd. | ₹166.64B | 18.59 | 2.06 | 11.57 | 14.90 |
| Polycab India Ltd. | ₹1.34T | 47.03 | 11.17 | 29.94 | 37.69 |
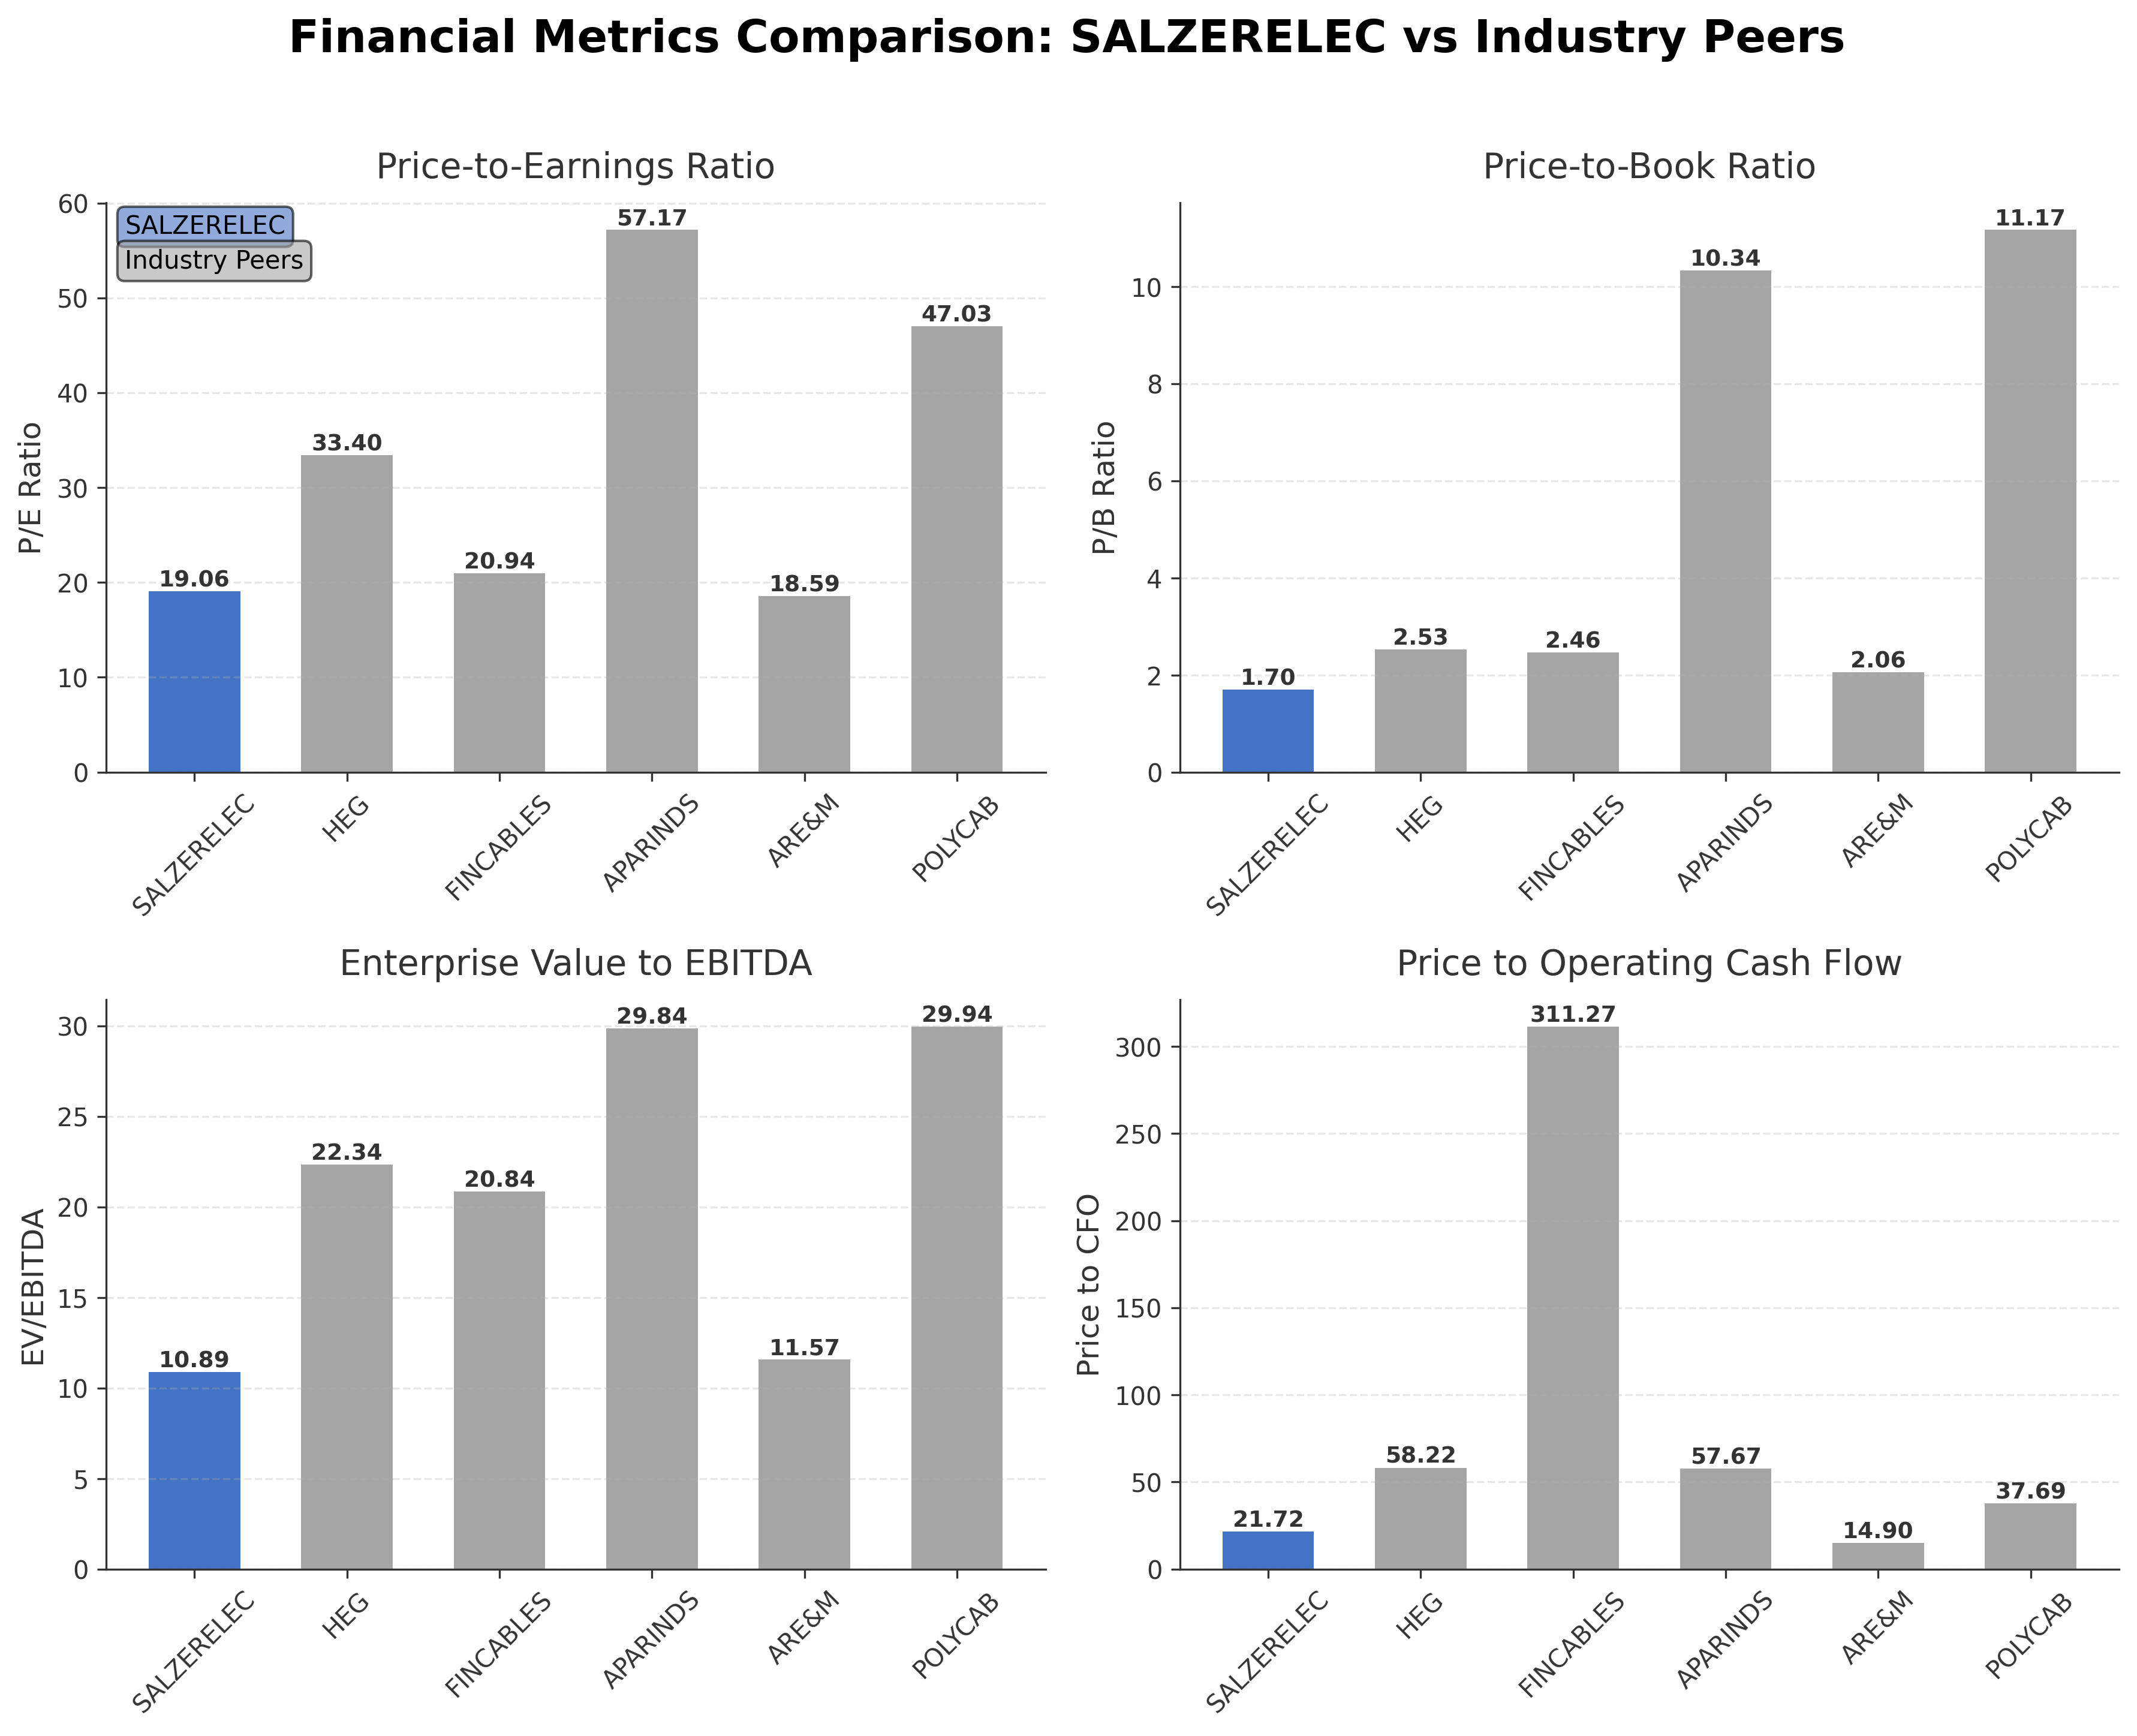
Comparison Analysis: Salzer Electronics Ltd. trades at a lower P/E ratio of 19.06 compared to many of its peers such as Apar Industries (57.17) and Polycab India (47.03), indicating a more conservative valuation. Its P/B ratio of 1.70 is also significantly lower than the industry heavyweights, suggesting less premium pricing relative to book value. The EV/EBITDA multiple of 10.89 is among the lower range in the peer group, reflecting potentially better value or lower growth expectations. Return on equity at 9.31% is moderate but below leaders like Polycab India (25.55%) and Apar Industries (19.74%), indicating room for improvement in profitability. Overall, Salzer Electronics presents a more modest valuation and profitability profile relative to larger industry peers, with potential upside if operational efficiencies and growth accelerate.
Financial Metrics Comparison with Peers
Financial Statements
Comprehensive financial data including income, balance sheet, and cash flow metrics
Income Statement
| fiscal_date | 2026-03-31 | 2025-03-31 | 2024-03-31 | 2023-03-31 | 2022-03-31 |
|---|---|---|---|---|---|
| Sales | 17.58B | 14.16B | 11.64B | 10.35B | 8.01B |
| Cost Of Goods | 13.51B | 10.68B | 8.86B | 8.10B | 6.35B |
| Gross Profit | 4.08B | 3.48B | 2.79B | 2.25B | 1.66B |
| Operating Expense Other Operating Expenses | 1.89B | 1.00B | 760.61M | 580.74M | 441.13M |
| Operating Income | 1.20B | 1.14B | 991.29M | 807.29M | 502.36M |
| Non Operating Interest Expense | 477.60M | 293.66M | 239.78M | 157.38M | 127.07M |
| Pretax Income | 734.68M | 746.81M | 647.29M | 548.95M | 325.08M |
| Income Tax | 184.53M | 221.95M | 176.63M | 152.77M | 83.03M |
| Net Income | 537.73M | 524.64M | 470.66M | 396.19M | 242.05M |
| Eps Basic | 29.94 | 29.75 | 25.94 | 21.90 | 14.14 |
| Eps Diluted | 29.94 | 29.67 | 25.94 | 21.90 | 14.14 |
| Basic Shares Outstanding | 17.68M | 17.64M | 16.76M | 15.99M | 15.98M |
| Diluted Shares Outstanding | 17.68M | 17.64M | 16.76M | 15.99M | 15.98M |
| Ebit | 1.21B | 1.04B | 887.07M | 706.34M | 452.14M |
| Ebitda | 1.49B | 1.29B | 1.10B | 877.14M | 614.06M |
| Net Income Continuous Operations | 537.73M | 524.64M | 470.66M | 396.19M | 242.05M |
| Minority Interests | -8.31M | -16.21M | -11.91M | -9.14M | -16.11M |
| Preferred Stock Dividends | 0.00 | 0.00 | 0.00 | 0.00 | 0.00 |
| Operating Expense Research And Development | N/A | 49.82M | 35.00M | 31.54M | 16.86M |
| Operating Expense Selling General And Administrative | N/A | 445.83M | 311.07M | 278.67M | 222.44M |
| Non Operating Interest Income | N/A | 6.02M | 5.82M | 5.73M | 5.12M |
Data provided by Twelve Data
Balance Sheet
| fiscal_date | 2026-03-31 | 2025-03-31 | 2024-03-31 | 2023-03-31 | 2022-03-31 |
|---|---|---|---|---|---|
| Cash And Cash Equivalents | 42.85M | 35.16M | 32.49M | 72.79M | 19.02M |
| Accounts Receivable | 4.46B | 4.05B | 3.34B | 2.87B | 2.18B |
| Total Assets | 13.72B | 11.80B | 9.93B | 8.95B | 7.52B |
| Total Liabilities | 7.69B | 6.27B | 5.13B | 4.82B | 3.94B |
| Long Term Debt | 306.53M | 253.66M | 166.15M | 119.15M | 124.07M |
| Shareholders Equity | 6.02B | 5.53B | 4.80B | 4.13B | 3.58B |
Data provided by Twelve Data
Cash Flow Statement
| fiscal_date | 2026-03-31 | 2025-03-31 | 2024-03-31 | 2023-03-31 | 2022-03-31 |
|---|---|---|---|---|---|
| Operating Activities Net Income | 537.73M | 524.64M | 470.66M | 396.19M | 242.05M |
| Operating Activities Other Non Cash Items | 461.09M | 391.97M | 331.19M | 248.50M | 191.80M |
| Operating Activities Accounts Receivable | -396.97M | -553.12M | -558.88M | -688.87M | -181.82M |
| Operating Activities Other Assets Liabilities | -1.09B | -1.28B | -167.25M | -252.22M | -603.29M |
| Operating Activities Operating Cash Flow | 464.82M | -914.00M | 75.72M | -296.41M | -351.26M |
| Investing Activities Purchase Of Investments | -42.00M | -173.62M | -9.74M | -12.35M | 0.00 |
| Investing Activities Sale Of Investments | 18.91M | 31.05M | 10.03M | 4.93M | 6.15M |
| Investing Activities Other Investing Activity | -13.92M | 7.31M | 3.85M | 6.99M | 19.35M |
| Investing Activities Investing Cash Flow | -37.01M | -796.25M | -465.21M | -354.59M | -166.50M |
| Financing Activities Long Term Debt Issuance | 57.69M | 93.28M | 52.07M | 0.00 | 0.00 |
| Financing Activities Short Term Debt Issuance | 683.24M | 1.01B | 254.82M | 293.70M | 521.24M |
| Financing Activities Common Stock Issuance | 0.00 | 240.56M | 229.76M | 181.03M | 0.00 |
| Financing Activities Common Dividends | -45.99M | -45.89M | -37.70M | -28.77M | -1.90M |
| Financing Activities Other Financing Charges | -6.95M | 21.74M | 3.42M | -6.56M | -67.66M |
| Financing Activities Financing Cash Flow | 687.99M | 1.32B | 502.37M | 439.41M | 451.68M |
| End Cash Position | 42.85M | 35.16M | 120.72M | 173.88M | 117.46M |
| Free Cash Flow | -172.06M | -809.62M | -231.82M | -151.33M | -317.92M |
| Investing Activities Capital Expenditures | N/A | -660.99M | -469.35M | -378.06M | -192.00M |
| Investing Activities Net Acquisitions | N/A | N/A | 0.00 | 23.89M | 0.00 |
| Financing Activities Long Term Debt Payments | N/A | N/A | N/A | N/A | N/A |
Data provided by Twelve Data
Technical Analysis
Key Insights
- The current trend direction for Salzer Electronics shows a downward movement from the 52-week high of ₹952.50 to the current price near ₹571, indicating bearish price action over the past year.
- Key support levels are observed near the 52-week low of ₹488.80, while resistance is evident around the 50-day moving average at ₹616.69 and the 200-day moving average at ₹640.03.
- The stock is trading below both the 50-day and 200-day moving averages, suggesting a lack of upward momentum in the medium to long term.
- Momentum indicators such as RSI and MACD currently reflect moderate bearish momentum with no strong oversold or overbought signals, indicating consolidation.
- Multi-timeframe analysis reveals consistent weakness on daily and weekly charts, with monthly charts confirming a longer-term downtrend from the previous highs.
- Potential market scenarios include continued price consolidation near current levels with possible retests of support around ₹488, or a recovery attempt if the stock breaks above the moving averages and resistance zones.
Trending News
1. Headline: Salzer Electronics slips after Q1 adjusted PAT drops 53% YoY | Capital Market News - Business Standard
Summary: Salzer Electronics fell 6.19% to Rs 571.25 after reporting weaker profitability for the quarter ended 30 June 2026.
Sentiment: negative
Summary: Stock Market LiveStocks to watchFinancial FreedomMilk prices Increase in MaharashtraQ1 ResultsDhoot Transmission IPOAmarnath Yatra suspendedQuit India Movement AnniversaryOTT Releases · Home / Markets / Capital Market News / Salzer Electronics consolidated net profit declines 53.47% in the ...
Sentiment: negative
3. Headline: Salzer Electronics Q1 Results: Net profit falls 52% YoY to ₹8.47 crore
Summary: Salzer Electronics reported Q1FY26 standalone net profit of ₹846.92 lakh, down 52% YoY, despite revenue rising 12.4% to ₹485.96 crore. Consolidated PAT fell 53.5% to ₹803.99 lakh. The Board approved re-appointments for D Rajesh Kumar, N. Rangachary, and V. Sankaran.
Sentiment: negative
4. Headline: Salzer Electronics Reports Q1 Standalone Net Profit Of 85M Rupees, Revenue At 4.85B Rupees
Summary: Salzer Electronics' Q1 FY27 results showcased a widening disconnect between sales expansion and bottom-line delivery. Operational revenue expanded to ₹485
Sentiment: positive
5. Headline: Salzer Electronics hosts Q1 FY27 earnings call on Aug 10
Summary: Salzer Electronics Limited is holding an earnings call on August 10, 2026, to review Q1 FY27 performance. Joint Managing Director D Rajesh Kumar will lead the discussion on operational and financial metrics. Global dial-in numbers and registration links have been provided for investor access.
Sentiment: neutral
Powered by Brave
Recent Updates
News Summary
As of August 11, 2026. Salzer Electronics reported a significant decline in Q1 FY27 net profit, falling 52% year-over-year to ₹8.47 crore despite a 12.4% increase in revenue to ₹485.96 crore. The consolidated net profit also dropped by over 53%, impacted by higher expenses and a share of loss from associates. The Board approved the re-appointment of key directors including Joint Managing Director D Rajesh Kumar, ensuring leadership continuity. Quarterly results indicated rising costs outpacing revenue growth, leading to margin compression. The company held an earnings call on August 10, 2026, to discuss these results and future outlook, emphasizing transparency with investors.
News Sentiment
The overall sentiment from recent updates is predominantly negative, driven by the sharp decline in quarterly profitability despite revenue growth. Margin pressures and increased expenses have weighed on earnings, contributing to investor concerns. However, positive aspects include leadership stability with director re-appointments and ongoing communication with shareholders through earnings calls. This mixed sentiment reflects operational challenges tempered by governance continuity and efforts to maintain investor relations. The outlook remains cautious given the financial performance trends.
Source List
- https://scanx.trade/stock-market-news/companies/salzer-electronics-q1-results-net-profit-falls-52-yoy-to-8-47-crore/47832455
- https://www.alphaspread.com/security/nse/salzerelec/investor-relations
- https://www.theglobeandmail.com/investing/markets/markets-news/Tipranks/2123361/salzer-electronics-submits-q4-and-full-year-investor-presentation-to-exchange/
- https://blinkx.in/insights/results/salzer-electronics-ltd-quarterly-result
- https://economictimes.indiatimes.com/salzer-electronics-ltd/stocksupdate/companyid-12008.cms
Analytical Overview
Analysis Summary
Salzer Electronics’ valuation metrics, including a trailing P/E of 19.06 and P/B of 1.70, are below many industry peers, suggesting a relatively attractive valuation compared to the sector average P/E of 19.06. The absence of a forward P/E limits forward-looking valuation insights. Revenue growth of 26.2% quarterly and 12.4% YoY in Q1 indicates a positive growth trajectory, though cash flow trends show operating cash flow of ₹46.48 crore but negative free cash flow of ₹-118.25 crore, highlighting cash generation challenges. The company’s debt-to-equity ratio of 88.78% signals elevated leverage, which may impact financial health and risk profile. Sector-specific challenges include rising raw material costs and competitive pressures in the electrical equipment industry, while opportunities stem from expanding industrial automation and infrastructure development in India. Given the Indian market context, regulatory environment and economic outlook remain important factors influencing growth and operational stability.
Overall Business and Market Assessment
Supporting Factors: moderate valuation relative to peers, consistent revenue growth, and stable leadership evidenced by recent board re-appointments
Risk Factors: margin pressures from rising expenses, high leverage, and negative free cash flow impacting liquidity
SWOT Analysis
Strengths
- Established market presence with diversified electrical product portfolio.
- Strong brand reputation supported by technological integration in manufacturing.
- Moderate profitability with a return on equity of 9.31%.
- Stable leadership with recent re-appointments of key directors.
Weaknesses
- High debt-to-equity ratio of 88.78% indicating elevated financial leverage.
- Negative free cash flow of ₹-118.25 crore reflecting cash generation challenges.
- Profit margins under pressure with net margin at 3.01%.
- Stock price volatility with a 52-week decline of over 53%.
Opportunities
- Growing demand for electrical components in industrial automation and infrastructure.
- Expansion potential in renewable energy and smart meter segments.
- Increasing exports contributing to revenue diversification.
- Potential operational efficiencies to improve margins.
Threats
- Rising raw material and operational costs impacting profitability.
- Competitive pressures from larger industry players with higher ROE.
- Macroeconomic uncertainties affecting industrial capital expenditure.
- Regulatory changes in the electrical equipment sector.
Company Description
Salzer Electronics Ltd. is a prominent electrical and electronics manufacturing company based in India. It specializes in producing a wide array of electrical installation components and systems, including wiring ducts, cable channels, and industrial switches. The primary function of Salzer Electronics is to supply essential components to industries such as automotive, renewable energy, real estate, and infrastructure development. Notable for its emphasis on quality and innovation, Salzer Electronics integrates advanced technology into its manufacturing processes, ensuring reliability and performance. The company plays a critical role in industrial automation by offering solutions that enhance operational efficiency and safety. Salzer Electronics Ltd. has established a significant market presence both domestically and internationally, contributing to the growth of the manufacturing sector. Its commitment to customer satisfaction and continuous improvement has enabled it to build a strong brand reputation in the global electrical components industry.