
Sagar Cements Ltd (SAGCEM)
Stock Analysis Report
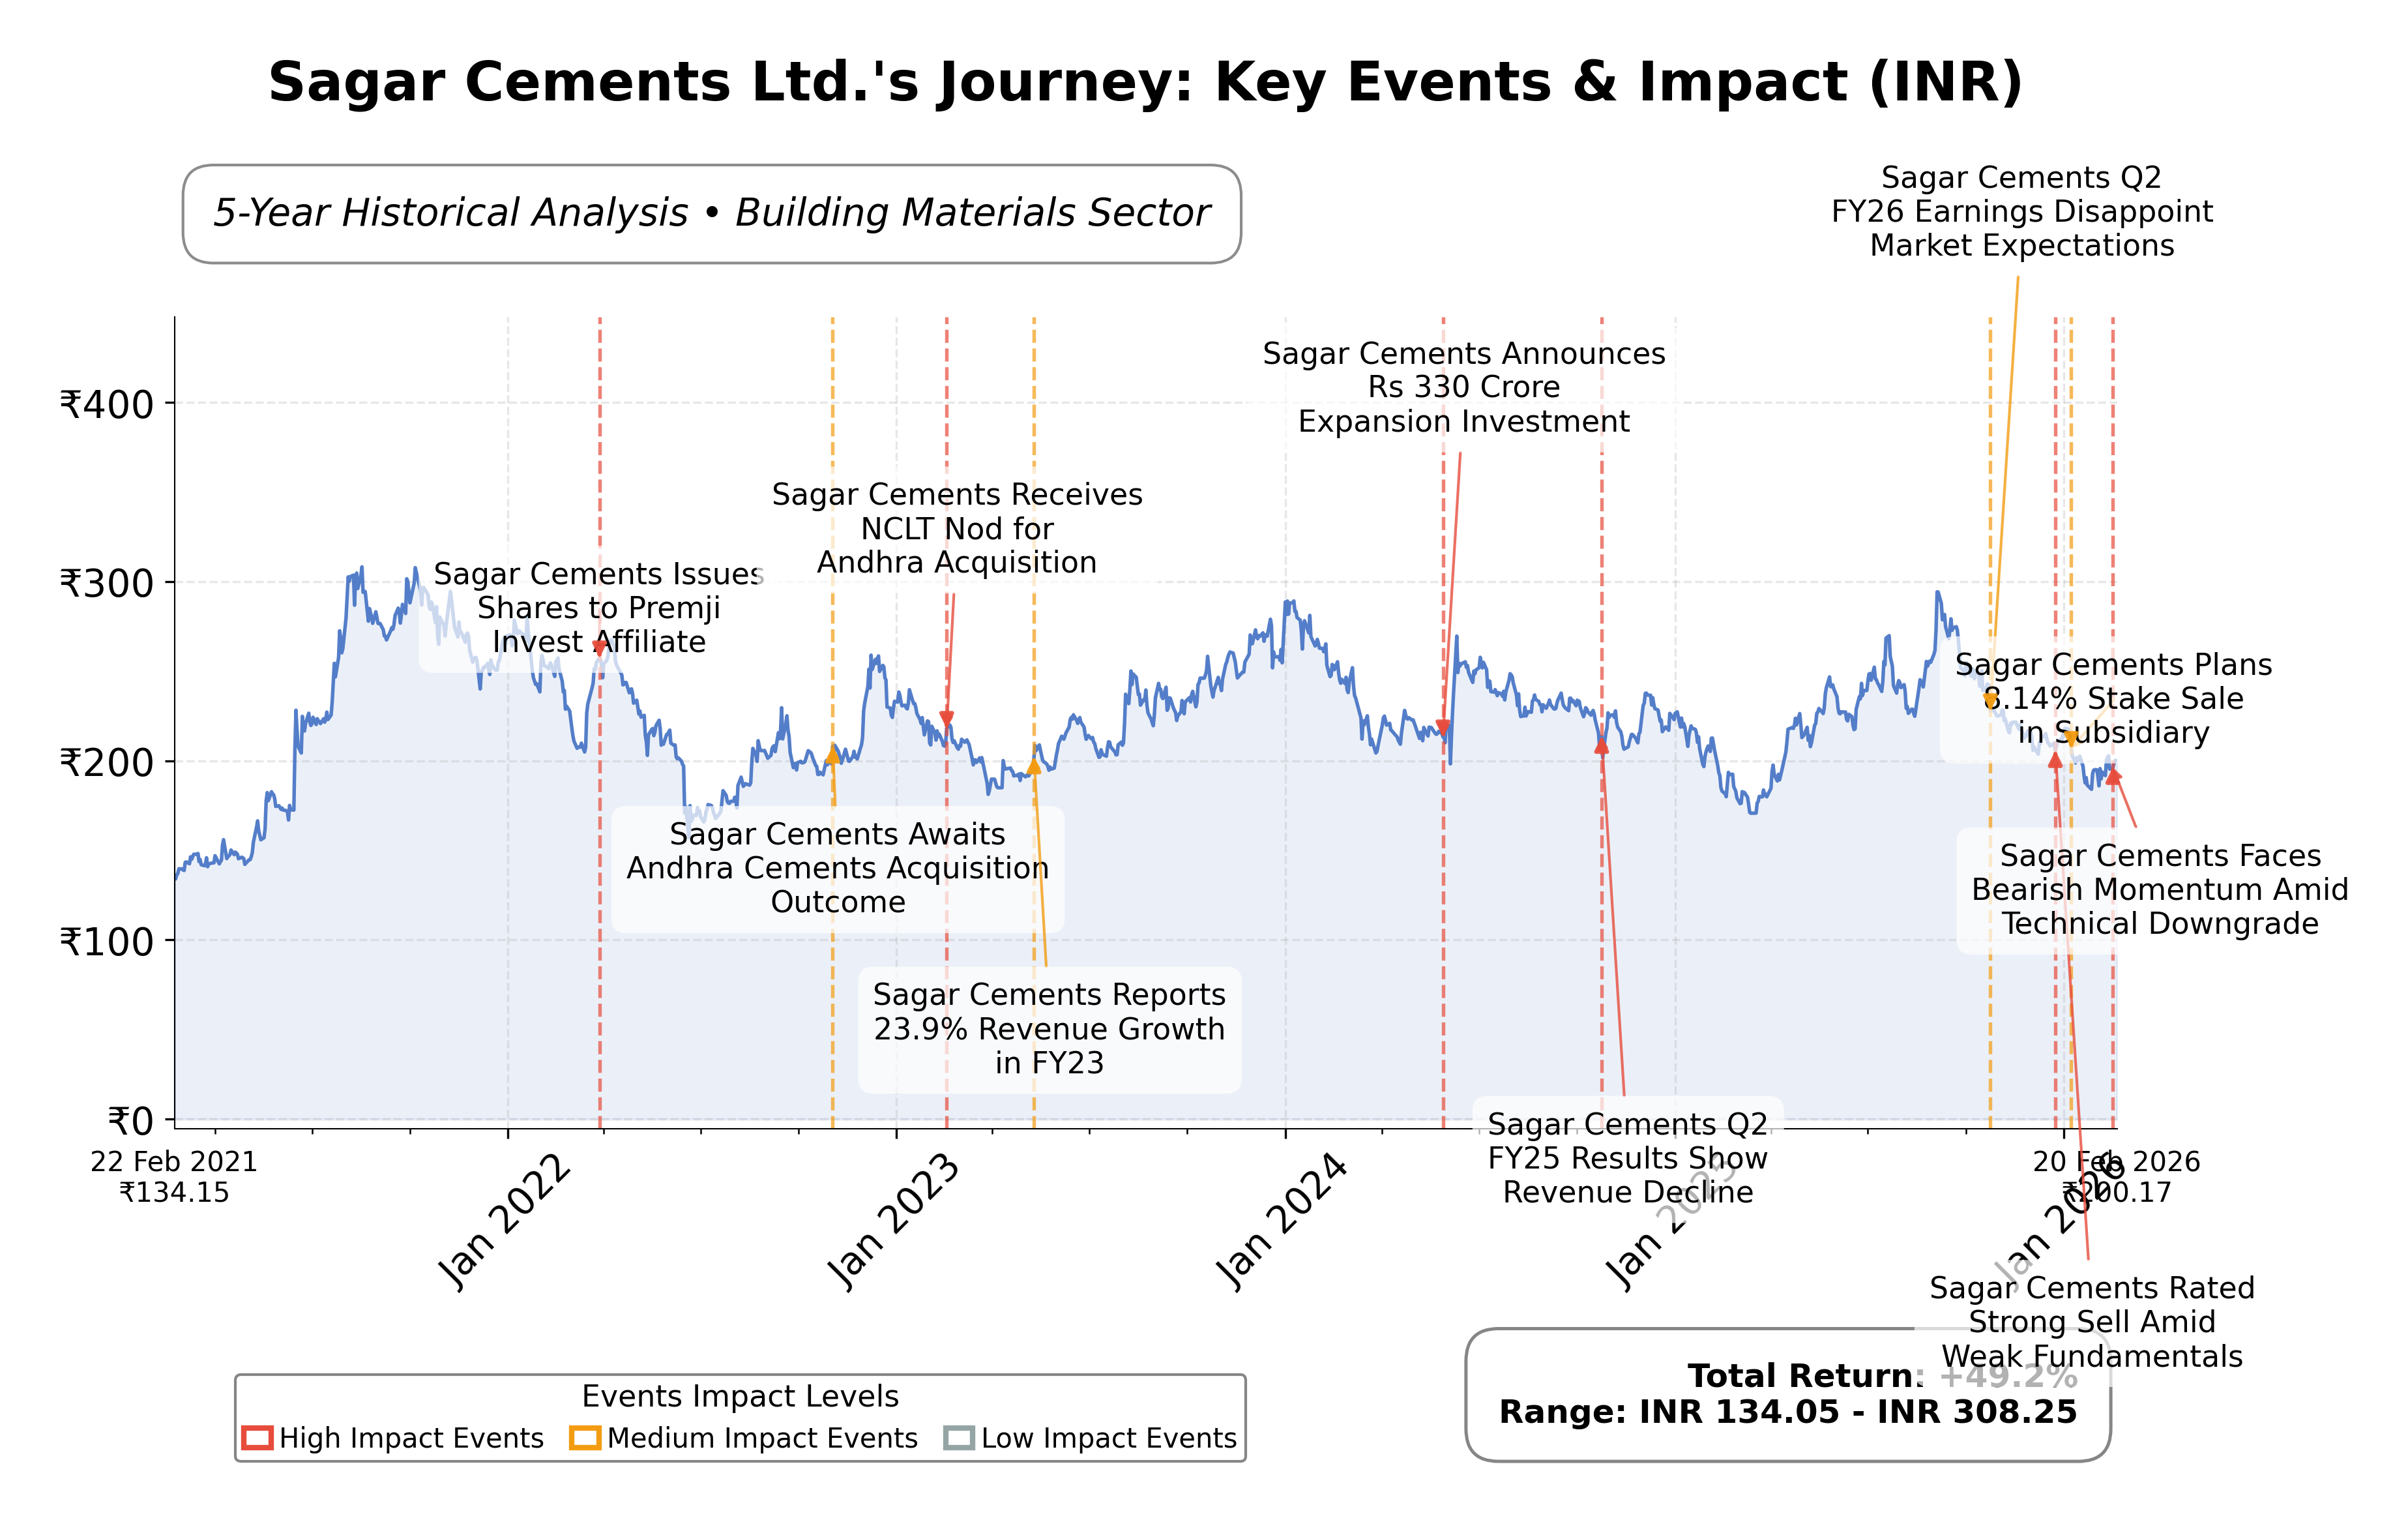
Stock Journey
Key Positives and Key Risks
Pros
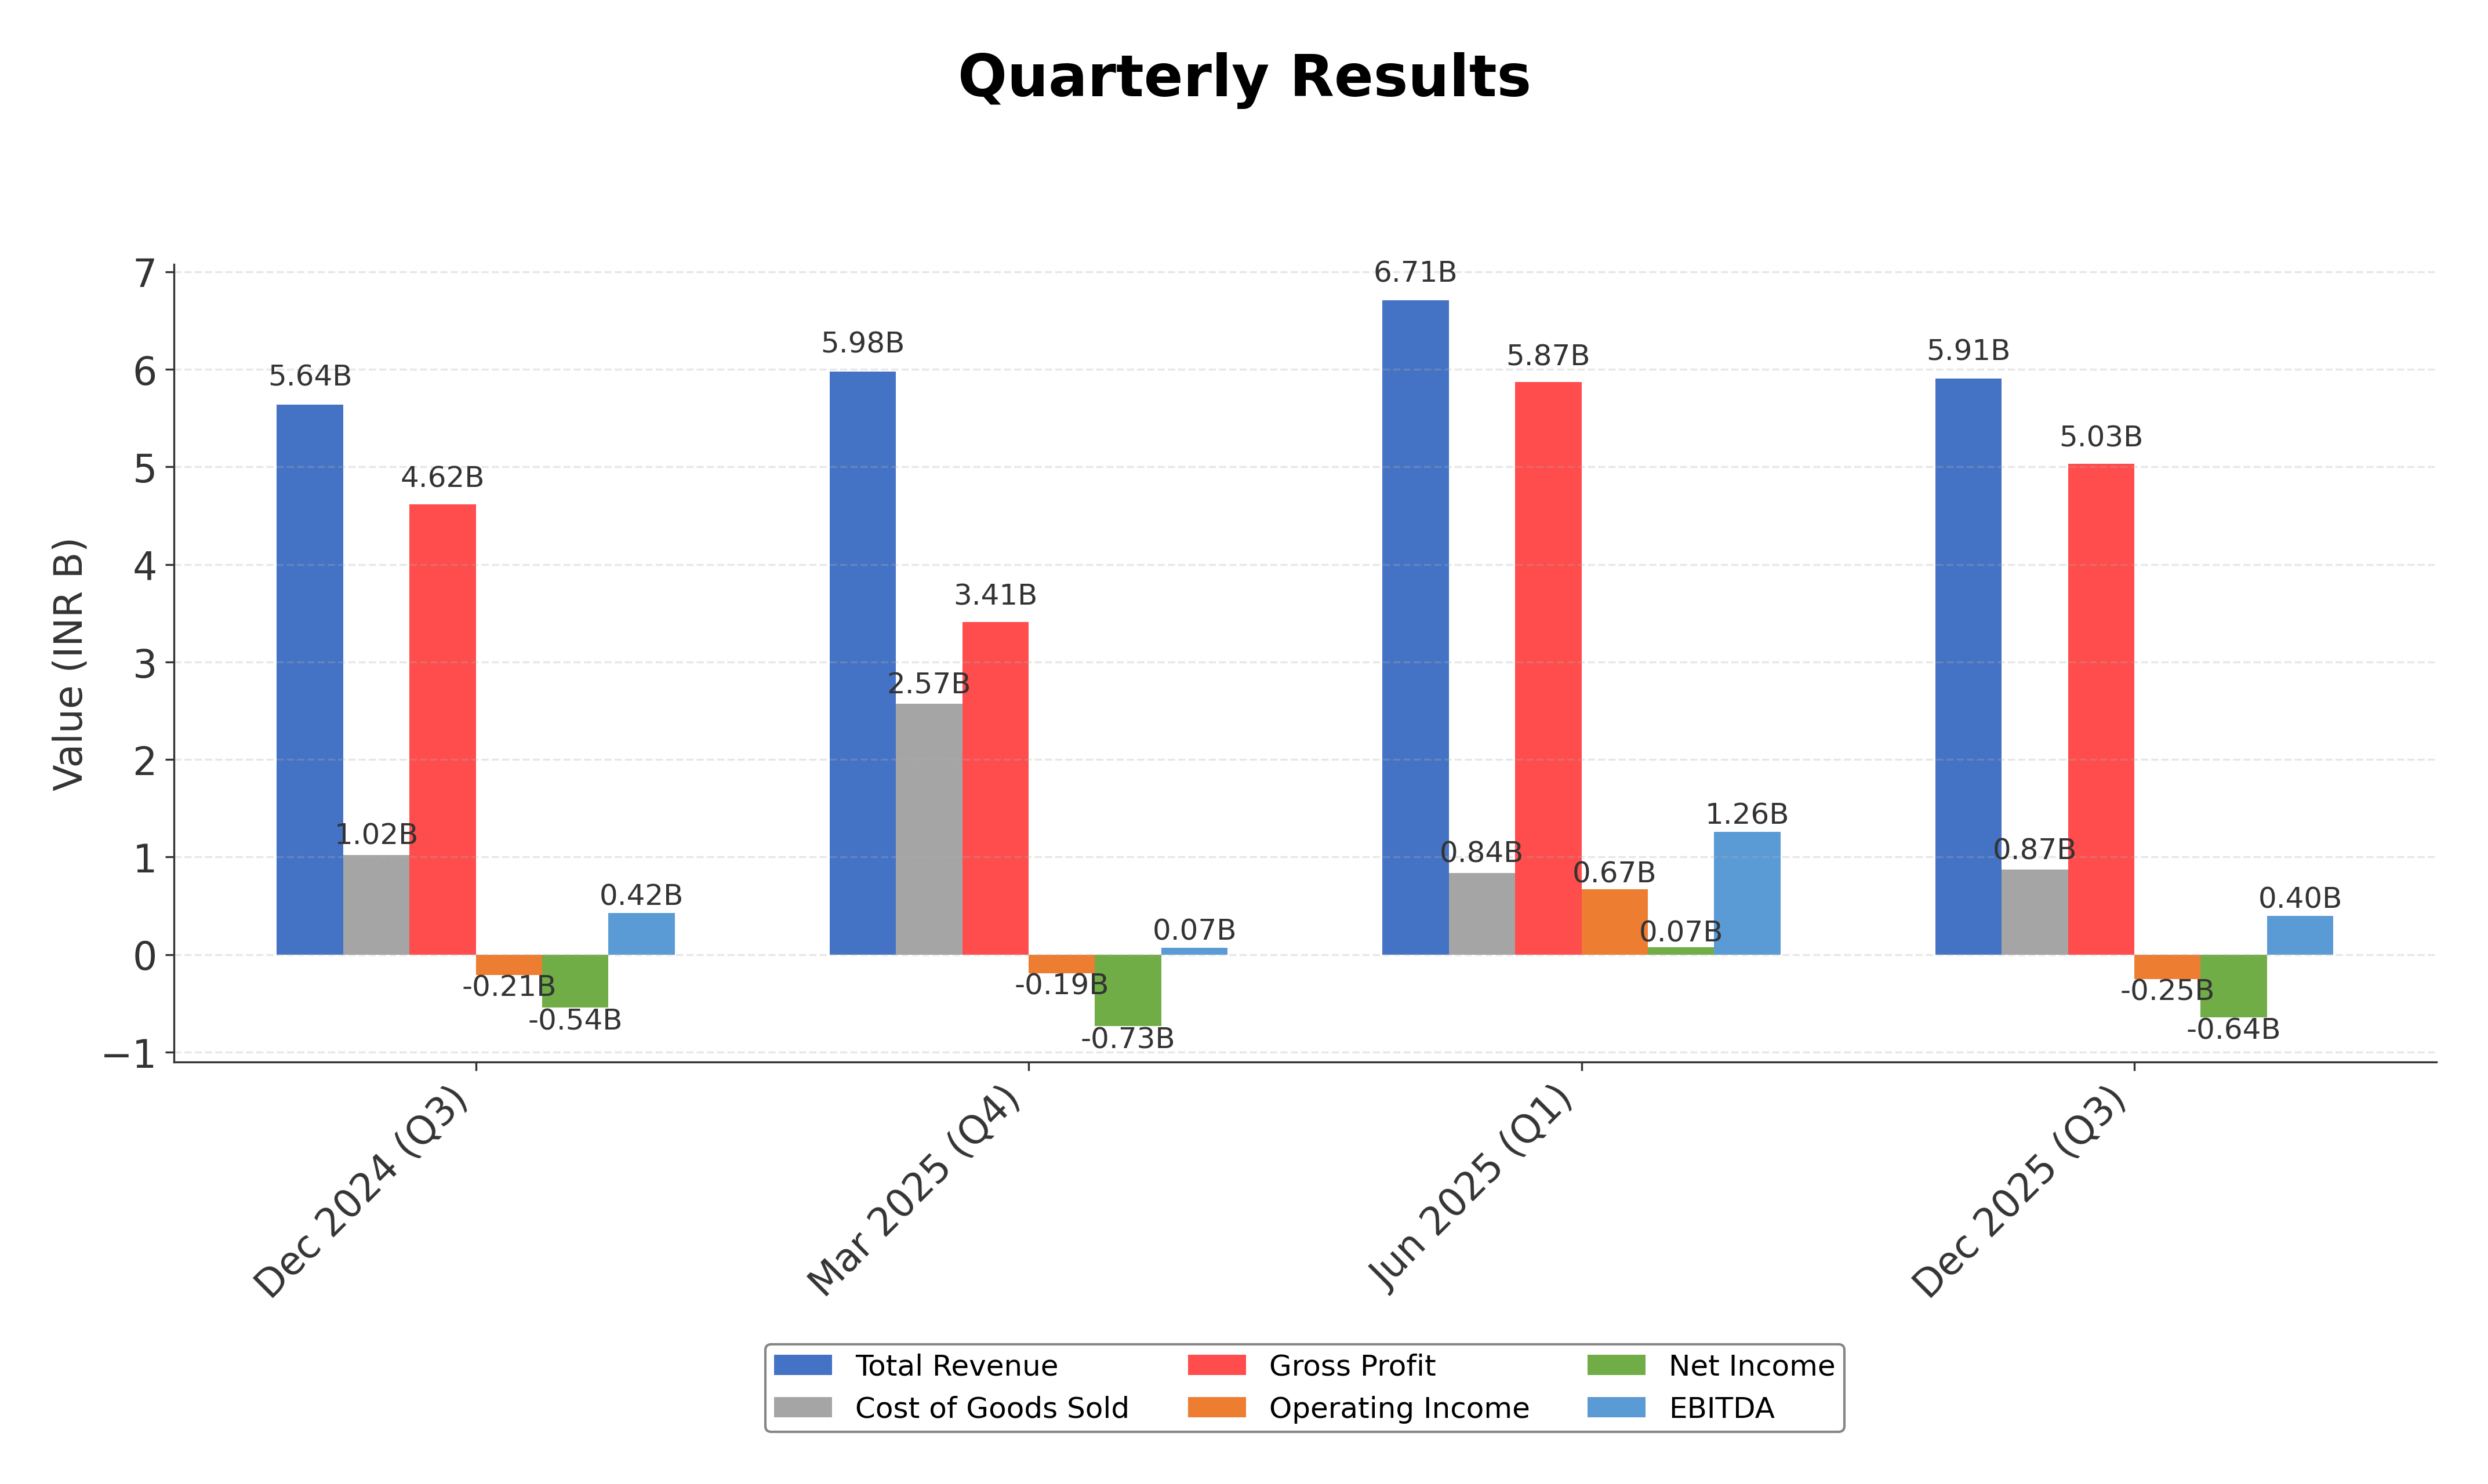
- Revenue growth of 4.7% quarterly indicates steady top-line expansion amid challenging conditions.
- Market capitalization of ₹26.22 billion positions the company as a mid-sized player with room for growth.
- Strategic sustainability partnership with Sow & Reap reflects innovation and alignment with environmental trends.
Cons
- Negative net income of ₹-1.69 billion and operating margin of -4.3% highlight ongoing profitability issues.
- High debt-to-equity ratio of 93.3% and current ratio of 0.58 indicate financial leverage and liquidity risks.
- Negative price-to-cash-flow ratio (-42.63) suggests weak cash generation relative to peers.
Disclosure: This information is for general awareness and does not constitute investment advice
Report Summary
Sagar Cements Ltd. operates primarily in the Indian cement manufacturing industry, producing various types of cement such as ordinary Portland cement (OPC) and Portland pozzolana cement (PPC). The company supports infrastructure, housing, and commercial construction sectors with a strong regional presence centered around Hyderabad, India. Its operations emphasize modern manufacturing techniques and sustainability initiatives, aligning with India's growing infrastructure demands.
Financially, Sagar Cements reports a market capitalization of approximately â¹26.22 billion with a trailing P/E ratio of 61.76 and a forward P/E of 381.28, indicating high valuation multiples relative to earnings expectations. The company posted a negative net income of â¹-1.69 billion over the trailing twelve months, with a profit margin of -6.72% and operating margin of -4.30%. Its enterprise value to EBITDA stands at 15.14, while the price-to-book ratio is 1.49. The firm exhibits a current ratio below 1 (0.58), a high debt-to-equity ratio near 93.3%, and negative operating and free cash flows, reflecting liquidity and leverage challenges.
Technically, the stock shows bearish momentum with recent price declines and trading below the 200-day moving average, while momentum indicators such as RSI and MACD signal caution. Recent strategic moves include a 10-year partnership with Sow & Reap for biochar and gasification units, reflecting a focus on sustainability. Leadership and ownership remain stable with insiders holding approximately 0.69% and institutions about 18%, though the company faces risks from high leverage, negative profitability, and sector pricing pressures.
Compared to regional peers like JK Cement, India Cements, ACC, Ramco Cements, and Grasim Industries, Sagar Cements has a significantly smaller market cap and higher valuation multiples such as P/E and EV/EBITDA. While peers like ACC and Grasim demonstrate stronger profitability and healthier cash flows, Sagar Cements lags in financial performance and operational metrics. Its price-to-cash-flow ratio is notably negative, contrasting with positive ratios among most peers, indicating relative weakness in cash generation.
Sagar Cements navigates a competitive and capital-intensive industry marked by cyclical demand and pricing pressures. The companyâs recent achievements in sustainability partnerships and operational adjustments occur amid ongoing challenges including negative earnings, high leverage, and technical downtrends. The stakes involve balancing growth initiatives with financial stability in a market environment where pricing discipline and capacity management are critical. Given the current financial and technical profile, a neutral or watchful stance may be appropriate for those monitoring the stockâs evolving fundamentals and market conditions.
Company and Industry Overview
Company Basics
Price Performance
Company Size
Shareholding Pattern
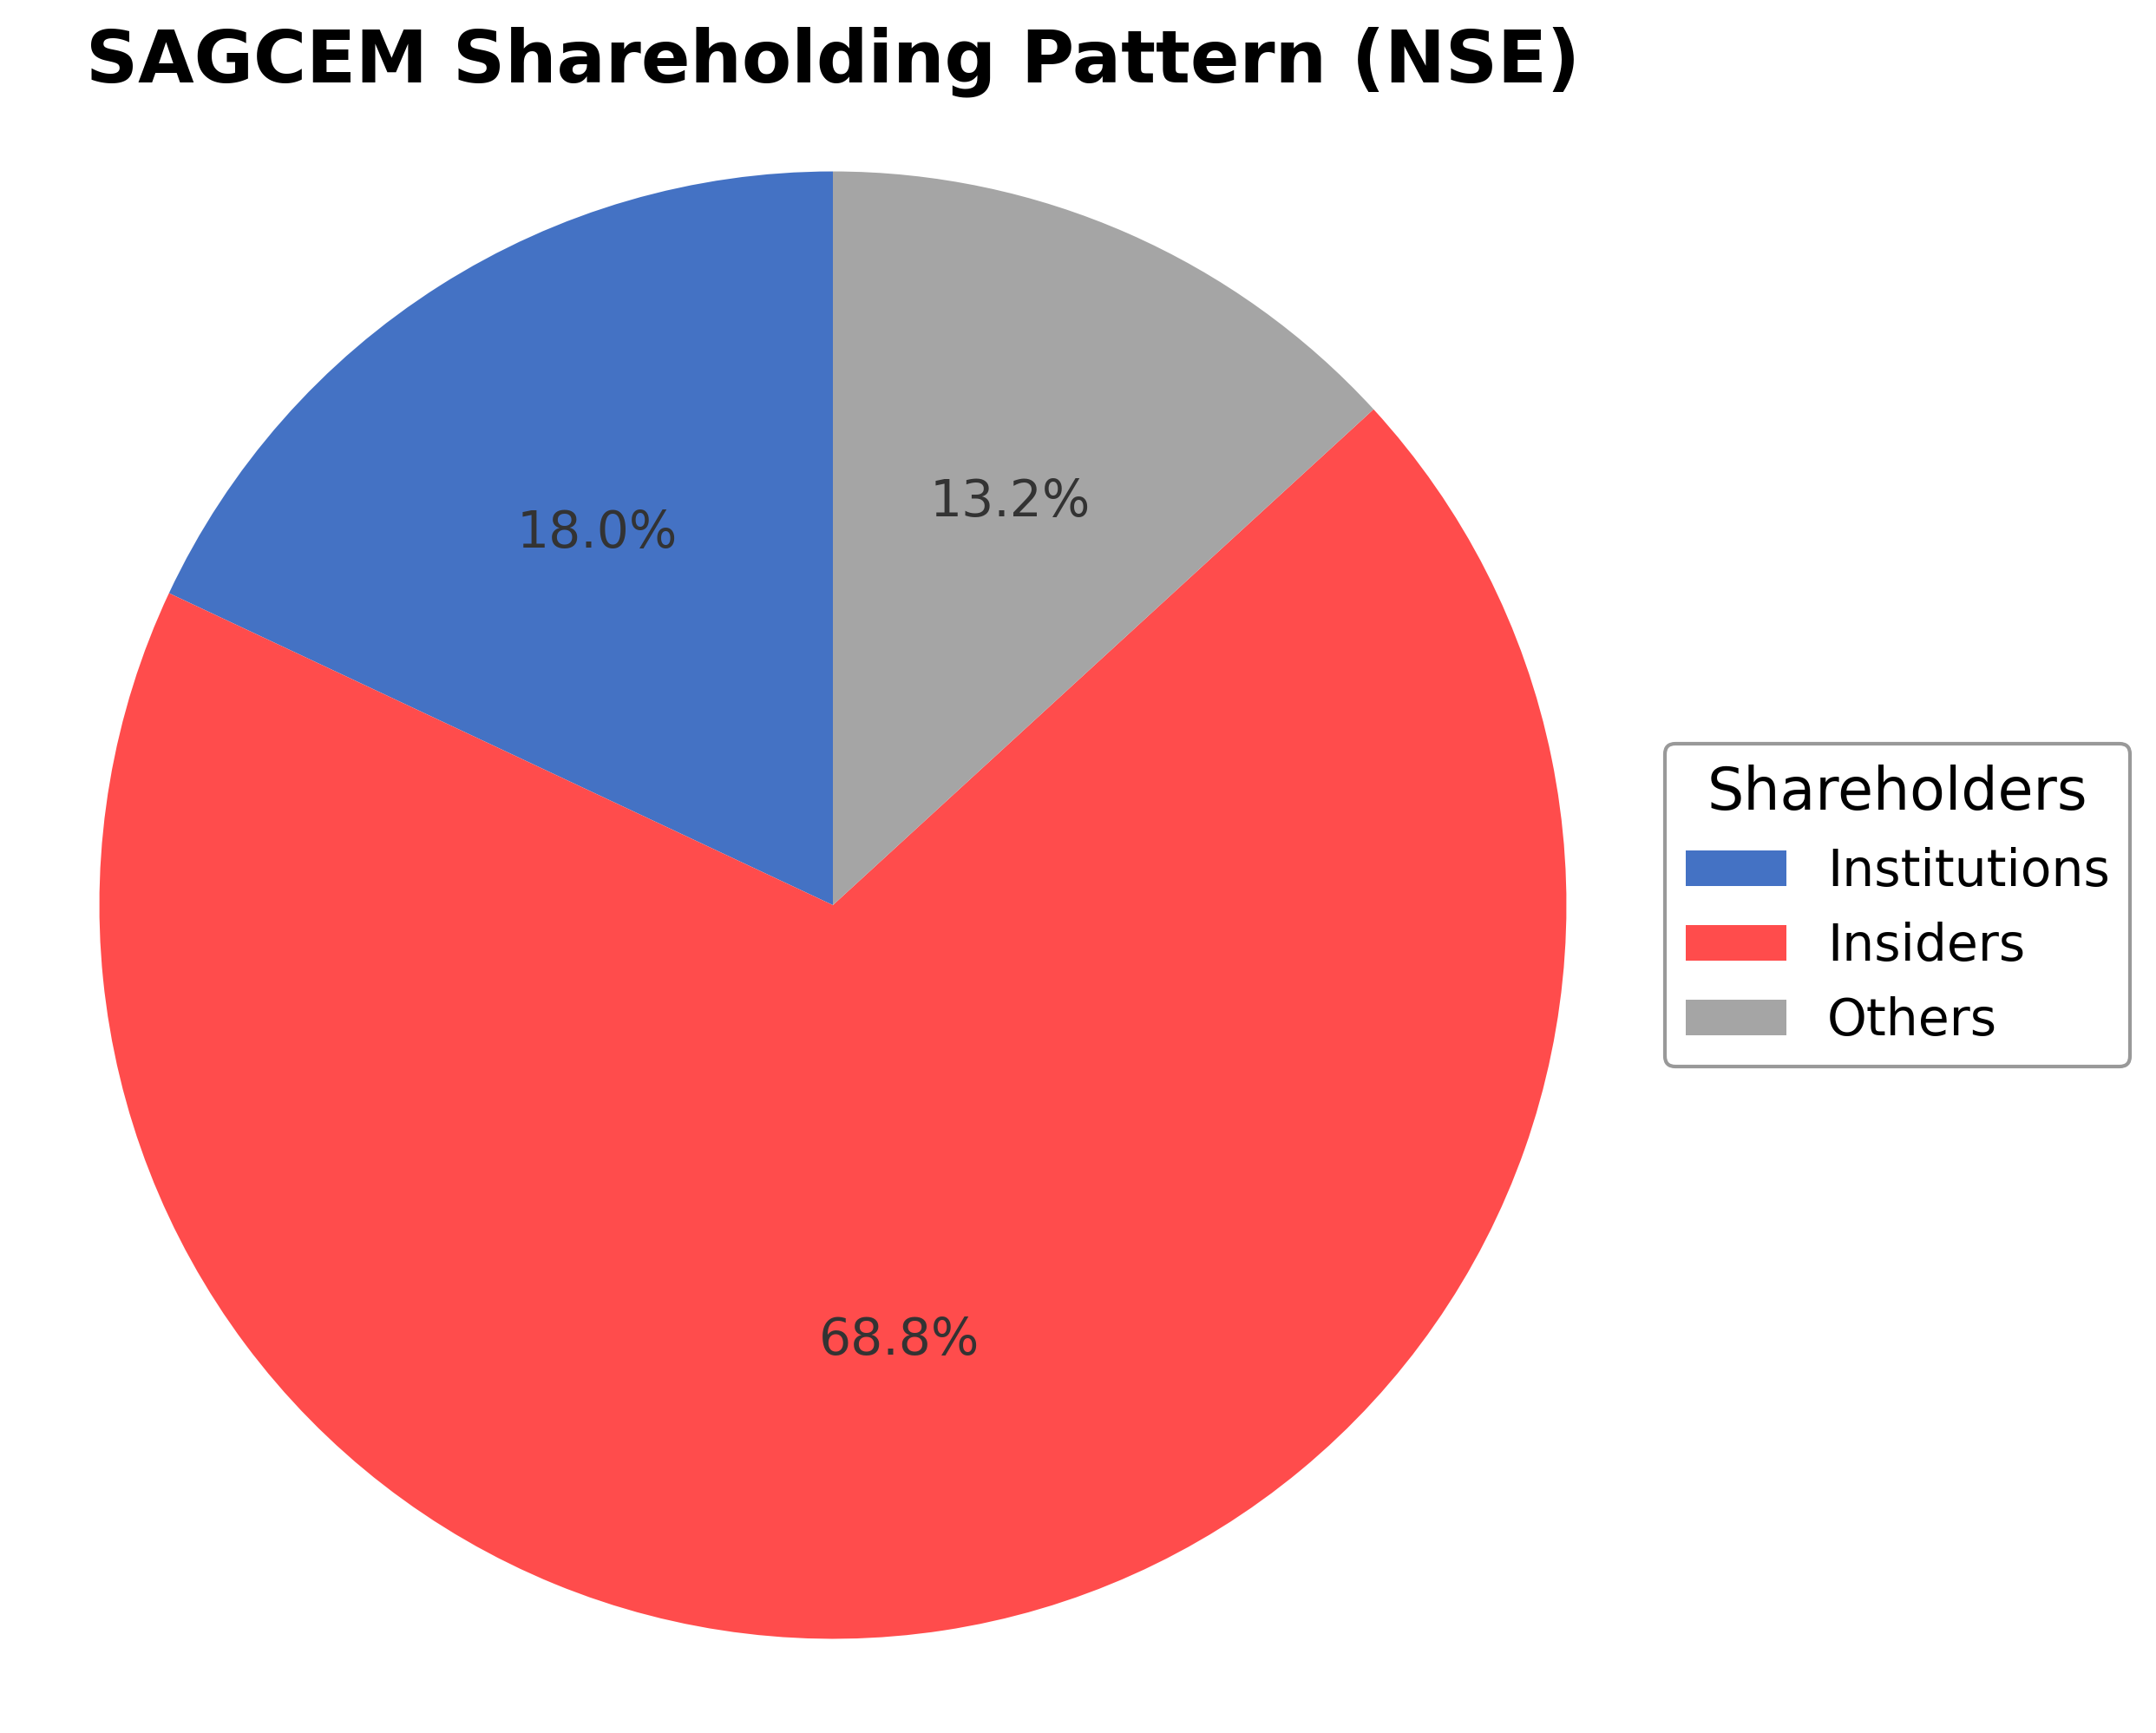
Sagar Cements Ltd.'s ownership structure comprises approximately 0.69% held by insiders including executives and board members, 18.01% by institutional investors such as mutual funds and asset managers, and the remaining 81.30% by public shareholders including retail investors and employee stock plans. Over the past 12-24 months, institutional holdings have shown moderate activity without significant shifts in major positions. Notable institutional investors have maintained stable stakes, indicating steady market sentiment. This distribution suggests a predominantly public ownership base with moderate institutional influence, which may impact governance dynamics and strategic decision-making. The current shareholding pattern reflects typical market participation for a mid-sized Indian cement company operating in a competitive building materials sector.
Sector and Industry Analysis
Sector and Industry Analysis: Cement Sector – India (Context for Sagar Cements Ltd.)
1. Sector Overview: The Indian cement sector is a critical component of the country’s infrastructure and real estate development, representing one of the largest cement producers globally with an annual production capacity exceeding 500 million tonnes. The sector has exhibited a steady growth trajectory, driven by robust demand from infrastructure projects, affordable housing schemes, and urbanization. Key players include UltraTech Cement, ACC, Ambuja Cements, Shree Cement, and Sagar Cements Ltd., among others, with a mix of large integrated producers and regional players. The market is characterized by fragmented regional demand but is consolidating gradually through capacity expansions and acquisitions. The sector’s contribution to GDP and employment is significant, underscoring its strategic importance.
2. Industry Trends: Technological advancements in manufacturing processes, such as the adoption of energy-efficient rotary kilns, waste heat recovery systems, and automation, are reshaping operational efficiencies and cost structures. There is a growing emphasis on sustainable cement production, with increased use of alternative fuels and supplementary cementitious materials to reduce carbon footprint. Consumer behavior is influenced by government-led affordable housing initiatives and infrastructure spending, which create cyclical demand patterns. Emerging opportunities lie in the expansion of rural infrastructure, smart city projects, and export potential to neighboring countries. Digitization in supply chain management and sales channels is also gaining traction, improving market responsiveness.
3. Regulatory Landscape: The cement industry operates under stringent environmental regulations related to emissions, mining leases, and resource utilization, governed by bodies such as the Ministry of Environment, Forest and Climate Change (MoEFCC) and state pollution control boards. Compliance with the National Green Tribunal (NGT) directives on air pollution and waste management is mandatory. Additionally, mining regulations impact raw material availability and cost. The government’s infrastructure policies, including the National Infrastructure Pipeline (NIP), and incentives for green energy adoption influence sector dynamics. Taxation policies, including GST rates on cement and input materials, also affect pricing and profitability.
4. Competitive Dynamics: The Indian cement market exhibits an oligopolistic structure with a few dominant players controlling a significant market share, while numerous regional players compete on price and distribution reach. Barriers to entry include high capital expenditure for plant setup, access to quality limestone reserves, and regulatory approvals. Established players benefit from economies of scale, integrated supply chains, and brand recognition. Competitive positioning hinges on cost leadership, product quality, distribution network strength, and innovation in sustainable products. Strategic alliances, capacity expansions, and backward integration into raw materials are common competitive strategies. Price volatility driven by input costs and regional demand-supply imbalances remains a key challenge.
Note: Analysis synthesized from industry research, market reports, and regulatory filings. Information is subject to change based on market conditions.
Illustrative Scenario Analysis
DCF Assumptions:
Method: Two-Stage EPS-Priority Model
Financials
Peer Analysis
| Company Name | Market Cap | P/E Ratio | P/B Ratio | EV/EBITDA | Price to CFO |
|---|---|---|---|---|---|
| Sagar Cements Ltd. | ₹26.22B | 61.76 | 1.49 | 15.14 | -42.63 |
| JK Cement Ltd. | ₹444.14B | 42.92 | 6.85 | 20.37 | 33.76 |
| India Cements Ltd. | ₹196.72B | 439.42 | 1.32 | 158.53 | 30.35 |
| Acc Ltd. | ₹302.83B | 11.45 | 1.52 | 10.32 | 26.26 |
| Ramco Cements Limited | ₹263.16B | 45.38 | 3.46 | 22.52 | 39.55 |
| Grasim Industries Ltd. | ₹1.92T | 42.55 | 1.93 | 12.99 | -9.18 |
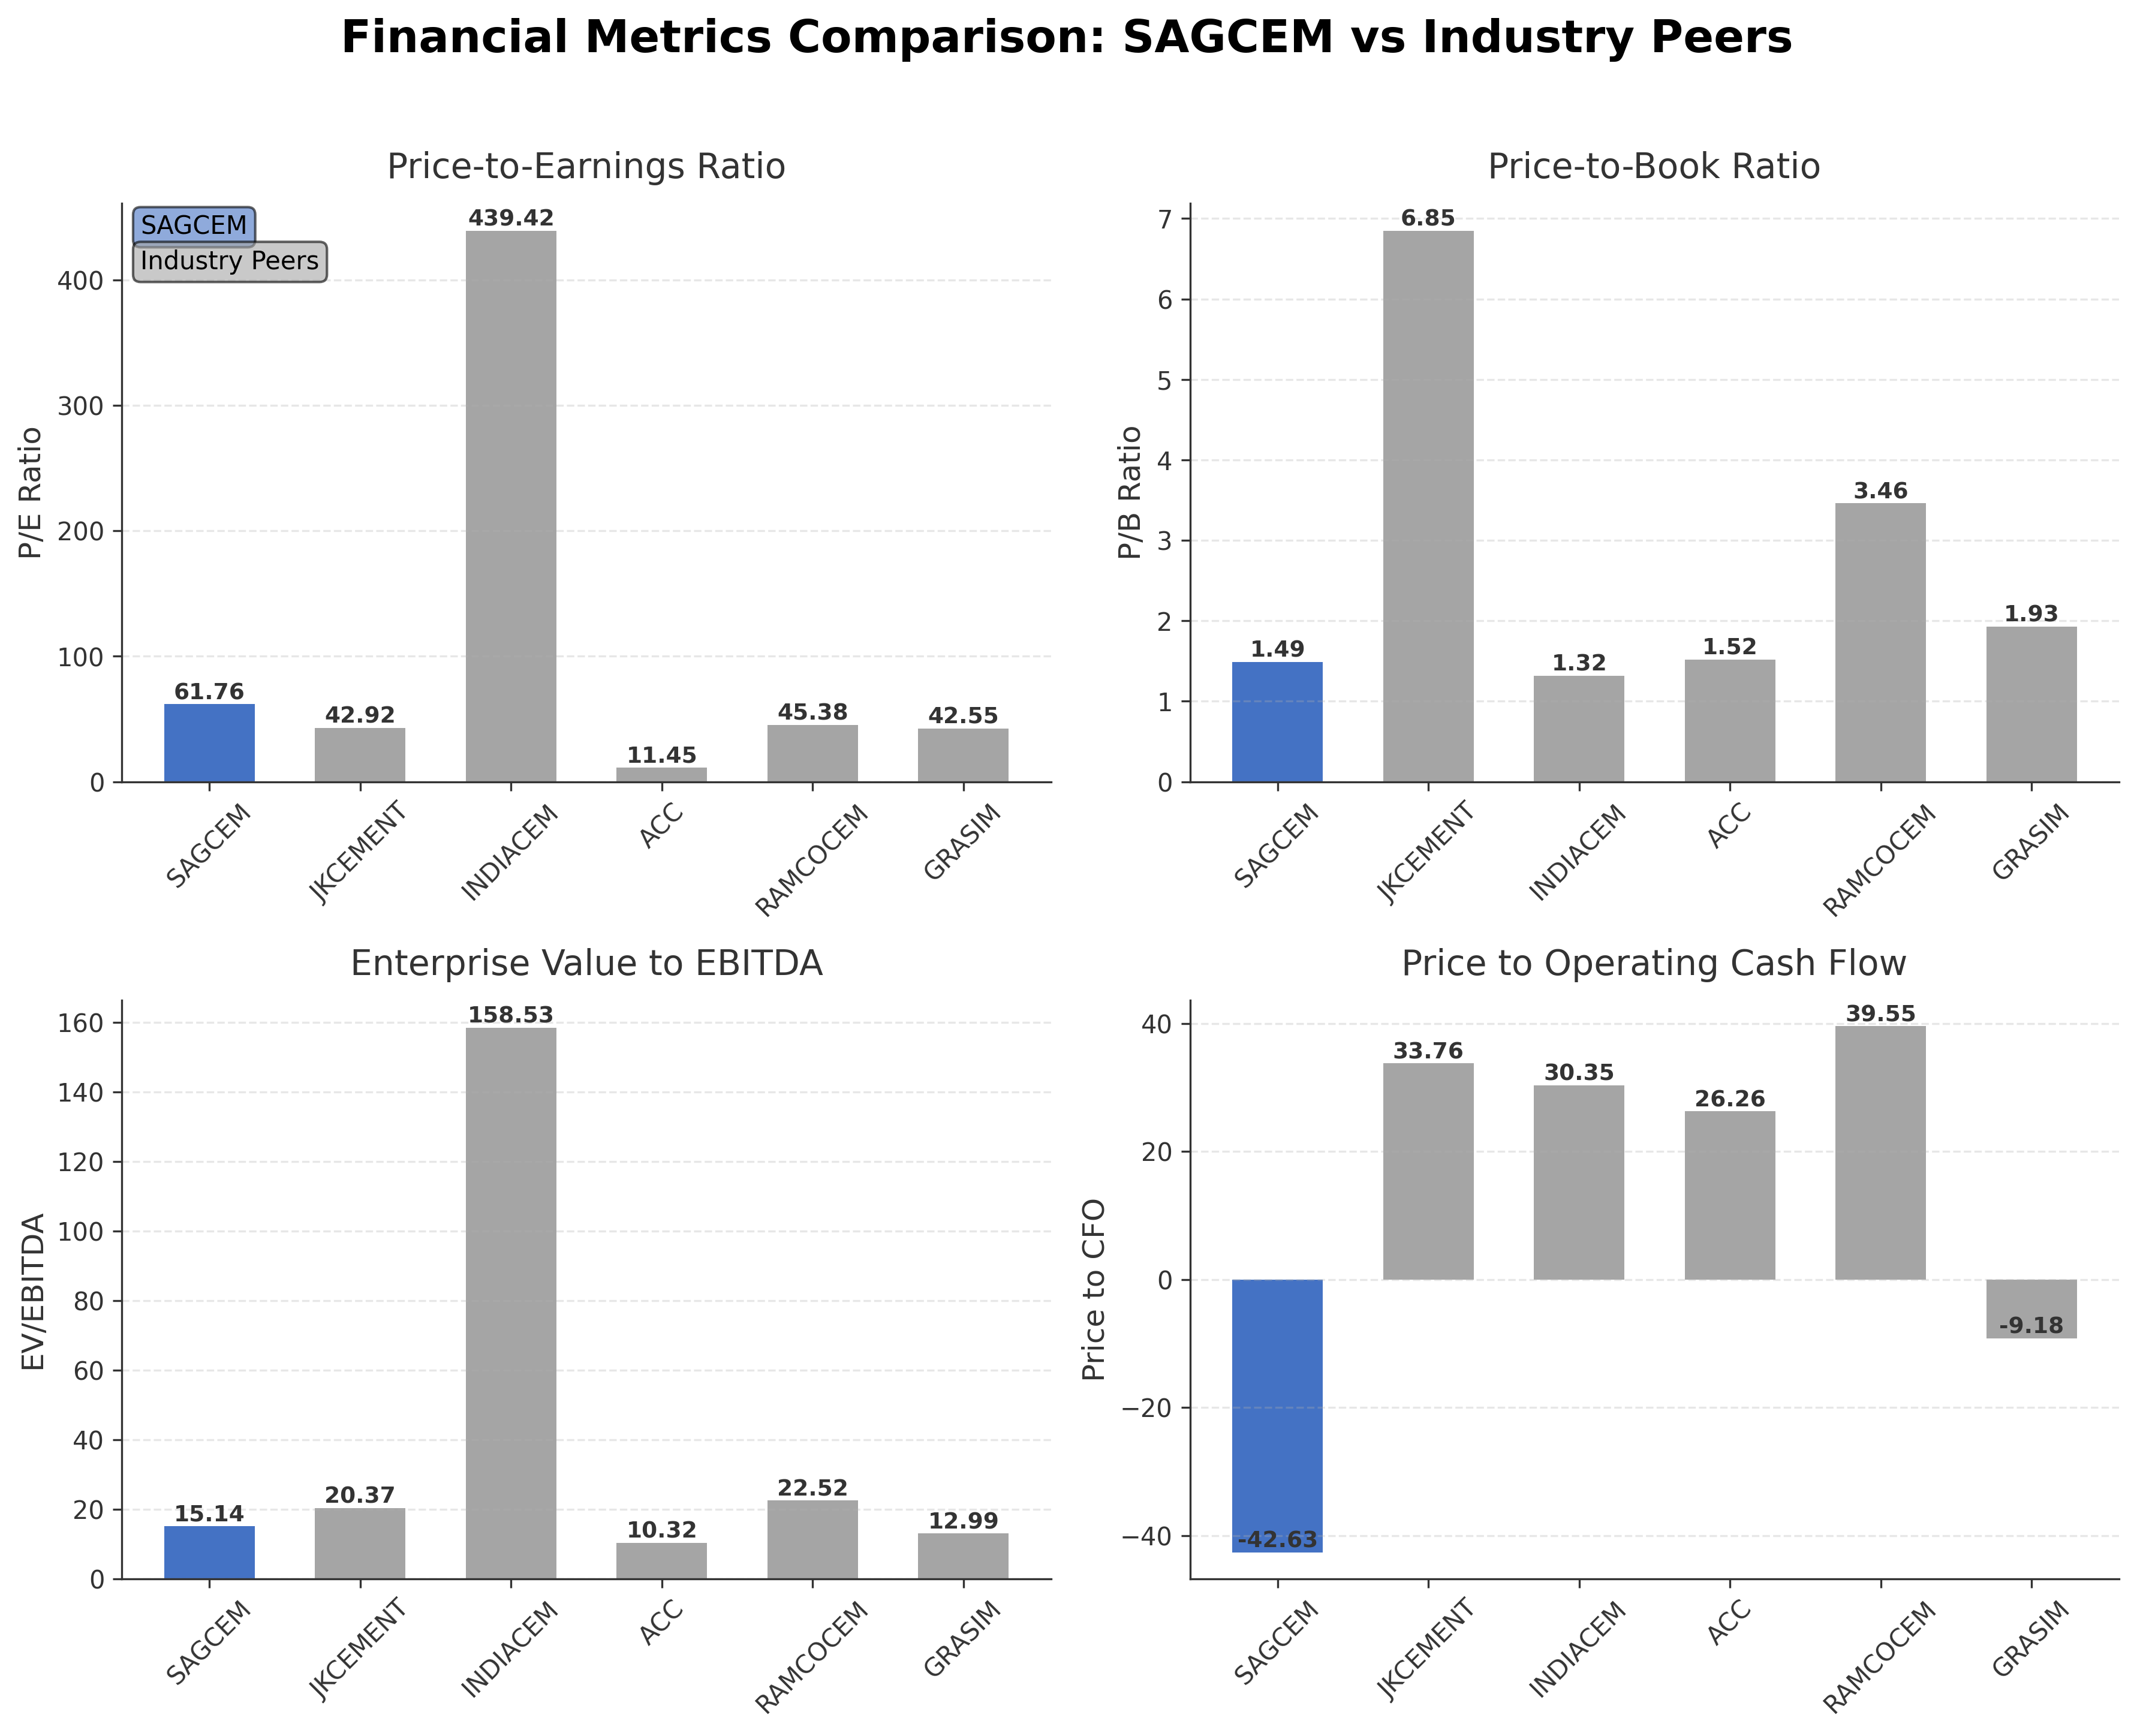
Comparison Analysis: Sagar Cements Ltd. has a smaller market capitalization relative to its regional peers and trades at a higher P/E ratio of 61.76 compared to ACC's 11.45 and Grasim's 42.55. Its price-to-book ratio of 1.49 is moderate but lower than JK Cement's 6.85 and Ramco Cements' 3.46. The company's EV/EBITDA multiple of 15.14 is below JK Cement and Ramco Cements but above ACC and Grasim, indicating mixed valuation metrics. Notably, Sagar Cements exhibits a negative price-to-cash-flow ratio (-42.63), contrasting with positive values among most peers, highlighting weaker cash generation. Overall, the company shows relatively high valuation multiples and financial challenges compared to larger, more established peers in the Indian cement sector.
Financial Metrics Comparison with Peers
Financial Statements
Comprehensive financial data including income, balance sheet, and cash flow metrics
Income Statement
| fiscal_date | 2025-03-31 | 2024-03-31 | 2023-03-31 | 2022-03-31 | 2021-03-31 |
|---|---|---|---|---|---|
| Sales | 21.98B | 24.98B | 22.23B | 15.93B | 13.53B |
| Cost Of Goods | 5.66B | 5.41B | 5.46B | 3.34B | 3.18B |
| Gross Profit | 16.32B | 19.57B | 16.77B | 12.59B | 10.34B |
| Operating Expense Selling General And Administrative | 5.14B | 5.39B | 4.50B | 3.20B | 2.72B |
| Operating Expense Other Operating Expenses | 8.97B | 10.57B | 9.72B | 5.79B | 3.05B |
| Operating Income | -872.10M | 318.70M | 16.30M | 1.83B | 3.21B |
| Non Operating Interest Income | 159.00M | 136.10M | 2.03B | 118.20M | 32.80M |
| Non Operating Interest Expense | 1.58B | 1.51B | 1.48B | 699.50M | 395.30M |
| Pretax Income | -2.84B | -841.20M | 184.70M | 1.04B | 2.81B |
| Income Tax | -668.50M | -320.70M | 88.60M | 448.50M | 945.10M |
| Net Income | -2.17B | -520.50M | 96.10M | 591.50M | 1.86B |
| Eps Basic | -16.05 | -3.32 | 2.33 | 5.89 | 16.13 |
| Eps Diluted | -16.05 | -3.32 | 2.33 | 5.89 | 16.13 |
| Basic Shares Outstanding | 130.71M | 130.71M | 129.40M | 117.50M | 115.65M |
| Diluted Shares Outstanding | 130.71M | 130.71M | 129.40M | 117.50M | 115.65M |
| Ebit | -1.26B | 670.80M | 1.66B | 1.74B | 3.20B |
| Ebitda | 1.29B | 2.27B | 3.04B | 2.67B | 4.02B |
| Net Income Continuous Operations | -2.84B | -841.20M | 184.70M | 1.04B | 2.81B |
| Minority Interests | 68.90M | 86.90M | 205.40M | 100.00M | 4.20M |
| Preferred Stock Dividends | 0.00 | 0.00 | 0.00 | 0.00 | 0.00 |
Data provided by Twelve Data
Balance Sheet
| fiscal_date | 2025-03-31 | 2024-03-31 | 2023-03-31 | 2022-03-31 | 2021-03-31 |
|---|---|---|---|---|---|
| Cash And Cash Equivalents | 704.90M | 1.67B | 1.75B | 1.43B | 2.25B |
| Accounts Receivable | 2.04B | 2.08B | 1.33B | 1.20B | 1.01B |
| Total Assets | 41.77B | 43.56B | 41.80B | 33.64B | 25.47B |
| Total Liabilities | 23.82B | 23.37B | 21.15B | 20.55B | 13.03B |
| Long Term Debt | 10.07B | 10.94B | 11.57B | 11.34B | 6.52B |
| Shareholders Equity | 17.94B | 20.20B | 20.65B | 13.09B | 12.44B |
Data provided by Twelve Data
Cash Flow Statement
| fiscal_date | 2025-03-31 | 2024-03-31 | 2023-03-31 | 2022-03-31 | 2021-03-31 |
|---|---|---|---|---|---|
| Operating Activities Net Income | -2.84B | -841.20M | 184.70M | 1.04B | 2.81B |
| Operating Activities Other Non Cash Items | 1.72B | 1.80B | 77.90M | 876.00M | 436.60M |
| Operating Activities Accounts Receivable | 48.50M | -745.10M | -158.30M | -216.30M | 352.20M |
| Operating Activities Other Assets Liabilities | 449.60M | 165.50M | -509.60M | -1.43B | -334.70M |
| Operating Activities Operating Cash Flow | -615.10M | 380.40M | -405.30M | 268.30M | 3.26B |
| Investing Activities Capital Expenditures | 82.20M | 257.10M | 13.30M | 48.70M | 10.30M |
| Investing Activities Purchase Of Investments | -49.90M | N/A | -200.80M | -4.50B | -239.20M |
| Investing Activities Sale Of Investments | 67.00M | 488.50M | 4.51B | 169.70M | 45.40M |
| Investing Activities Other Investing Activity | 800.00K | -488.40M | -99.00M | -12.30M | -193.80M |
| Investing Activities Investing Cash Flow | 100.10M | 257.20M | 1.01B | -4.30B | -377.30M |
| Financing Activities Long Term Debt Issuance | 461.20M | 958.60M | 708.10M | 6.94B | 4.31B |
| Financing Activities Long Term Debt Payments | -1.60B | -1.30B | -6.07B | -841.00M | -734.80M |
| Financing Activities Short Term Debt Issuance | 1.02B | -39.70M | 157.30M | 775.70M | -384.60M |
| Financing Activities Common Dividends | -91.50M | -91.50M | -91.50M | -58.80M | -152.80M |
| Financing Activities Financing Cash Flow | -208.60M | -477.80M | -1.81B | 7.02B | 3.71B |
| End Cash Position | 704.90M | 1.67B | 1.75B | 1.43B | 2.25B |
| Free Cash Flow | 957.80M | 1.75B | 574.20M | -2.74B | -840.70M |
| Investing Activities Net Acquisitions | N/A | 0.00 | -3.22B | 0.00 | N/A |
| Financing Activities Common Stock Issuance | N/A | 0.00 | 3.50B | 105.00M | 670.60M |
| Financing Activities Other Financing Charges | N/A | -7.90M | -10.10M | 105.00M | N/A |
Data provided by Twelve Data
Technical Analysis
Key Insights
- The current trend direction for Sagar Cements Ltd. is bearish, with recent price declines and downward momentum across daily and weekly timeframes.
- Key support levels are near ₹168.04 (52-week low) while resistance is observed around ₹202.35 (50-day moving average) and ₹230.68 (200-day moving average).
- The stock price is trading below the 200-day moving average and near the 50-day moving average, indicating potential downward pressure in the medium term.
- Momentum indicators such as RSI and MACD show weakening momentum with RSI levels below neutral thresholds and MACD histogram indicating bearish crossover.
- Multi-timeframe analysis reveals consistent bearish signals on daily and weekly charts, while monthly charts suggest a longer-term consolidation phase.
- Potential market scenarios include continued downward pressure if support levels fail, or a stabilization phase if price holds above recent lows, with volatility expected amid mixed technical signals.
Trending News
1. Headline: UltraTech Cement Share Price Fall 2.97% to Close at ₹12,664
Summary: UltraTech Cement experienced a 2.97% decline in share price closing at ₹12,664 amid broad selling pressure in the cement sector. The drop was driven by sector-wide sentiment and market flows rather than company-specific news, reflecting cautious investor behavior in the industry.
Sentiment: Negative
2. Headline: CRH posts higher cement volumes in 2025; strengthens SCM position
Summary: CRH reported increased cement volumes across its Americas and International segments in 2025, supported by pricing improvements and supply chain management enhancements. This performance underscores CRH's strengthening market position and operational efficiency in the global cement industry.
Sentiment: Positive
3. Headline: Cement Sector: JPMorgan Flags Pricing Discipline vs. Market Share Clash
Summary: JPMorgan highlights a tension in the Indian cement sector between maintaining pricing discipline and pursuing market share growth. Capacity additions may cap utilization rates, creating challenges for profit growth and necessitating strategic balancing among firms.
Sentiment: Negative
4. Headline: Sagar Cements Ltd is Rated Strong Sell
Summary: MarketsMOJO rates Sagar Cements Ltd as Strong Sell as of December 2025, reflecting concerns over fundamentals and financial metrics. The rating incorporates the company's recent performance and market conditions as of February 2026, providing a cautious outlook.
Sentiment: Neutral
5. Headline: Sagar Cements Ltd Faces Bearish Momentum Amid Technical Downgrade
Summary: Technical indicators for Sagar Cements Ltd signal a bearish trend across multiple timeframes, with shares closing at ₹192.65 on 16 February 2026, down 5.29% from the previous close. This reflects increased caution among market participants regarding the stock's near-term prospects.
Sentiment: Negative
Powered by Brave
Recent Updates
News Summary
Recent news on Sagar Cements Ltd. reflects a mixed market perception with a strong sell rating by MarketsMOJO updated in December 2025, highlighting concerns over fundamentals and financial performance. The company has entered a strategic 10-year partnership with Sow & Reap for biochar and gasification units, emphasizing sustainability initiatives. Additionally, a report from Simply Wall Street suggests the stock may be undervalued by approximately 38% relative to intrinsic value estimates. Technical momentum has shifted from bearish to mildly bearish, indicating nuanced market sentiment. The company also plans to divest an 8.14% stake in its subsidiary Andhra Cements to comply with regulatory requirements. These developments collectively underscore ongoing efforts to navigate operational challenges while addressing regulatory and environmental factors.
News Sentiment
Sentiment across recent updates is cautiously positive to neutral, with strategic partnerships and valuation insights providing optimism, balanced by ongoing concerns reflected in sell ratings and technical momentum shifts. The mixed sentiment suggests a market environment of uncertainty with potential for both risk and opportunity as the company executes its strategic initiatives.
Analytical Overview
Analysis Summary
Valuation Metrics: Sagar Cements' trailing P/E ratio of 61.76 is aligned with the industry average but its forward P/E of 381.28 is significantly elevated, indicating market expectations for earnings growth that may be challenging given current fundamentals.
Growth Trajectory: The company shows modest revenue growth of 4.7% quarterly but reports negative net income and operating cash flow, suggesting challenges in translating top-line growth into profitability and cash generation.
Financial Health: A high debt-to-equity ratio near 93.3% and a current ratio below 1 indicate leverage and liquidity pressures, while negative free cash flow underscores operational cash constraints.
Sector Specific Factors: The Indian cement sector faces pricing discipline challenges and capacity additions that may cap utilization, impacting profitability; sustainability initiatives present growth opportunities amid regulatory focus.
Market Factors: Considering India's regulatory environment and infrastructure growth, Sagar Cements operates in a dynamic market with competitive pressures and evolving consumer demand patterns influencing its positioning.
Investment Conclusion
Supporting Factors: Sagar Cements maintains steady revenue growth and has initiated sustainability partnerships enhancing long-term prospects.
Risk Factors: Negative profitability and operating cash flow raise concerns about financial resilience.
SWOT Analysis
Strengths
- Established presence in the Indian cement manufacturing sector with diverse product offerings.
- Strategic partnerships focused on sustainability and modern manufacturing techniques.
- Robust distribution network supporting regional market penetration.
- Consistent revenue growth despite sector challenges.
Weaknesses
- Negative net income and operating cash flow indicating profitability issues.
- High debt-to-equity ratio reflecting significant leverage.
- Current ratio below 1 suggesting liquidity constraints.
- Elevated forward P/E ratio indicating market expectations may be optimistic.
Opportunities
- Growing infrastructure and housing demand in India driving cement consumption.
- Expansion of sustainable production methods aligning with regulatory trends.
- Potential to improve operational efficiencies and reduce costs.
- Divestment of non-core assets to strengthen balance sheet.
Threats
- Intense competition leading to pricing pressures within the cement industry.
- Capacity additions in the sector potentially capping utilization rates.
- Volatility in raw material and energy costs impacting margins.
- Regulatory changes affecting operational and environmental compliance.
Company Description
Sagar Cements Ltd. is a prominent cement manufacturing company primarily operating in the Indian market. The core operation of Sagar Cements revolves around producing a diverse range of cement types, including ordinary Portland cement (OPC), Portland pozzolana cement (PPC), and specific composite cements, tailored to cater to various construction needs. The company plays a pivotal role in supporting sectors such as infrastructure, housing, and commercial construction by providing essential materials for building and development projects. Sagar Cements Ltd. emphasizes modern manufacturing techniques and sustainability by incorporating waste materials and alternative fuels into its production processes. Headquartered in Hyderabad, India, the company has established a strong regional presence through strategic production facilities and a robust distribution network. Sagar Cements not only contributes significantly to local construction activities but also aligns with India's growing infrastructure demands, marking its importance in the domestic market by consistently meeting quality and supply requirements.