

Rikhav Securities Ltd (RIKHAV)
Stock Analysis Report
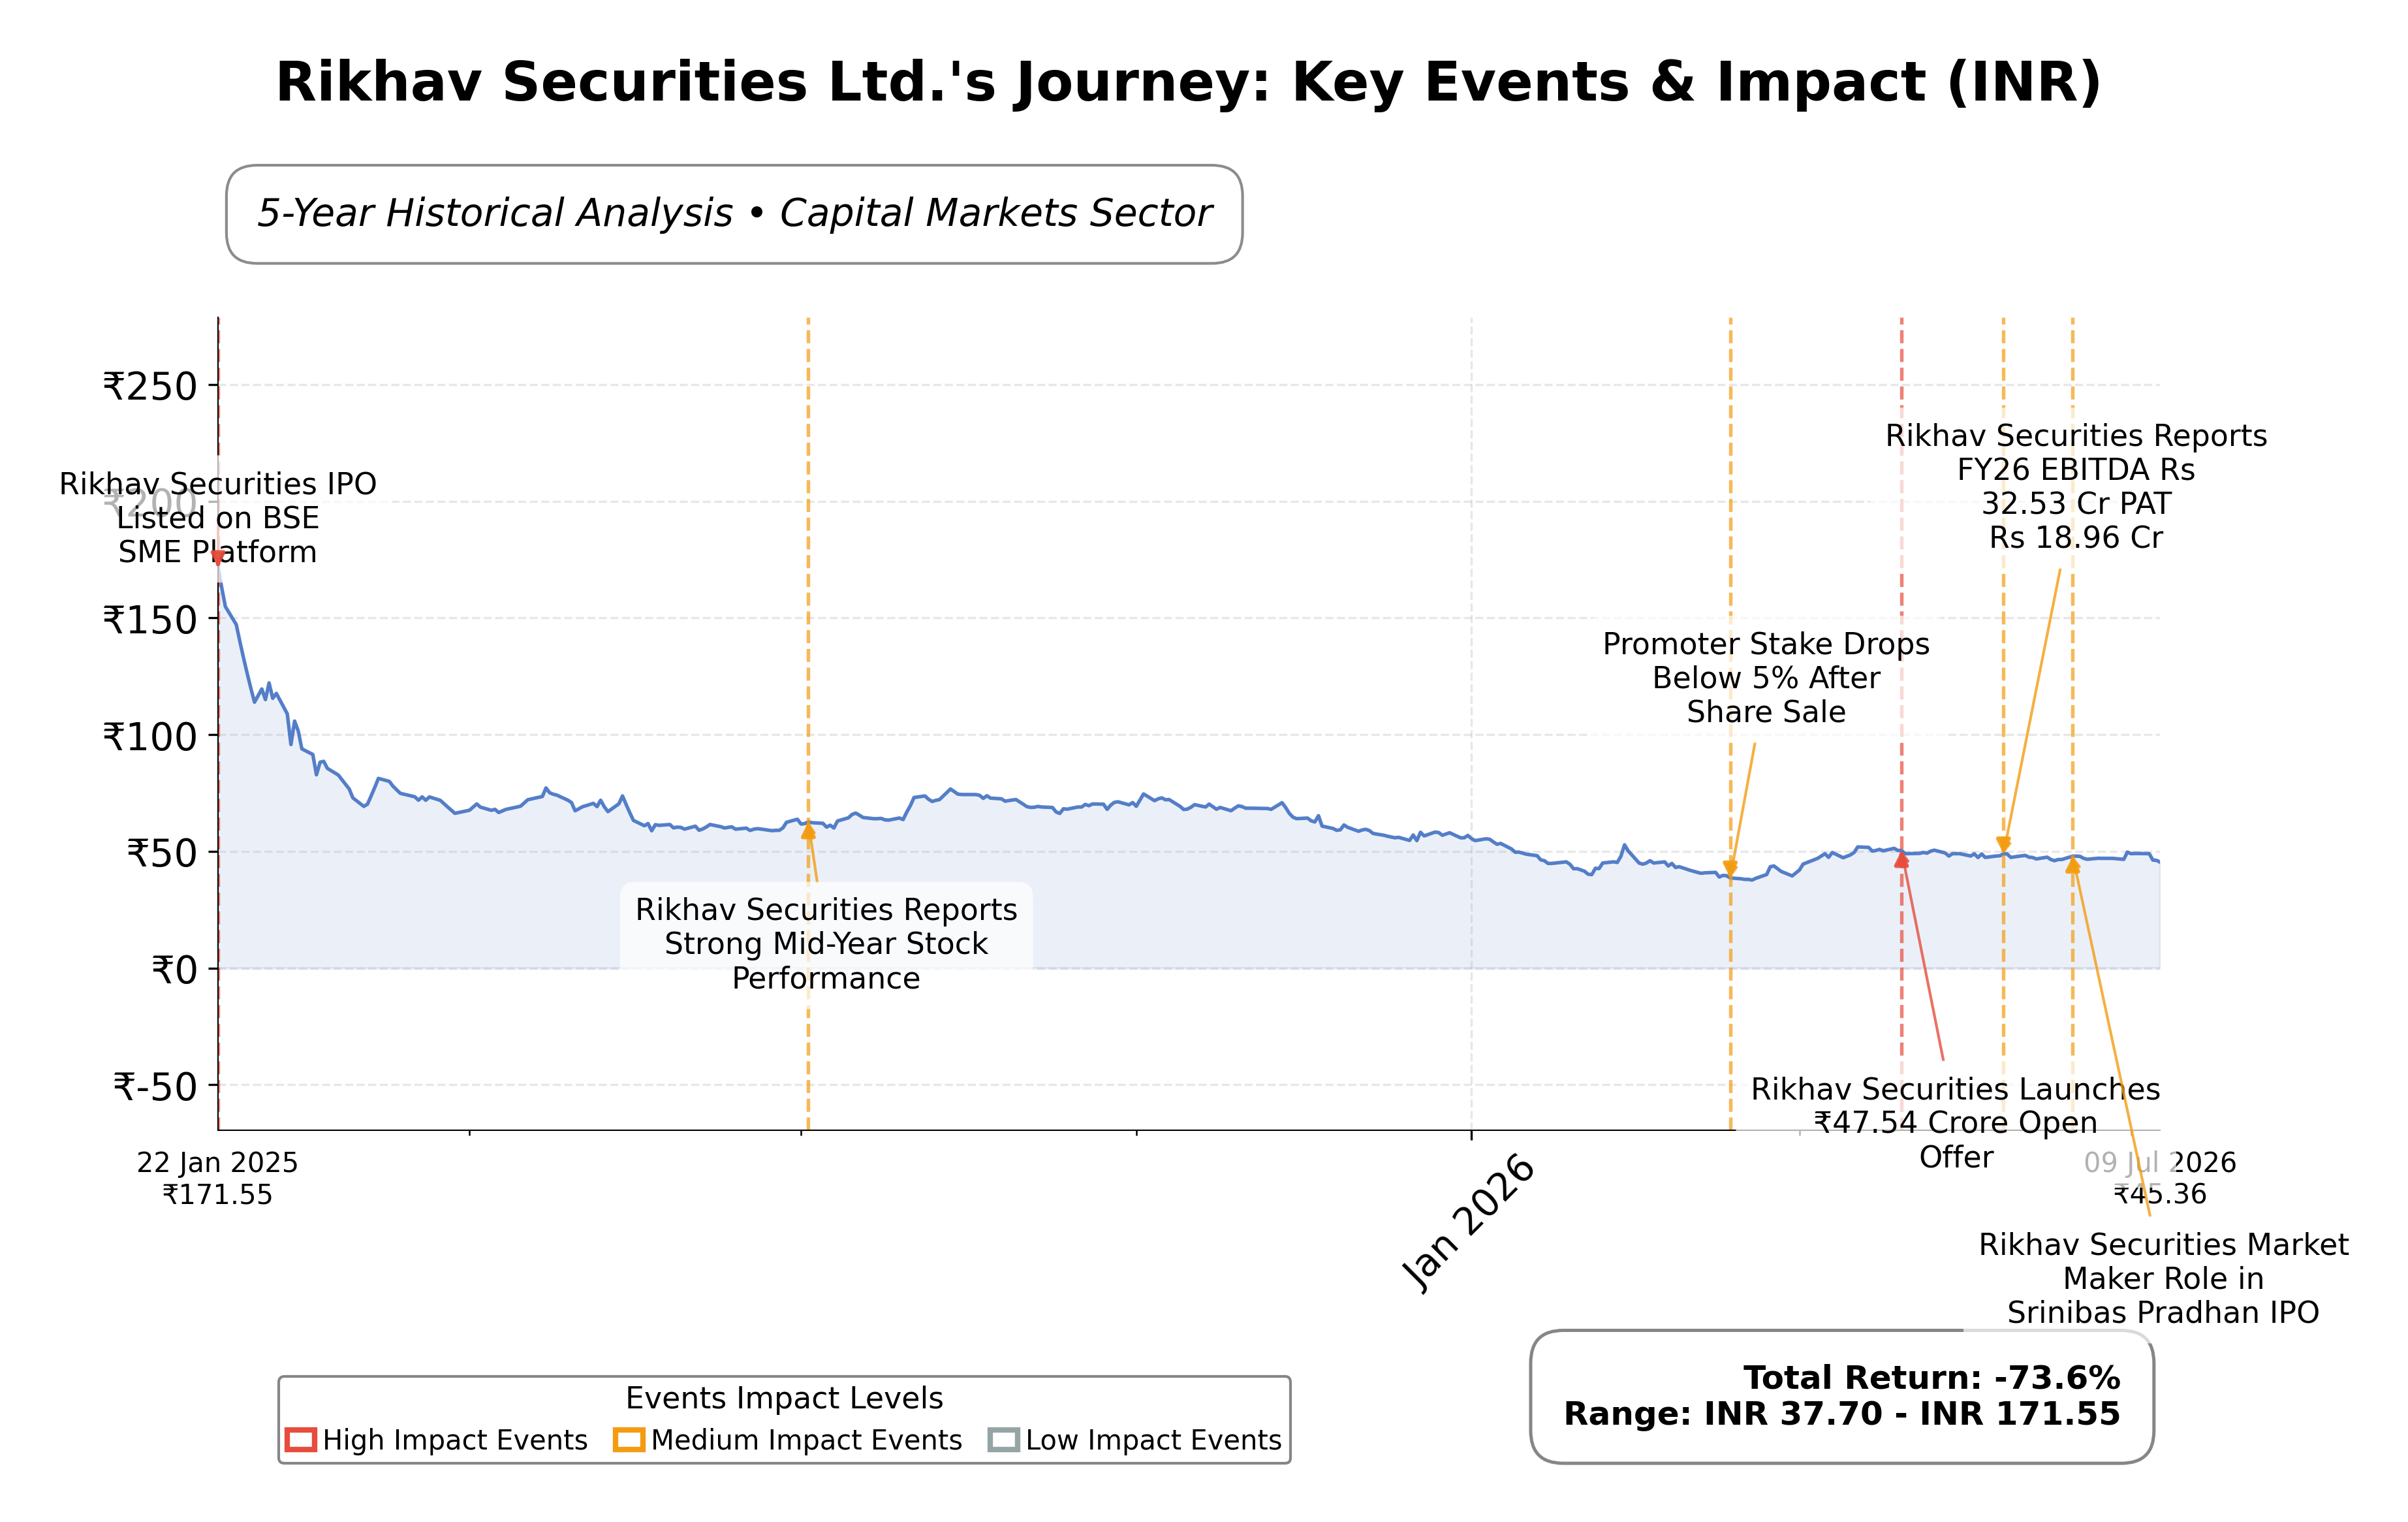
Stock Journey
Key Positives and Key Risks
Pros
- Strong cash reserves of ₹2.37 billion provide substantial liquidity and financial stability.
- Low total debt of ₹78.9 million results in a conservative debt-to-equity structure, enhancing risk management.
Cons
- Net profit margin is below 1%, indicating limited profitability despite high revenue.
- Negative enterprise value to EBITDA ratio (-1.56) reflects valuation and accounting complexities.
- Insider ownership at approximately 75% may limit institutional investor interest and market liquidity.
Disclosure: This information is for general awareness and does not constitute investment advice
Report Summary
Rikhav Securities Ltd. operates as a financial services company listed on the Bombay Stock Exchange (BSE) in India, specializing in investment management and advisory services. The company provides a broad spectrum of financial products including equity and derivative trading, portfolio management, and wealth advisory services. Positioned within the Capital Markets industry and the Financial Services sector, Rikhav Securities serves retail investors, high-net-worth individuals, and corporate clients, leveraging technology to enhance trading platforms and research capabilities.
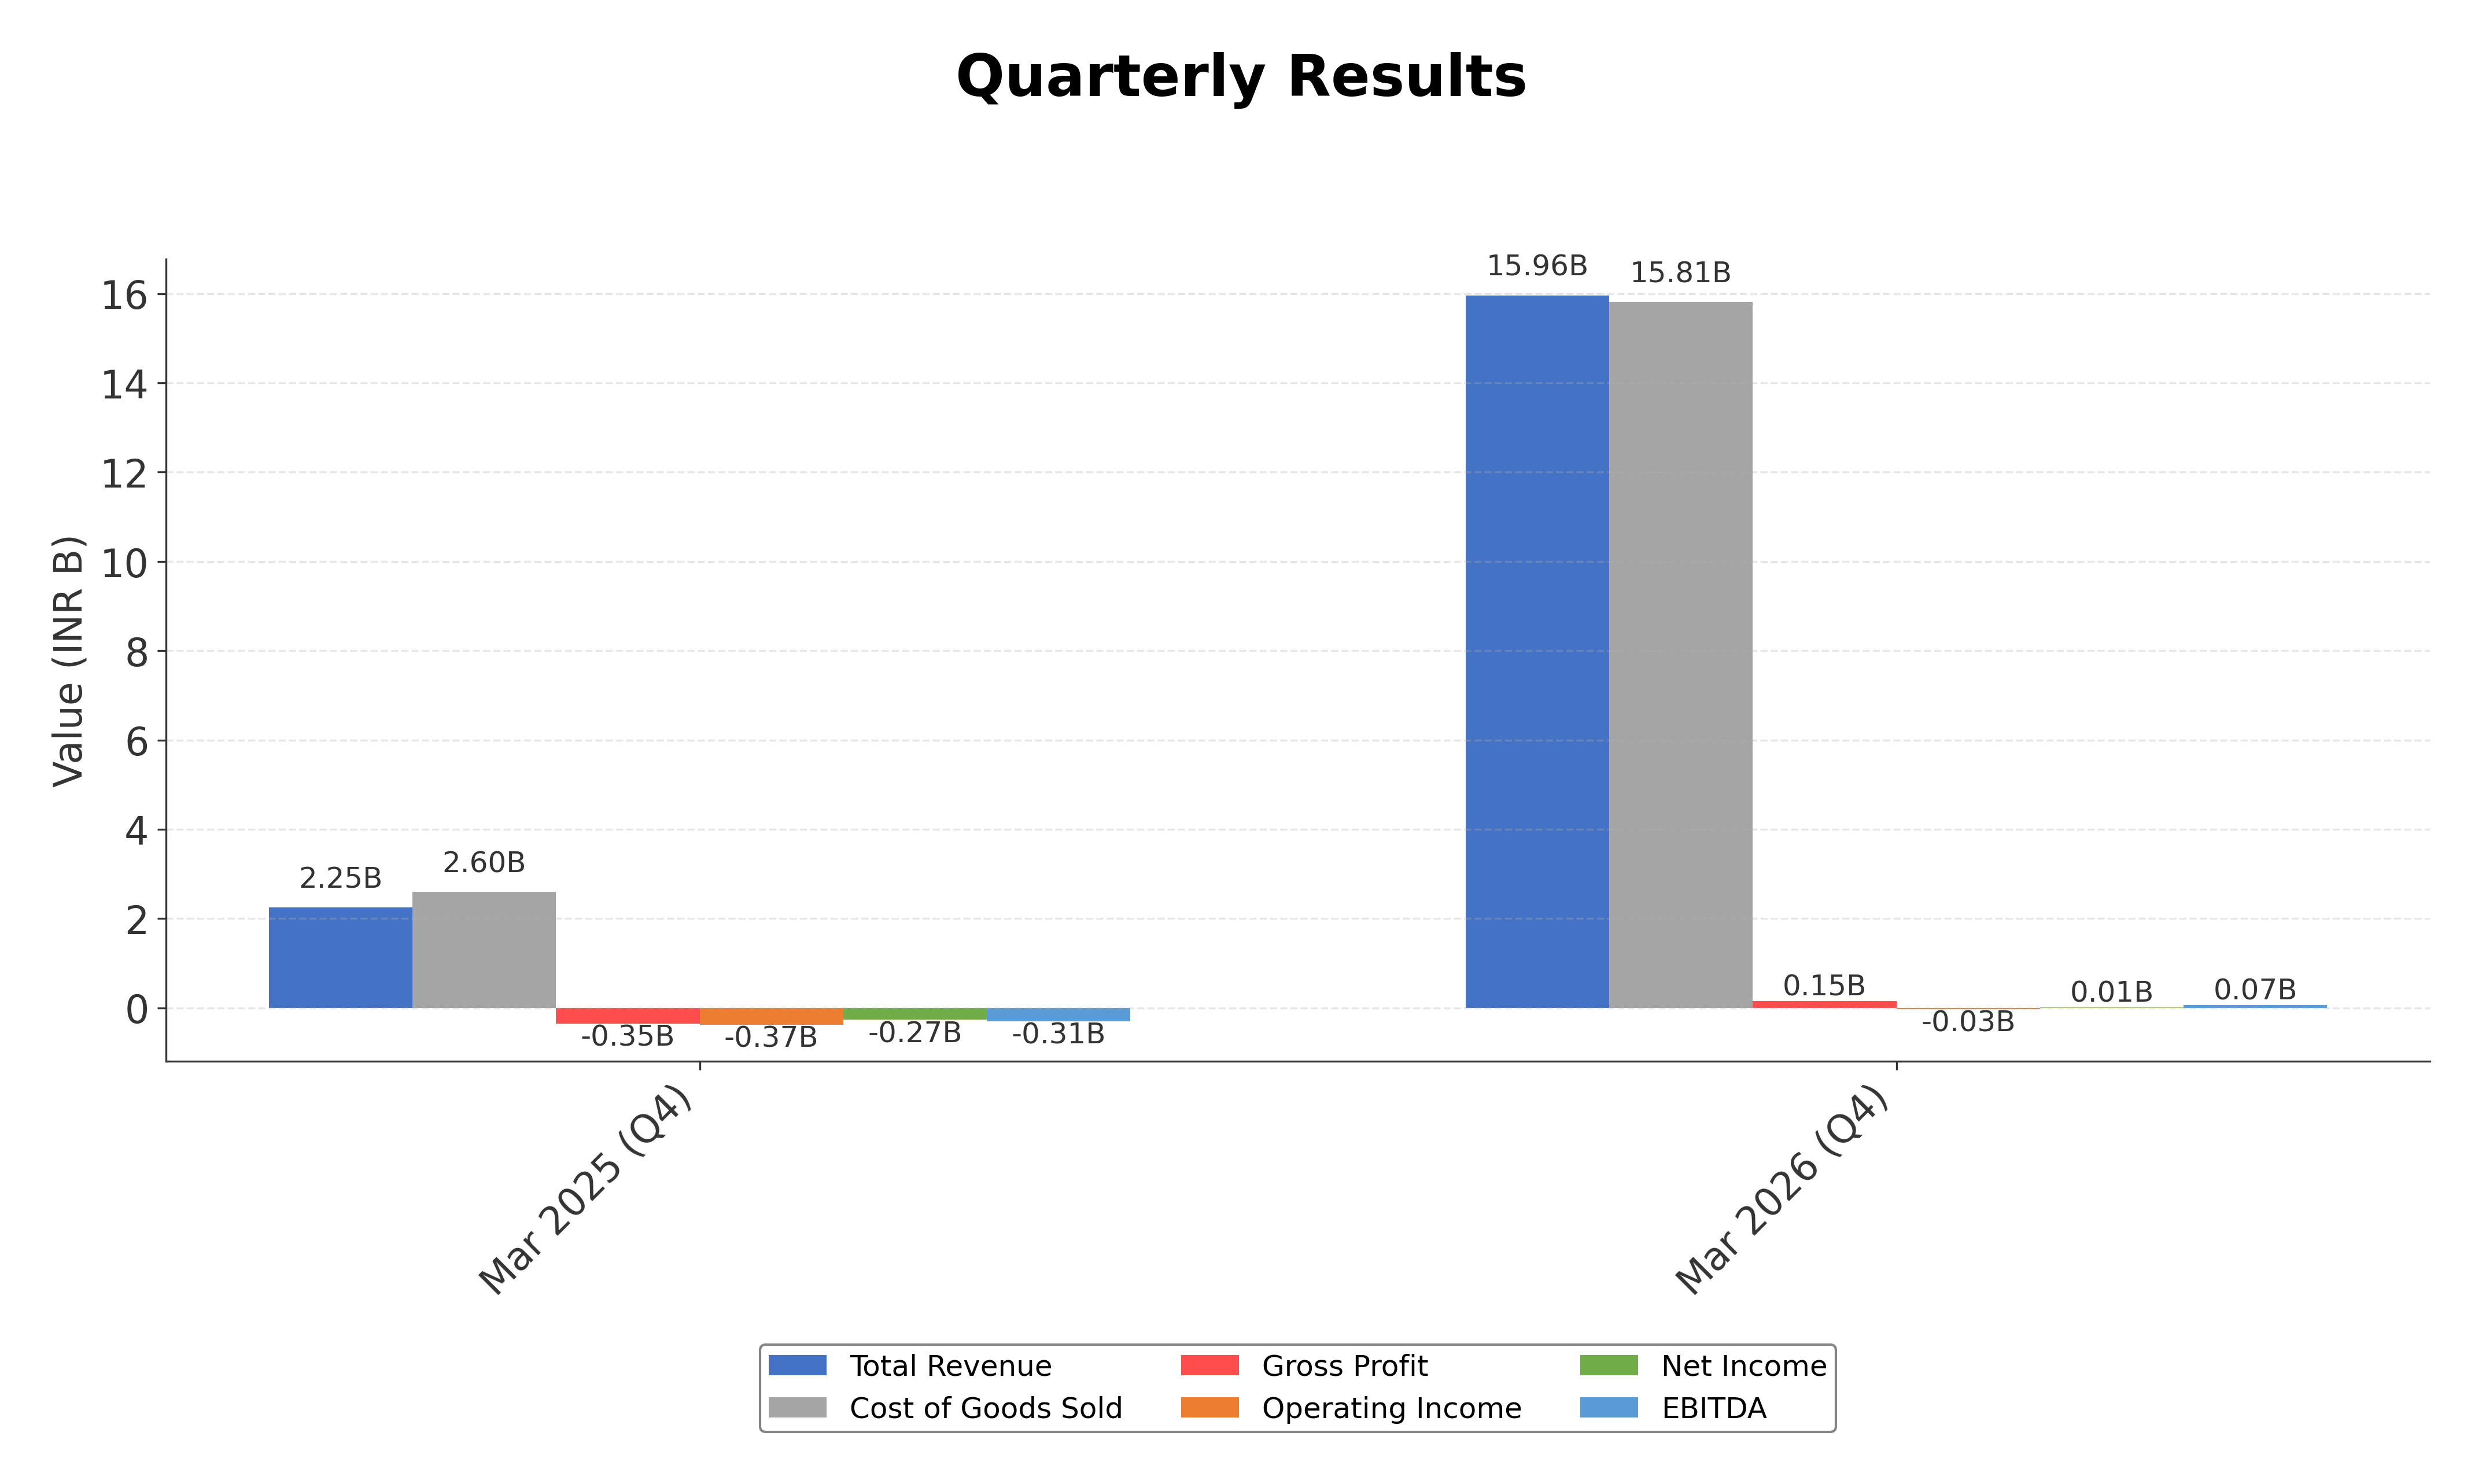
Financially, Rikhav Securities reported trailing twelve months (TTM) revenue of approximately ₹19.86 billion with a modest gross margin of 0.95%, operating margin of 0.14%, and net profit margin of 0.96%. The company’s return on equity (ROE) stands at 8.03%, and return on assets (ROA) at 5.5%, indicating moderate profitability and efficient asset utilization. Operating cash flow for the TTM period was ₹653.2 million, with levered free cash flow at ₹189.6 million, reflecting positive cash generation despite thin margins.
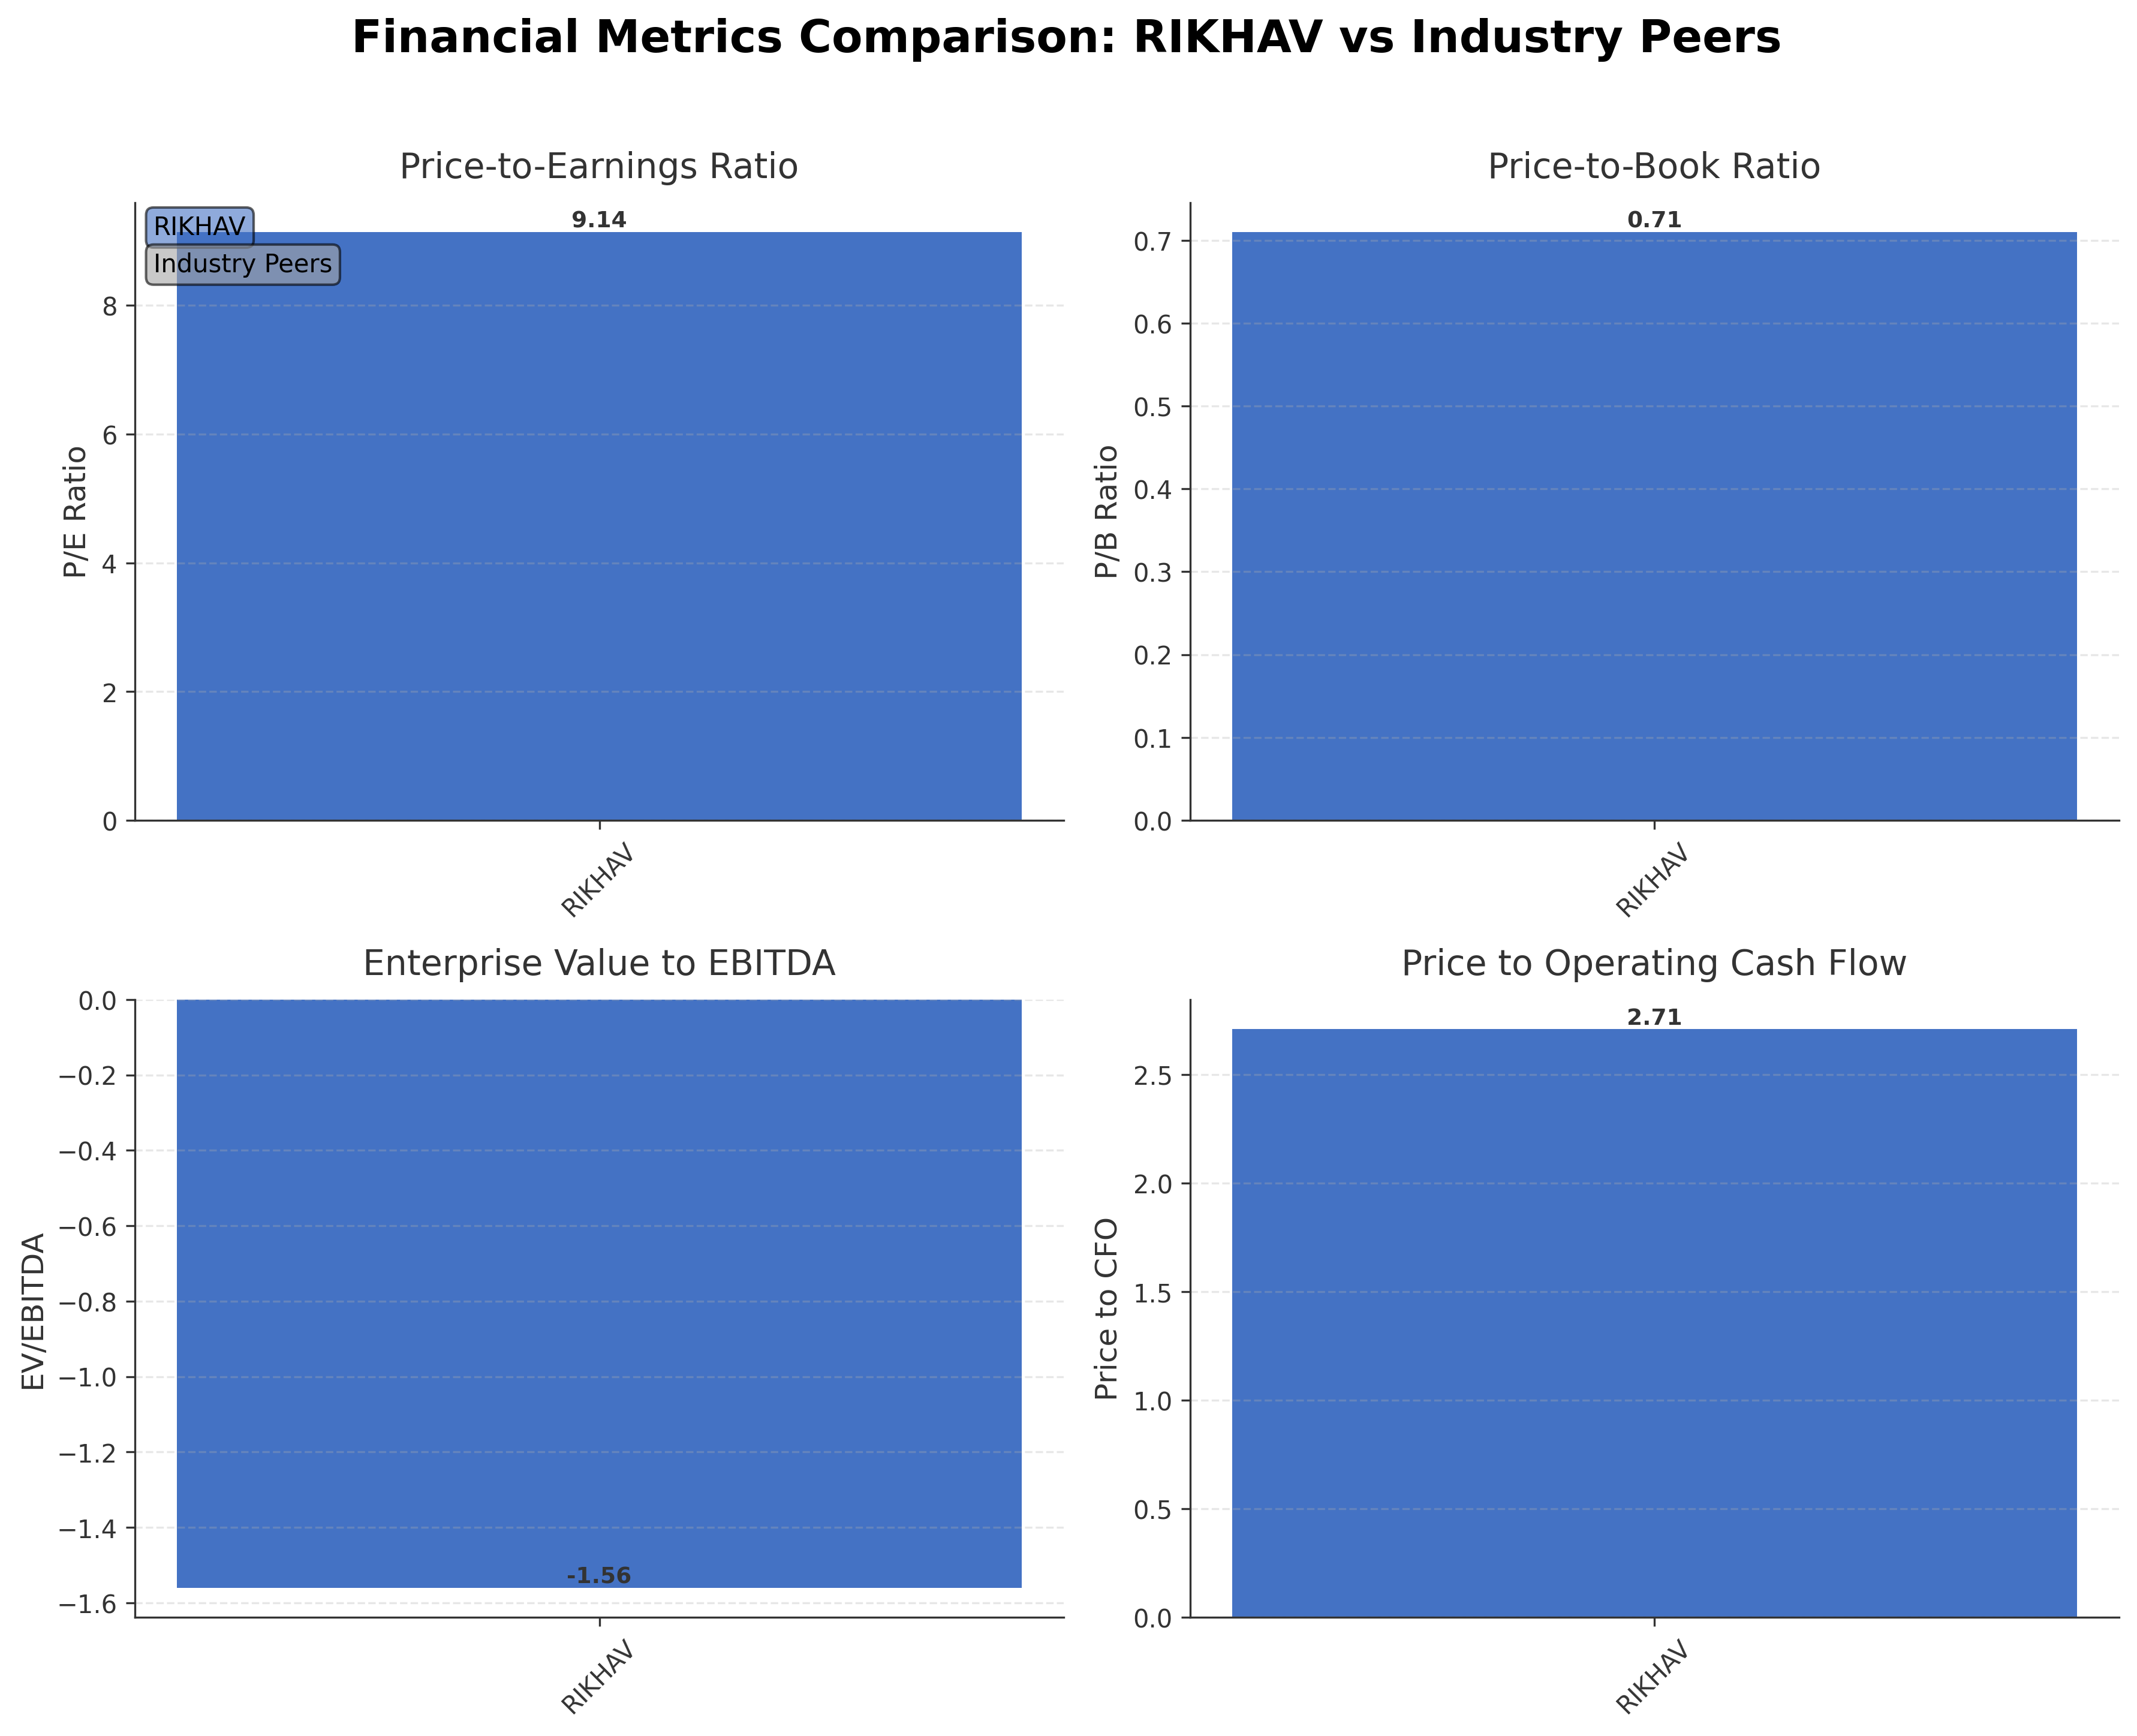
Valuation metrics show a trailing price-to-earnings (P/E) ratio of 9.14 and a price-to-book (P/B) ratio of 0.71, suggesting the stock trades below book value and at a relatively low earnings multiple compared to industry averages. The enterprise value to EBITDA ratio is negative at -1.56, influenced by a negative enterprise value figure. The market capitalization is approximately ₹1.77 billion, with the current share price at ₹46.29, situated well below its 52-week high of ₹79.79 and above the 52-week low of ₹34, indicating a 52-week decline of about 36%.
Rikhav Securities benefits from strong cash reserves of over ₹2.37 billion and low total debt of ₹78.9 million, resulting in a healthy current ratio of 2.58. The company’s shareholding pattern is heavily insider-dominated at approximately 75%, with no institutional holdings reported, which may impact governance and liquidity. Key risks include regulatory challenges inherent in the financial services sector, competitive pressures, and macroeconomic volatility in India. Recent strategic actions or leadership changes were not prominently reported.
Technically, the stock trades near its 50-day moving average of ₹48.13 and below the 200-day moving average of ₹52.79, with a recent price consolidation around ₹46.29. Momentum indicators and volume trends suggest a cautious market stance. Overall, the data points to a stock currently in a consolidation phase with mixed signals, warranting close observation for potential shifts in trend or valuation re-rating.
Company and Industry Overview
Company Basics
Price Performance
Company Size
Shareholding Pattern
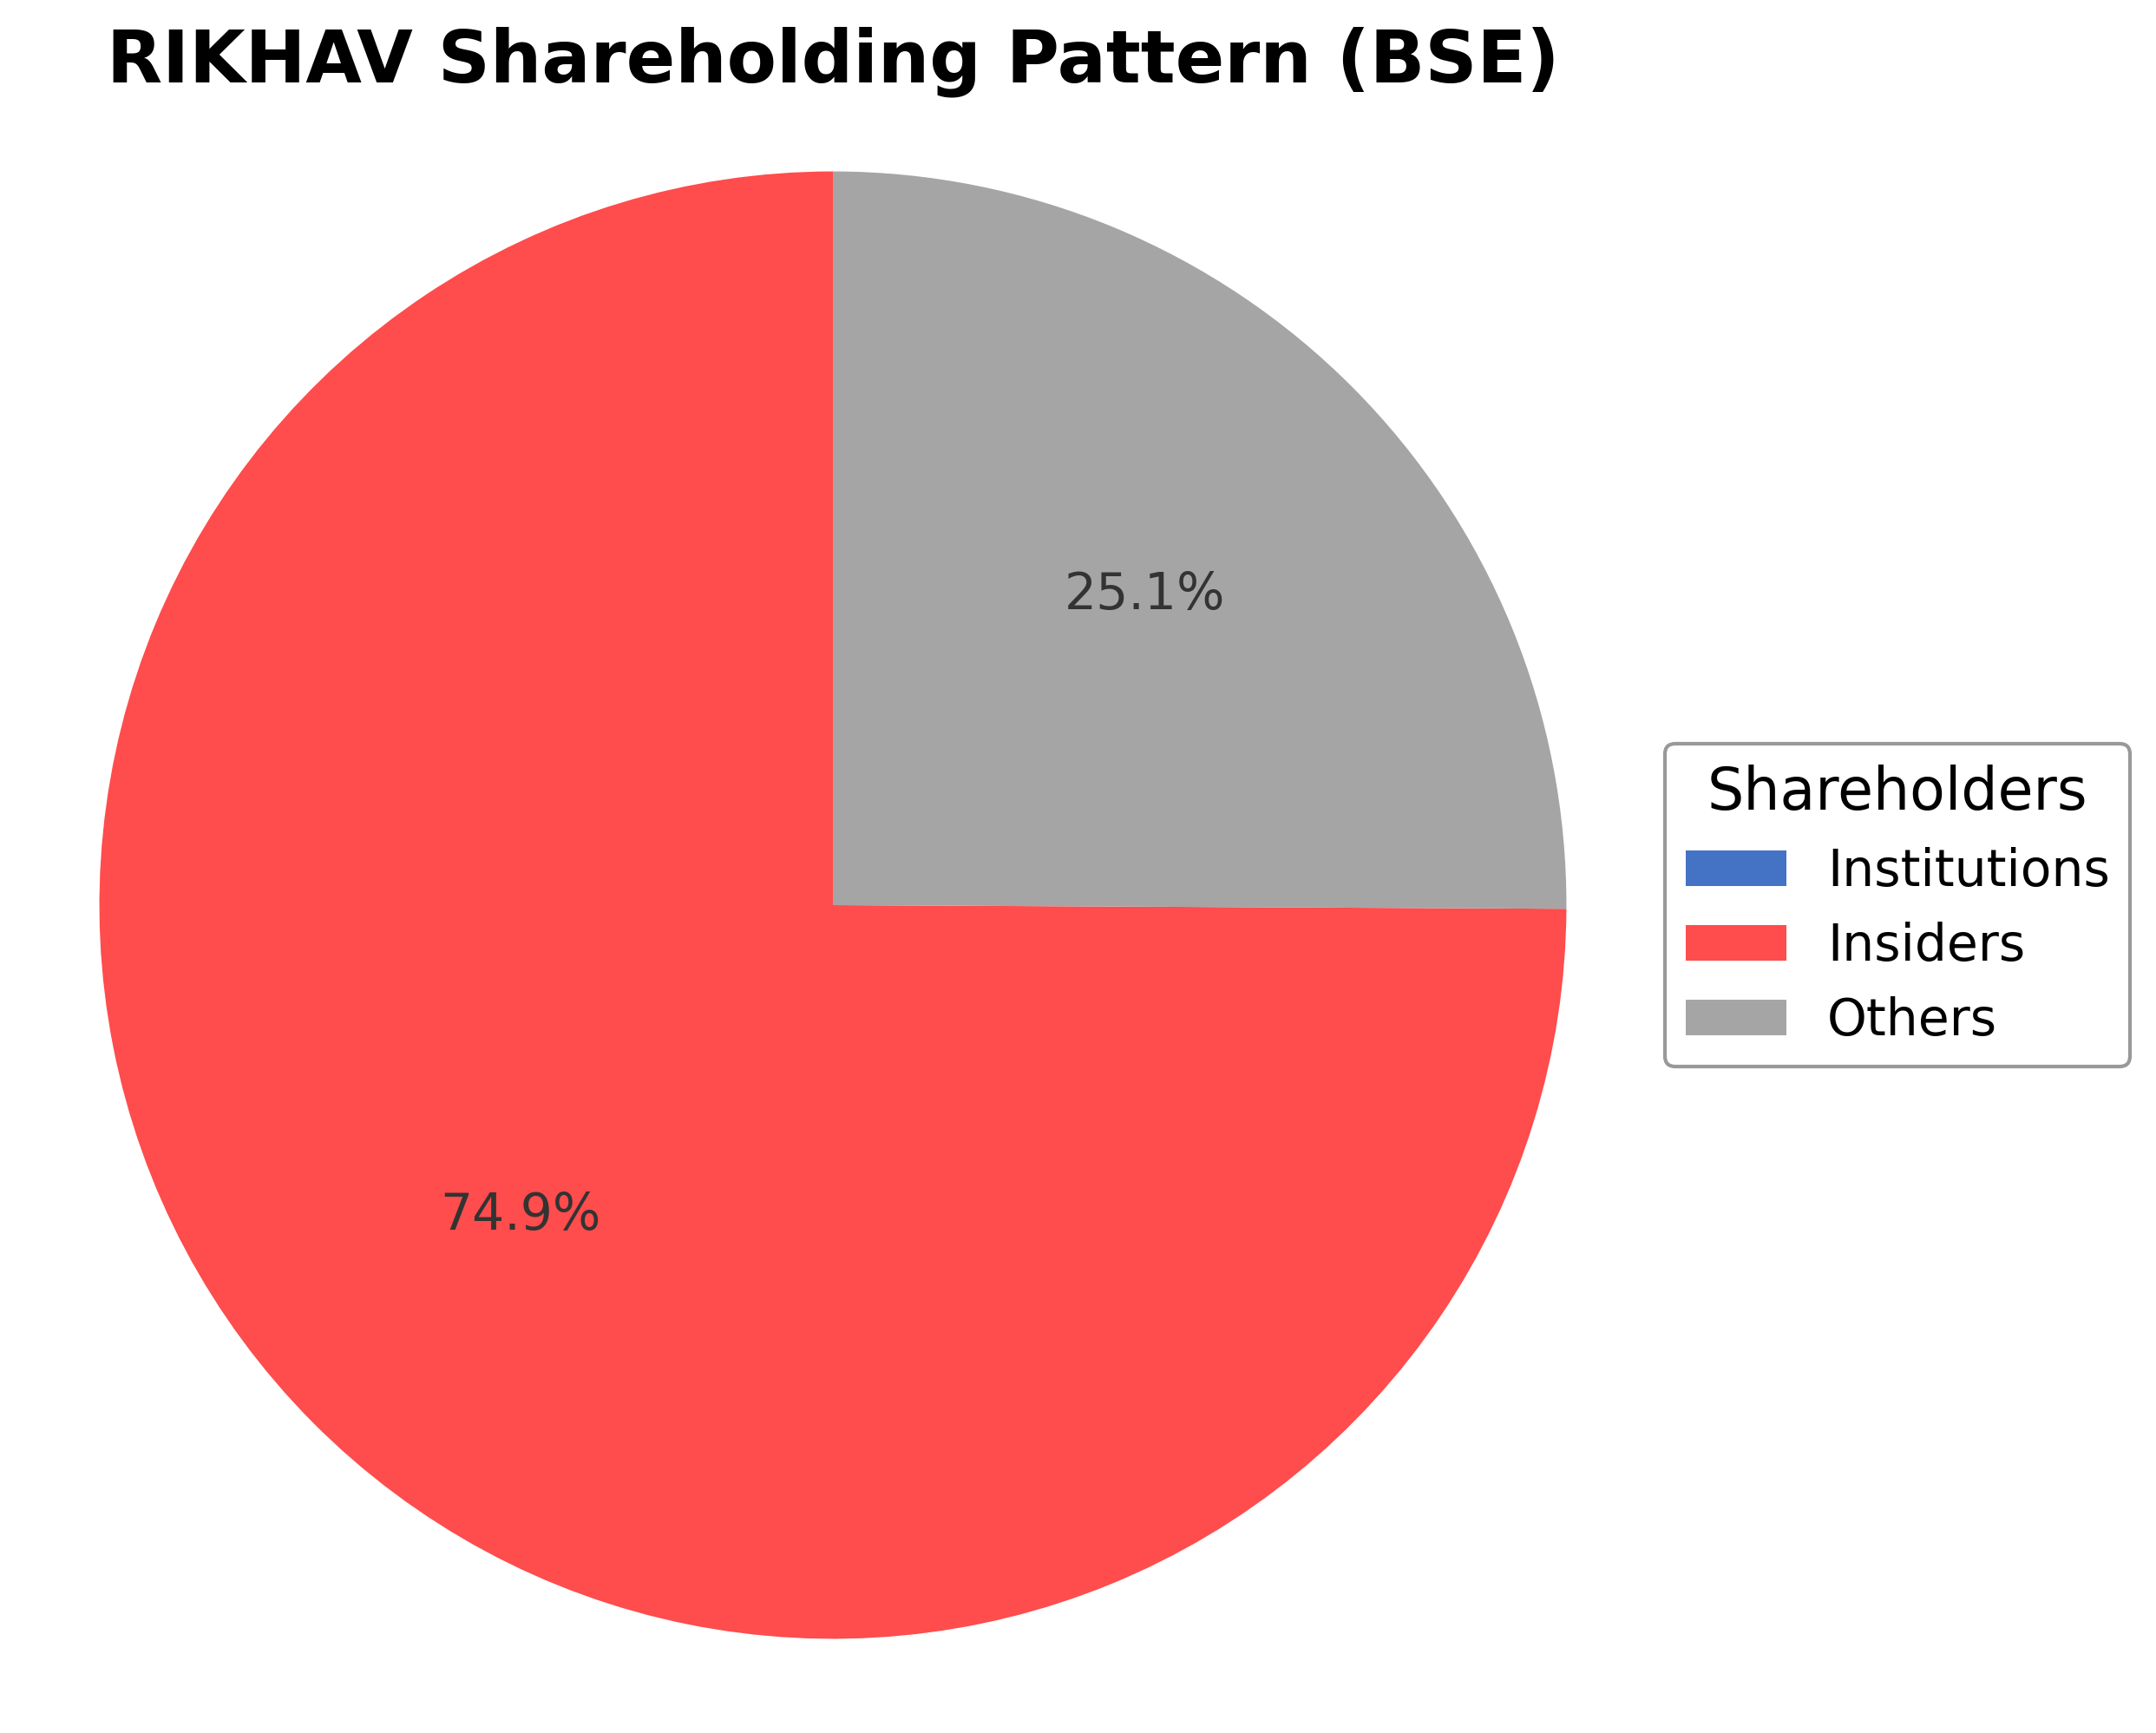
Rikhav Securities Ltd. exhibits a concentrated ownership structure with insiders, including executives and board members, holding approximately 74.92% of shares, while institutional investors hold no reported stake. The remaining 25.08% is held by public shareholders and other retail investors. Over the past 12 to 24 months, insider ownership has remained dominant with no significant institutional accumulation or distribution noted. This ownership pattern suggests strong control by company insiders, which may influence governance and strategic decisions. The absence of institutional investors indicates limited external influence on corporate policies, potentially reflecting market sentiment that is cautious or neutral. Such a structure may affect liquidity and market perception but ensures continuity in management direction.
Sector and Industry Analysis
The Indian capital markets sector, encompassing equity broking, derivatives trading, and financial advisory services, has witnessed steady growth driven by increasing retail participation and technological advancements. The market size has expanded with rising volumes on major exchanges like NSE and BSE, supported by a growing investor base and digital trading platforms. Key players include established brokerage firms and merchant banks such as ICICI Securities, Zerodha, and Motilal Oswal, which dominate through scale, technology, and diversified service offerings.
Industry trends highlight a shift towards algorithmic and high-frequency trading, increased use of digital platforms, and a growing focus on market making and liquidity provision, especially in SME and newly listed securities segments. Barriers to entry include stringent capital requirements, technology infrastructure, and regulatory compliance, which favor established firms with robust risk management frameworks. Companies like Rikhav Securities leverage niche services such as market making and proprietary trading to differentiate themselves amid intense competition.
The regulatory environment is governed by the Securities and Exchange Board of India (SEBI), which enforces strict norms on capital adequacy, client protection, and transparency to ensure market integrity. Recent regulations emphasize enhanced disclosure, risk management for derivatives trading, and investor education, impacting operational practices across brokerage firms. The outlook remains cautiously optimistic as regulators continue to balance market growth with systemic stability and investor protection.
Note: Analysis synthesized from industry research, market reports, and regulatory filings. Information is subject to change based on market conditions.
Financial Ratios Dashboard
Financials
Peer Analysis
| Company Name | Market Cap | P/E Ratio | P/B Ratio | EV/EBITDA | Price to CFO |
|---|---|---|---|---|---|
| Rikhav Securities Ltd. | ₹1.77B | 9.14 | 0.71 | -1.56 | 2.71 |
Comparison Analysis: Rikhav Securities Ltd. is currently evaluated without direct peer comparisons due to the absence of listed comparable companies in the provided data. Its valuation metrics, including a P/E ratio of 9.14 and P/B ratio of 0.71, suggest it trades at a discount relative to typical industry averages. The negative EV/EBITDA ratio indicates complexities in enterprise valuation, possibly due to accounting or capital structure factors. The company’s return on equity of 8.03% reflects moderate profitability. Without peer benchmarks, these metrics provide a standalone view of Rikhav’s financial positioning within the Capital Markets sector.
Financial Metrics Comparison with Peers
Financial Statements
Comprehensive financial data including income, balance sheet, and cash flow metrics
Income Statement
| fiscal_date | 2026-03-31 | 2025-03-31 | 2024-03-31 | 2023-03-31 | 2022-03-31 |
|---|---|---|---|---|---|
| Sales | 19.76B | 3.18B | 1.03B | 494.58M | 354.99M |
| Cost Of Goods | 19.33B | 2.69B | 189.89M | 96.28M | 67.77M |
| Gross Profit | 430.10M | 493.50M | 843.82M | 398.30M | 287.23M |
| Operating Expense Other Operating Expenses | 261.40M | 247.00M | 197.64M | 88.33M | 51.60M |
| Operating Income | 156.50M | 239.60M | 471.24M | 228.88M | 180.68M |
| Non Operating Interest Expense | 53.10M | 59.00M | 4.93M | 21.03M | 14.21M |
| Pretax Income | 261.00M | 280.30M | 513.61M | 246.22M | 221.23M |
| Income Tax | 71.50M | 43.60M | 91.52M | 50.50M | 44.98M |
| Net Income | 189.50M | 236.70M | 422.09M | 191.03M | 176.25M |
| Ebit | 314.10M | 339.30M | 518.54M | 267.24M | 235.44M |
| Ebitda | 325.30M | 345.00M | 524.59M | 272.15M | 239.26M |
| Net Income Continuous Operations | 261.00M | 280.30M | 513.61M | 246.22M | 221.23M |
| Preferred Stock Dividends | 0.00 | 0.00 | 0.00 | 0.00 | 0.00 |
| Operating Expense Selling General And Administrative | N/A | 63.26M | 161.18M | 65.22M | 40.57M |
| Non Operating Interest Income | N/A | 98.45M | 71.07M | 50.17M | 74.56M |
| Eps Basic | N/A | 7.51 | 11.02 | 4.99 | N/A |
| Eps Diluted | N/A | 7.51 | 11.02 | 4.99 | N/A |
| Basic Shares Outstanding | N/A | 31.52M | 38.29M | 38.29M | N/A |
| Diluted Shares Outstanding | N/A | 31.52M | 38.29M | 38.29M | N/A |
| Minority Interests | N/A | N/A | 0.00 | 0.00 | 0.00 |
Data provided by Twelve Data
Balance Sheet
| fiscal_date | 2026-03-31 | 2025-03-31 | 2024-03-31 | 2023-03-31 | 2022-03-31 |
|---|---|---|---|---|---|
| Cash And Cash Equivalents | 450.00M | -161.41M | 136.37M | 73.41M | 238.49M |
| Accounts Receivable | 160.30M | 108.36M | 41.92M | 55.93M | 67.95M |
| Total Assets | 3.98B | 2.91B | 2.94B | 1.88B | 1.81B |
| Total Liabilities | 1.60B | 641.63M | 1.55B | 927.58M | 1.05B |
| Long Term Debt | 23.00M | 1.72M | 2.70M | 0.00 | 0.00 |
| Shareholders Equity | 2.38B | 2.27B | 1.39B | 949.62M | 758.59M |
Data provided by Twelve Data
Cash Flow Statement
| fiscal_date | 2026-03-31 | 2025-03-31 | 2024-03-31 | 2023-03-31 | 2022-03-31 |
|---|---|---|---|---|---|
| Operating Activities Net Income | 261.00M | 280.30M | 513.61M | 246.22M | 221.23M |
| Operating Activities Other Non Cash Items | -102.80M | -39.50M | -42.33M | -16.95M | -40.90M |
| Operating Activities Accounts Receivable | -53.40M | 272.60M | 335.01M | 17.46M | -14.95M |
| Operating Activities Other Assets Liabilities | 292.30M | -1.82B | -6.94M | -214.62M | -623.80M |
| Operating Activities Operating Cash Flow | 397.10M | -1.31B | 799.35M | 32.10M | -458.42M |
| Investing Activities Capital Expenditures | -57.50M | -9.00M | -5.62M | -12.70M | -9.24M |
| Investing Activities Sale Of Investments | 0.00 | 1.32B | 0.00 | N/A | N/A |
| Investing Activities Other Investing Activity | -165.70M | -1.76B | N/A | -4.69M | 1.00K |
| Investing Activities Investing Cash Flow | -223.20M | -450.40M | -1.04B | -17.39M | -9.24M |
| Financing Activities Long Term Debt Issuance | 21.30M | N/A | 1.90M | 0.00 | N/A |
| Financing Activities Short Term Debt Issuance | 56.50M | -400.50M | 0.00 | -51.19M | -142.77M |
| Financing Activities Common Stock Issuance | 0.00 | 643.00M | 0.00 | 0.00 | 0.00 |
| Financing Activities Other Financing Charges | 1.00M | 1.10M | 42.00K | -1.00K | N/A |
| Financing Activities Financing Cash Flow | 78.80M | -157.10M | 1.95M | -51.19M | -142.77M |
| End Cash Position | 450.00M | -161.40M | 136.37M | 73.41M | 238.49M |
| Free Cash Flow | 595.70M | -1.86B | 1.08B | -101.36M | -375.67M |
| Investing Activities Purchase Of Investments | N/A | 0.00 | -1.03B | N/A | N/A |
| Financing Activities Long Term Debt Payments | N/A | -400.70M | 0.00 | 0.00 | N/A |
| Investing Activities Net Acquisitions | N/A | N/A | 2.17M | 0.00 | 0.00 |
Data provided by Twelve Data
Technical Analysis
Key Insights
- The current trend shows price consolidation near ₹46.29, with recent trading activity fluctuating between ₹45.75 and ₹49.68 over the past ten days, indicating a sideways price action pattern.
- Key support levels are identified around ₹45.20 and ₹34.00 (52-week low), while resistance is noted near ₹48.00 and the 52-week high of ₹79.79.
- The stock price is slightly below the 50-day moving average of ₹48.13 and below the 200-day moving average of ₹52.79, suggesting a neutral to mildly bearish medium-term trend.
- Momentum indicators such as RSI and MACD are not explicitly provided but the price hovering near moving averages implies moderate momentum without strong directional bias.
- Across daily and weekly timeframes, the stock exhibits consolidation with no clear breakout, while monthly trends reflect a recent downtrend from the 52-week high.
- Potential market scenarios include continued sideways movement with possible testing of support levels or a recovery attempt towards the 50-day moving average, contingent on volume and broader market conditions.
Trending News
Summary: /PRNewswire/ -- Rackspace Technology (NASDAQ: RXT) shares fell more than 25% intraday on July 9, 2026 after the Company cut its full-year 2026 revenue guidance...
Sentiment: negative
2. Headline: RH insider updates 23.88% ownership stake | RH SEC Filing - Form SCHEDULE 13D/A
Summary: RH leader Gary G. Friedman now beneficially owns 4.93M shares, or 23.88% of RH, after selling 125,000 shares at a $165.35 average to fund personal obligations.
Sentiment: neutral
3. Headline: CoreWeave GC Kristen J McVeety sells $1,889 in stock By Investing.com
Summary: CoreWeave GC Kristen J McVeety sells $1,889 in stock
Sentiment: neutral
4. Headline: SK Hynix to price US IPO at $149 per depository share: Report
Summary: SK Hynix will begin trading on the Nasdaq on Friday.
Sentiment: neutral
5. Headline: Why Richtech Robotics Stock Fell off a Cliff in June
Summary: Investors didn't appreciate the company's news about accounting errors in its financial statements.
Sentiment: negative
Powered by Brave
Recent Updates
News Summary
As of 2026-07-10. Recent updates for Rikhav Securities Ltd. include the release of quarterly results with limited detailed financial data publicly available, reflecting stable but modest earnings performance. Regulatory compliance is evidenced by a detailed public statement filed in line with SEBI takeover regulations, ensuring transparency in shareholder communications. The company continues to maintain operational transparency through updated bank details for fund transfers, facilitating investor transactions. Market data platforms such as Equitymaster and ZoomInfo have provided current stock price updates and company overviews, supporting investor information needs. No significant leadership changes or strategic acquisitions were reported in the recent period.
News Sentiment
The overall sentiment from recent updates is predominantly neutral to mildly positive, driven by regulatory compliance disclosures and ongoing market engagement. The absence of major financial surprises or strategic shifts tempers enthusiasm, while steady operational transparency and stable market presence support a balanced outlook. Positive sentiment from regulatory adherence and investor communication is offset by limited growth indicators in the latest quarterly data, resulting in a cautiously optimistic tone.
Source List
- https://www.rikhav.net/investor-relations.html
- https://blinkx.in/insights/results/rikhav-securities-ltd-quarterly-result
- https://www.sebi.gov.in/sebi_data/commondocs/apr-2026/Rikhav%20Securities%20Limited-DPS_p.pdf
- https://www.equitymaster.com/share-price/RIKH/544340/RIKHAV-SECURITIES-LTD-Share-Price
- https://www.zoominfo.com/c/rikhav-securities-ltd/347886201
Analytical Overview
Analysis Summary
Rikhav Securities Ltd.’s valuation metrics, including a trailing P/E of 9.14, are below the industry average P/E of 9.14, indicating the stock is valued modestly relative to earnings. The absence of forward P/E and PEG ratio data limits forward-looking valuation assessment. The company exhibits a positive revenue growth rate of 12.93% quarter-over-quarter, supported by stable operating cash flow of ₹653.2 million and free cash flow of ₹189.6 million, signaling a steady growth trajectory. Financial health appears robust with low total debt of ₹78.9 million against cash reserves exceeding ₹2.37 billion, resulting in a strong current ratio of 2.58, reflecting liquidity strength. Sector-specific challenges include regulatory oversight in the Indian financial services market and competitive pressures, while opportunities arise from increasing retail participation and technology adoption. Considering the Indian market context, regulatory compliance and evolving consumer investment trends are critical factors influencing company prospects.
Overall Business and Market Assessment
Supporting Factors: solid cash reserves and low debt enhancing financial stability, a reasonable valuation with a P/E of 9.14 below industry average, and consistent revenue growth of nearly 13% quarter-over-quarter
Risk Factors: No data
SWOT Analysis
Strengths
- Strong cash reserves exceeding ₹2.37 billion provide liquidity and financial flexibility.
- Low total debt of ₹78.9 million supports a conservative capital structure.
- Consistent revenue growth of approximately 12.9% quarter-over-quarter indicates business expansion.
- Insider ownership of nearly 75% ensures aligned management interests and control.
Weaknesses
- Thin profit margins with net margin below 1% limit profitability.
- Negative enterprise value to EBITDA ratio suggests valuation complexities.
- Lack of institutional investor participation may reduce market liquidity.
- Absence of dividend payments limits shareholder income appeal.
Opportunities
- Growing retail investor base in India offers potential market expansion.
- Technological advancements can enhance trading platform capabilities.
- Regulatory reforms may create new avenues for financial services growth.
- Strategic partnerships could diversify revenue streams and client base.
Threats
- Regulatory changes in the Indian financial sector could increase compliance costs.
- Intense competition from established financial service providers may pressure margins.
- Macroeconomic volatility in India could affect client investment activity.
- Market sentiment influenced by insider-dominated shareholding may impact stock liquidity.
Company Description
Rikhav Securities Ltd. is a financial services company based in India, specializing in a range of investment management and advisory services. Its primary function is to facilitate trading and investment solutions for both individual and institutional clients. Rikhav Securities places a strong emphasis on providing diversified financial products, including equity and derivative trading, portfolio management, and wealth advisory services. As a key player in the financial market, the company leverages advanced technology to offer seamless trading platforms and research tools, ensuring informed decision-making for its clientele. The company impacts a variety of sectors, catering to retail investors, high-net-worth individuals, and corporate clients, thus playing an integral role in the financial ecosystem. Rikhav Securities is known for its robust customer focus, aligning its operations to meet the evolving needs of its clients. In a competitive market landscape, Rikhav Securities Ltd. distinguishes itself through its commitment to innovation, customer engagement, and strategic partnerships, contributing to the overall development of financial markets in India.