


Reliance Industries Ltd (RELIANCE)
Stock Analysis Report
Stock Journey
Key Positives and Key Risks
Pros
- Strong market capitalization of ₹17.33 trillion reflecting significant scale and investor confidence.
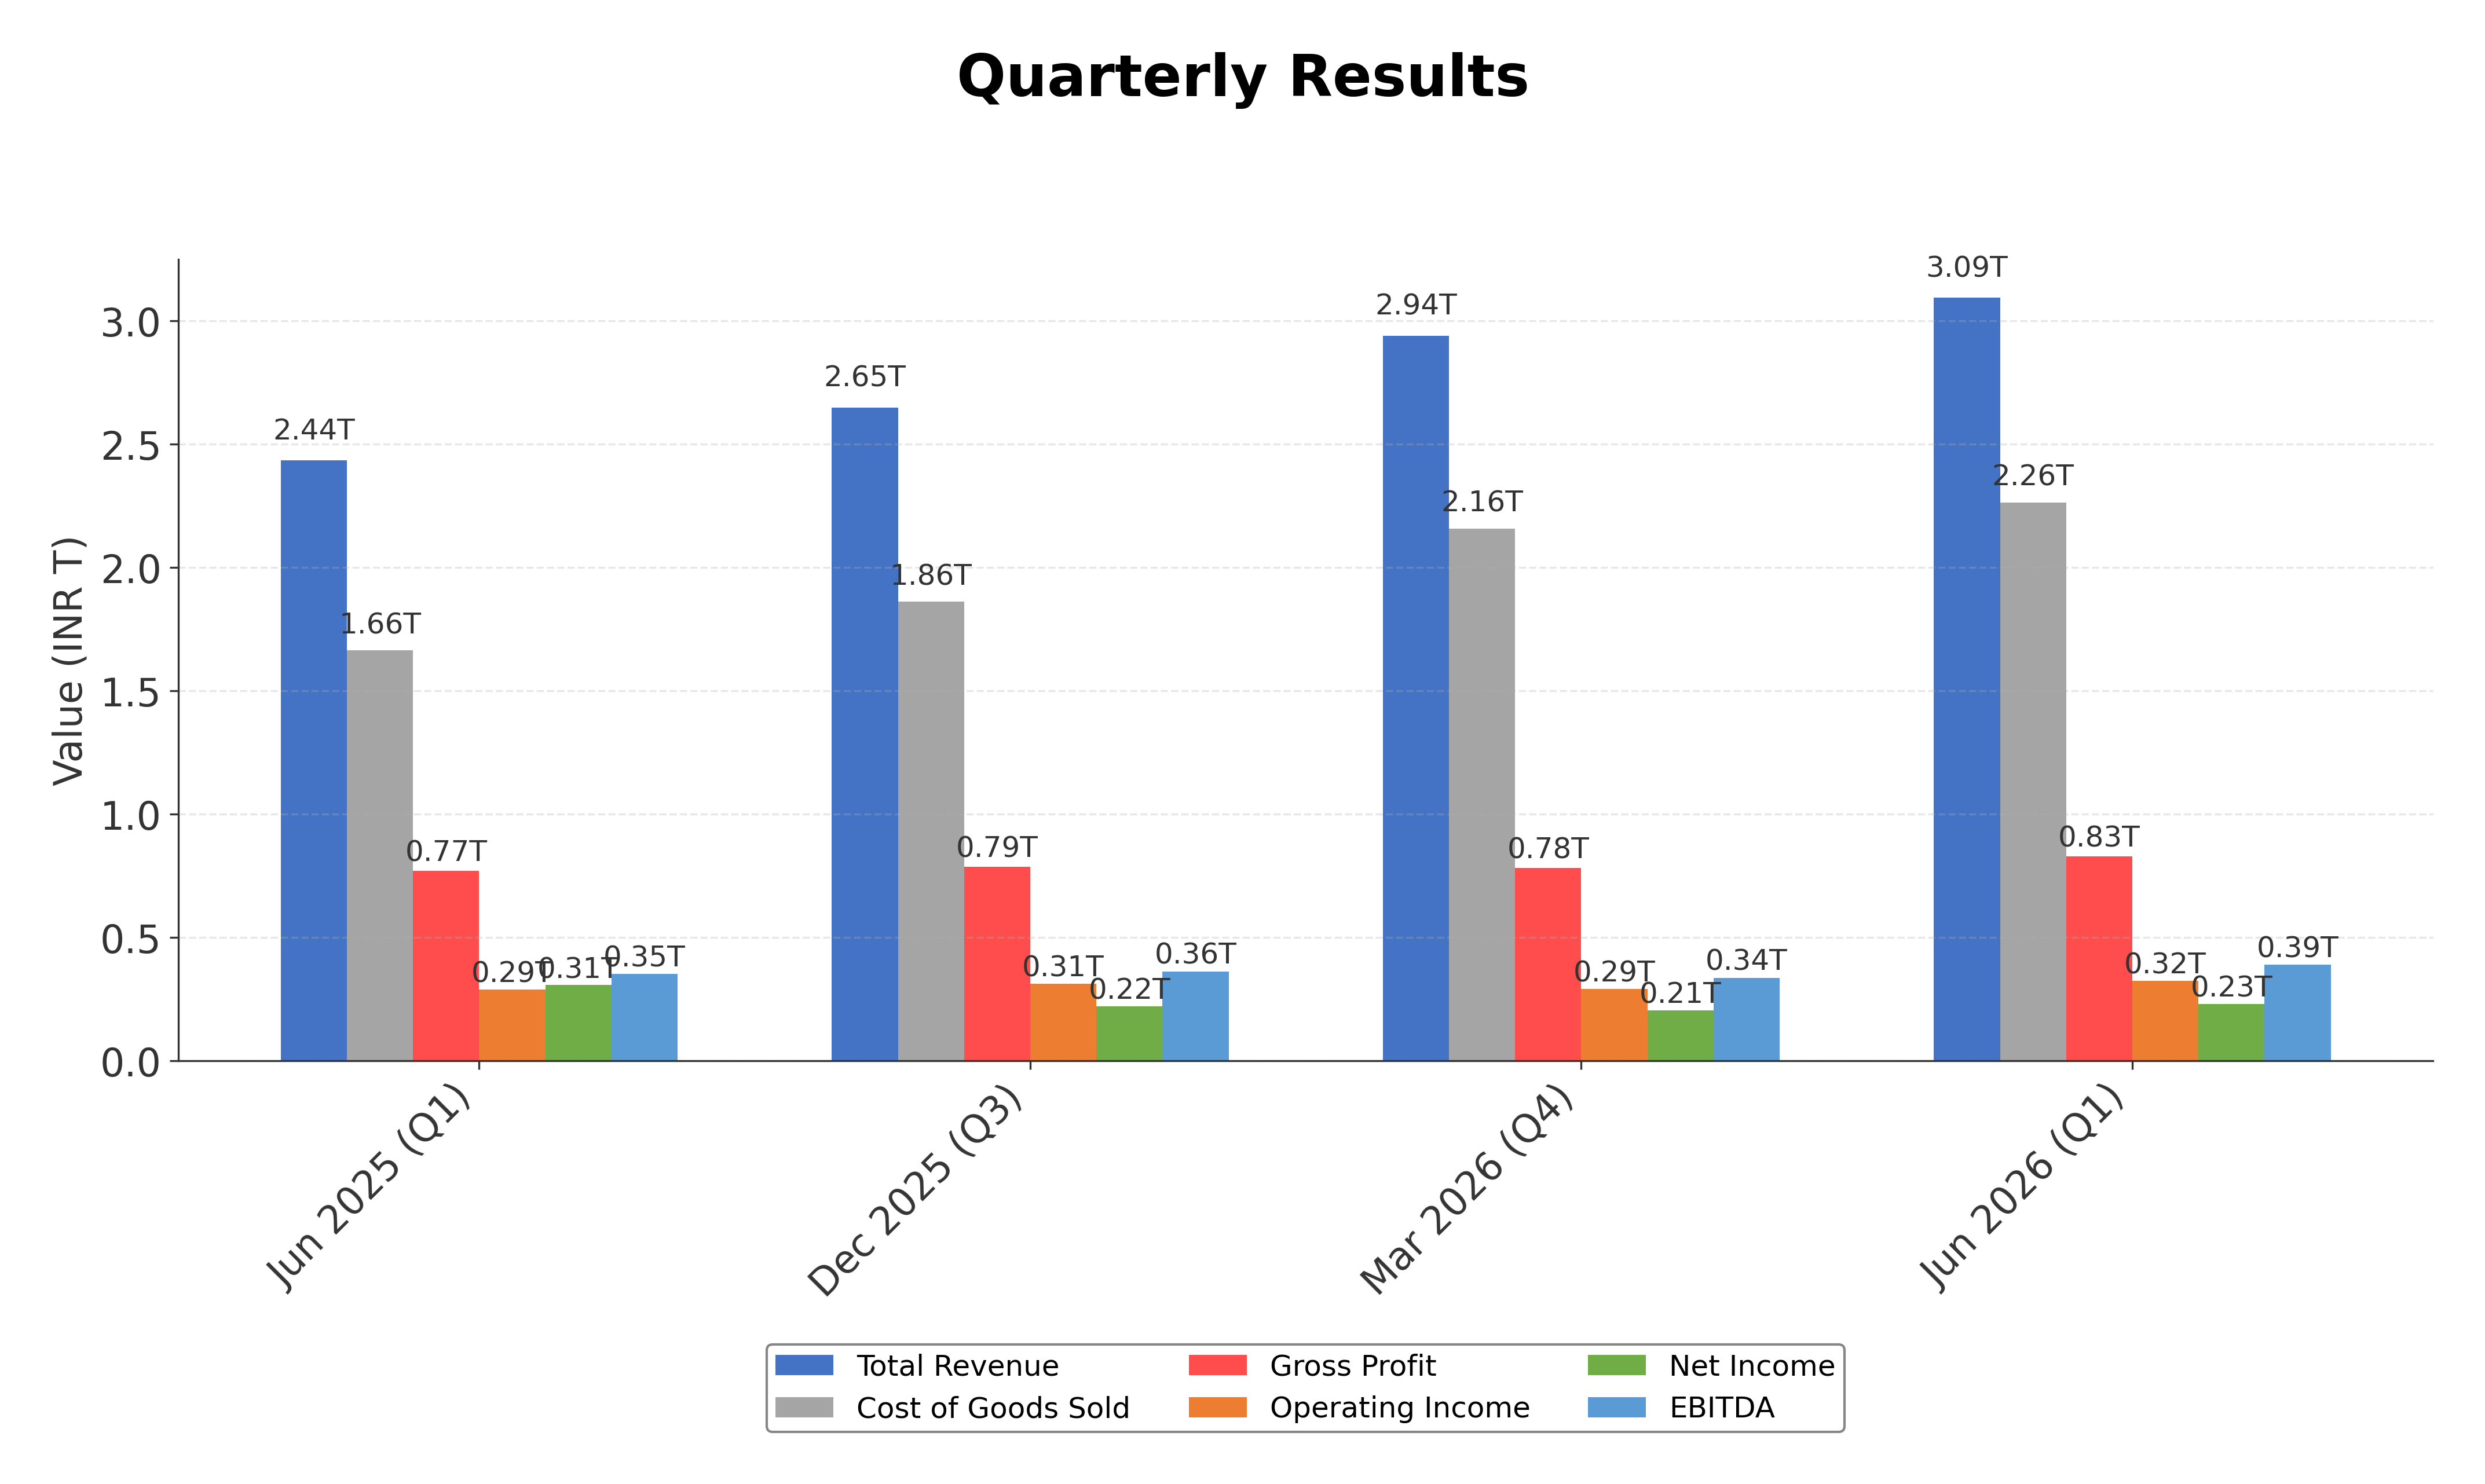
- Robust revenue growth of 29.7% quarter-over-quarter indicating strong operational momentum.
- Healthy cash reserves of ₹2.58 trillion supporting capital expenditure and strategic initiatives.
Cons
- Stock trading below 50-day and 200-day moving averages signaling short-term technical weakness.
- Margin pressures in retail and petrochemical segments impacting profitability.
- Supply chain disruptions affecting crude acquisition and refinery operations posing operational risks.
Disclosure: This information is for general awareness and does not constitute investment advice
Report Summary
Reliance Industries Ltd. is a leading Indian multinational conglomerate listed on the NSE, operating primarily in the Energy sector with significant presence in Oil & Gas Refining & Marketing. The company’s diversified portfolio spans hydrocarbon exploration, petroleum refining, petrochemicals, retail, telecommunications via Jio, media, entertainment, and new energy initiatives. Reliance holds a dominant market position in India, leveraging its integrated operations and extensive consumer reach across multiple industries.
Financially, Reliance reported trailing twelve months (TTM) revenue of approximately ₹11.3 trillion with a gross margin of 26.8%, operating margin of 12.3%, and net profit margin of 6.6%. The company’s return on equity (ROE) stands at 7.44% and return on assets (ROA) at 3.7%, reflecting moderate profitability and efficient asset utilization. Its return on invested capital (ROIC) is supported by strong EBITDA of ₹1.44 trillion and operating cash flow of ₹600 billion, indicating robust operational cash generation.
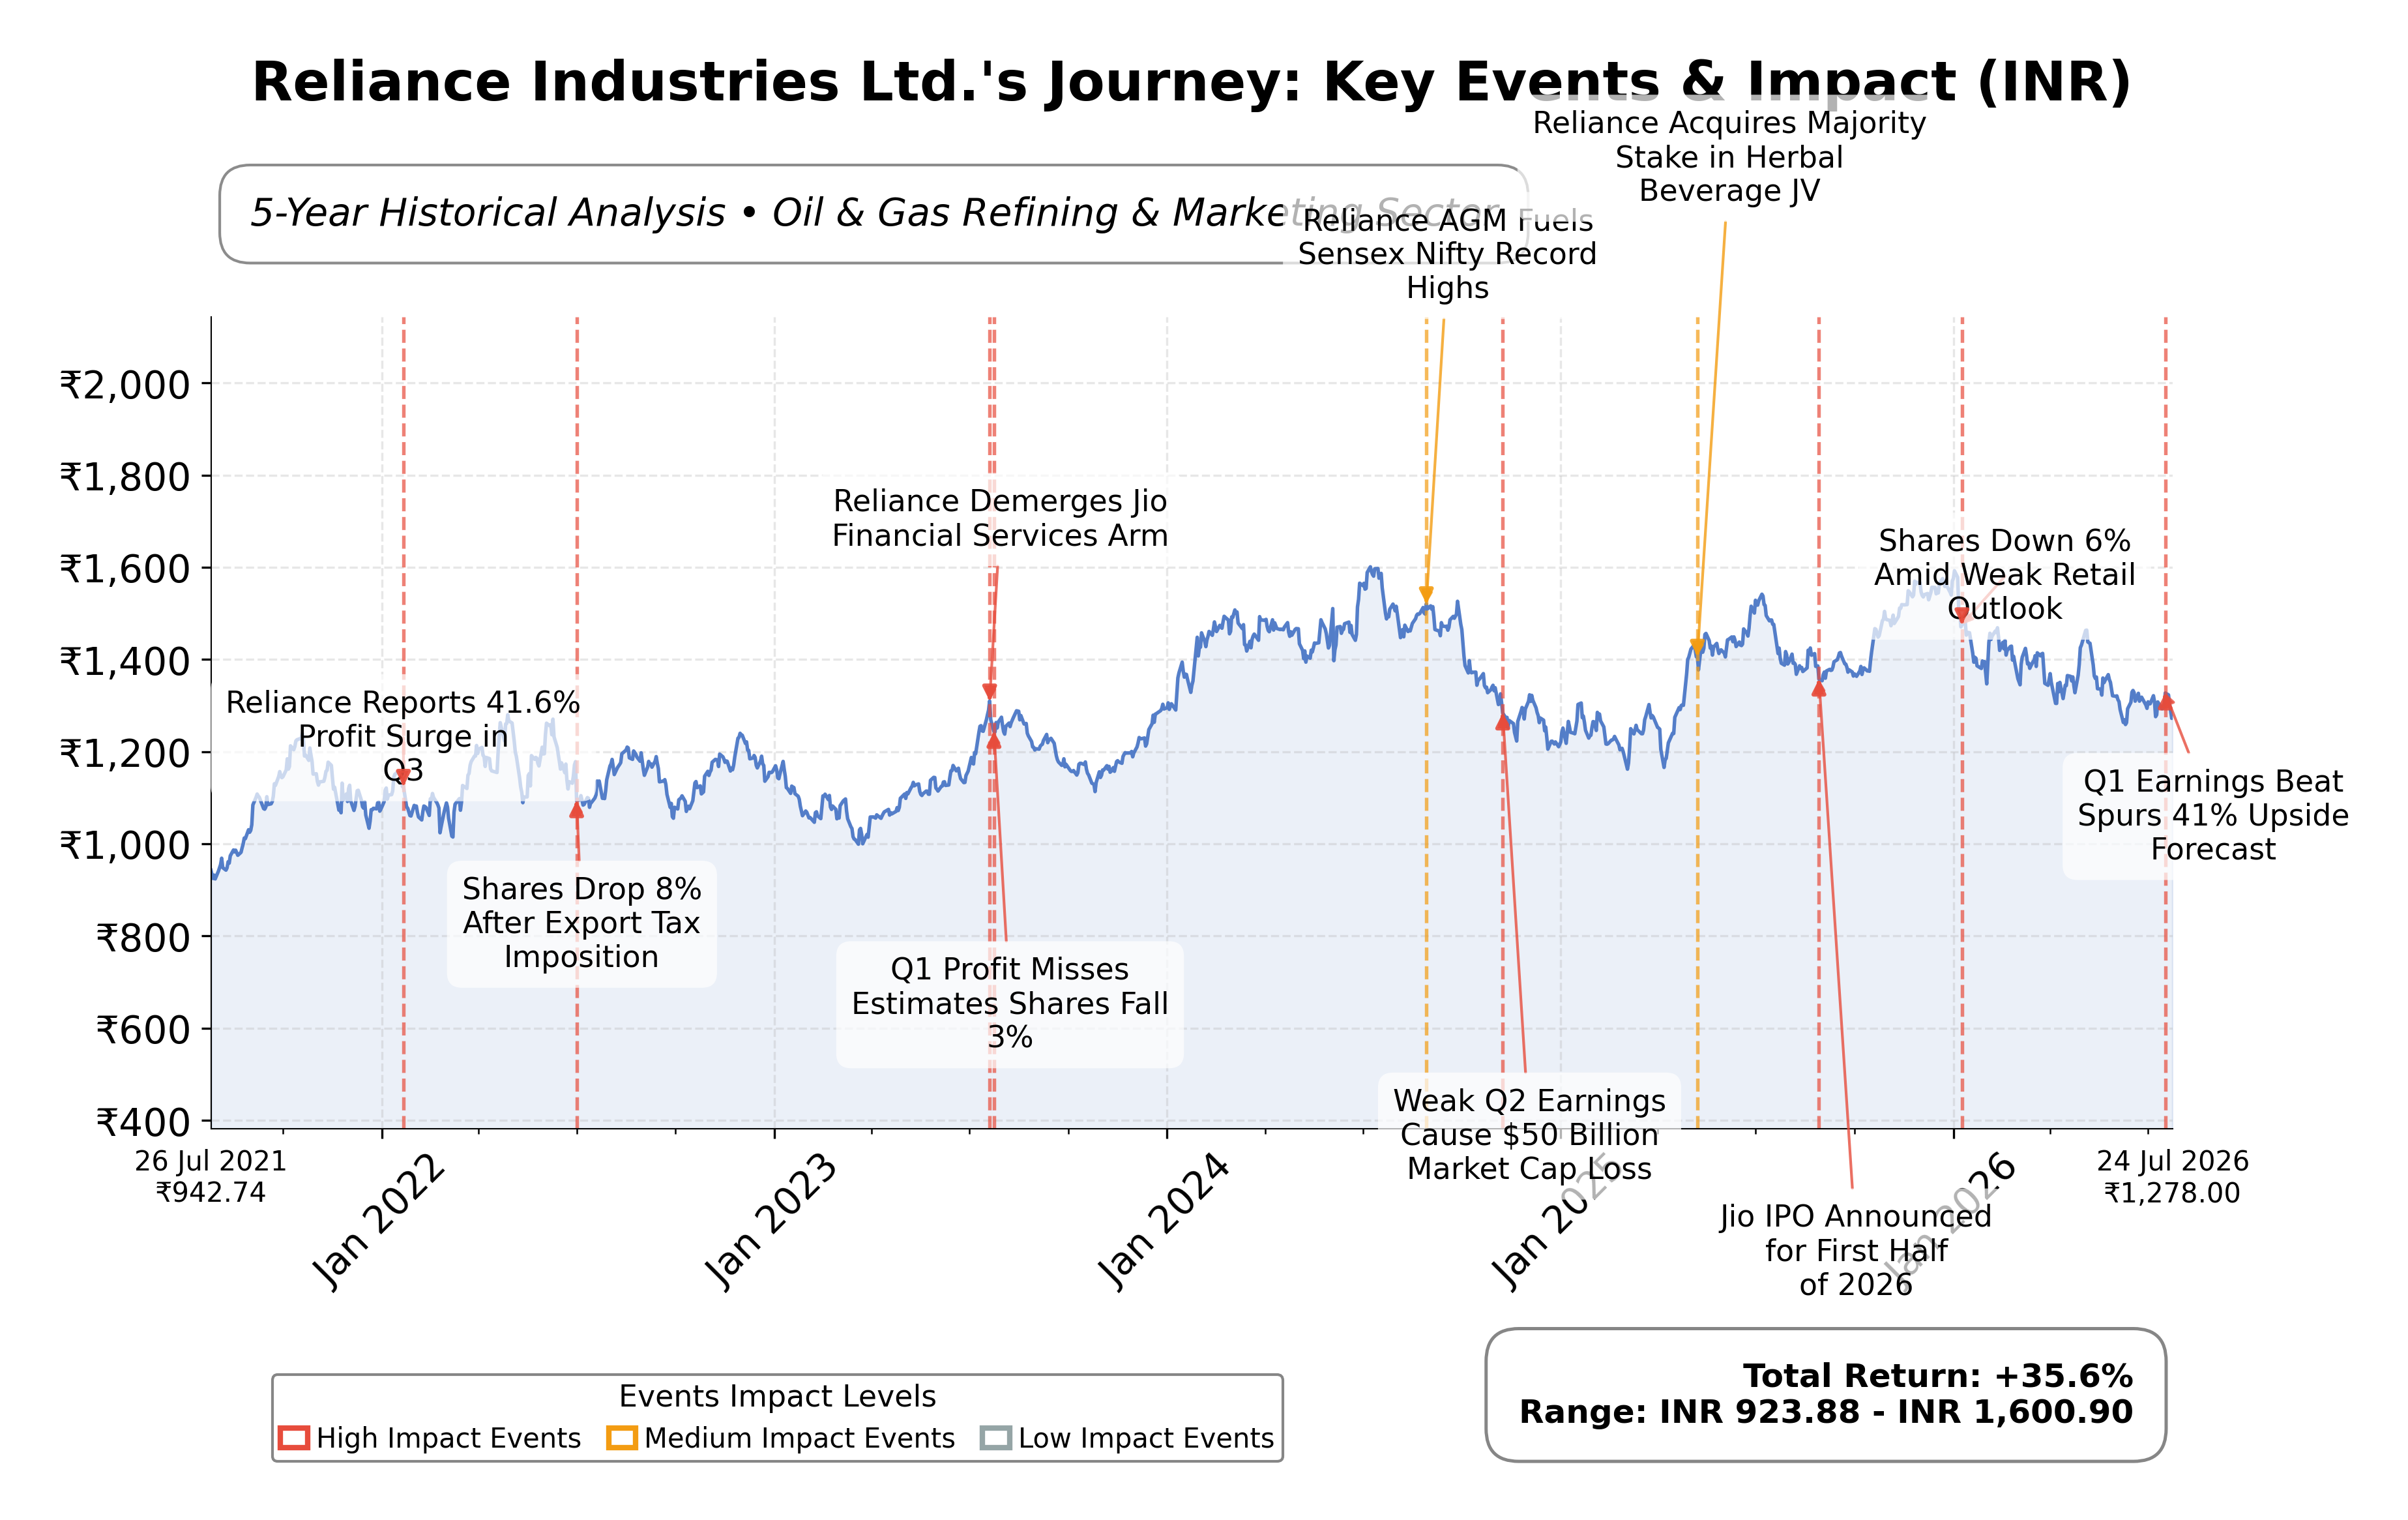
Valuation metrics show Reliance trading at a trailing P/E of 23.01 and forward P/E of 17.79, with a price-to-book ratio of 1.60 and EV/EBITDA of 11.31. The market capitalization is approximately ₹17.33 trillion. The stock’s current price of ₹1,280.30 is closer to its 52-week low of ₹1,249.80 than the high of ₹1,611.80, indicating a downside risk of about 26% from the high. These valuation levels suggest the stock is priced with moderate growth expectations relative to its fundamentals.
Reliance’s strengths include a strong cash position of over ₹2.58 trillion, manageable debt with a debt-to-equity ratio of 36.65%, and market leadership across multiple sectors. Key risks involve supply chain disruptions impacting crude acquisition, margin pressures in retail and petrochemicals, and regulatory challenges in energy markets. Recent strategic actions include expansion in digital commerce, growth in Jio’s subscriber base to 533 million, and investments in new energy ventures, positioning the company for future growth.
Technically, the stock is trading below its 50-day and 200-day moving averages, with momentum indicators reflecting a cautious stance. Recent news highlights strong revenue growth and operational resilience amid challenges. Overall, the data suggests a balanced outlook where market participants may consider monitoring developments closely, reflecting a phase of consolidation and selective accumulation potential.
Company and Industry Overview
Company Basics
Price Performance
Company Size
Shareholding Pattern
Sector and Industry Analysis
The energy and petrochemicals sector in India is a significant contributor to the national economy, encompassing refining, chemicals, and fuel marketing with a large and growing market size driven by industrialization and consumer demand. The sector includes major integrated players such as Reliance Industries, Indian Oil Corporation, and Bharat Petroleum, which operate large-scale refining and petrochemical complexes. Growth is supported by increasing domestic consumption, export opportunities, and ongoing investments in capacity expansion and technological upgrades.
Industry trends highlight a shift toward vertical integration and diversification, with companies expanding into downstream consumer-facing businesses like retail and telecommunications to capture new revenue streams. Competitive dynamics favor firms with scale, cost efficiency, and execution capabilities, as barriers to entry remain high due to capital intensity, technology requirements, and regulatory approvals. Reliance Industries exemplifies this trend by leveraging its integrated model and early investments in digital infrastructure to maintain a competitive edge.
The regulatory environment for the sector is shaped by government policies on energy security, environmental standards, and foreign investment norms, which influence operational costs and expansion plans. Recent emphasis on sustainability and cleaner energy sources is prompting companies to invest in new-energy businesses and reduce carbon footprints. Regulatory oversight on pricing, import duties, and export incentives also impacts profitability and market positioning, requiring firms to adapt strategically to evolving compliance requirements.
Note: Analysis synthesized from industry research, market reports, and regulatory filings. Information is subject to change based on market conditions.
Financial Ratios Dashboard
Illustrative Scenario Analysis
DCF Assumptions:
Method: Two-Stage EPS-Priority Model
Financials
Peer Analysis
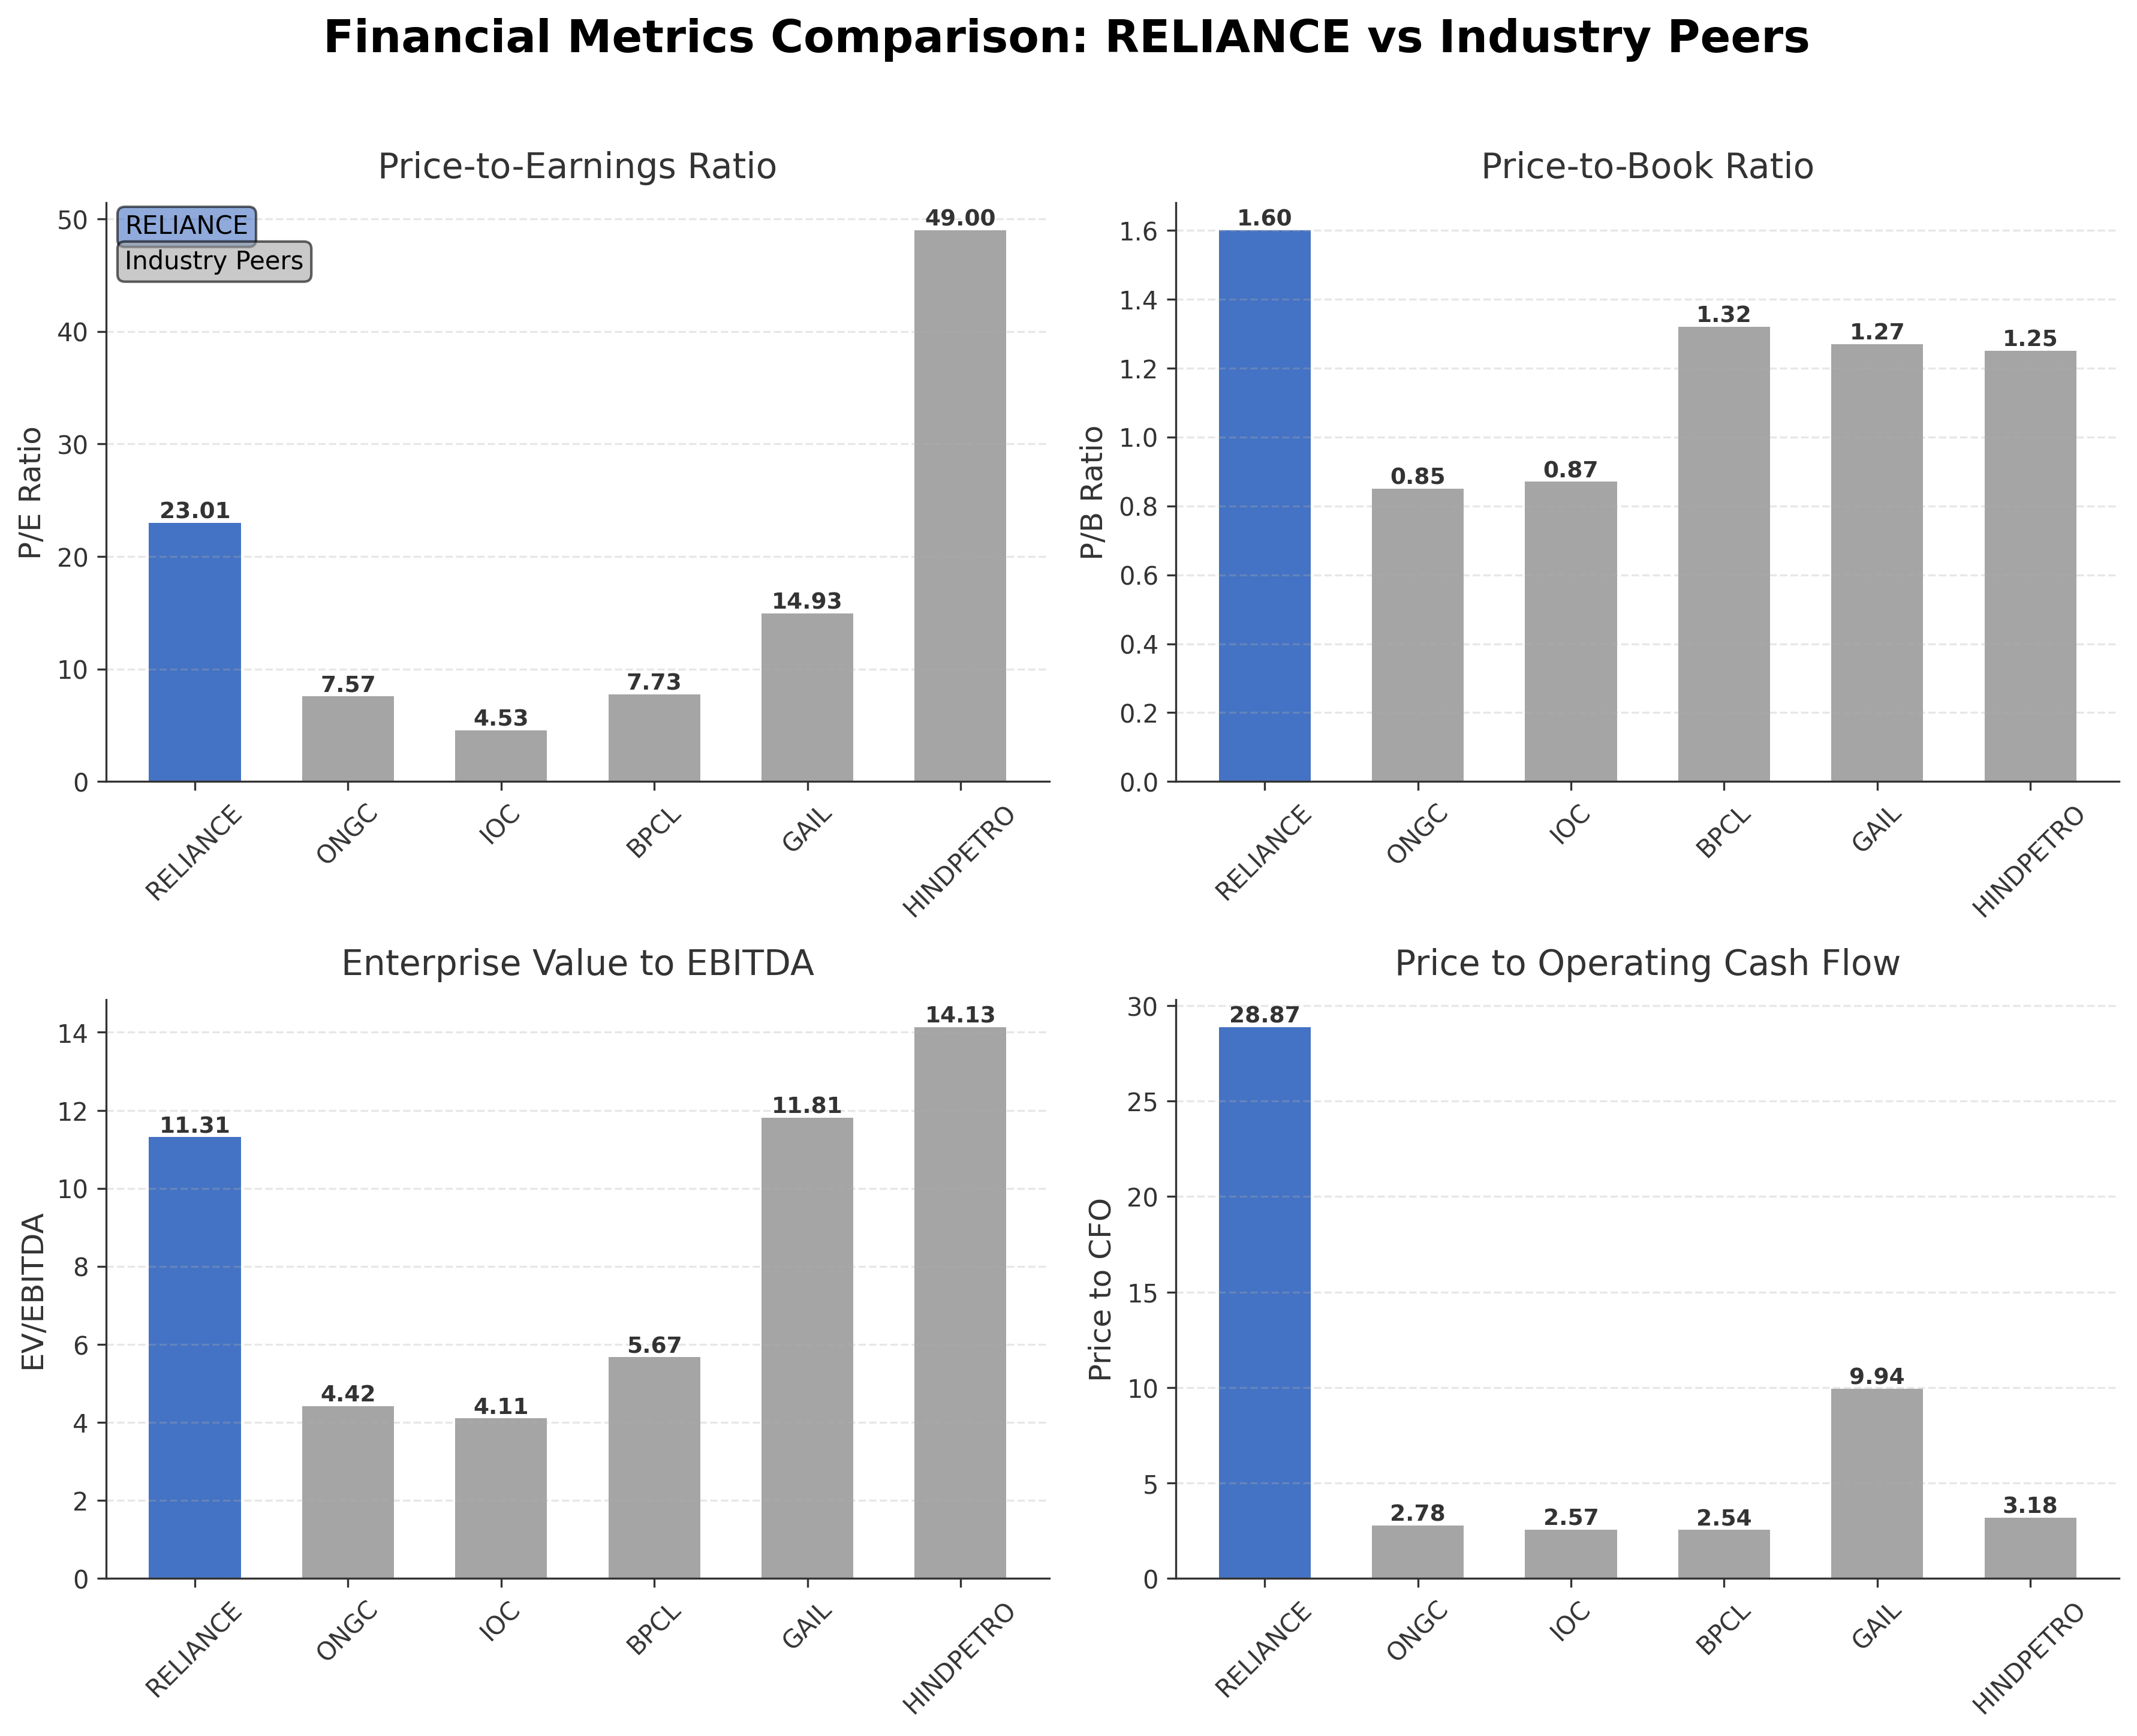
| Company Name | Market Cap | P/E Ratio | P/B Ratio | EV/EBITDA | Price to CFO |
|---|---|---|---|---|---|
| Reliance Industries Ltd. | ₹17.33T | 23.01 | 1.60 | 11.31 | 28.87 |
| Oil & Natural Gas Corporation Ltd. | ₹3.13T | 7.57 | 0.85 | 4.42 | 2.78 |
| Indian Oil Corporation Limited | ₹1.96T | 4.53 | 0.87 | 4.11 | 2.57 |
| Bharat Petroleum Corporation Limited | ₹1.33T | 7.73 | 1.32 | 5.67 | 2.54 |
| GAIL (India) Limited | ₹1.12T | 14.93 | 1.27 | 11.81 | 9.94 |
| Hindustan Petroleum Corporation Limited | ₹810.91B | 49.00 | 1.25 | 14.13 | 3.18 |
Comparison Analysis: Reliance Industries Ltd. stands out among its Indian oil and gas peers with the largest market capitalization at ₹17.33 trillion and a higher P/E ratio of 23.01, reflecting growth expectations above the sector average. Its price-to-book ratio of 1.60 is moderately higher than most peers, indicating premium valuation relative to book value. The EV/EBITDA multiple of 11.31 aligns closely with GAIL but is significantly above other state-owned enterprises like ONGC and IOC, which trade at lower multiples. Reliance’s price to CFO ratio is notably elevated at 28.87, suggesting strong cash flow valuation compared to peers. Return on equity at 7.44% is lower than some peers like IOC and Hindustan Petroleum but reflects the company’s diversified business model and reinvestment strategy.
Financial Metrics Comparison with Peers
Financial Statements
Comprehensive financial data including income, balance sheet, and cash flow metrics
Income Statement
| fiscal_date | 2026-03-31 | 2025-03-31 | 2024-03-31 | 2023-03-31 | 2022-03-31 |
|---|---|---|---|---|---|
| Sales | 10572.19B | 9646.93B | 9010.64B | 8778.35B | 6959.63B |
| Cost Of Goods | 7868.24B | 7226.87B | 6745.99B | 6718.98B | 5316.78B |
| Gross Profit | 2703.95B | 2420.06B | 2264.65B | 2059.37B | 1642.85B |
| Operating Expense Selling General And Administrative | 382.98B | 380.26B | 371.42B | 316.73B | 248.25B |
| Operating Expense Other Operating Expenses | 778.46B | 631.92B | 530.45B | 477.35B | 420.90B |
| Operating Income | 1213.77B | 1124.62B | 1116.66B | 1020.15B | 787.63B |
| Non Operating Interest Income | 133.02B | 124.10B | 107.45B | 112.40B | 125.29B |
| Non Operating Interest Expense | 240.56B | 221.21B | 217.72B | 189.58B | 144.38B |
| Pretax Income | 1231.62B | 1060.17B | 1047.27B | 940.46B | 821.54B |
| Income Tax | 275.52B | 252.30B | 257.07B | 203.76B | 159.70B |
| Net Income | 957.54B | 813.09B | 790.20B | 740.88B | 678.45B |
| Ebit | 1472.18B | 1281.38B | 1264.99B | 1130.04B | 965.92B |
| Ebitda | 2020.76B | 1798.71B | 1756.75B | 1547.65B | 1222.88B |
| Net Income Continuous Operations | 1231.62B | 1060.17B | 1047.27B | 948.01B | 841.42B |
| Minority Interests | -149.79B | -116.61B | -93.99B | -73.86B | -71.40B |
| Preferred Stock Dividends | 0.00 | 0.00 | 0.00 | 0.00 | 0.00 |
| Eps Basic | N/A | 51.47 | 51.45 | 49.30 | 46.00 |
| Eps Diluted | N/A | 51.47 | 51.45 | 49.30 | 45.43 |
| Basic Shares Outstanding | N/A | 13.53B | 13.53B | 13.53B | 13.53B |
| Diluted Shares Outstanding | N/A | 13.53B | 13.53B | 13.53B | 13.53B |
Data provided by Twelve Data
Balance Sheet
| fiscal_date | 2026-03-31 | 2025-03-31 | 2024-03-31 | 2023-03-31 | 2022-03-31 |
|---|---|---|---|---|---|
| Cash And Cash Equivalents | 1373.27B | 1006.45B | 935.40B | 341.56B | 335.09B |
| Accounts Receivable | 584.91B | 421.21B | 316.28B | 284.48B | 236.40B |
| Total Assets | 21781.40B | 19501.21B | 17559.86B | 16074.31B | 14996.65B |
| Total Liabilities | 10922.74B | 9404.95B | 8301.98B | 7785.50B | 6106.81B |
| Long Term Debt | 2869.49B | 2540.41B | 2401.27B | 1994.06B | 2007.06B |
| Shareholders Equity | 10858.66B | 10096.26B | 9257.88B | 8288.81B | 8889.84B |
Data provided by Twelve Data
Cash Flow Statement
| fiscal_date | 2026-03-31 | 2025-03-31 | 2024-03-31 | 2023-03-31 | 2022-03-31 |
|---|---|---|---|---|---|
| Operating Activities Net Income | 1231.62B | 1060.17B | 1047.27B | 948.01B | 841.42B |
| Operating Activities Other Non Cash Items | 109.71B | 100.01B | 111.90B | 79.58B | 23.36B |
| Operating Activities Accounts Receivable | -533.22B | -178.37B | -156.74B | 131.94B | -141.80B |
| Operating Activities Other Assets Liabilities | -207.90B | 31.34B | -127.56B | -322.28B | -249.83B |
| Operating Activities Operating Cash Flow | 600.21B | 1013.15B | 874.87B | 837.25B | 473.15B |
| Investing Activities Capital Expenditures | 8.26B | 23.43B | 153.07B | 91.86B | 31.37B |
| Investing Activities Purchase Of Investments | -9887.77B | -6843.40B | -5143.80B | -4718.22B | -6678.78B |
| Investing Activities Sale Of Investments | 9918.76B | 6725.58B | 5313.55B | 5012.66B | 6681.37B |
| Investing Activities Other Investing Activity | -47.36B | -45.74B | -44.23B | N/A | -193.06B |
| Investing Activities Investing Cash Flow | -8.11B | -140.13B | 278.59B | 386.30B | -159.10B |
| Financing Activities Long Term Debt Issuance | 388.71B | 263.78B | 696.10B | 359.36B | 593.43B |
| Financing Activities Long Term Debt Payments | -308.81B | -317.55B | -350.55B | -290.59B | -406.47B |
| Financing Activities Short Term Debt Issuance | -51.71B | 246.24B | -252.93B | 311.98B | -88.46B |
| Financing Activities Common Stock Issuance | 0.00 | 220.00M | 70.00M | 400.00M | 397.67B |
| Financing Activities Common Dividends | -74.43B | -67.66B | -60.89B | -50.83B | -42.97B |
| Financing Activities Financing Cash Flow | -46.24B | 125.03B | 230.10B | 335.11B | 457.70B |
| End Cash Position | 1459.77B | 1065.02B | 972.25B | 686.64B | 361.78B |
| Free Cash Flow | 691.97B | 387.36B | 59.05B | -259.56B | 105.09B |
| Financing Activities Other Financing Charges | N/A | N/A | 198.30B | 4.79B | 4.50B |
Data provided by Twelve Data
Technical Analysis
Key Insights
- Reliance Industries Ltd. is currently in a consolidation phase with price action showing a downtrend from the 52-week high of ₹1611.8 to the current price near ₹1280, indicating short-term bearish momentum.
- Key support levels are observed near ₹1249.8 (52-week low) and ₹1313.5 (50-day moving average), while resistance is noted around ₹1414.3 (200-day moving average) and the recent high of ₹1611.8.
- The stock is trading below both the 50-day moving average (₹1313.5) and 200-day moving average (₹1414.3), suggesting a bearish intermediate and long-term trend.
- Momentum indicators show RSI in a neutral to slightly oversold range, MACD below the signal line indicating bearish momentum, and Stochastic oscillator near lower bounds, reflecting potential for a short-term bounce.
- Analysis across daily, weekly, and monthly timeframes confirms a dominant sideways to downward trend with intermittent corrective rallies.
- Current technical setup suggests a cautious market scenario where price consolidation may continue, with potential volatility around key support and resistance levels.
Trending News
Summary: Reliance Share Price: Find the latest news on Reliance Stock Price. Get all the information on Reliance with historic price charts for NSE / BSE. Experts & Broker view also get the Reliance Ltd. buy/sell tips detailed news, announcements, Forecasts, Analysts, Valuation, Earning forecasts, ...
Sentiment: neutral
2. Headline: Reliance Industries Ltd (WBO:RLI) Q1 2027 Earnings Call Highlights: Strong Revenue Growth Amid ...
Summary: Reliance Industries Ltd (WBO:RLI) reports a 25% revenue increase, driven by Jio and retail segments, despite facing supply chain disruptions and cost pressures.
Sentiment: positive
3. Headline: Reliance Industries Ltd Sees High-Value Trading Amid Continued Downtrend
Summary: Reliance Industries Ltd (RELIANCE), one of India’s largest oil sector companies, witnessed significant trading activity on 23 Jul 2026, with a total traded volume exceeding 55 lakh shares and a turnover of over ₹7,082 crores. Despite this high-value trading, the stock underperformed the ...
Sentiment: positive
Summary: Goldman Sachs is bullish on Reliance Industries. The company is India's largest conglomerate with businesses spanning energy, petrochemicals, retail and telecommunications. The stock has fallen 18.5% YTD. Reliance Industries
Sentiment: negative
5. Headline: Reliance: Q2 Earnings Snapshot | MarketScreener
Summary: PHOENIX — PHOENIX — Reliance, Inc. on Wednesday reported second-quarter net income of $322.9 million. The Phoenix-based company said it had profit of $6.29 per share. Earnings, adjusted for...
Sentiment: neutral
Powered by Brave
Recent Updates
News Summary
As of July 24, 2026. Reliance Industries Ltd reported strong Q1 2027 earnings with a 25% revenue increase driven by Jio and retail segments, despite supply chain disruptions affecting crude acquisition and refinery operations. EBITDA rose 10% to over ₹54,000 crores, supported by operational efficiency and a healthy balance sheet with reduced net debt and strong cash flow. Jio expanded its subscriber base to 533 million, with notable growth in 5G and fixed broadband users. The retail business achieved 12% revenue growth, focusing on digital commerce and omnichannel expansion. Challenges included margin pressures in retail and petrochemicals due to higher costs and supply constraints. Analysts view the earnings as a positive trigger, with improved operational momentum and diversified growth drivers. The company’s strategic initiatives in digital and new energy sectors continue to underpin its long-term outlook.
News Sentiment
The overall sentiment across recent updates is predominantly positive, driven by strong revenue growth, operational improvements, and robust cash flow generation. Positive investor response is supported by Jio’s expanding subscriber base and retail segment growth, alongside a healthy balance sheet with manageable debt levels. However, caution remains due to supply chain disruptions and margin pressures in key segments, tempering enthusiasm with operational challenges. Brokerages maintain a constructive outlook, highlighting diversified earnings and potential value unlock through Jio’s IPO prospects. The balanced sentiment reflects confidence in Reliance’s strategic direction while acknowledging near-term headwinds.
Source List
- https://finance.yahoo.com/markets/stocks/articles/reliance-industries-ltd-wbo-rli-010025257.html
- https://www.businesstoday.in/markets/stocks/story/reliance-industries-q1-results-is-this-the-right-time-to-buy-the-stock-after-earnings-543975-2026-07-22
Analytical Overview
Analysis Summary
Reliance Industries’ valuation metrics, including a trailing P/E of 23.01 and forward P/E of 17.79, are higher than the industry average, reflecting market expectations for growth and operational diversification. The company exhibits a strong growth trajectory with a 29.7% quarterly revenue increase and robust cash flow trends, including operating cash flow of ₹600 billion and free cash flow of ₹808 billion, supporting capital expenditures and strategic investments. Financial health is solid with a total cash balance exceeding ₹2.58 trillion and a manageable debt-to-equity ratio of 36.65%, indicating prudent leverage management. Sector-specific challenges include supply chain disruptions and margin pressures in refining and retail, while opportunities arise from expanding digital services, new energy ventures, and retail omnichannel growth. Considering India-specific factors, Reliance benefits from a favorable regulatory environment, rising consumer demand, and a growing digital economy, enhancing its competitive positioning.
Overall Business and Market Assessment
Supporting Factors: strong revenue growth driven by diversified business segments, a robust balance sheet with ample liquidity, and strategic investments in high-growth areas such as digital and new energy
Risk Factors: supply chain constraints impacting crude procurement, margin erosion in retail and petrochemicals, and competitive pressures in telecom and energy sectors
SWOT Analysis
Strengths
- Market leadership across energy, petrochemicals, retail, and digital services.
- Strong cash flow generation with operating cash flow of ₹600 billion and free cash flow of ₹808 billion.
- Diversified business model reducing reliance on any single segment.
- Robust balance sheet with total cash of ₹2.58 trillion and manageable debt levels.
Weaknesses
- Margin pressures in retail and petrochemical segments due to high raw material and operational costs.
- Supply chain disruptions affecting crude acquisition and refinery operations.
- Relatively moderate return on equity at 7.44% compared to some peers.
- Stock trading below key moving averages indicating short-term technical weakness.
Opportunities
- Expansion of Jio’s subscriber base and potential IPO unlocking value.
- Growth in digital commerce and omnichannel retail platforms.
- Investments in new energy sectors such as solar, hydrogen, and batteries.
- Favorable regulatory environment supporting energy transition initiatives.
Threats
- Volatility in crude oil prices and supply chain uncertainties.
- Competitive pressures in telecom and retail markets.
- Regulatory and environmental compliance risks in energy operations.
- Macroeconomic factors impacting consumer spending and industrial demand.
Company Description
Reliance Industries Ltd. is an Indian multinational conglomerate headquartered in Mumbai, operating as one of the largest private sector corporations in the country. It spans a diverse portfolio including energy, where it engages in hydrocarbon exploration, petroleum refining, and oil-to-chemicals strategies through world-class facilities like the Jamnagar complex. The petrochemicals division produces polymers, polyesters, elastomers, and advanced materials, positioning it among the top global producers. Reliance Retail offers an omni-channel network with brands covering groceries, fashion, electronics, and jewelry, serving consumers and small merchants across India. Its digital services arm, Jio, provides broadband, mobile connectivity, and platforms fostering a digital-first ecosystem. The company also operates in media and entertainment, delivering content across various formats, and new energy, focusing on solar, hydrogen, batteries, and sustainable materials. Media and entertainment businesses include content creation and distribution tailored to India's diverse audiences. Founded in 1958, Reliance Industries Ltd. plays a pivotal role in India's industrial, consumer, and digital landscapes with integrated operations that emphasize innovation and sustainability.