


Reliance Industries Ltd (RELIANCE)
Stock Analysis Report
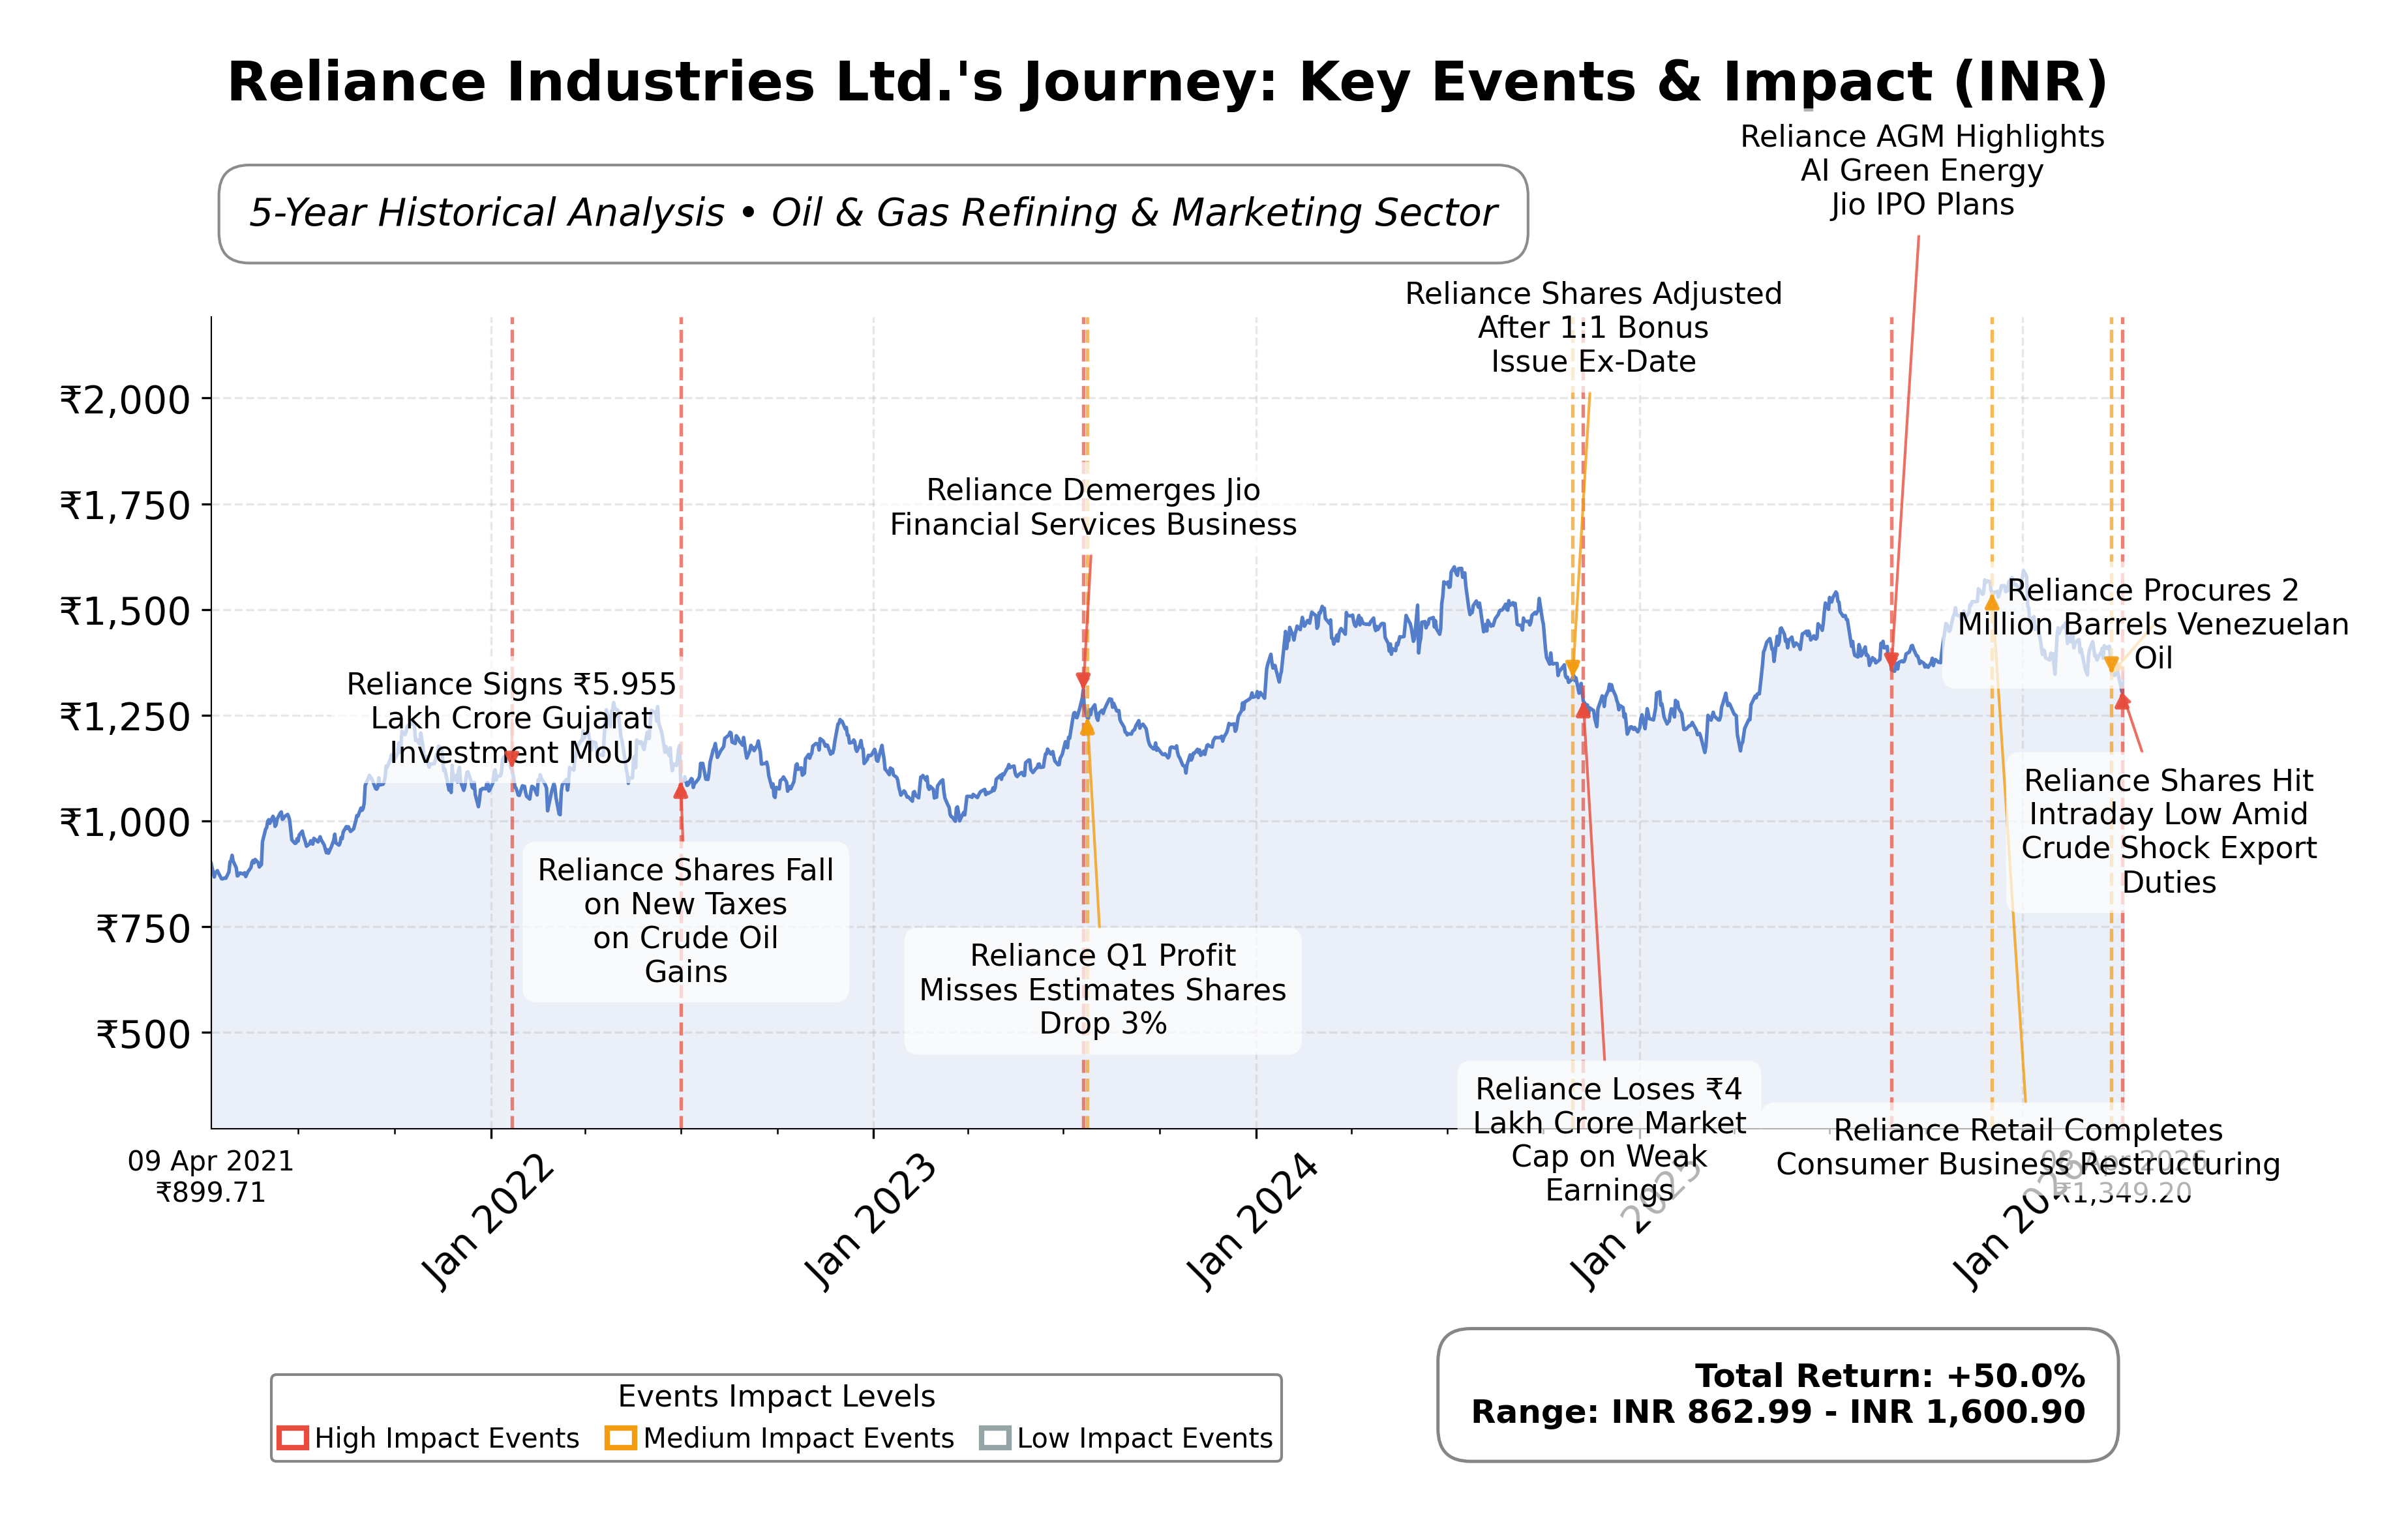
Stock Journey
Key Positives and Key Risks
Pros
- Market capitalization of ₹18.28 trillion underscores dominant industry position and scale.
- Revenue growth of 10.4% year-over-year indicates strong operational momentum.
- Operating cash flow of ₹1.01 trillion supports financial flexibility and investment capacity.
Cons
- Downside risk of 17.8% from 52-week high reflects recent share price volatility.
- Debt-to-equity ratio of 35.65% suggests moderate leverage requiring monitoring.
Disclosure: This information is for general awareness and does not constitute investment advice
Report Summary
Reliance Industries Ltd. is a leading Indian multinational conglomerate operating primarily in the energy sector, including oil and gas refining and marketing. The company has diversified operations spanning petrochemicals, retail, digital services through Jio, media, entertainment, and new energy initiatives. It holds a strong market position in India with integrated operations and a focus on innovation and sustainability.
Financially, Reliance Industries reports a market capitalization of approximately â¹18.28 trillion and an enterprise value near â¹21.51 trillion. The trailing P/E ratio stands at 21.98, closely aligned with the industry average, with a forward P/E of 20.59 and a PEG ratio of 1.75. The company shows a profit margin of 8.12% and an operating margin of 11.85%, supported by a revenue TTM of over â¹10.24 trillion and net income of â¹832 billion. Its balance sheet reflects total assets of â¹19.5 trillion and a current ratio of 1.10, indicating moderate liquidity.
Technically, the stock trades near â¹1,329 with a 52-week range between â¹1,114.85 and â¹1,611.80, showing a downside risk of 17.8% from the high. The company recently implemented a 2-for-1 stock split and maintains a forward dividend yield of 1.63%. Recent strategic initiatives include fuel sales caps amid supply constraints and ongoing digital and retail expansion. Strengths include diversified business lines and strong cash flow, while risks involve sector volatility and regulatory challenges.
Peer comparison within the Indian Oil & Gas Refining & Marketing industry shows Reliance as the largest by market cap, significantly surpassing peers like Bharat Petroleum and Mangalore Refinery. Reliance's valuation metrics such as P/E and EV/EBITDA are higher than most peers, reflecting its diversified portfolio and growth prospects. Return on equity is modest at 6.9%, comparable to peers, while some smaller companies show lower profitability and valuation multiples.
Reliance Industries navigates a complex industry landscape marked by energy market fluctuations, regulatory shifts, and evolving consumer trends. Recent achievements include strong revenue growth and strategic diversification, while challenges persist in supply constraints and market volatility. The companyâs integrated model and innovation focus position it at a pivotal moment where execution of current strategies will significantly influence its competitive standing. Given the data, a balanced approach toward share accumulation or realization of gains may be considered appropriate, with attention to market developments and company performance.
Company and Industry Overview
Company Basics
Price Performance
Company Size
Shareholding Pattern
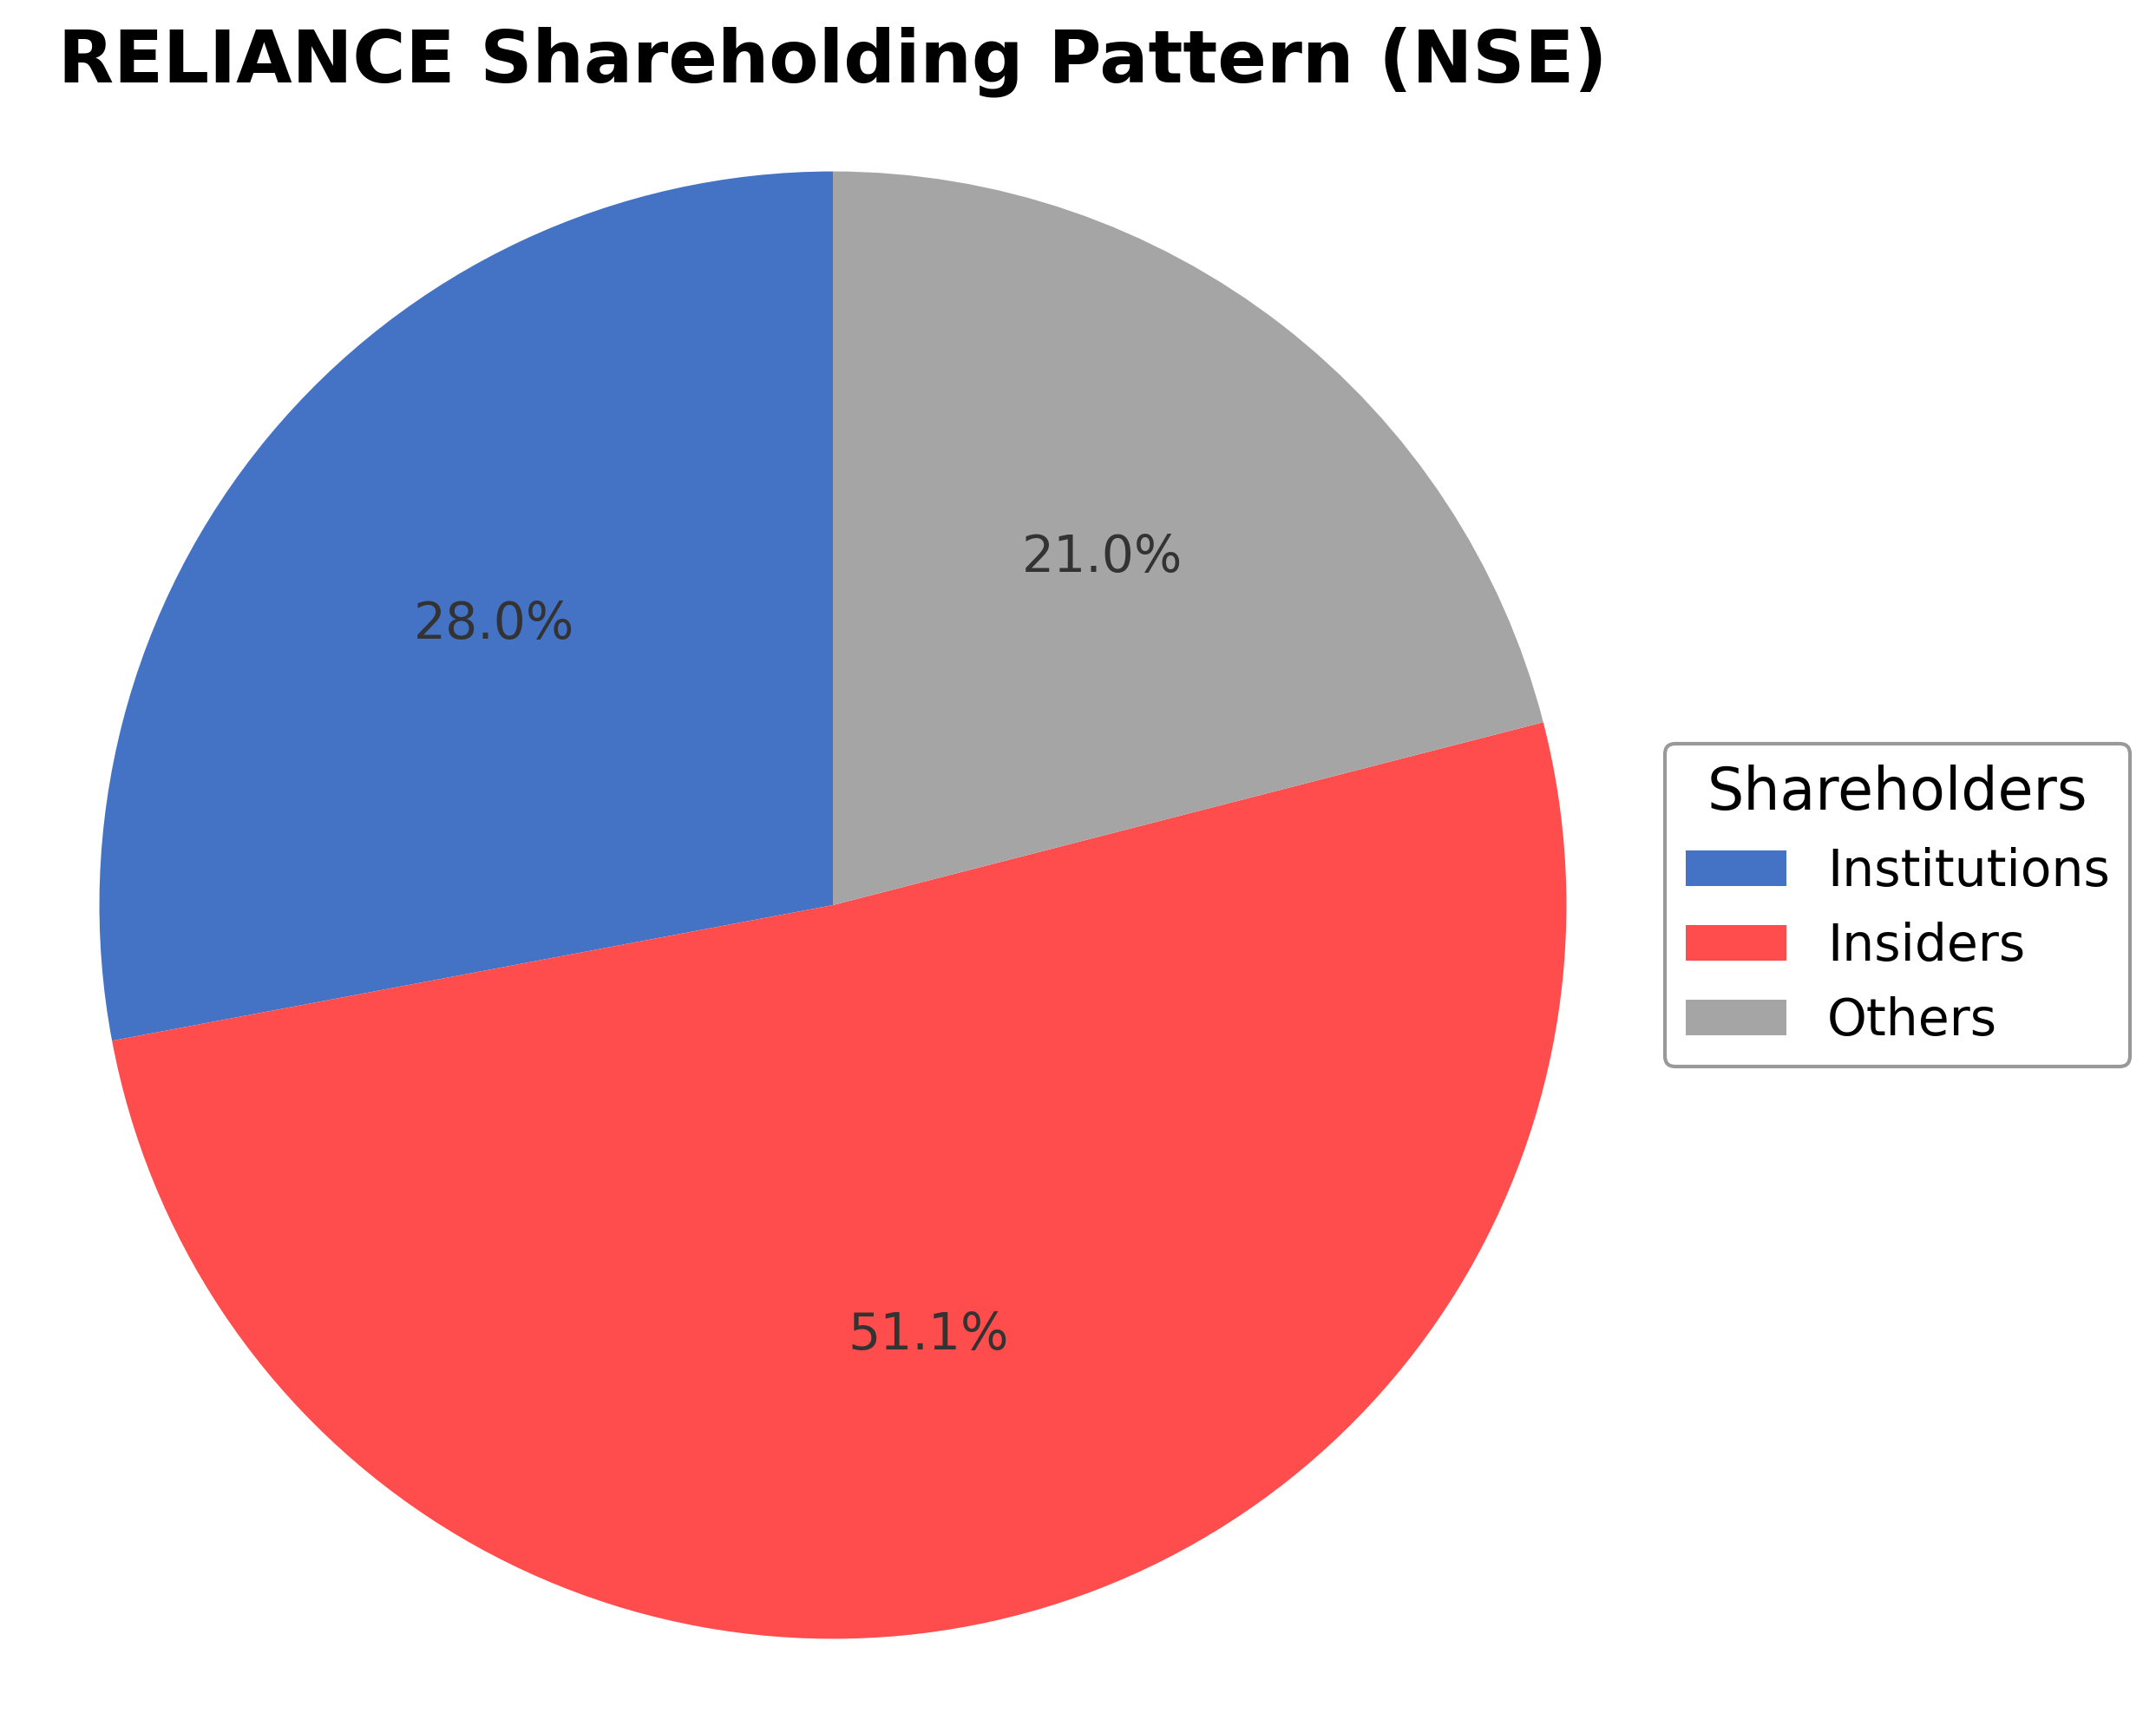
Reliance Industries Ltd. exhibits a shareholding structure dominated by insiders, holding approximately 51.05% of shares, including executives and board members. Institutional investors possess around 27.96%, comprising mutual funds, pension funds, and asset managers, reflecting moderate institutional interest. The remaining 20.99% is held by public shareholders, including retail investors and employee stock plans. Over the past 12-24 months, institutional accumulation has been steady with no significant large-scale disposals reported. Major funds have maintained or slightly increased their positions, indicating stable market sentiment. This ownership distribution supports strong governance continuity and strategic direction, with promoter control ensuring alignment on long-term objectives. The structure may facilitate decisive corporate actions while balancing external investor interests.
Sector and Industry Analysis
Reliance Industries Ltd. (RELIANCE) operates primarily within the Oil Exploration and Production sector, a critical segment of the broader energy industry that remains foundational to global economic activity. The sector encompasses upstream activities such as exploration, drilling, and production of crude oil and natural gas. Globally, the oil and gas sector is characterized by substantial market size, with revenues influenced by volatile commodity prices and geopolitical factors. Reliance, with a market capitalization near $195 billion as of 2026, ranks among the largest integrated energy companies in India and holds a significant position in the global energy landscape. The sector’s growth trajectory is currently shaped by fluctuating oil demand, energy transition pressures, and increasing investments in downstream and petrochemical diversification, areas where Reliance has strategically expanded.
Industry trends in oil exploration and production are increasingly influenced by technological innovation and shifting consumer and regulatory demands. Advances in seismic imaging, drilling techniques, and digital oilfield technologies are enhancing exploration efficiency and reducing operational costs. Concurrently, there is a growing pivot towards sustainability, with companies integrating cleaner energy solutions and investing in renewable energy assets. Consumer behavior is indirectly affecting the sector through demand for cleaner fuels and energy alternatives, prompting traditional oil majors to diversify portfolios. Reliance has capitalized on this by expanding its petrochemicals and refining capacities and investing in digital and retail ventures, reflecting an industry-wide trend toward integrated business models that mitigate upstream volatility.
The regulatory landscape governing the oil exploration and production sector is complex and multifaceted, encompassing environmental regulations, licensing regimes, and international trade policies. In India, regulatory bodies impose stringent compliance requirements related to environmental impact assessments, emissions standards, and resource management. Policy shifts toward energy security and self-reliance have led to reforms encouraging domestic exploration and production, but also increased scrutiny on environmental sustainability. Globally, climate change policies and commitments to reduce carbon emissions are compelling companies to adapt operational practices and invest in cleaner technologies. Reliance operates within this evolving regulatory framework, balancing compliance with growth ambitions, which necessitates continuous engagement with policymakers and adherence to both national and international standards.
Competitive dynamics in the oil exploration and production industry are shaped by high capital intensity, technological expertise, and geopolitical risk exposure, creating significant barriers to entry. The market structure is oligopolistic, dominated by large integrated oil and gas companies with diversified portfolios and global reach. Reliance’s competitive positioning benefits from its integrated business model spanning upstream, refining, petrochemicals, and retail sectors, enabling operational synergies and risk diversification. The company’s scale, technological capabilities, and strategic investments in digital infrastructure and new energy ventures provide competitive advantages. However, the sector faces ongoing challenges from new entrants in renewables and energy tech, necessitating agility and innovation to maintain market leadership amid shifting energy paradigms.
Note: Analysis synthesized from industry research, market reports, and regulatory filings. Information is subject to change based on market conditions.
Illustrative Scenario Analysis
DCF Assumptions:
Method: Two-Stage EPS-Priority Model
Financials
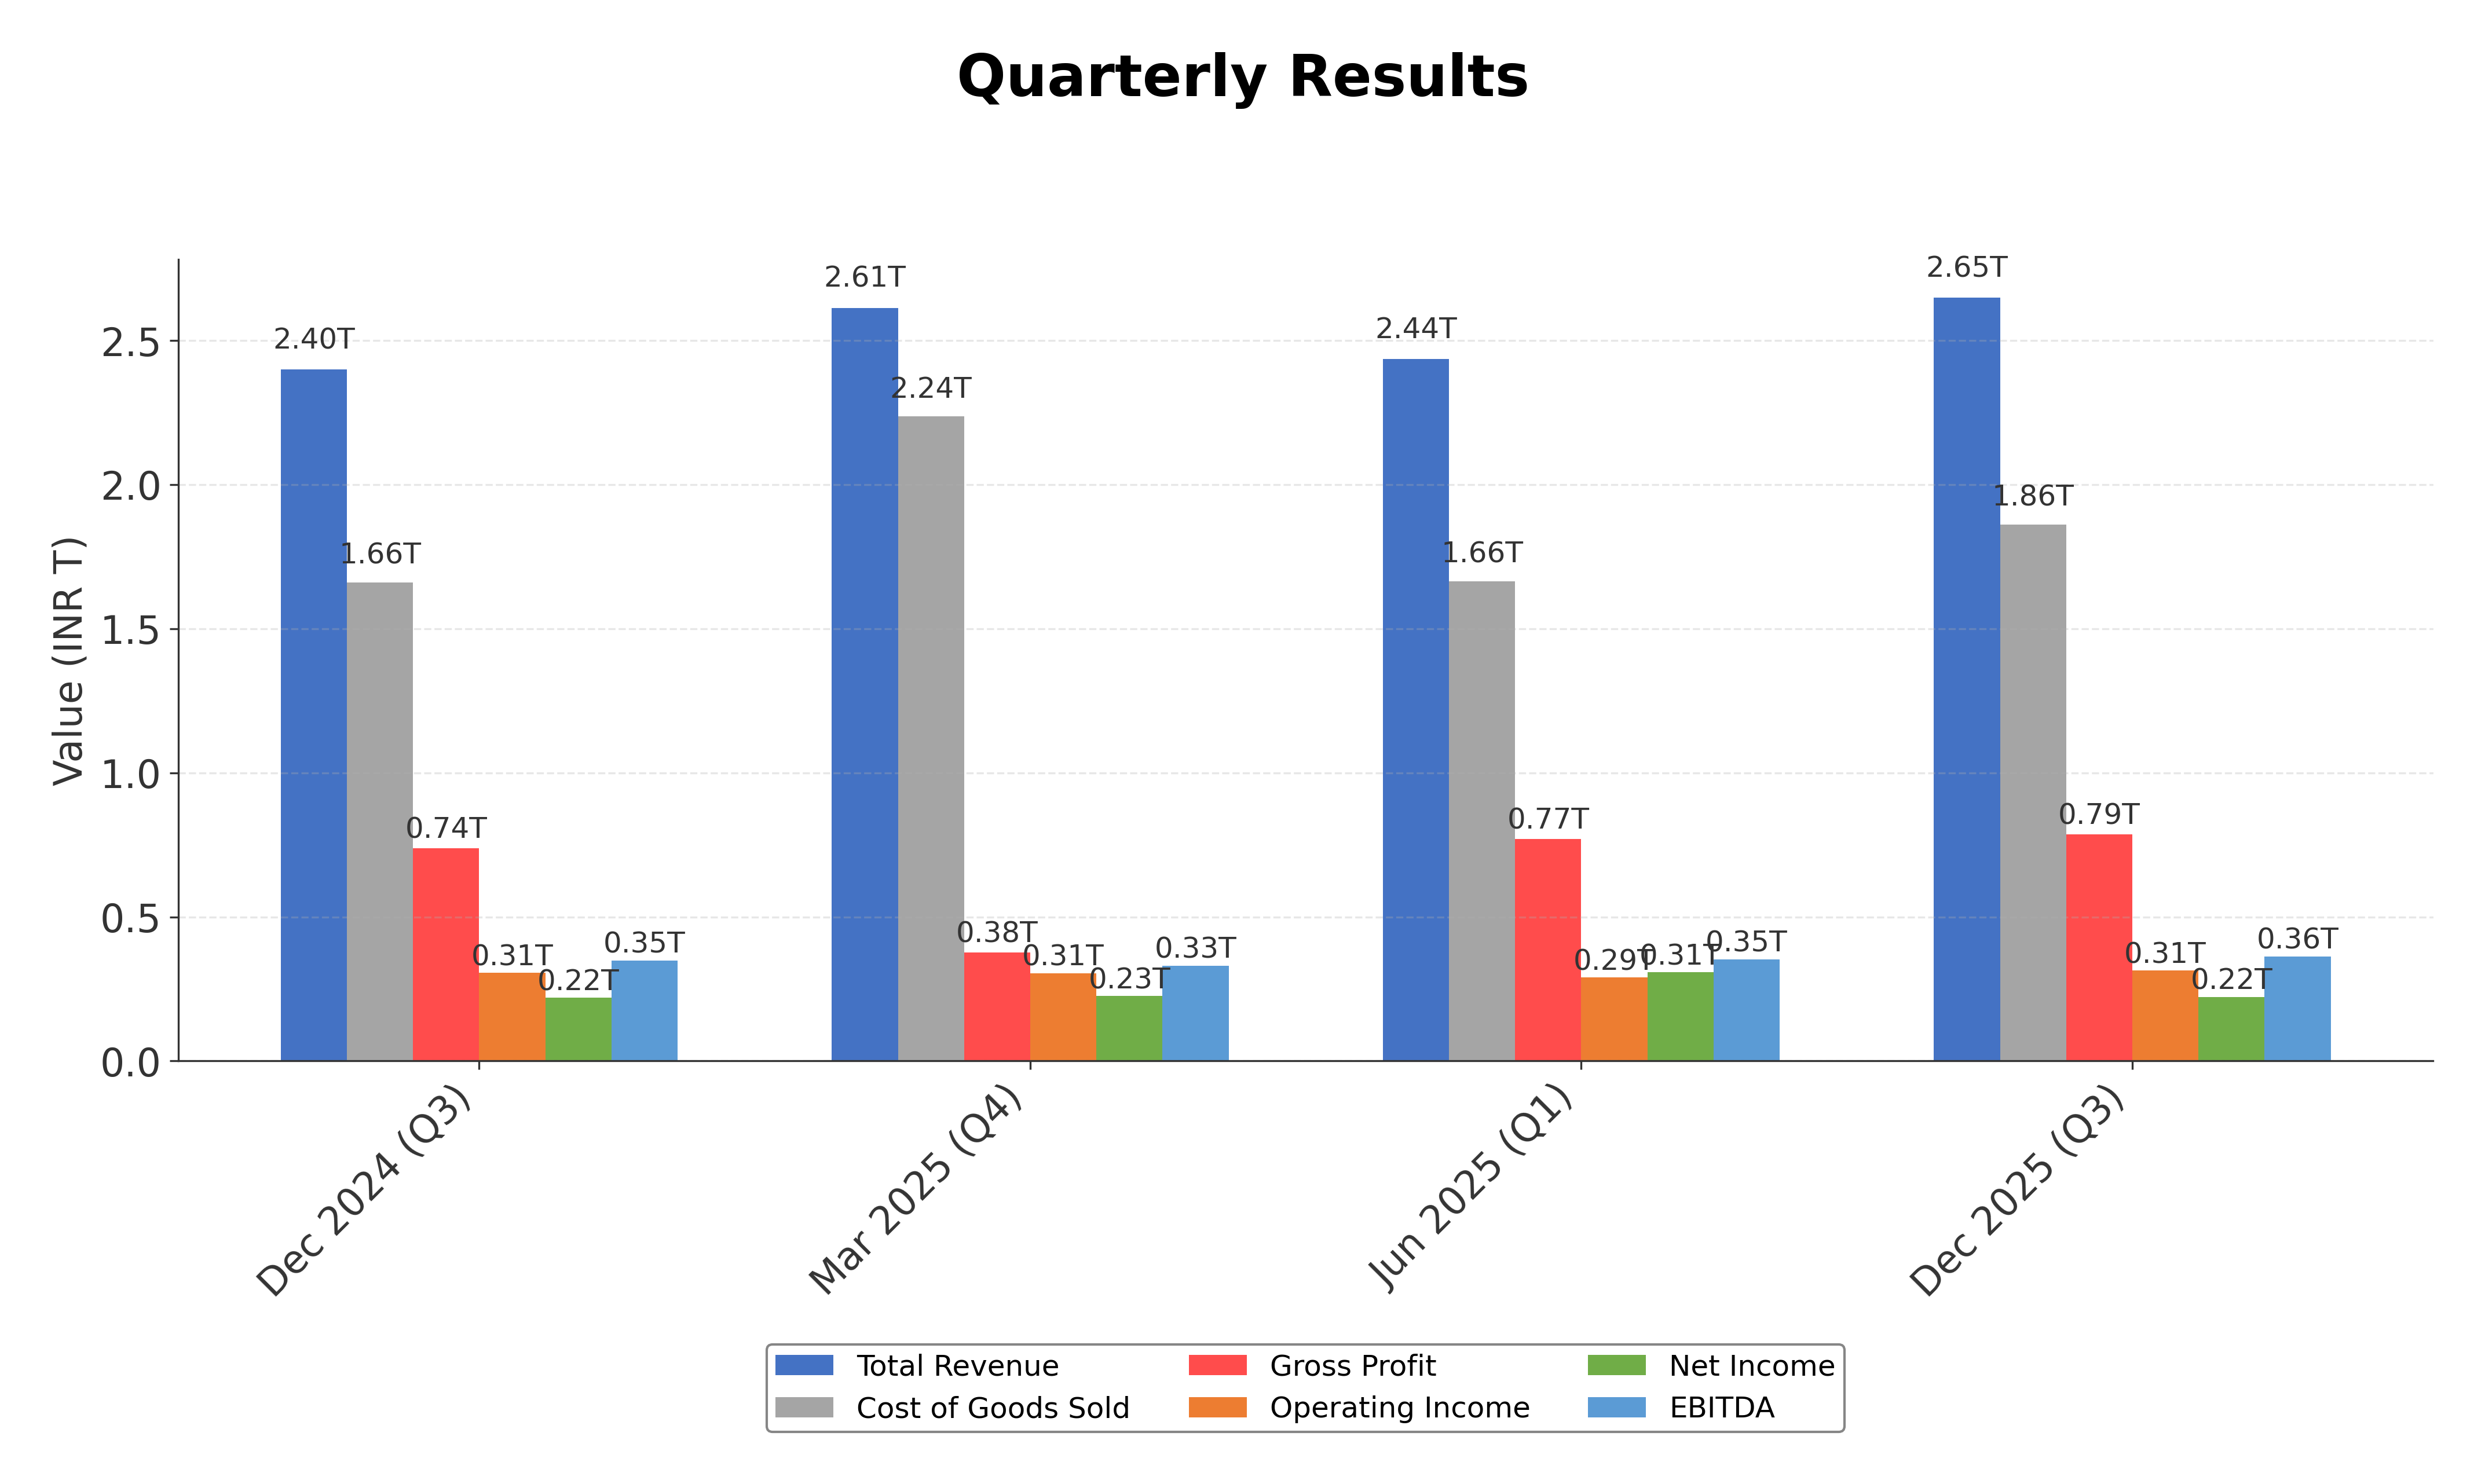
Peer Analysis
| Company Name | Market Cap | P/E Ratio | P/B Ratio | EV/EBITDA | Price to CFO |
|---|---|---|---|---|---|
| Reliance Industries Ltd. | ₹18.28T | 21.98 | 2.08 | 12.77 | 18.04 |
| Mangalore Refinery and Petrochemicals Limited | ₹319.58B | 14.67 | 2.40 | 7.34 | 19.69 |
| Bharat Petroleum Corporation Limited | ₹1.21T | 4.68 | 1.23 | 4.08 | 5.52 |
| Chennai Petroleum Corporation Limited | ₹153.86B | 7.15 | 1.74 | 4.78 | 7.62 |
| Aegis Logistics Limited | ₹206.83B | 48.78 | 4.63 | 20.85 | 16.99 |
| Hindustan Petroleum Corporation Limited | ₹693.67B | 4.50 | 1.22 | 4.77 | 15.19 |
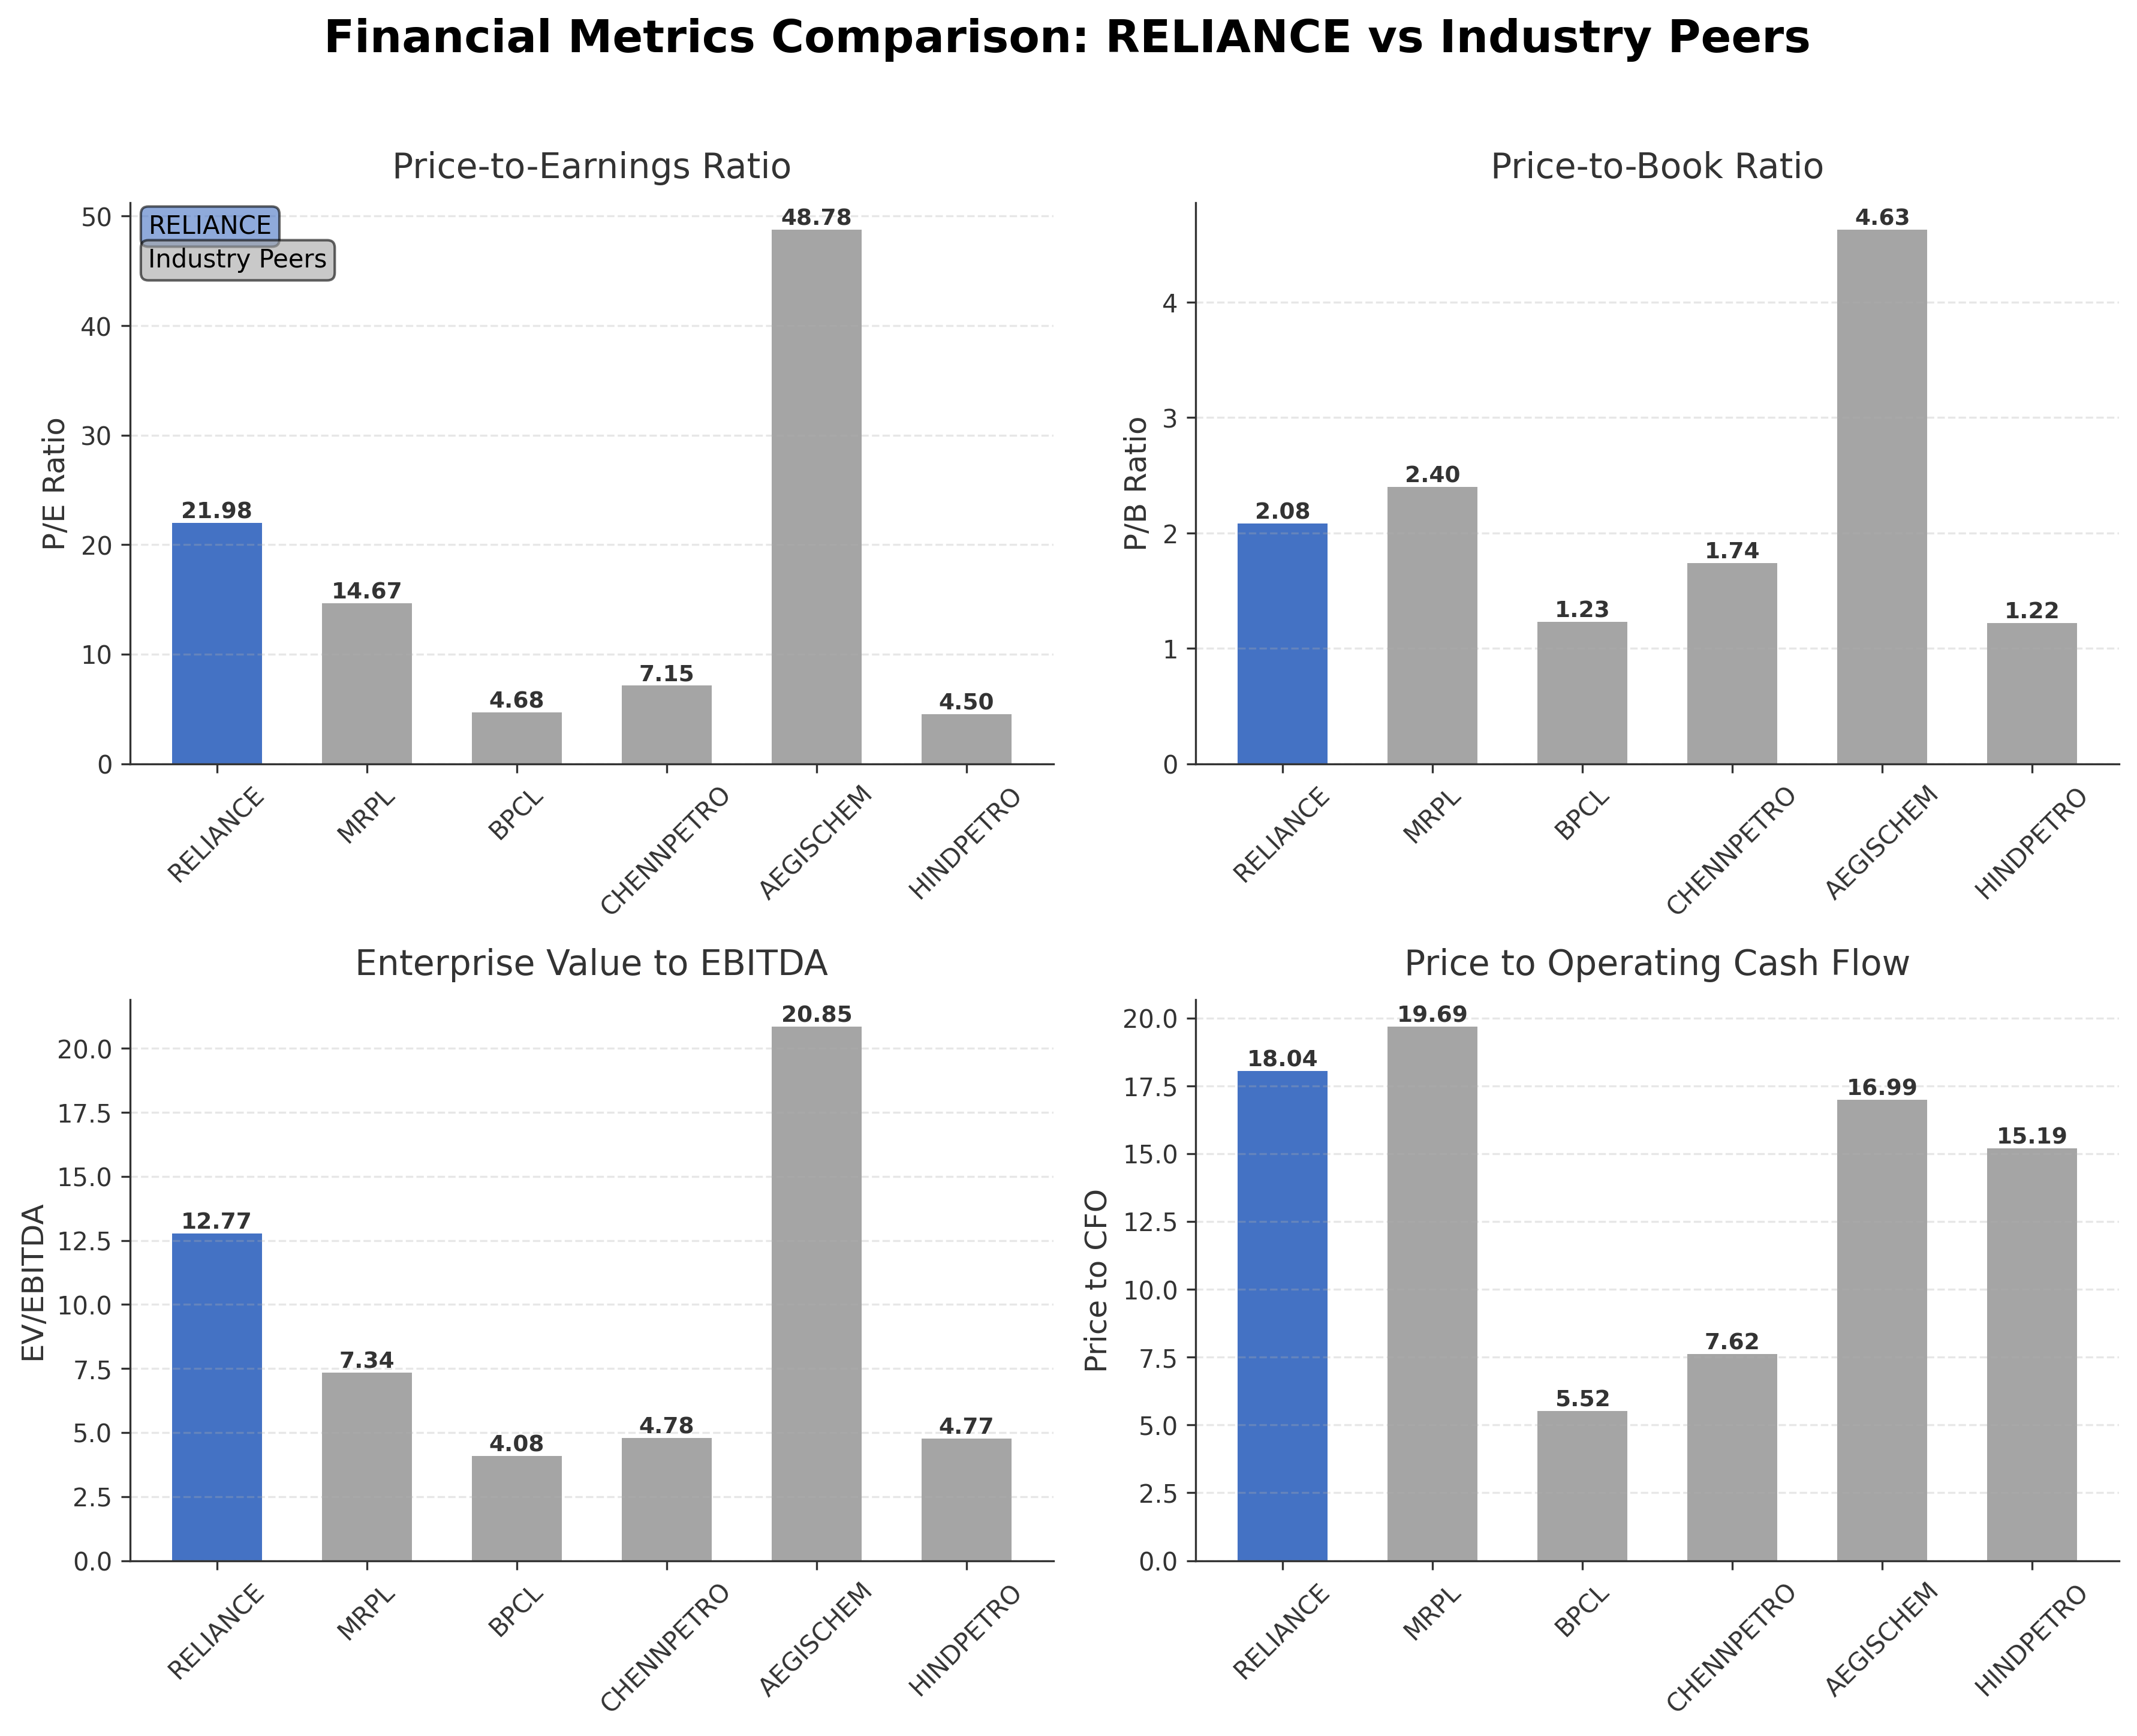
Comparison Analysis: Reliance Industries Ltd. stands as the largest entity by market capitalization among its Indian oil and gas refining peers, with a market cap of ₹18.28 trillion, significantly exceeding others. Its P/E ratio of 21.98 is higher than most peers, reflecting a premium valuation likely due to its diversified business model and growth prospects. The EV/EBITDA multiple of 12.77 also surpasses the industry average, indicating relatively higher enterprise valuation. Return on equity at 6.9% is modest but notably higher than peers, many of which report near zero or low single-digit returns. Price to CFO ratio is elevated compared to most peers, suggesting strong cash flow generation but also a higher valuation. Overall, Reliance exhibits superior scale and valuation metrics, balanced by moderate profitability relative to its sector.
Financial Metrics Comparison with Peers
Financial Statements
Comprehensive financial data including income, balance sheet, and cash flow metrics
Income Statement
| fiscal_date | 2025-03-31 | 2024-03-31 | 2023-03-31 | 2022-03-31 | 2021-03-31 |
|---|---|---|---|---|---|
| Sales | 9646.93B | 9010.64B | 8778.35B | 6959.63B | 4669.24B |
| Cost Of Goods | 7226.87B | 6745.99B | 6718.98B | 5316.78B | 3390.61B |
| Gross Profit | 2420.06B | 2264.65B | 2059.37B | 1642.85B | 1278.63B |
| Operating Expense Selling General And Administrative | 380.26B | 371.42B | 316.73B | 248.25B | 196.70B |
| Operating Expense Other Operating Expenses | 631.92B | 530.45B | 477.35B | 420.90B | 396.01B |
| Operating Income | 1124.62B | 1116.66B | 1020.15B | 787.63B | 541.65B |
| Non Operating Interest Income | 124.10B | 107.45B | 112.40B | 125.29B | 103.66B |
| Non Operating Interest Expense | 221.21B | 217.72B | 189.58B | 144.38B | 179.07B |
| Pretax Income | 1060.17B | 1047.27B | 940.46B | 821.54B | 554.61B |
| Income Tax | 252.30B | 257.07B | 203.76B | 159.70B | 17.22B |
| Net Income | 813.09B | 790.20B | 740.88B | 678.45B | 537.39B |
| Eps Basic | 51.47 | 51.45 | 49.30 | 46.00 | 38.19 |
| Eps Diluted | 51.47 | 51.45 | 49.30 | 45.43 | 37.60 |
| Basic Shares Outstanding | 13.53B | 13.53B | 13.53B | 13.53B | 12.87B |
| Diluted Shares Outstanding | 13.53B | 13.53B | 13.53B | 13.53B | 12.87B |
| Ebit | 1281.38B | 1264.99B | 1130.04B | 965.92B | 733.68B |
| Ebitda | 1798.71B | 1756.75B | 1547.65B | 1222.88B | 893.34B |
| Net Income Continuous Operations | 1060.17B | 1047.27B | 948.01B | 841.42B | 554.61B |
| Minority Interests | -116.61B | -93.99B | -73.86B | -71.40B | -46.11B |
| Preferred Stock Dividends | 0.00 | 0.00 | 0.00 | 0.00 | 0.00 |
Source: Financial statements and regulatory filings
Balance Sheet
| fiscal_date | 2025-03-31 | 2024-03-31 | 2023-03-31 | 2022-03-31 | 2021-03-31 |
|---|---|---|---|---|---|
| Cash And Cash Equivalents | 1006.45B | 935.40B | 341.56B | 335.09B | 145.06B |
| Accounts Receivable | 421.21B | 316.28B | 284.48B | 236.40B | 190.14B |
| Total Assets | 19501.21B | 17559.86B | 16074.31B | 14996.65B | 13212.12B |
| Total Liabilities | 9404.95B | 8301.98B | 7785.50B | 6106.81B | 5217.80B |
| Long Term Debt | 2540.41B | 2401.27B | 1994.06B | 2007.06B | 1706.31B |
| Shareholders Equity | 10096.26B | 9257.88B | 8288.81B | 8889.84B | 7994.32B |
Source: Financial statements and regulatory filings
Cash Flow Statement
| fiscal_date | 2025-03-31 | 2024-03-31 | 2023-03-31 | 2022-03-31 | 2021-03-31 |
|---|---|---|---|---|---|
| Operating Activities Net Income | 1060.17B | 1047.27B | 948.01B | 841.42B | 554.61B |
| Operating Activities Other Non Cash Items | 100.01B | 111.90B | 79.58B | 23.36B | 108.55B |
| Operating Activities Accounts Receivable | -178.37B | -156.74B | 131.94B | -141.80B | 9.59B |
| Operating Activities Other Assets Liabilities | 31.34B | -127.56B | -322.28B | -249.83B | -77.69B |
| Operating Activities Operating Cash Flow | 1013.15B | 874.87B | 837.25B | 473.15B | 595.06B |
| Investing Activities Capital Expenditures | 23.43B | 153.07B | 91.86B | 31.37B | -1035.18B |
| Investing Activities Purchase Of Investments | -6843.40B | -5143.80B | -4718.22B | -6678.78B | -6898.66B |
| Investing Activities Sale Of Investments | 6725.58B | 5313.55B | 5012.66B | 6681.37B | 6425.51B |
| Investing Activities Other Investing Activity | -45.74B | -44.23B | N/A | -193.06B | -20.00M |
| Investing Activities Investing Cash Flow | -140.13B | 278.59B | 386.30B | -159.10B | -1508.35B |
| Financing Activities Long Term Debt Issuance | 263.78B | 696.10B | 359.36B | 593.43B | 332.11B |
| Financing Activities Long Term Debt Payments | -317.55B | -350.55B | -290.59B | -406.47B | -872.40B |
| Financing Activities Short Term Debt Issuance | 246.24B | -252.93B | 311.98B | -88.46B | -296.81B |
| Financing Activities Common Stock Issuance | 220.00M | 70.00M | 400.00M | 397.67B | 132.15B |
| Financing Activities Common Dividends | -67.66B | -60.89B | -50.83B | -42.97B | -39.21B |
| Financing Activities Financing Cash Flow | 125.03B | 230.10B | 335.11B | 457.70B | 1212.66B |
| End Cash Position | 1065.02B | 972.25B | 686.64B | 361.78B | 173.97B |
| Free Cash Flow | 387.36B | 59.05B | -259.56B | 105.09B | -788.79B |
| Financing Activities Other Financing Charges | N/A | 198.30B | 4.79B | 4.50B | 1956.82B |
Source: Financial statements and regulatory filings
Technical Analysis
Key Insights
- The current trend shows a recent price decline from the 52-week high of ₹1,611.80 to the current price near ₹1,329.10, indicating a downward correction within a broader uptrend.
- Key support levels are identified around ₹1,114.85 (52-week low) and near the 200-day moving average at ₹1,444.05, while resistance is observed near the 52-week high and the 50-day moving average at ₹1,403.43.
- The stock price is currently trading below both the 50-day and 200-day moving averages, suggesting short-to-medium term bearish momentum.
- Momentum indicators show a moderate RSI, indicating neither overbought nor oversold conditions; MACD signals recent bearish crossover, and stochastic oscillator reflects weakening momentum.
- Multi-timeframe analysis reveals daily charts with short-term weakness, weekly charts indicating consolidation, and monthly charts maintaining a longer-term positive bias.
- Potential market scenarios include further consolidation near support levels or a rebound if momentum indicators improve, with downside risk if key supports fail to hold.
Trending News
1. Headline: Reliance Caps Fuel Sales at $11 Per Pump Amid Growing Shortages - Bloomberg
Summary: Reliance Industries Ltd. has capped fuel purchases across its retail outlets — limiting customers to about $11 worth of gasoline or diesel — as the Middle East crisis continues to choke off supplies despite a tentative ceasefire.
Sentiment: negative
Summary: Among large-cap names, Reliance Industries Ltd (RIL) is expected to report stable performance. The brokerage estimates consolidated revenue and EBITDA to grow around 8 per cent and 8.5 per cent year-on-year (YoY) to Rs 2,82,200 crore and Rs 47,600 crore, respectively, supported by strong traction ...
Sentiment: positive
3. Headline: Reliance Industries Ltd Rallies 3.15% Amid Mixed Technicals and Sector Gains
Summary: The Sensex advanced 3.74% on 8 Apr 2026, yet Reliance Industries Ltd managed a respectable 3.15% gain, slightly underperforming the benchmark but outperforming its Oil sector peers by 0.49 percentage points. This single-session surge, following three consecutive days of decline, prompts a closer ...
Sentiment: positive
4. Headline: RIL shares slide 19% from 52 week high; should investors buy the dip? - BusinessToday
Summary: Shares of Reliance Industries Ltd (RIL) settled almost on a flat note on Tuesday, shedding just 0.01 per cent to close at Rs 1,304.65.
Sentiment: negative
5. Headline: Crude Oil Supply Diversification Gains Pace as India Reduces Gulf Reliance | Investing.com
Summary: Market Analysis by covering: Crude Oil WTI Futures. Read 's Market Analysis on Investing.com
Sentiment: positive
6. Headline: RIL Share Price Highlights: RIL Stock Price History - The Economic Times
Summary: Welcome to the RIL Stock Liveblog, your real-time source for the latest updates and comprehensive analysis on a prominent stock. Dive into the current details of RIL, including: Last traded price 1304.6, Market capitalization: 1765446.38, Volume: 28388922, Price-to-earnings ratio 21.22, Earnings ...
Sentiment: neutral
7. Headline: Reliance Industries Ltd Hits Intraday Low Amid Price Pressure on 6 Apr 2026
Summary: Reliance Industries Ltd experienced a notable decline today, touching an intraday low of Rs 1,312, reflecting a 2.88% drop as the stock faced significant pri...
Sentiment: negative
8. Headline: Reliance Industries Ltd Sees High-Value Trading Amid Declining Momentum
Summary: Reliance Industries Ltd (RELIANCE), a heavyweight in the Indian oil sector, witnessed significant trading activity on 6 April 2026, with a total traded value exceeding ₹4,098 crores. Despite this high-value turnover, the stock experienced a notable decline, reflecting waning investor enthusiasm ...
Sentiment: negative
9. Headline: Reliance Industries shares crash 6% in two days, wipes off Rs 1 lakh crore. What lies ahead? - The Economic Times
Summary: Reliance Industries shares have fallen sharply over two days, erasing over Rs 1 lakh crore in market value amid weak technical indicators and policy concerns. Analysts see near-term pressure with key support levels in focus, though stability above these levels could trigger a short-term rebound ...
Sentiment: negative
10. Headline: Reliance share price falls over 4%; market cap slips below ₹18 lakh crore | Stock Market News
Summary: However, a senior official clarified that the reimposed windfall export taxes on diesel and ATF will not apply to Reliance Industries Ltd’s SEZ refinery due to judicial rulings, PTI reported.
Sentiment: negative
Recent Updates
News Summary
Recent news coverage of Reliance Industries Ltd. highlights a mix of operational challenges and strategic developments. The company has implemented fuel sales caps amid supply shortages linked to geopolitical tensions, reflecting immediate operational constraints. Concurrently, financial forecasts indicate stable revenue and EBITDA growth, supported by diversified business segments. Market reactions have been mixed, with share price volatility and technical fluctuations noted alongside sector gains. Broader industry trends include India's strategic diversification of crude oil sources, potentially benefiting Reliance's supply chain resilience. Leadership and historical context remain steady, with no major governance changes reported. These developments collectively underscore a dynamic environment where Reliance balances near-term pressures with long-term growth initiatives.
News Sentiment
Sentiment analysis reveals a predominantly neutral to slightly positive tone across sources, tempered by operational challenges such as fuel supply restrictions and share price corrections. Positive outlooks stem from expected financial stability and strategic diversification efforts, while negative sentiment arises from market volatility and supply constraints. The mixed sentiment reflects cautious optimism, with market participants closely monitoring operational execution and external factors influencing performance.
Analytical Overview
Analysis Summary
Valuation Metrics: Reliance Industries' P/E ratio of 21.98 aligns closely with the industry average of 21.98, while its forward P/E of 20.59 suggests moderate valuation relative to expected earnings. The PEG ratio of 1.75 indicates valuation is somewhat balanced against growth expectations within the sector.
Growth Trajectory: The company demonstrates a healthy revenue growth rate of 10.4% year-over-year and positive quarterly earnings growth, supported by robust operating cash flow of ₹1.01 trillion and free cash flow of ₹696 billion, indicating solid operational performance and cash generation.
Financial Health: Reliance maintains a total debt to equity ratio of 35.65%, reflecting manageable leverage levels. The current ratio of 1.10 suggests adequate short-term liquidity, while cash reserves of ₹2.24 trillion provide a strong liquidity buffer to support ongoing operations and investments.
Sector Specific Factors: The energy sector faces volatility from geopolitical tensions and regulatory changes, which impact supply chains and pricing. Reliance's diversification into retail, digital services, and new energy sectors offers opportunities to mitigate traditional sector risks and capture emerging market trends.
India Specific Factors: Operating in India, Reliance benefits from a growing consumer market and supportive regulatory environment for digital and energy sectors. However, it must navigate challenges such as fluctuating commodity prices, policy shifts, and infrastructure constraints inherent to the Indian economic landscape.
Overall Business and Market Assessment
Supporting Factors: No data
Risk Factors: No data
SWOT Analysis
Strengths
- Diversified portfolio across energy, retail, digital, and media sectors.
- Strong market capitalization and leading position in the Indian energy industry.
- Robust cash flow and healthy liquidity with significant cash reserves.
- Integrated operations with world-class refining and petrochemical facilities.
Weaknesses
- Moderate leverage with a total debt to equity ratio of 35.65%.
- Profit margins are moderate relative to some global peers.
- Recent operational constraints due to supply shortages impacting sales.
- Relatively low return on equity at 6.9% compared to valuation multiples.
Opportunities
- Expansion in digital services and new energy sectors such as solar and hydrogen.
- Growing Indian consumer market supporting retail and digital growth.
- Strategic diversification reducing dependence on traditional oil and gas revenues.
- Potential benefits from India's crude oil supply diversification efforts.
Threats
- Volatility in global oil prices and geopolitical tensions affecting supply.
- Regulatory changes and policy risks in the energy and retail sectors.
- Competitive pressures from domestic and international energy companies.
- Market volatility leading to share price fluctuations and investor uncertainty.
Company Description
Reliance Industries Ltd. is an Indian multinational conglomerate headquartered in Mumbai, operating as one of the largest private sector corporations in the country. It spans a diverse portfolio including energy, where it engages in hydrocarbon exploration, petroleum refining, and oil-to-chemicals strategies through world-class facilities like the Jamnagar complex. The petrochemicals division produces polymers, polyesters, elastomers, and advanced materials, positioning it among the top global producers. Reliance Retail offers an omni-channel network with brands covering groceries, fashion, electronics, and jewelry, serving consumers and small merchants across India. Its digital services arm, Jio, provides broadband, mobile connectivity, and platforms fostering a digital-first ecosystem. The company also operates in media and entertainment, delivering content across various formats, and new energy, focusing on solar, hydrogen, batteries, and sustainable materials. Media and entertainment businesses include content creation and distribution tailored to India's diverse audiences. Founded in 1958, Reliance Industries Ltd. plays a pivotal role in India's industrial, consumer, and digital landscapes with integrated operations that emphasize innovation and sustainability.