


Reliance Industries Ltd (RELIANCE)
Stock Analysis Report
Stock Journey
Key Positives and Key Risks
Pros
- Market capitalization of ₹17.66 trillion reflects strong market presence and investor confidence.
- Operating cash flow of INR 1.92 trillion demonstrates robust cash generation supporting investments and operations.
- Strategic expansion into battery manufacturing with a 10 GWh gigafactory aligns with government incentives and growth in new energy.
Cons
- Stock trades below 50-day and 200-day moving averages indicating short-term technical weakness.
- Recent quarterly earnings declined by 12.6% year-over-year, signaling near-term profitability pressures.
- Regulatory warning from SEBI over alleged insider trading poses compliance and reputational risks.
Disclosure: This information is for general awareness and does not constitute investment advice
Report Summary
Reliance Industries Ltd. is a leading Indian multinational conglomerate operating primarily in the energy sector, listed on the NSE under the symbol RELIANCE. The company’s core businesses include hydrocarbon exploration, petroleum refining, petrochemicals production, retail, digital services through Jio, media, and new energy initiatives. Reliance holds a dominant market position in oil refining and chemicals, operates one of the world’s largest refining complexes at Jamnagar, and has a significant presence in retail and digital ecosystems. Its diversified portfolio spans traditional energy to cutting-edge digital and renewable segments, positioning it as a key player in India’s industrial and consumer markets.
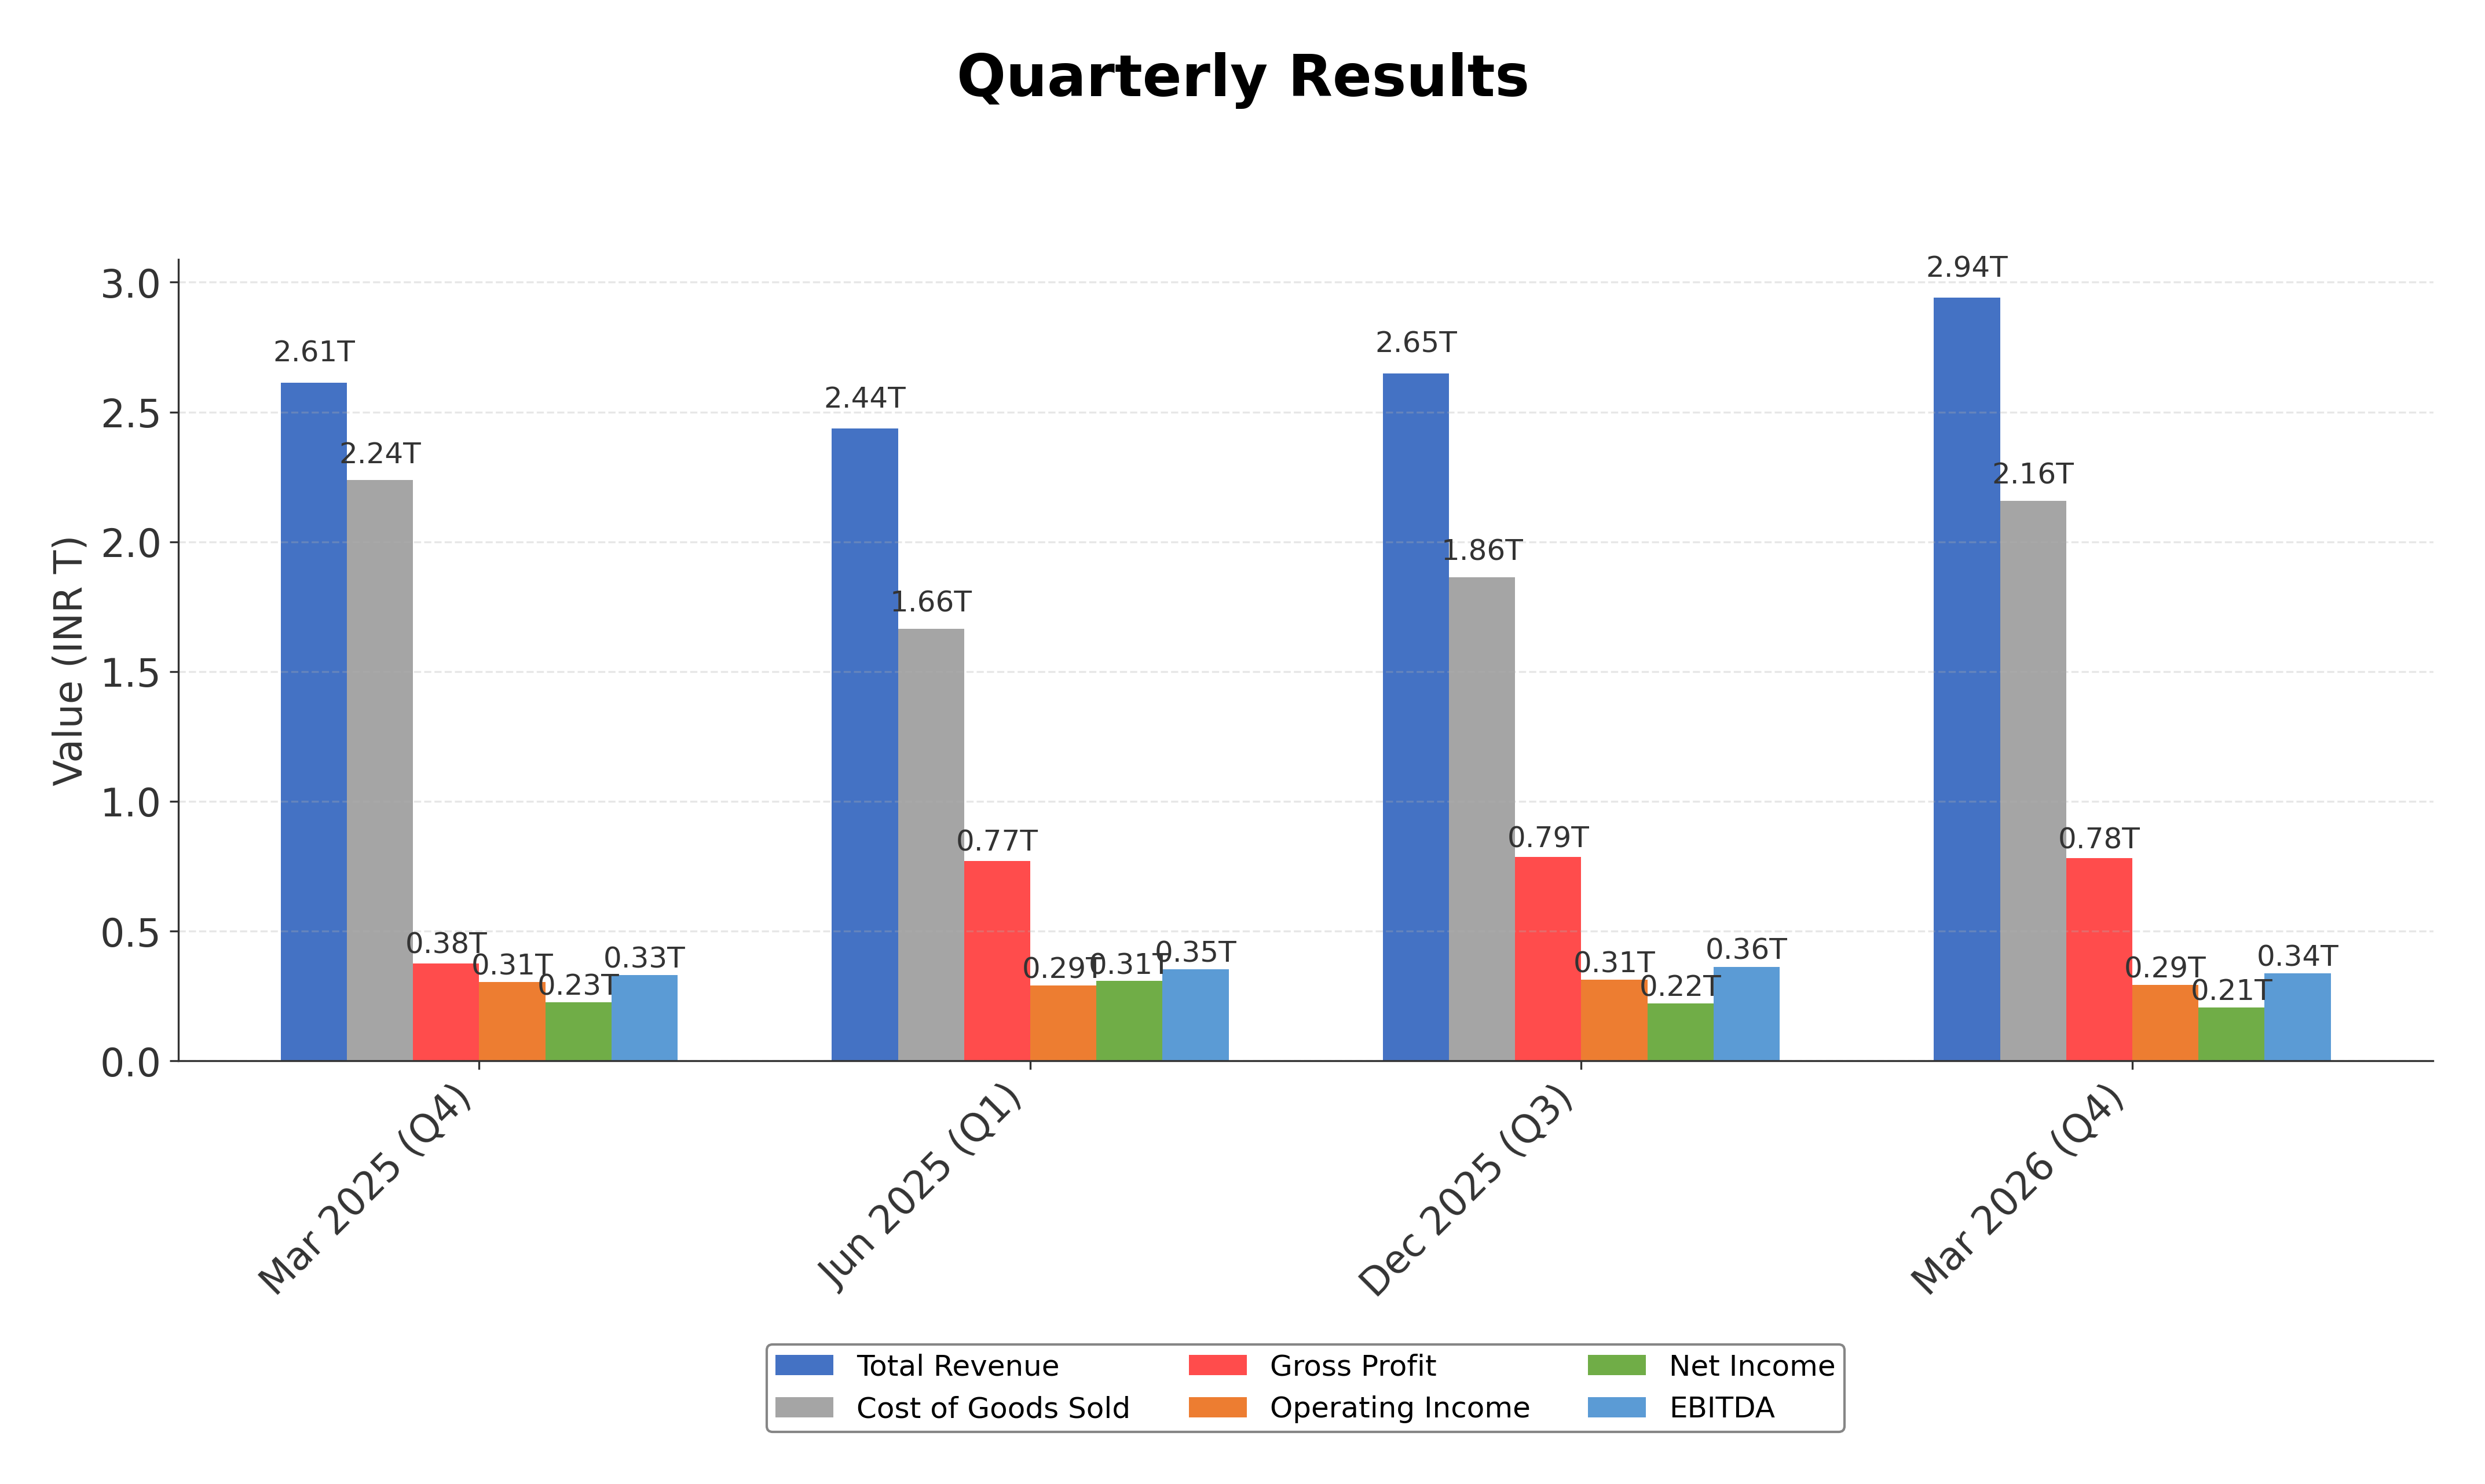
Financially, Reliance reported trailing twelve months revenue of approximately INR 10.57 trillion with a gross margin of 26.6%, operating margin near 10%, and net profit margin of 7.64%. The company’s return on equity (ROE) stands at 9.14%, and return on assets (ROA) at 3.67%, indicating moderate profitability and asset efficiency. Operating cash flow totaled INR 1.92 trillion, with free cash flow of INR 218 billion, reflecting strong cash generation capabilities. However, quarterly earnings growth showed a decline of 12.6% year-over-year, signaling some near-term earnings pressure.
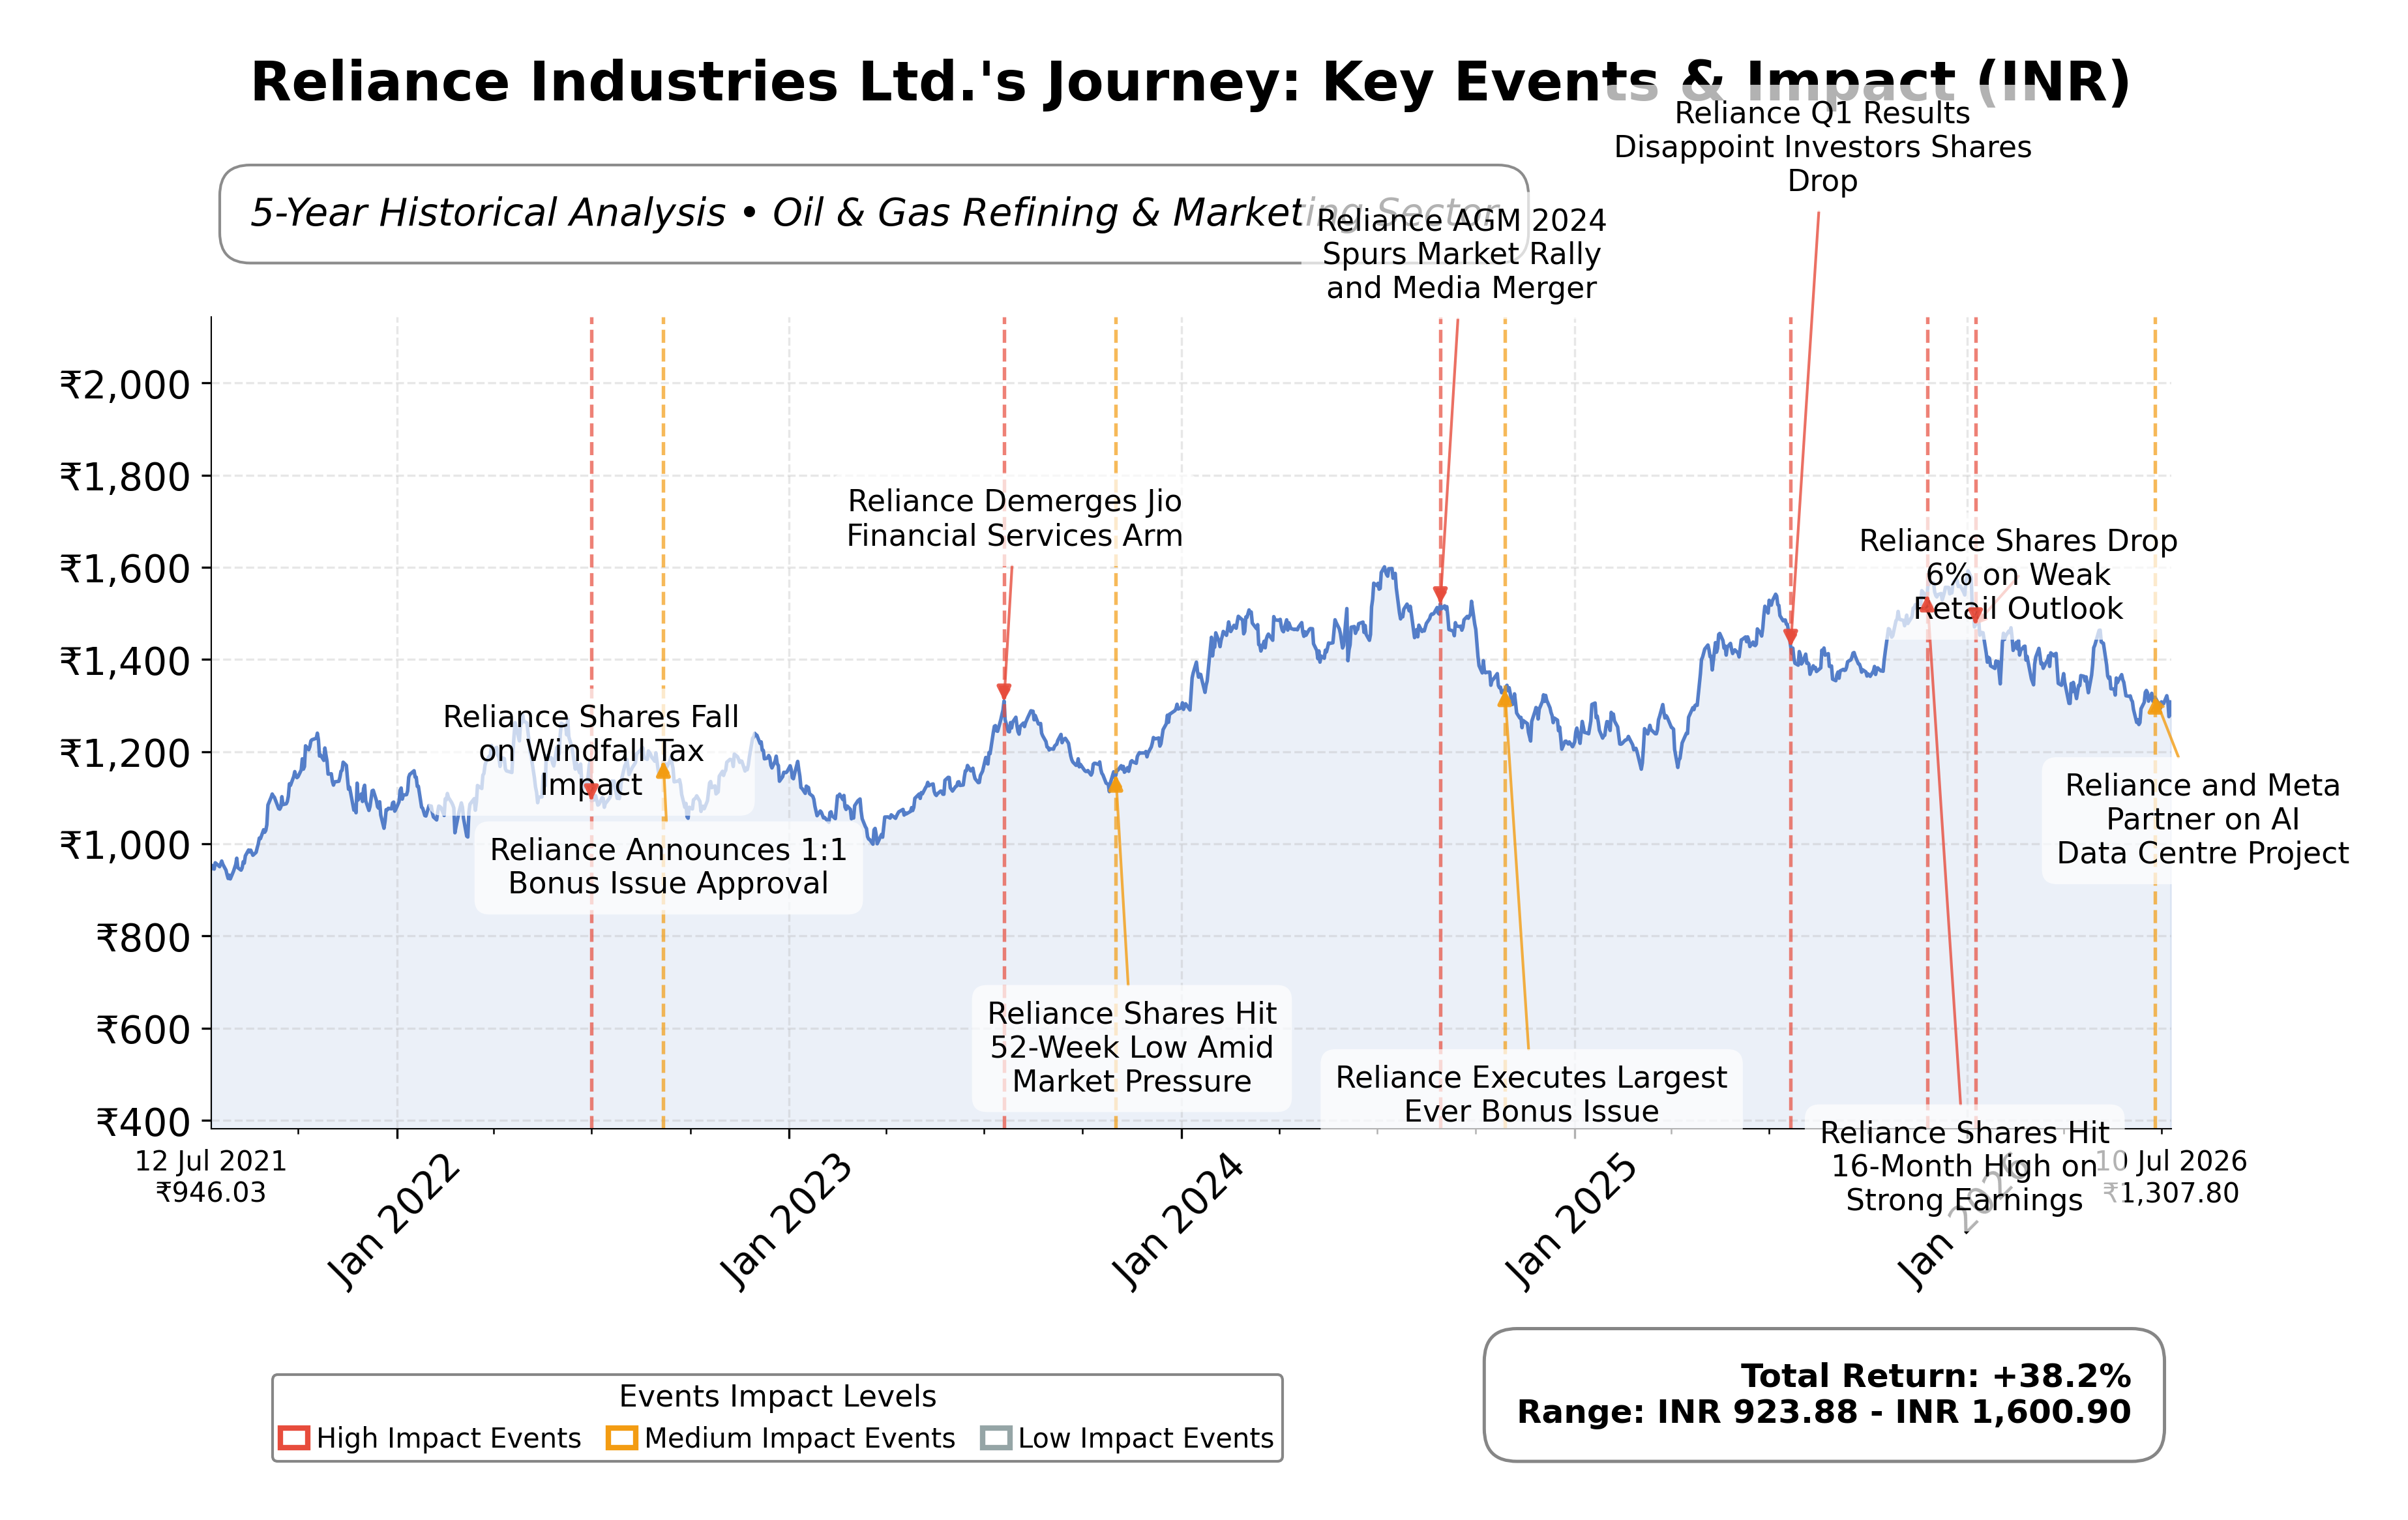
Valuation metrics show a trailing P/E ratio of 21.84 and forward P/E of 18.16, with a price-to-book ratio of 1.95 and enterprise value to EBITDA of 12.17. The market capitalization is approximately INR 17.66 trillion. The stock currently trades near INR 1,310, closer to its 52-week low of INR 1,253 than the high of INR 1,612, reflecting an 18.2% decline from the peak. These valuation levels suggest the stock is priced at a premium relative to some peers but with potential upside based on analyst target prices averaging INR 1,694.
Strengths include robust cash flow generation, a diversified business model with leadership in multiple sectors, and low debt-to-equity ratio at 36.7%. Key risks involve regulatory scrutiny highlighted by a recent SEBI warning over alleged insider trading, competitive pressures in energy and digital sectors, and macroeconomic factors impacting commodity prices. Recent strategic actions include the establishment of a 10 GWh battery gigafactory at Jamnagar under the government’s PLI scheme, supporting its new energy ambitions.
Technically, the stock is trading below its 50-day and 200-day moving averages, with momentum indicators showing mixed signals across timeframes. Recent news reflects both positive developments in new energy investments and regulatory challenges. Overall, the data suggests a cautious stance with conditions warranting close monitoring of compliance issues and execution on growth initiatives before considering accumulation or realization of gains.
Company and Industry Overview
Company Basics
Price Performance
Company Size
Shareholding Pattern
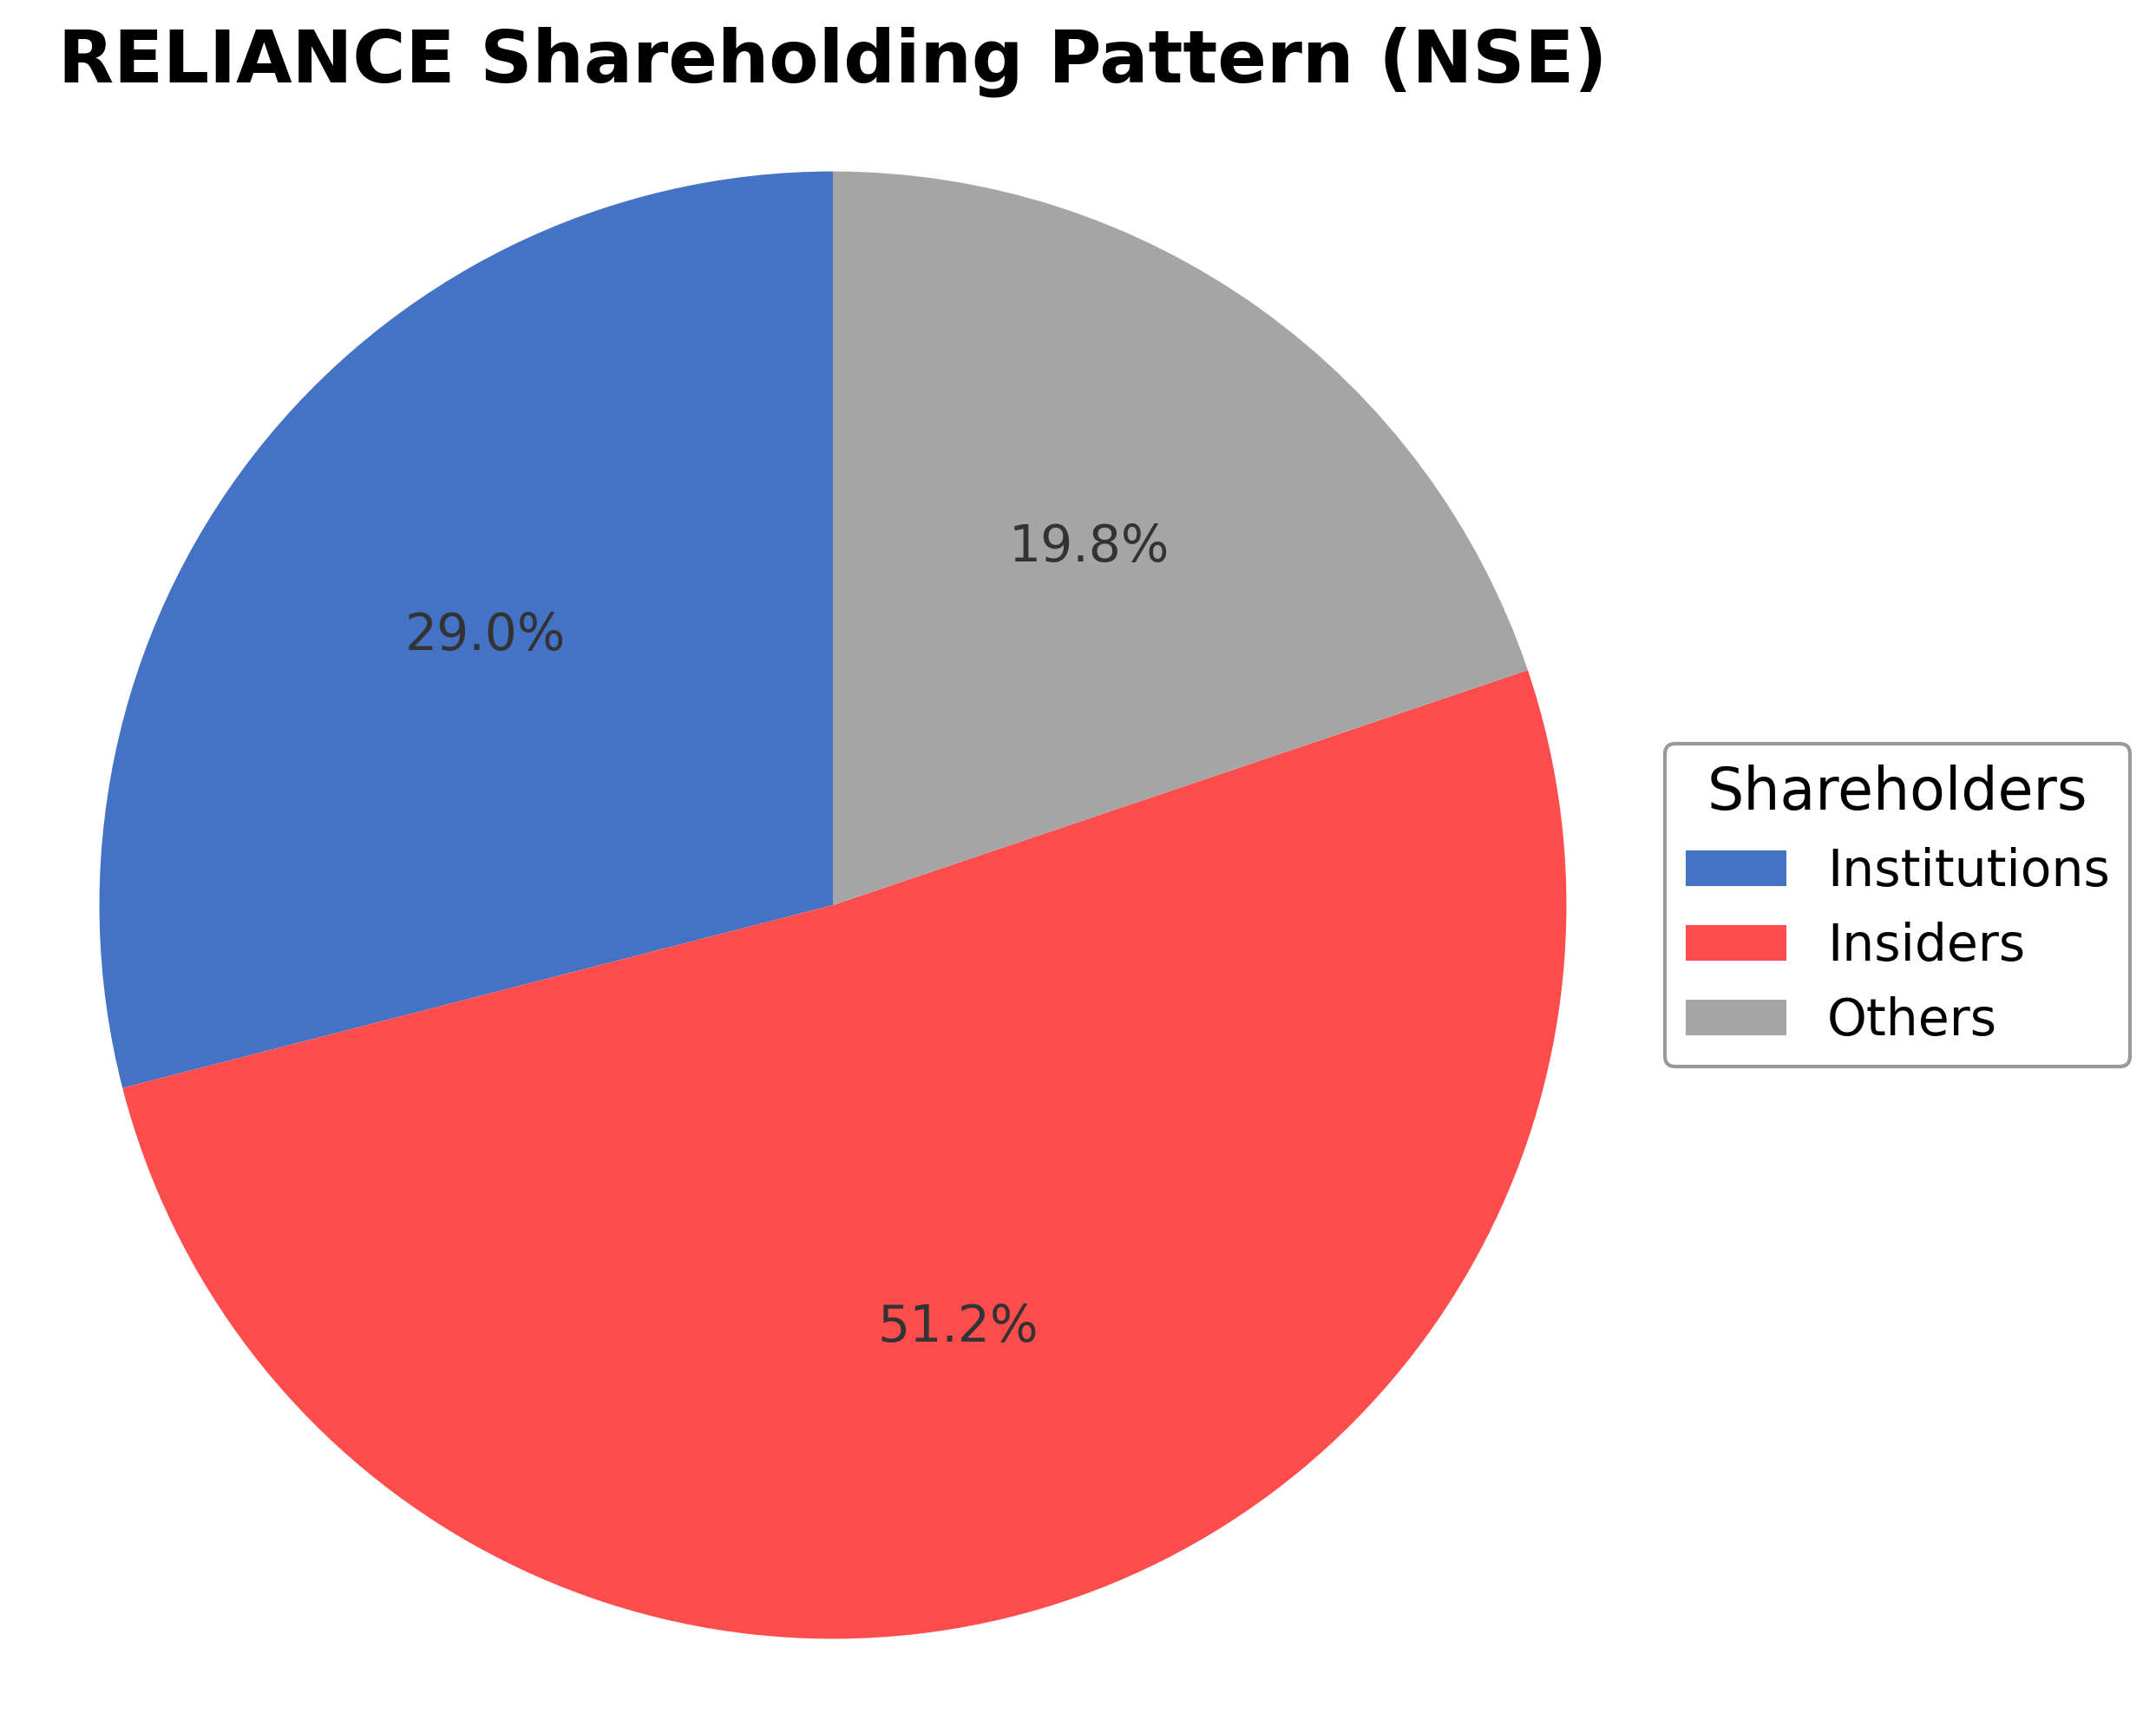
Reliance Industries Ltd. exhibits a shareholding structure dominated by insiders holding 51.18% of shares, including executives and board members, reflecting strong promoter control. Institutional investors, comprising mutual funds, pension funds, and asset managers, hold a significant 29.01%, indicating substantial institutional interest and confidence. The remaining 19.81% is held by public shareholders including retail investors and employee stock plans. Over the past 12-24 months, institutional ownership has shown moderate accumulation, with key funds increasing stakes amid strategic expansions in digital and energy segments. This ownership pattern underscores a stable governance framework with a balance of promoter control and institutional oversight, which may influence the company’s strategic direction and capital allocation decisions.
Sector and Industry Analysis
The Indian conglomerate sector, encompassing energy, petrochemicals, telecommunications, and retail, is marked by substantial market size and rapid growth. Reliance Industries Ltd. is a dominant player with diversified operations spanning refining, petrochemicals, digital services, and retail. The sector is experiencing robust revenue growth, with some segments like telecommunications and retail expanding rapidly due to rising consumer demand and digital penetration.
Industry trends highlight a shift towards digital transformation and integrated business models, with Reliance leveraging its telecom arm’s 5G rollout and retail omni-channel expansion to capture market share. Competitive dynamics are intense, with major rivals including Bharti Airtel in telecom and various petrochemical firms in refining. Barriers to entry remain high due to capital intensity, technological expertise, and regulatory compliance requirements, favoring established players with scale and diversification.
The regulatory environment is complex, involving commodity price controls, customs duties, data privacy, and competition laws. Recent government exemptions on customs duties for petrochemical products aim to stabilize sector demand amid price volatility. Ongoing scrutiny on data privacy and competition, along with currency fluctuations, pose risks but also drive governance and risk management practices. Overall, regulatory policies continue to shape operational strategies and investment decisions in the sector.
Note: Analysis synthesized from industry research, market reports, and regulatory filings. Information is subject to change based on market conditions.
Financial Ratios Dashboard
Illustrative Scenario Analysis
DCF Assumptions:
Method: Two-Stage EPS-Priority Model
Financials
Peer Analysis
| Company Name | Market Cap | P/E Ratio | P/B Ratio | EV/EBITDA | Price to CFO |
|---|---|---|---|---|---|
| Reliance Industries Ltd. | ₹17.66T | 21.84 | 1.95 | 12.17 | 9.19 |
| Oil & Natural Gas Corporation Ltd. | ₹2.99T | 7.22 | 0.80 | 4.26 | 2.65 |
| Indian Oil Corporation Limited | ₹2.00T | 4.63 | 0.89 | 4.14 | 2.63 |
| Bharat Petroleum Corporation Limited | ₹1.32T | 5.13 | 1.31 | 3.87 | 2.59 |
| GAIL (India) Limited | ₹1.15T | 15.10 | 1.28 | 11.93 | 10.18 |
| Hindustan Petroleum Corporation Limited | ₹849.53B | 4.71 | 1.30 | 4.16 | 2.35 |
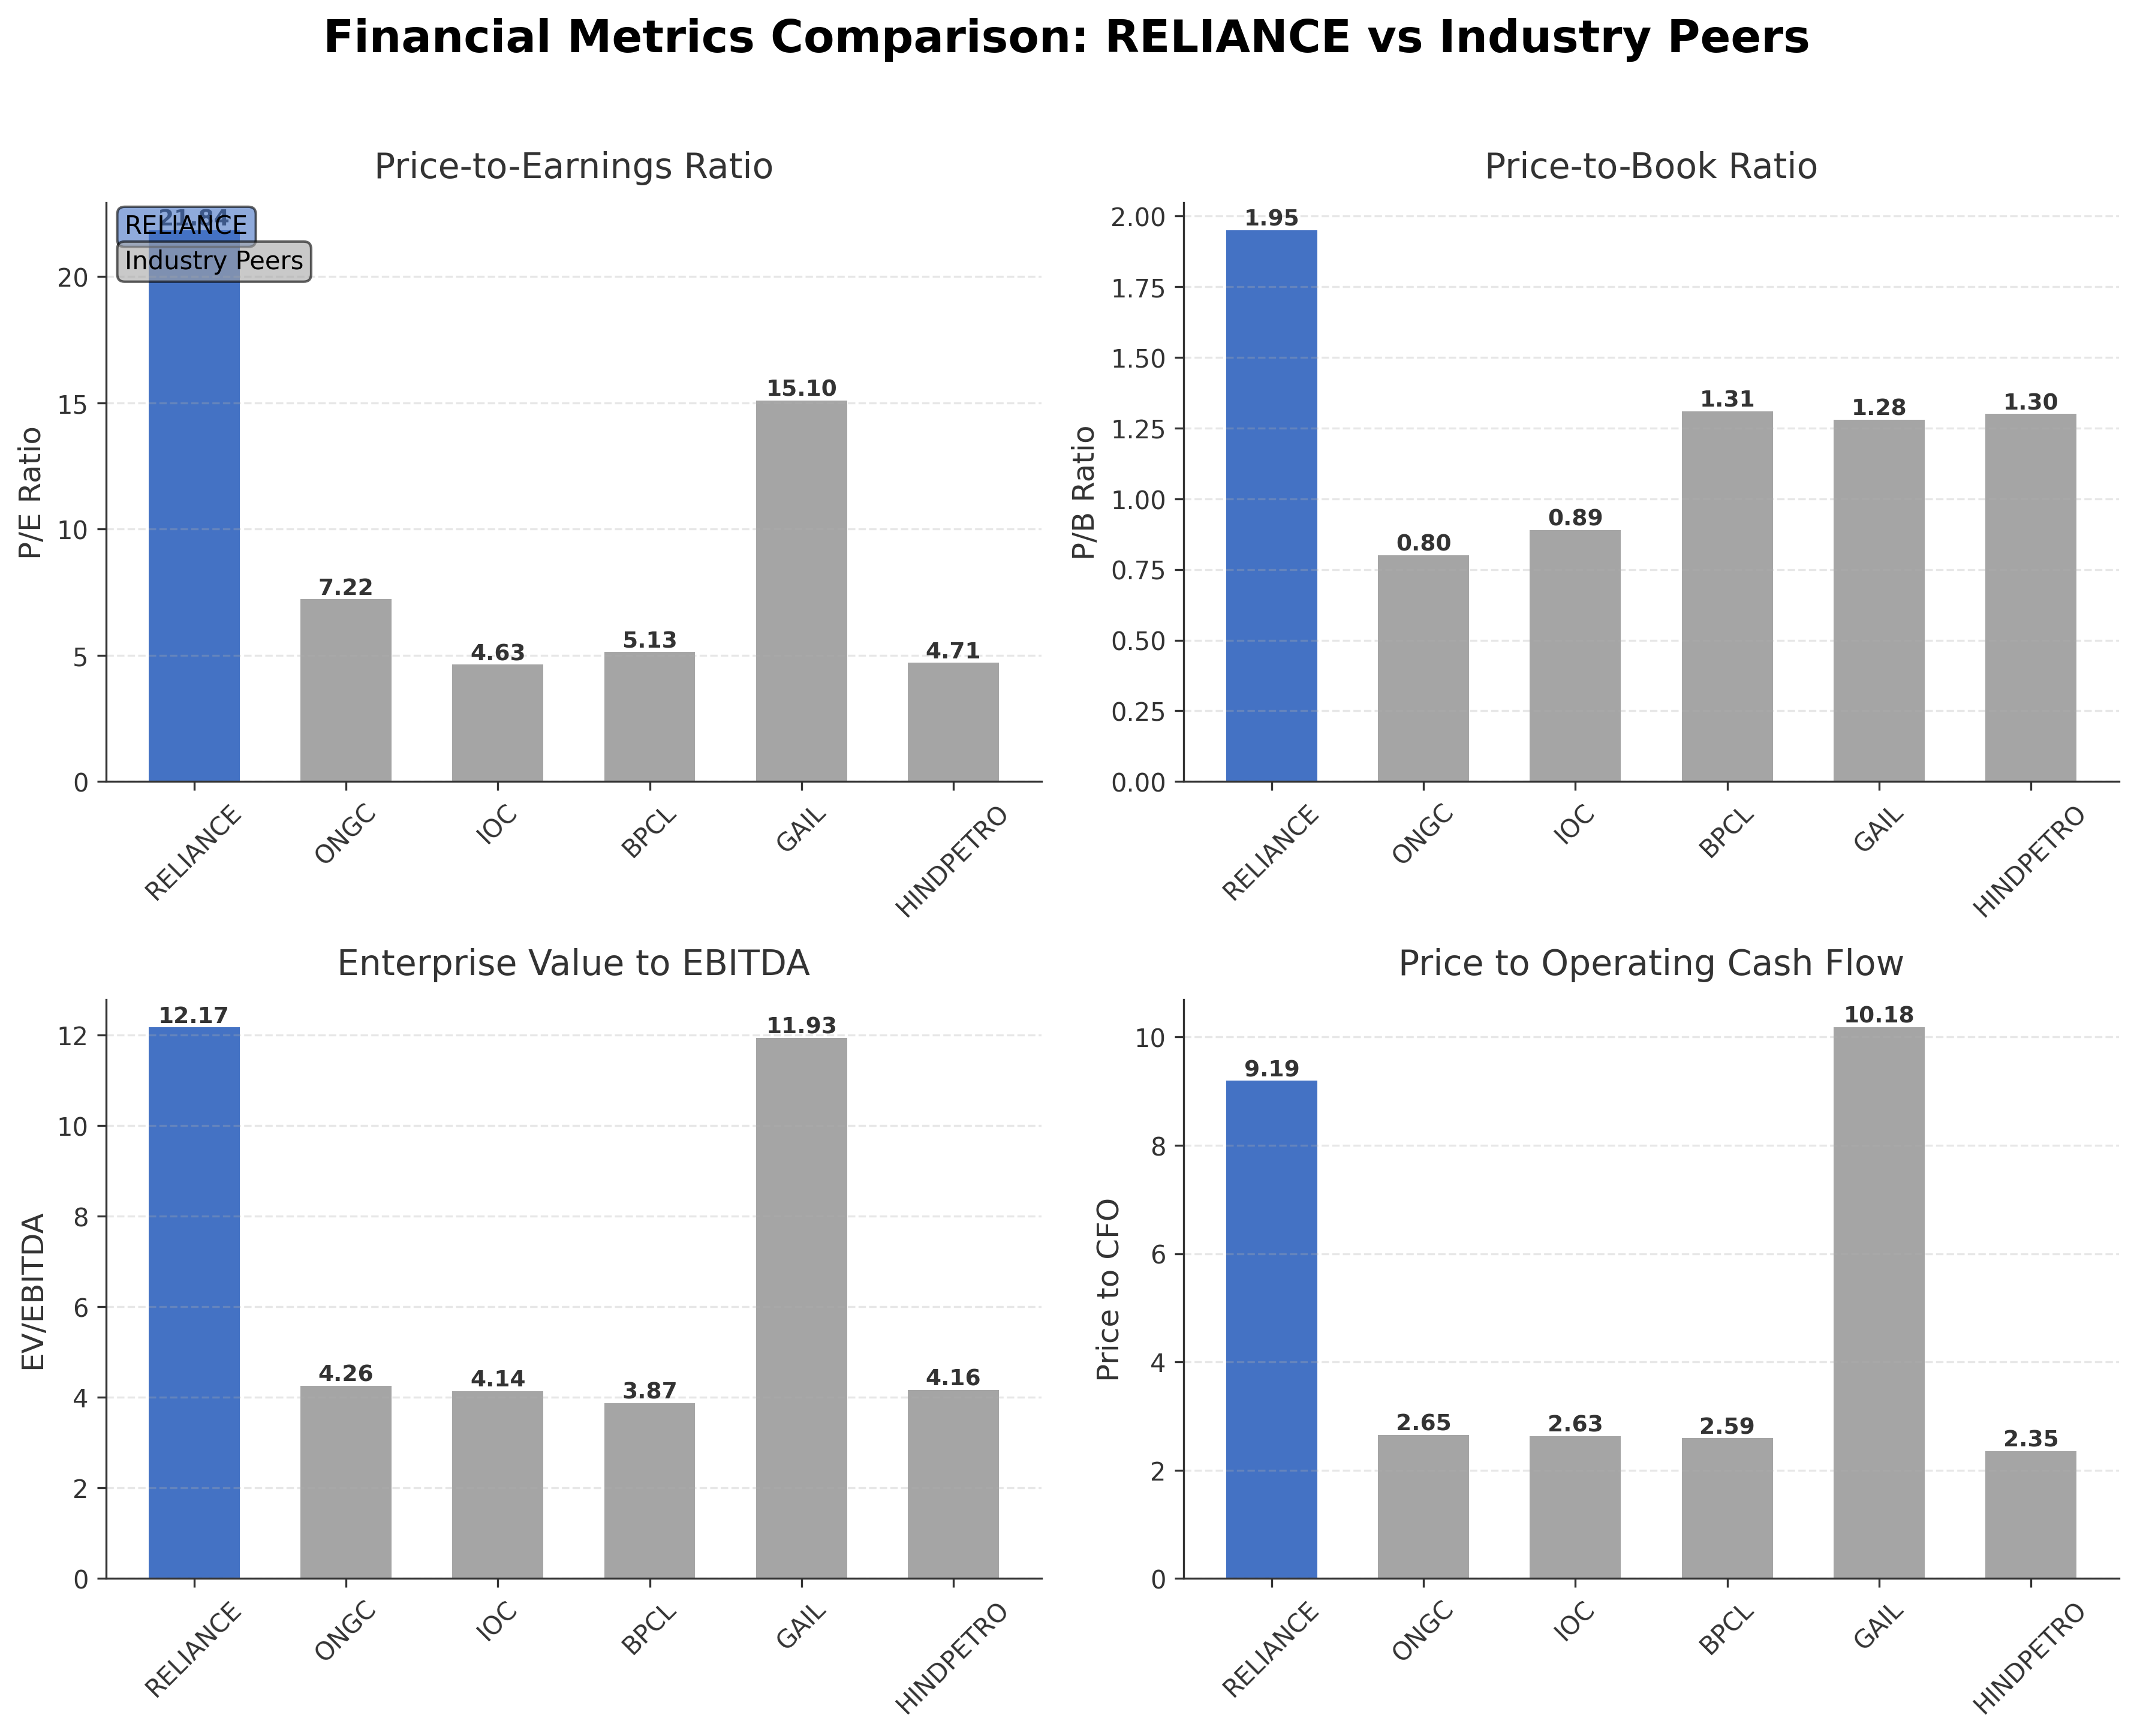
Comparison Analysis: Reliance Industries Ltd. stands out among its regional peers with a significantly larger market capitalization of ₹17.66 trillion compared to the next largest peer ONGC at ₹2.99 trillion. Its P/E ratio of 21.84 is substantially higher than peers, which range from approximately 4.6 to 15.1, indicating a premium valuation reflecting growth expectations. The price-to-book ratio of 1.95 is also elevated relative to peers mostly below 1.5, while the EV/EBITDA multiple at 12.17 is higher but comparable to GAIL’s 11.93. Reliance’s return on equity of 9.14% is moderate and lower than several peers such as BPCL (28.47%) and Hindustan Petroleum (30.93%), suggesting room for efficiency improvements. Overall, Reliance’s valuation metrics reflect its diversified business model and growth prospects, albeit at a premium compared to traditional oil and gas refiners.
Financial Metrics Comparison with Peers
Financial Statements
Comprehensive financial data including income, balance sheet, and cash flow metrics
Income Statement
| fiscal_date | 2026-03-31 | 2025-03-31 | 2024-03-31 | 2023-03-31 | 2022-03-31 |
|---|---|---|---|---|---|
| Sales | 10572.19B | 9646.93B | 9010.64B | 8778.35B | 6959.63B |
| Cost Of Goods | 7868.24B | 7226.87B | 6745.99B | 6718.98B | 5316.78B |
| Gross Profit | 2703.95B | 2420.06B | 2264.65B | 2059.37B | 1642.85B |
| Operating Expense Selling General And Administrative | 382.98B | 380.26B | 371.42B | 316.73B | 248.25B |
| Operating Expense Other Operating Expenses | 778.46B | 631.92B | 530.45B | 477.35B | 420.90B |
| Operating Income | 1213.77B | 1124.62B | 1116.66B | 1020.15B | 787.63B |
| Non Operating Interest Income | 133.02B | 124.10B | 107.45B | 112.40B | 125.29B |
| Non Operating Interest Expense | 240.56B | 221.21B | 217.72B | 189.58B | 144.38B |
| Pretax Income | 1231.62B | 1060.17B | 1047.27B | 940.46B | 821.54B |
| Income Tax | 275.52B | 252.30B | 257.07B | 203.76B | 159.70B |
| Net Income | 957.54B | 813.09B | 790.20B | 740.88B | 678.45B |
| Ebit | 1472.18B | 1281.38B | 1264.99B | 1130.04B | 965.92B |
| Ebitda | 2020.76B | 1798.71B | 1756.75B | 1547.65B | 1222.88B |
| Net Income Continuous Operations | 1231.62B | 1060.17B | 1047.27B | 948.01B | 841.42B |
| Minority Interests | -149.79B | -116.61B | -93.99B | -73.86B | -71.40B |
| Preferred Stock Dividends | 0.00 | 0.00 | 0.00 | 0.00 | 0.00 |
| Eps Basic | N/A | 51.47 | 51.45 | 49.30 | 46.00 |
| Eps Diluted | N/A | 51.47 | 51.45 | 49.30 | 45.43 |
| Basic Shares Outstanding | N/A | 13.53B | 13.53B | 13.53B | 13.53B |
| Diluted Shares Outstanding | N/A | 13.53B | 13.53B | 13.53B | 13.53B |
Data provided by Twelve Data
Balance Sheet
| fiscal_date | 2026-03-31 | 2025-03-31 | 2024-03-31 | 2023-03-31 | 2022-03-31 |
|---|---|---|---|---|---|
| Cash And Cash Equivalents | 1373.27B | 1006.45B | 935.40B | 341.56B | 335.09B |
| Accounts Receivable | 584.91B | 421.21B | 316.28B | 284.48B | 236.40B |
| Total Assets | 21781.40B | 19501.21B | 17559.86B | 16074.31B | 14996.65B |
| Total Liabilities | 10922.74B | 9404.95B | 8301.98B | 7785.50B | 6106.81B |
| Long Term Debt | 2869.49B | 2540.41B | 2401.27B | 1994.06B | 2007.06B |
| Shareholders Equity | 10858.66B | 10096.26B | 9257.88B | 8288.81B | 8889.84B |
Data provided by Twelve Data
Cash Flow Statement
| fiscal_date | 2026-03-31 | 2025-03-31 | 2024-03-31 | 2023-03-31 | 2022-03-31 |
|---|---|---|---|---|---|
| Operating Activities Net Income | 1231.62B | 1060.17B | 1047.27B | 948.01B | 841.42B |
| Operating Activities Other Non Cash Items | 109.71B | 100.01B | 111.90B | 79.58B | 23.36B |
| Operating Activities Accounts Receivable | -533.22B | -178.37B | -156.74B | 131.94B | -141.80B |
| Operating Activities Other Assets Liabilities | -207.90B | 31.34B | -127.56B | -322.28B | -249.83B |
| Operating Activities Operating Cash Flow | 600.21B | 1013.15B | 874.87B | 837.25B | 473.15B |
| Investing Activities Capital Expenditures | 8.26B | 23.43B | 153.07B | 91.86B | 31.37B |
| Investing Activities Purchase Of Investments | -9887.77B | -6843.40B | -5143.80B | -4718.22B | -6678.78B |
| Investing Activities Sale Of Investments | 9918.76B | 6725.58B | 5313.55B | 5012.66B | 6681.37B |
| Investing Activities Other Investing Activity | -47.36B | -45.74B | -44.23B | N/A | -193.06B |
| Investing Activities Investing Cash Flow | -8.11B | -140.13B | 278.59B | 386.30B | -159.10B |
| Financing Activities Long Term Debt Issuance | 388.71B | 263.78B | 696.10B | 359.36B | 593.43B |
| Financing Activities Long Term Debt Payments | -308.81B | -317.55B | -350.55B | -290.59B | -406.47B |
| Financing Activities Short Term Debt Issuance | -51.71B | 246.24B | -252.93B | 311.98B | -88.46B |
| Financing Activities Common Stock Issuance | 0.00 | 220.00M | 70.00M | 400.00M | 397.67B |
| Financing Activities Common Dividends | -74.43B | -67.66B | -60.89B | -50.83B | -42.97B |
| Financing Activities Financing Cash Flow | -46.24B | 125.03B | 230.10B | 335.11B | 457.70B |
| End Cash Position | 1459.77B | 1065.02B | 972.25B | 686.64B | 361.78B |
| Free Cash Flow | 691.97B | 387.36B | 59.05B | -259.56B | 105.09B |
| Financing Activities Other Financing Charges | N/A | N/A | 198.30B | 4.79B | 4.50B |
Data provided by Twelve Data
Technical Analysis
Key Insights
- Reliance Industries stock is currently in a short-term downtrend, trading below both its 50-day (₹1343.41) and 200-day (₹1419.44) moving averages, indicating bearish momentum in price action.
- Key support levels are identified near the 52-week low of ₹1253.20, while resistance is observed around the 52-week high of ₹1611.80 and the 50-day moving average at ₹1343.41.
- The stock is positioned below the 10-day, 50-day, and 200-day moving averages, suggesting sustained downward pressure across multiple timeframes.
- Momentum indicators show the RSI near neutral levels, MACD below the signal line indicating bearish momentum, and stochastic oscillators reflecting oversold conditions, signaling potential for a technical rebound.
- Analysis across daily, weekly, and monthly charts confirms a consolidation phase with downward bias, though oversold momentum indicators may suggest limited near-term downside.
- Current technical setup implies a cautious market scenario where the stock may test support levels before any meaningful recovery, with volatility likely to persist amid mixed momentum signals.
Trending News
Summary: Reliance Share Price: Find the latest news on Reliance Stock Price. Get all the information on Reliance with historic price charts for NSE / BSE. Experts & Broker view also get the Reliance Ltd. buy/sell tips detailed news, announcements, Forecasts, Analysts, Valuation, Earning forecasts, ...
Sentiment: neutral
2. Headline: Here's why Reliance Industries, Exide, Amara Raja shares are trading higher today - CNBC TV18
Summary: Reliance Industries is setting up a 10 GWh battery gigafactory at Jamnagar and is one of the beneficiaries under the government's Advanced Chemistry Cell (ACC) Production Linked Incentive (PLI) scheme.
Sentiment: positive
3. Headline: Reliance vs SEBI: Supreme Court says position limit breach is not market fraud - Opinion News | The Financial Express
Summary: The Supreme Court ruled that breaching position limits is not fraud, emphasizing the need for clear proof of inducement and manipulation in securities regulation cases. This decision challenges SEBI’s enforcement approach.
Sentiment: neutral
4. Headline: Reliance Industries shares in focus as company gets Sebi's warning over alleged insider trading - The Economic Times
Summary: Reliance Industries received a warning letter from market regulator Sebi. The letter cited alleged insider trading by two employees and a relative. Sebi investigated trades made while possessing unpublished price-sensitive information. The company stated it will address the concerns raised ...
Sentiment: negative
5. Headline: Stocks in news: RIL, Trent, Titan, Cochin Shipyard, Nestle, Indian Oil - The Economic Times
Summary: Markets extended their winning streak on Monday, supported by encouraging quarterly business updates. Reliance Industries received an administrative warning from Sebi regarding insider trading allegations. Trent and Titan reported strong revenue growth in their respective June quarter results.
Sentiment: positive
Powered by Brave
Recent Updates
News Summary
As of July 9, 2026. Reliance Industries is advancing its new energy strategy by setting up a 10 GWh battery gigafactory at Jamnagar, supported by the government’s Advanced Chemistry Cell Production Linked Incentive scheme. This initiative aims to reduce import costs and foster a local battery manufacturing ecosystem, positioning Reliance as a key player in India’s energy transition. Concurrently, the company received a cautionary warning letter from SEBI concerning alleged insider trading by certain employees and associates. While the regulator found violations related to trades made on unpublished price-sensitive information, no financial or operational restrictions were imposed. Reliance has committed to addressing the regulatory concerns and improving compliance standards. Despite these challenges, the company’s shares have shown resilience with gains over recent weeks, although the stock has declined approximately 16% year-to-date. These developments highlight Reliance’s dual focus on growth through innovation and the need for stringent governance adherence.
News Sentiment
The overall sentiment from recent updates is mixed but leans toward neutral to positive. Positive sentiment is driven by strategic investments in battery manufacturing under government incentives, signaling growth and innovation in new energy sectors. However, regulatory concerns related to insider trading allegations introduce caution and highlight governance risks. Market reaction has been relatively stable, reflecting investor confidence in the company’s fundamentals despite compliance scrutiny. The balance of growth initiatives and regulatory vigilance shapes the current outlook, emphasizing the importance of execution and risk management.
Source List
- https://www.cnbctv18.com/market/reliance-industries-exide-amara-raja-shares-customs-duty-manufacture-lithium-ion-cells-19941513.htm
- https://m.economictimes.com/markets/stocks/news/reliance-industries-shares-in-focus-as-company-gets-sebis-warning-over-alleged-insider-trading/articleshow/132229731.cms
Analytical Overview
Analysis Summary
Reliance Industries’ valuation metrics, including a trailing P/E of 21.84 and forward P/E of 18.16, are elevated compared to the industry average P/E of 21.84, reflecting premium pricing aligned with its diversified business model and growth prospects. The company’s revenue growth rate of 12.5% and strong operating cash flow of INR 1.92 trillion indicate a positive growth trajectory, although recent quarterly earnings have declined slightly year-over-year. Financial health appears solid with a moderate debt-to-equity ratio of 36.7% and substantial cash reserves of INR 2.58 trillion, supporting liquidity and investment capacity. Sector-specific opportunities include expansion in new energy and digital services, supported by government incentives, while challenges encompass regulatory scrutiny and competitive pressures in core energy markets. Considering India-specific factors, Reliance benefits from a favorable regulatory environment for renewable energy and digital infrastructure, alongside growing consumer demand in retail and telecom sectors.
Overall Business and Market Assessment
Supporting Factors: robust cash flow generation, diversified revenue streams across energy, retail, and digital sectors, and strategic investments in battery manufacturing aligned with government policies
Risk Factors: regulatory compliance issues highlighted by SEBI warnings and potential earnings volatility amid macroeconomic and commodity price fluctuations
SWOT Analysis
Strengths
- Strong diversified business model spanning energy, retail, digital, and media sectors.
- Robust cash flow generation with operating cash flow of INR 1.92 trillion.
- Leading market position in oil refining and petrochemicals with world-class facilities.
- Significant promoter and institutional ownership ensuring stable governance.
Weaknesses
- Recent quarterly earnings declined by 12.6% year-over-year.
- Moderate return on equity at 9.14% compared to some industry peers.
- Regulatory scrutiny due to SEBI warning on insider trading allegations.
- Stock trading below key moving averages indicating short-term technical weakness.
Opportunities
- Expansion into battery manufacturing with a 10 GWh gigafactory under government PLI scheme.
- Growth potential in digital services through Jio’s broadband and mobile platforms.
- Increasing demand for sustainable energy solutions in India’s evolving market.
- Potential upside from analyst target prices averaging 23% above current levels.
Threats
- Regulatory risks related to insider trading investigations and compliance enforcement.
- Competitive pressures in energy and telecom sectors from domestic and international players.
- Macroeconomic volatility impacting commodity prices and consumer spending.
- Potential market volatility due to geopolitical and economic uncertainties.
Company Description
Reliance Industries Ltd. is an Indian multinational conglomerate headquartered in Mumbai, operating as one of the largest private sector corporations in the country. It spans a diverse portfolio including energy, where it engages in hydrocarbon exploration, petroleum refining, and oil-to-chemicals strategies through world-class facilities like the Jamnagar complex. The petrochemicals division produces polymers, polyesters, elastomers, and advanced materials, positioning it among the top global producers. Reliance Retail offers an omni-channel network with brands covering groceries, fashion, electronics, and jewelry, serving consumers and small merchants across India. Its digital services arm, Jio, provides broadband, mobile connectivity, and platforms fostering a digital-first ecosystem. The company also operates in media and entertainment, delivering content across various formats, and new energy, focusing on solar, hydrogen, batteries, and sustainable materials. Media and entertainment businesses include content creation and distribution tailored to India's diverse audiences. Founded in 1958, Reliance Industries Ltd. plays a pivotal role in India's industrial, consumer, and digital landscapes with integrated operations that emphasize innovation and sustainability.