
Reliance Industries Ltd (RELIANCE)
Stock Analysis Report
Key Positives and Key Risks
Pros
- Market capitalization of ₹17.97 trillion underscores Reliance’s dominant industry position and scale.
- Operating cash flow of INR 1.01 trillion and free cash flow of INR 696 billion demonstrate strong liquidity and operational efficiency.
- Forward P/E ratio of 20.31 aligns with industry average, indicating fair valuation relative to growth prospects.
Cons
- Return on equity of 6.9% suggests moderate profitability compared to some peers with higher efficiency.
- Debt-to-equity ratio of 35.65% indicates leverage that requires monitoring amid capital-intensive operations.
- Stock trades at a premium EV/EBITDA multiple of 12.7 compared to regional peers, reflecting valuation risk.
Disclosure: This information is for general awareness and does not constitute investment advice
Report Summary
Reliance Industries Ltd. is a leading Indian multinational conglomerate primarily operating in the energy sector, specifically in oil and gas refining and marketing. Listed on the NSE, it holds a dominant position in India’s energy industry with diversified business segments including petrochemicals, retail, digital services through Jio, media, entertainment, and new energy initiatives. The company’s integrated operations span hydrocarbon exploration, refining, petrochemicals production, retail distribution, and digital connectivity, positioning it as a key player in India’s industrial and consumer markets.
Financially, Reliance reported trailing twelve-month revenue of approximately INR 10.25 trillion with a gross margin of 29.7%, operating margin of 11.85%, and net profit margin of 8.12%. Its return on equity stands at 6.9% and return on assets at 3.57%, reflecting moderate profitability and asset efficiency. The company generated operating cash flow of INR 1.01 trillion and levered free cash flow of INR 696 billion, indicating strong cash generation capabilities supporting its capital-intensive operations.
Valuation metrics show a trailing P/E ratio of 21.58, forward P/E of 20.31, and price-to-book ratio of 2.05, with an enterprise value to EBITDA multiple of 12.7. The market capitalization is approximately INR 17.97 trillion, with the stock currently trading at INR 1,370.5, near the middle of its 52-week range of INR 1,290 to INR 1,611.8. These valuation levels suggest the stock is priced in line with its fundamentals relative to the industry average P/E of 21.58.
Reliance’s strengths include a robust cash position of INR 2.24 trillion, manageable debt levels with a debt-to-equity ratio of 35.65%, and diversified business segments that provide resilience against sector-specific risks. Key risks involve regulatory challenges in energy and digital sectors, competitive pressures in retail and telecom, and macroeconomic factors affecting commodity prices. The company’s recent strategic focus on digital expansion and new energy initiatives reflects an adaptive approach to evolving market dynamics.
Technically, the stock is trading above its 50-day moving average but below the 200-day average, with momentum indicators showing neutral to slightly bullish signals. The current price action and volume trends suggest a balanced market sentiment. Overall, the data indicates a stable trajectory with conditions that may warrant close observation for potential accumulation or realization of gains depending on market developments.
Company and Industry Overview
Company Basics
Price Performance
Company Size
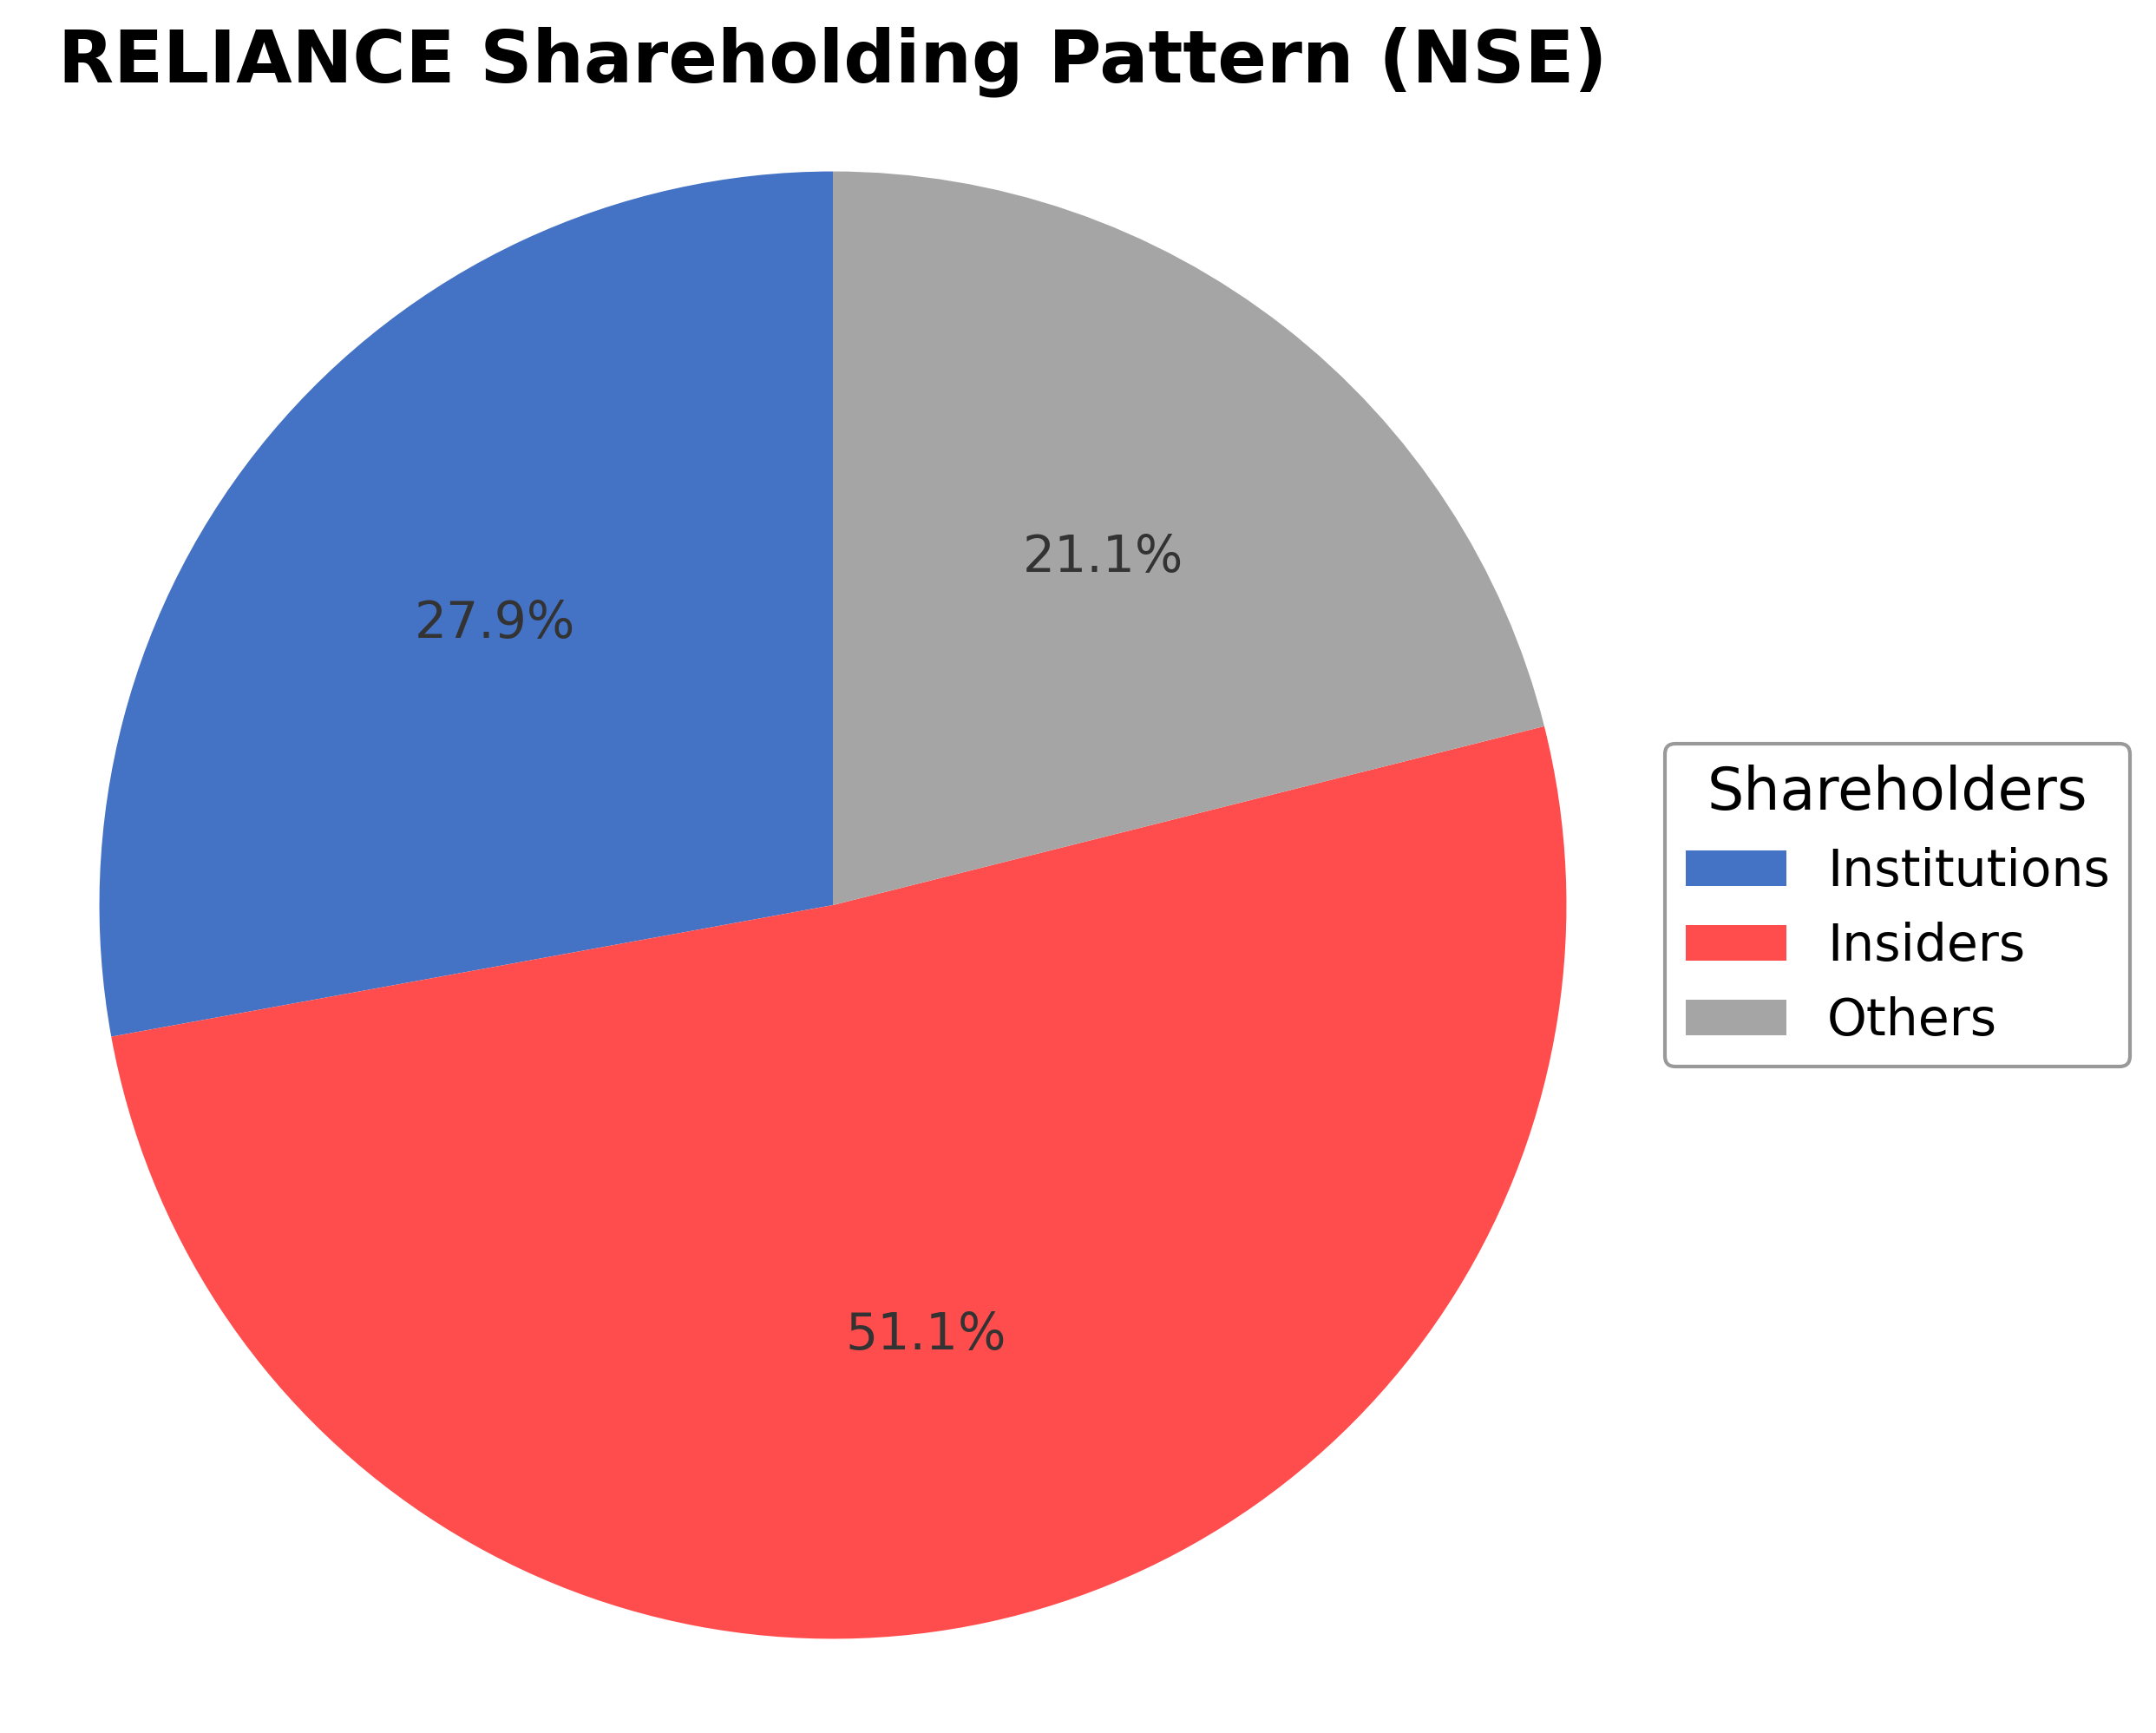
Shareholding Pattern
Sector and Industry Analysis
The Indian oil refining and petrochemicals sector is a significant contributor to the country's industrial output, with Reliance Industries Ltd. being one of the largest players. The sector has witnessed robust revenue growth, driven by rising domestic demand and export opportunities. Key players include Reliance, Gail, and other integrated oil and gas companies, with the market expanding due to increasing consumption of refined products and petrochemicals.
Industry trends highlight a shift towards diversification and digital integration, as seen in Reliance's expansion into retail and digital services alongside its traditional oil-to-chemicals (O2C) business. Competitive dynamics are shaped by economies of scale, technological advancements, and strategic acquisitions, which create high barriers to entry. Reliance’s strong presence across multiple segments and investments in new energy verticals position it favorably against peers.
The regulatory environment in India supports energy security and sustainability, with policies encouraging cleaner fuels and digital infrastructure development. Refining margins benefit from favorable product cracks, while retail and digital sectors gain from government initiatives promoting digital adoption and consumer spending. Ongoing regulatory scrutiny on environmental norms and pricing mechanisms will continue to influence sector profitability and investment decisions.
Note: Analysis synthesized from industry research, market reports, and regulatory filings. Information is subject to change based on market conditions.
Financial Ratios Dashboard
Illustrative Scenario Analysis
DCF Assumptions:
Method: Two-Stage EPS-Priority Model
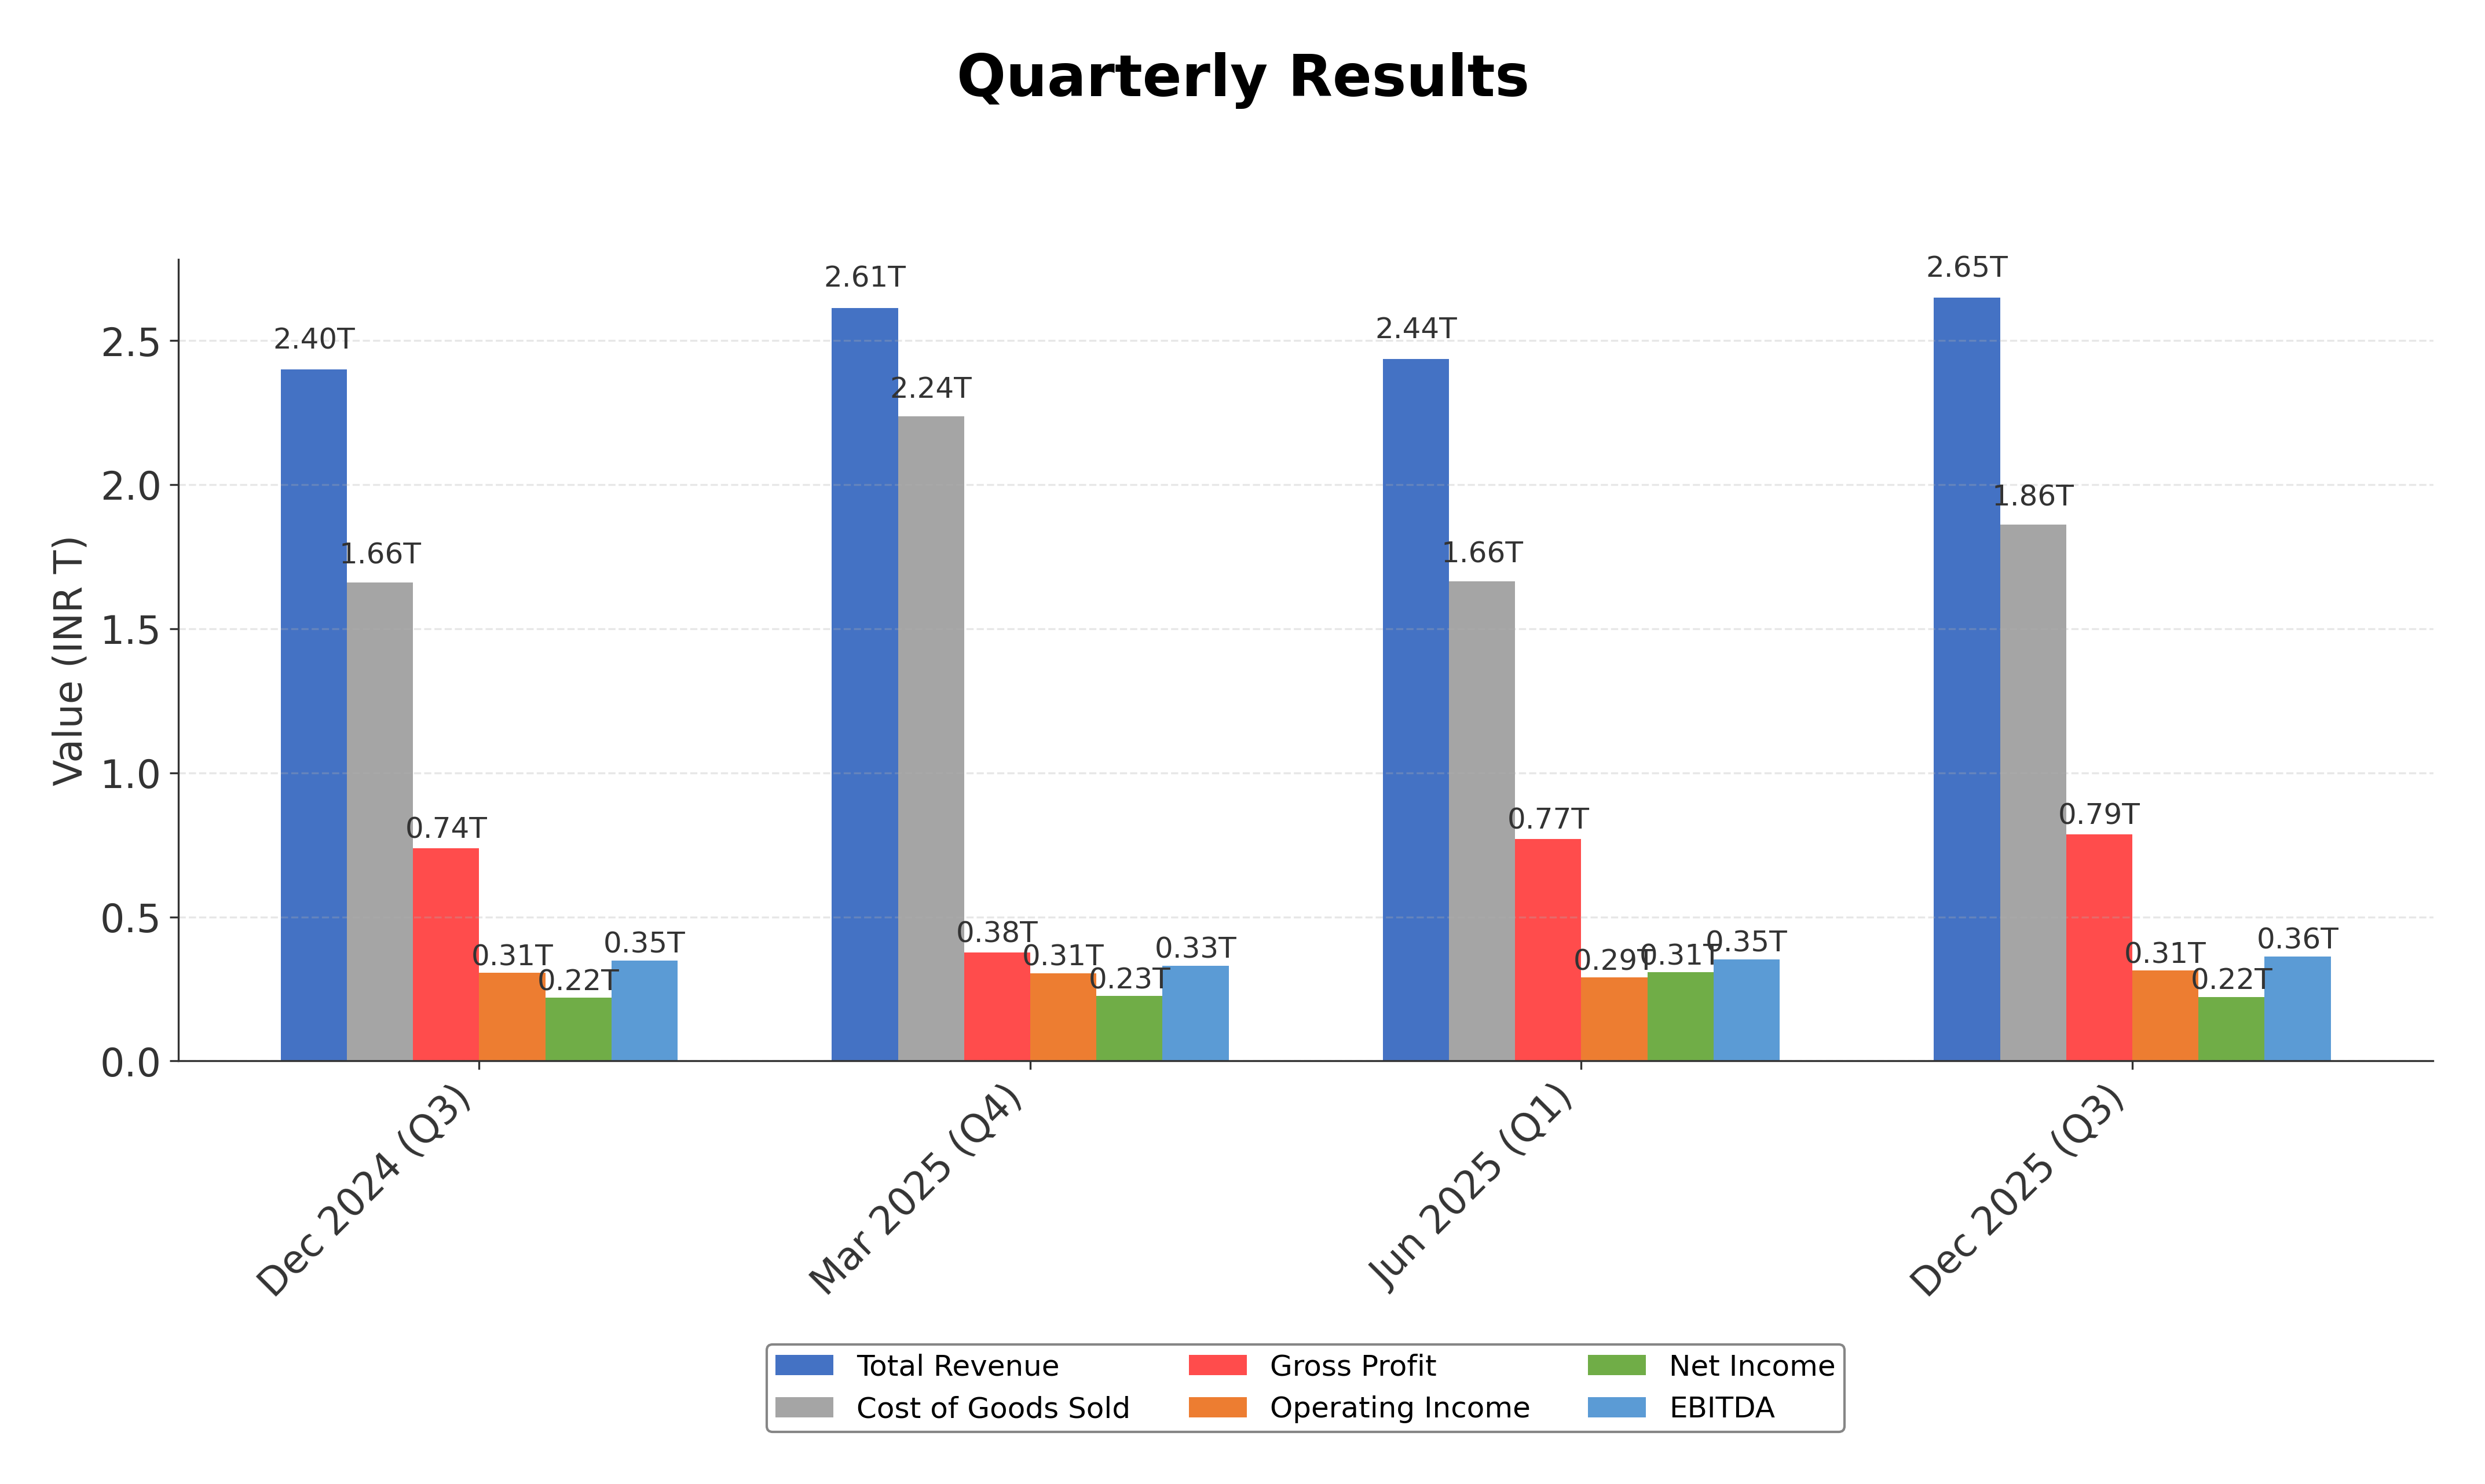
Financials
Peer Analysis
| Company Name | Market Cap | P/E Ratio | P/B Ratio | EV/EBITDA | Price to CFO |
|---|---|---|---|---|---|
| Reliance Industries Ltd. | ₹17.97T | 21.58 | 2.05 | 12.71 | 17.74 |
| Chennai Petroleum Corporation Limited | ₹154.12B | 4.97 | 1.75 | 4.79 | 6.54 |
| Aegis Logistics Limited | ₹250.79B | 48.78 | 5.62 | 24.96 | 20.60 |
| Mangalore Refinery and Petrochemicals Limited | ₹326.65B | 16.97 | 2.45 | 7.47 | 20.12 |
| Hindustan Petroleum Corporation Limited | ₹794.74B | 5.16 | 1.40 | 5.09 | 17.40 |
| Petronet LNG Ltd. | ₹410.18B | 11.29 | 1.94 | 6.84 | 8.36 |
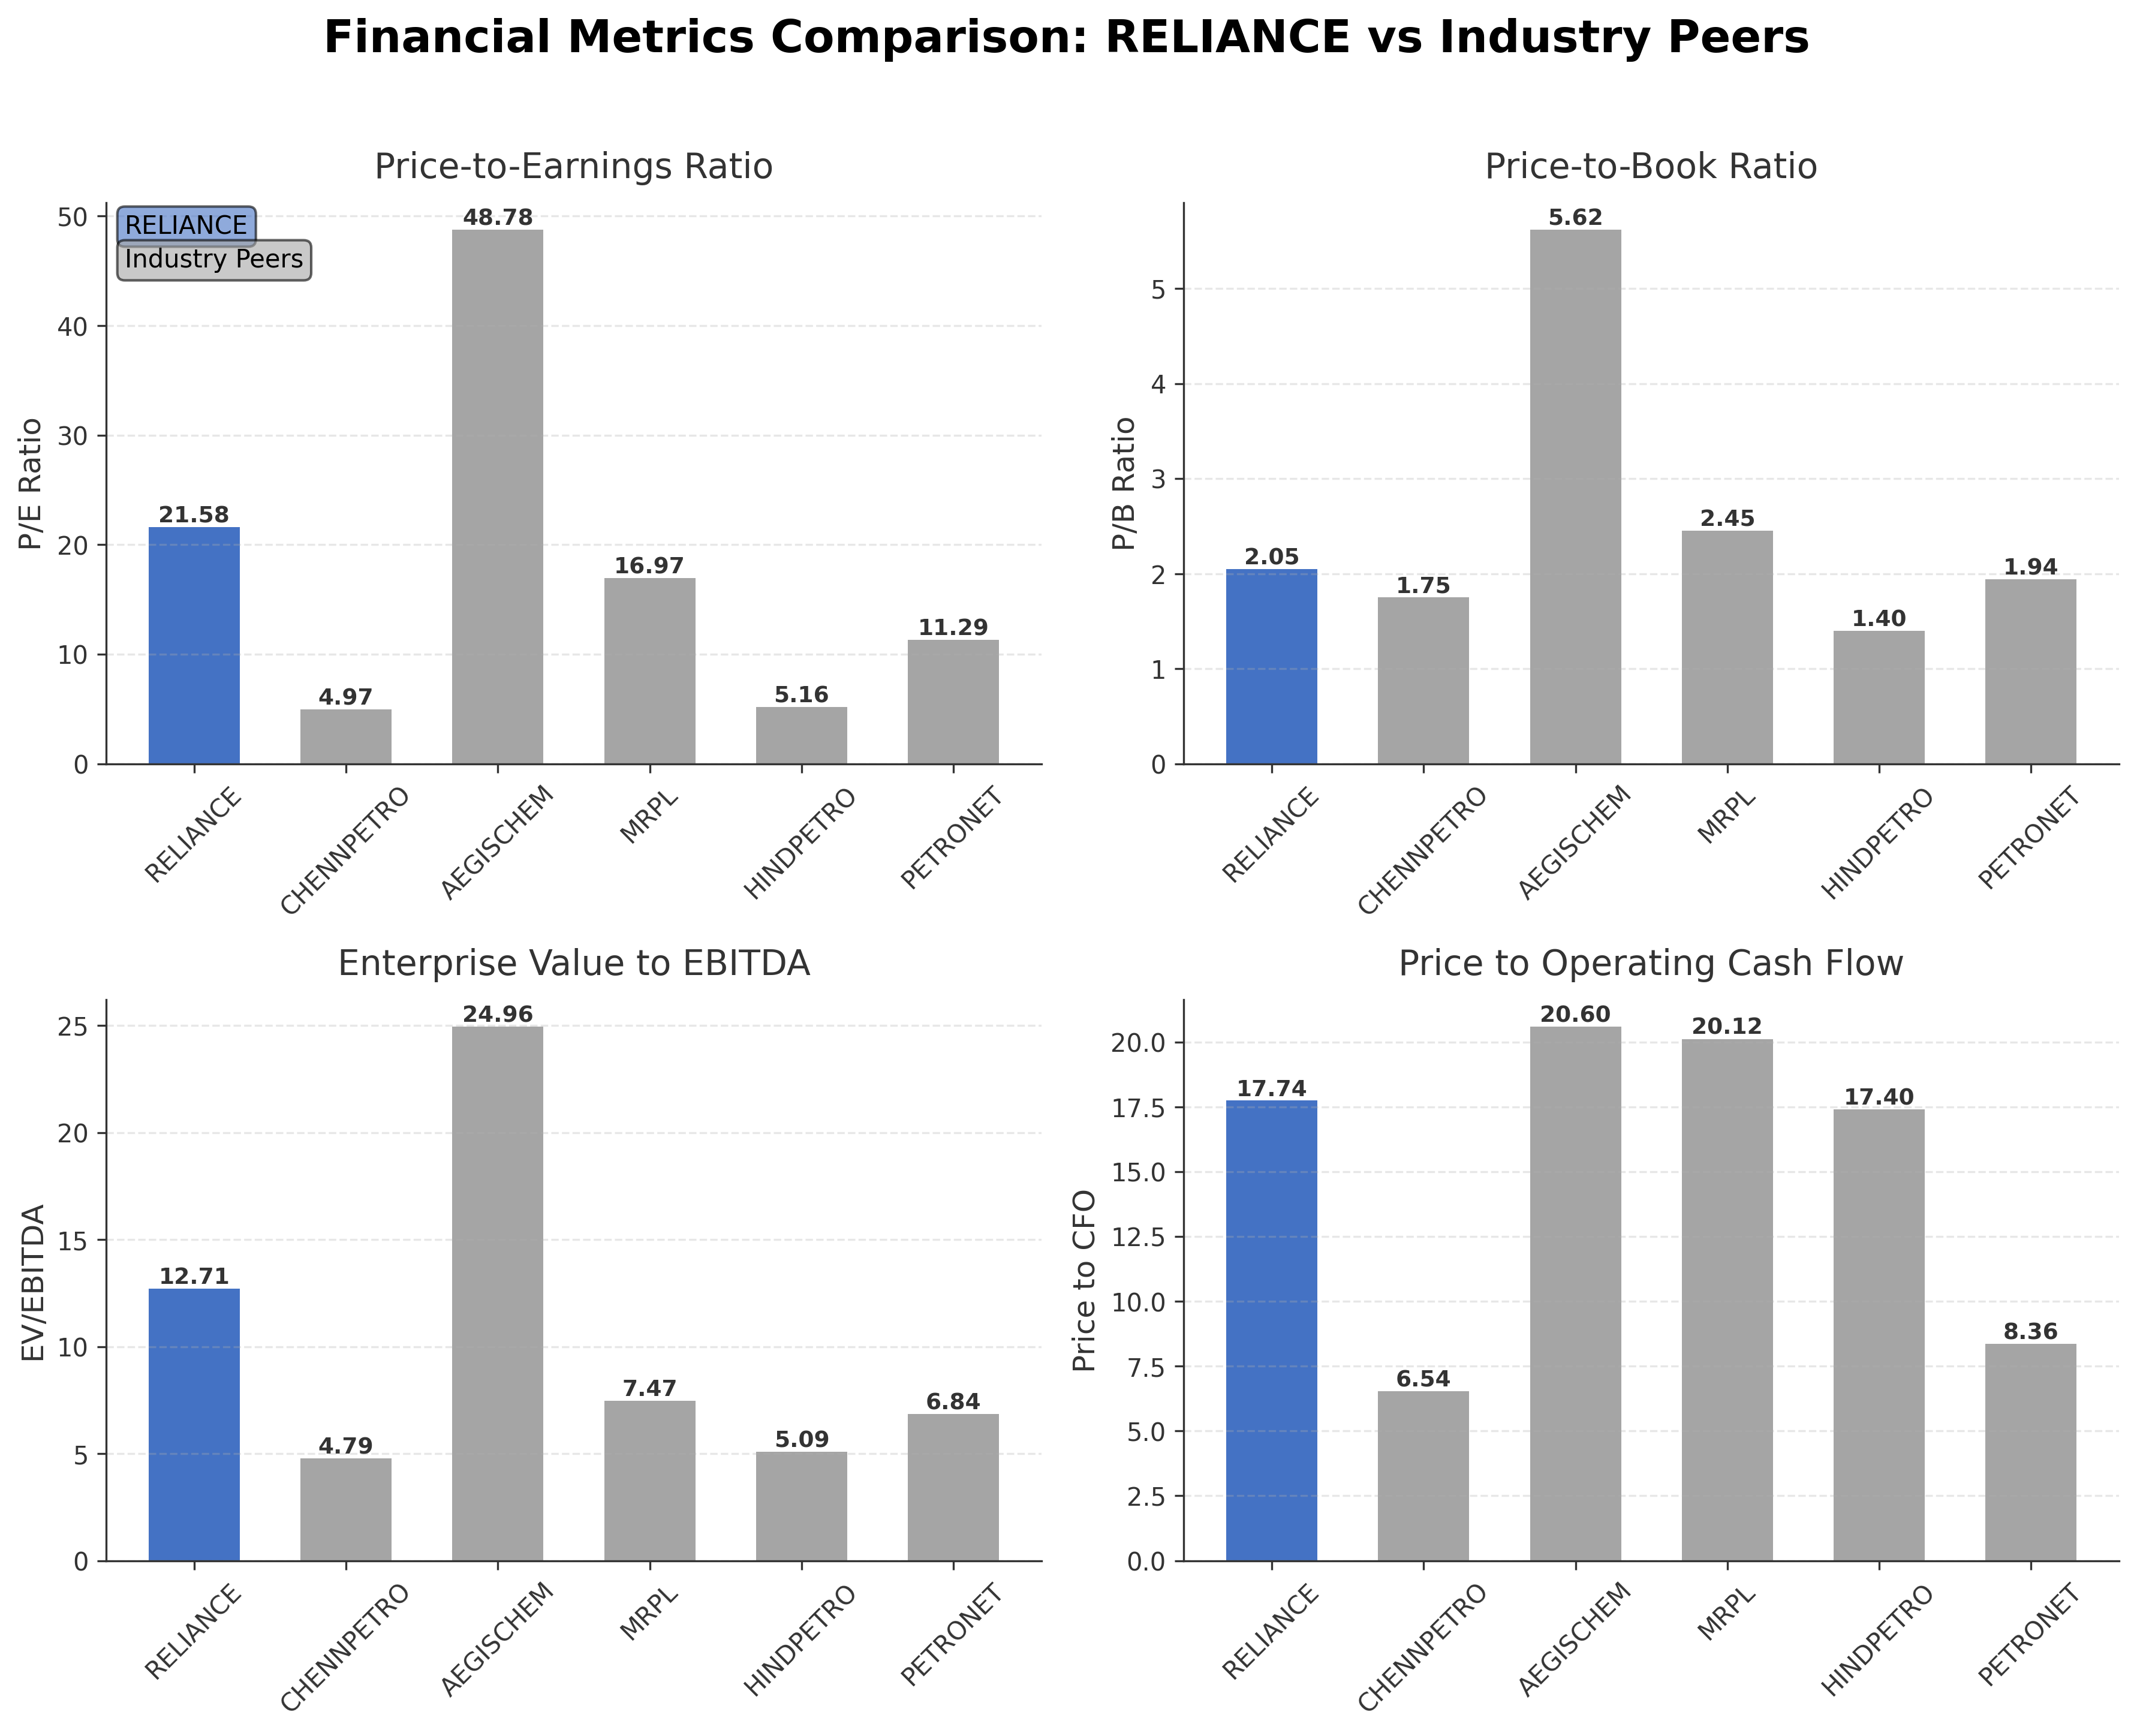
Comparison Analysis: Reliance Industries Ltd. exhibits a higher market capitalization and moderate valuation multiples compared to its regional peers in the oil and gas refining sector. Its P/E ratio of 21.58 is significantly above companies like Chennai Petroleum and Hindustan Petroleum, which trade at single-digit P/E ratios, reflecting Reliance's diversified business model and growth prospects. The company’s EV/EBITDA multiple of 12.71 is also higher than most peers, indicating a premium valuation. Return on equity at 6.9% is modest relative to some peers but aligns with its large-scale integrated operations. Overall, Reliance stands out for its scale and diversified operations, though it trades at a premium relative to more specialized regional competitors.
Financial Metrics Comparison with Peers
Financial Statements
Comprehensive financial data including income, balance sheet, and cash flow metrics
Income Statement
| fiscal_date | 2025-03-31 | 2024-03-31 | 2023-03-31 | 2022-03-31 | 2021-03-31 |
|---|---|---|---|---|---|
| Sales | 9646.93B | 9010.64B | 8778.35B | 6959.63B | 4669.24B |
| Cost Of Goods | 7226.87B | 6745.99B | 6718.98B | 5316.78B | 3390.61B |
| Gross Profit | 2420.06B | 2264.65B | 2059.37B | 1642.85B | 1278.63B |
| Operating Expense Selling General And Administrative | 380.26B | 371.42B | 316.73B | 248.25B | 196.70B |
| Operating Expense Other Operating Expenses | 631.92B | 530.45B | 477.35B | 420.90B | 396.01B |
| Operating Income | 1124.62B | 1116.66B | 1020.15B | 787.63B | 541.65B |
| Non Operating Interest Income | 124.10B | 107.45B | 112.40B | 125.29B | 103.66B |
| Non Operating Interest Expense | 221.21B | 217.72B | 189.58B | 144.38B | 179.07B |
| Pretax Income | 1060.17B | 1047.27B | 940.46B | 821.54B | 554.61B |
| Income Tax | 252.30B | 257.07B | 203.76B | 159.70B | 17.22B |
| Net Income | 813.09B | 790.20B | 740.88B | 678.45B | 537.39B |
| Eps Basic | 51.47 | 51.45 | 49.30 | 46.00 | 38.19 |
| Eps Diluted | 51.47 | 51.45 | 49.30 | 45.43 | 37.60 |
| Basic Shares Outstanding | 13.53B | 13.53B | 13.53B | 13.53B | 12.87B |
| Diluted Shares Outstanding | 13.53B | 13.53B | 13.53B | 13.53B | 12.87B |
| Ebit | 1281.38B | 1264.99B | 1130.04B | 965.92B | 733.68B |
| Ebitda | 1798.71B | 1756.75B | 1547.65B | 1222.88B | 893.34B |
| Net Income Continuous Operations | 1060.17B | 1047.27B | 948.01B | 841.42B | 554.61B |
| Minority Interests | -116.61B | -93.99B | -73.86B | -71.40B | -46.11B |
| Preferred Stock Dividends | 0.00 | 0.00 | 0.00 | 0.00 | 0.00 |
Source: Financial statements and regulatory filings
Balance Sheet
| fiscal_date | 2025-03-31 | 2024-03-31 | 2023-03-31 | 2022-03-31 | 2021-03-31 |
|---|---|---|---|---|---|
| Cash And Cash Equivalents | 1006.45B | 935.40B | 341.56B | 335.09B | 145.06B |
| Accounts Receivable | 421.21B | 316.28B | 284.48B | 236.40B | 190.14B |
| Total Assets | 19501.21B | 17559.86B | 16074.31B | 14996.65B | 13212.12B |
| Total Liabilities | 9404.95B | 8301.98B | 7785.50B | 6106.81B | 5217.80B |
| Long Term Debt | 2540.41B | 2401.27B | 1994.06B | 2007.06B | 1706.31B |
| Shareholders Equity | 10096.26B | 9257.88B | 8288.81B | 8889.84B | 7994.32B |
Source: Financial statements and regulatory filings
Cash Flow Statement
| fiscal_date | 2025-03-31 | 2024-03-31 | 2023-03-31 | 2022-03-31 | 2021-03-31 |
|---|---|---|---|---|---|
| Operating Activities Net Income | 1060.17B | 1047.27B | 948.01B | 841.42B | 554.61B |
| Operating Activities Other Non Cash Items | 100.01B | 111.90B | 79.58B | 23.36B | 108.55B |
| Operating Activities Accounts Receivable | -178.37B | -156.74B | 131.94B | -141.80B | 9.59B |
| Operating Activities Other Assets Liabilities | 31.34B | -127.56B | -322.28B | -249.83B | -77.69B |
| Operating Activities Operating Cash Flow | 1013.15B | 874.87B | 837.25B | 473.15B | 595.06B |
| Investing Activities Capital Expenditures | 23.43B | 153.07B | 91.86B | 31.37B | -1035.18B |
| Investing Activities Purchase Of Investments | -6843.40B | -5143.80B | -4718.22B | -6678.78B | -6898.66B |
| Investing Activities Sale Of Investments | 6725.58B | 5313.55B | 5012.66B | 6681.37B | 6425.51B |
| Investing Activities Other Investing Activity | -45.74B | -44.23B | N/A | -193.06B | -20.00M |
| Investing Activities Investing Cash Flow | -140.13B | 278.59B | 386.30B | -159.10B | -1508.35B |
| Financing Activities Long Term Debt Issuance | 263.78B | 696.10B | 359.36B | 593.43B | 332.11B |
| Financing Activities Long Term Debt Payments | -317.55B | -350.55B | -290.59B | -406.47B | -872.40B |
| Financing Activities Short Term Debt Issuance | 246.24B | -252.93B | 311.98B | -88.46B | -296.81B |
| Financing Activities Common Stock Issuance | 220.00M | 70.00M | 400.00M | 397.67B | 132.15B |
| Financing Activities Common Dividends | -67.66B | -60.89B | -50.83B | -42.97B | -39.21B |
| Financing Activities Financing Cash Flow | 125.03B | 230.10B | 335.11B | 457.70B | 1212.66B |
| End Cash Position | 1065.02B | 972.25B | 686.64B | 361.78B | 173.97B |
| Free Cash Flow | 387.36B | 59.05B | -259.56B | 105.09B | -788.79B |
| Financing Activities Other Financing Charges | N/A | 198.30B | 4.79B | 4.50B | 1956.82B |
Source: Financial statements and regulatory filings
Technical Analysis
Key Insights
- Current trend shows a consolidation phase with price trading between key moving averages, indicating indecision in market direction.
- Support levels are identified near INR 1,290 (52-week low) and INR 1,370, while resistance is observed around INR 1,430 (200-day moving average) and INR 1,611.8 (52-week high).
- The stock is currently trading above the 50-day moving average (INR 1,379) but below the 200-day moving average (INR 1,431), suggesting mixed momentum.
- Momentum indicators show RSI near neutral levels around 50, MACD histogram close to zero, and stochastic oscillators indicating no strong overbought or oversold conditions.
- Multi-timeframe analysis reveals neutral to slightly bullish signals on daily and weekly charts, with monthly charts showing sideways movement.
- Potential market scenarios include a breakout above 200-day moving average leading to upward momentum or a decline towards support levels triggering consolidation.
Trending News
No trending news available.
Recent Updates
News Summary
As of the latest available data, there are no recent significant news updates related to Reliance Industries Ltd. covering earnings, leadership changes, strategic partnerships, regulatory developments, or major industry events within the past three months. The absence of new material news suggests a period of operational stability without notable corporate actions or external impacts reported.
News Sentiment
The overall sentiment from recent updates is neutral due to the lack of new information or events affecting the company. This absence of news indicates no immediate catalysts influencing market perception or stock performance, reflecting a stable but uneventful period.
Source List
Analytical Overview
Analysis Summary
Reliance Industries Ltd.’s valuation metrics, including a trailing P/E of 21.58 and forward P/E of 20.31, are broadly in line with the industry average of 21.58, suggesting the stock is fairly valued relative to peers. The PEG ratio of 1.72 indicates moderate growth expectations priced into the stock. The company’s revenue growth rate of 10.4% and consistent operating cash flow generation demonstrate a positive growth trajectory supported by diversified business segments.
Financial health appears robust with a debt-to-equity ratio of 35.65%, manageable within the capital-intensive energy sector, and strong cash reserves of over INR 2.2 trillion. Operating cash flow of INR 1.01 trillion and free cash flow of INR 696 billion underscore solid liquidity and capacity for reinvestment or debt servicing. Sector-specific challenges include regulatory scrutiny and commodity price volatility, while opportunities arise from digital expansion and new energy initiatives.
Considering India-specific factors, Reliance benefits from a favorable regulatory environment promoting energy transition and digital infrastructure growth. Consumer trends towards digital services and retail expansion support its diversified portfolio. The company’s strategic positioning in energy, retail, and digital sectors provides competitive advantages in a rapidly evolving Indian market landscape.
Overall Business and Market Assessment
Supporting Factors: Key supporting factors include strong cash flow generation, diversified business operations, and stable financial health with moderate leverage. Risks to monitor encompass regulatory changes, competitive pressures in telecom and retail, and commodity price fluctuations impacting energy margins. The appropriate investment timeframe is medium to long-term, reflecting the company’s strategic initiatives and sector dynamics. Overall, Reliance Industries Ltd. presents a balanced profile with stable fundamentals and growth prospects tempered by sector-specific risks.
Risk Factors: No data
SWOT Analysis
Strengths
- Large market capitalization and diversified business portfolio across energy, retail, and digital services.
- Strong cash flow generation with operating cash flow of INR 1.01 trillion and free cash flow of INR 696 billion.
- Robust balance sheet with manageable debt-to-equity ratio of 35.65% and cash reserves exceeding INR 2.2 trillion.
- Integrated operations with world-class refining and petrochemical facilities supporting competitive positioning.
Weaknesses
- Moderate return on equity of 6.9% indicating room for improvement in capital efficiency.
- Stock valuation at a premium relative to regional peers with higher P/E and EV/EBITDA multiples.
- Relatively low dividend yield of approximately 1.65% which may limit income appeal.
- Dependence on commodity prices exposes earnings to market volatility.
Opportunities
- Expansion in digital services and broadband through Jio platform tapping into growing Indian market.
- Growth potential in new energy sectors including solar, hydrogen, and sustainable materials.
- Retail segment’s omni-channel strategy addressing rising consumer demand and market penetration.
- Favorable regulatory environment supporting energy transition and infrastructure development.
Threats
- Regulatory risks in energy and telecommunications sectors could impact operations.
- Intense competition in retail and digital markets may pressure margins and market share.
- Macroeconomic factors such as inflation and currency fluctuations affecting costs and profitability.
- Volatility in global oil prices influencing refining and petrochemical margins.
Company Description
Reliance Industries Ltd. is an Indian multinational conglomerate headquartered in Mumbai, operating as one of the largest private sector corporations in the country. It spans a diverse portfolio including energy, where it engages in hydrocarbon exploration, petroleum refining, and oil-to-chemicals strategies through world-class facilities like the Jamnagar complex. The petrochemicals division produces polymers, polyesters, elastomers, and advanced materials, positioning it among the top global producers. Reliance Retail offers an omni-channel network with brands covering groceries, fashion, electronics, and jewelry, serving consumers and small merchants across India. Its digital services arm, Jio, provides broadband, mobile connectivity, and platforms fostering a digital-first ecosystem. The company also operates in media and entertainment, delivering content across various formats, and new energy, focusing on solar, hydrogen, batteries, and sustainable materials. Media and entertainment businesses include content creation and distribution tailored to India's diverse audiences. Founded in 1958, Reliance Industries Ltd. plays a pivotal role in India's industrial, consumer, and digital landscapes with integrated operations that emphasize innovation and sustainability.