
RattanIndia Enterprises Ltd (RTNINDIA)
Stock Analysis Report
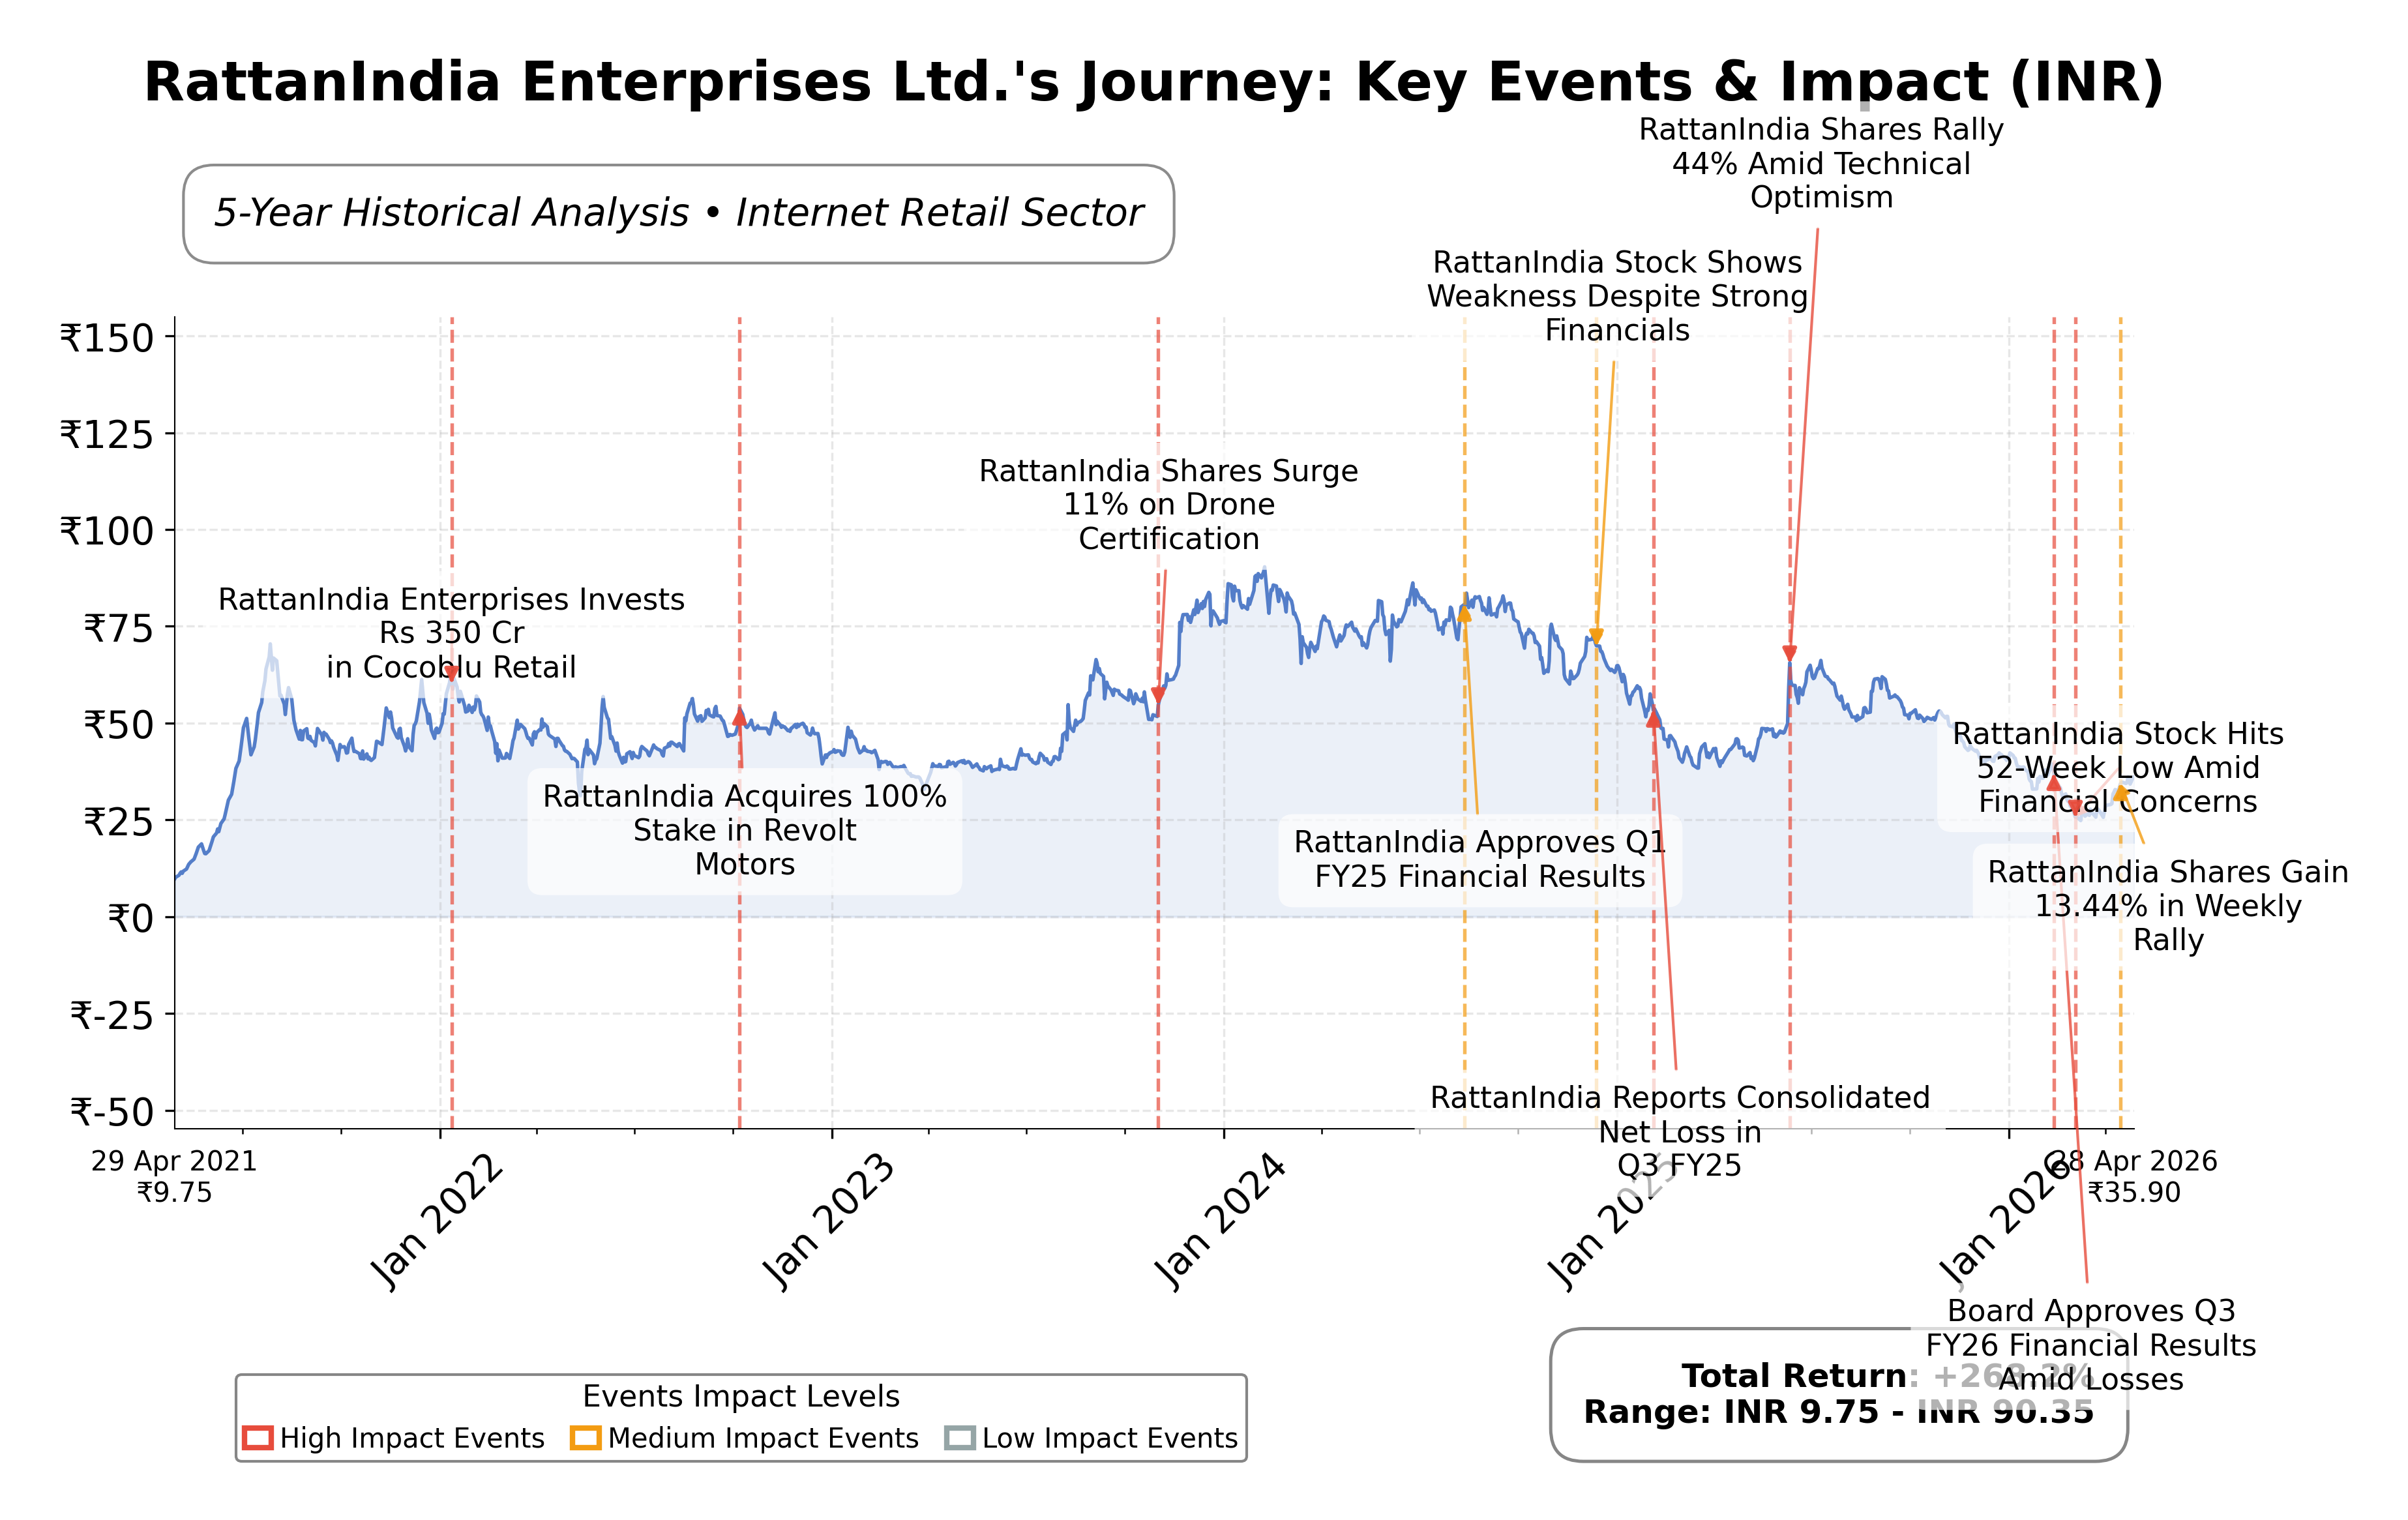
Stock Journey
Key Positives and Key Risks
Pros
- Strong cash reserves of approximately INR 13.29 billion provide liquidity support.
- Positive operating cash flow of INR 4.05 billion demonstrates operational efficiency.
- Diversified business model across renewable energy and digital sectors offers growth avenues.
Cons
- High debt-to-equity ratio of 107.3% indicates significant leverage risk.
- Net loss of approximately INR 6.63 billion reflects ongoing profitability challenges.
- Current stock price is closer to 52-week low with a downside risk of 48.9%, indicating market caution.
Disclosure: This information is for general awareness and does not constitute investment advice
Report Summary
RattanIndia Enterprises Ltd. operates primarily in the Indian infrastructure and renewable energy sectors with a strong focus on solar power project development and management. The company also extends its business into new-age digital technologies and FinTech, positioning itself within the Consumer Cyclical sector on the NSE exchange. Its diversified portfolio aligns with India's sustainability goals and government policies promoting green energy and technological innovation, establishing it as a significant player in the evolving Indian market landscape.
Financially, RattanIndia reported trailing twelve months (TTM) revenue of INR 581,000 with a gross margin of 22.34%, operating margin of 1.52%, and a profit margin of 17.69%. The return on equity (ROE) stands at 9.14%, and return on assets (ROA) at 3.20%, reflecting moderate profitability and asset efficiency. However, the company posted a net loss of approximately INR 6.63 billion over the same period, indicating challenges in net income generation despite positive operating cash flow of INR 4.05 billion and free cash flow of INR 844 million.
From a valuation perspective, the stock trades at a high trailing price-to-earnings (P/E) ratio of 84.51 and a price-to-book (P/B) ratio of 4.58, with an enterprise value to EBITDA (EV/EBITDA) ratio showing a negative figure due to EBITDA distortions. The market capitalization is around INR 47.30 billion, with the current share price at INR 35.84, positioned closer to its 52-week low of INR 24.40 than the high of INR 69.70. These metrics suggest a premium valuation relative to earnings and book value, reflecting market expectations for growth or strategic repositioning.
Key strengths include substantial cash reserves of approximately INR 13.29 billion and manageable debt levels at INR 11.10 billion, though the debt-to-equity ratio is elevated at 107.3%. The company benefits from a diversified business model with exposure to renewable energy and digital sectors. Risks encompass regulatory challenges, competitive pressures in the internet retail and energy sectors, and ongoing net losses. Recent strategic actions include expansion into e-commerce through Cocoblu and technical upgrades reflected in improved market sentiment and stock momentum.
Technically, the stock shows mixed signals with price currently below the 200-day moving average (INR 43.23) but above the 50-day average (INR 29.69), indicating potential consolidation. Momentum indicators suggest some positive shifts, supported by recent news of technical momentum and improved trading volumes. Overall, the data portrays a complex scenario where conditions may favor cautious observation or selective accumulation depending on evolving market dynamics and company performance.
Company and Industry Overview
Company Basics
Price Performance
Company Size
Shareholding Pattern
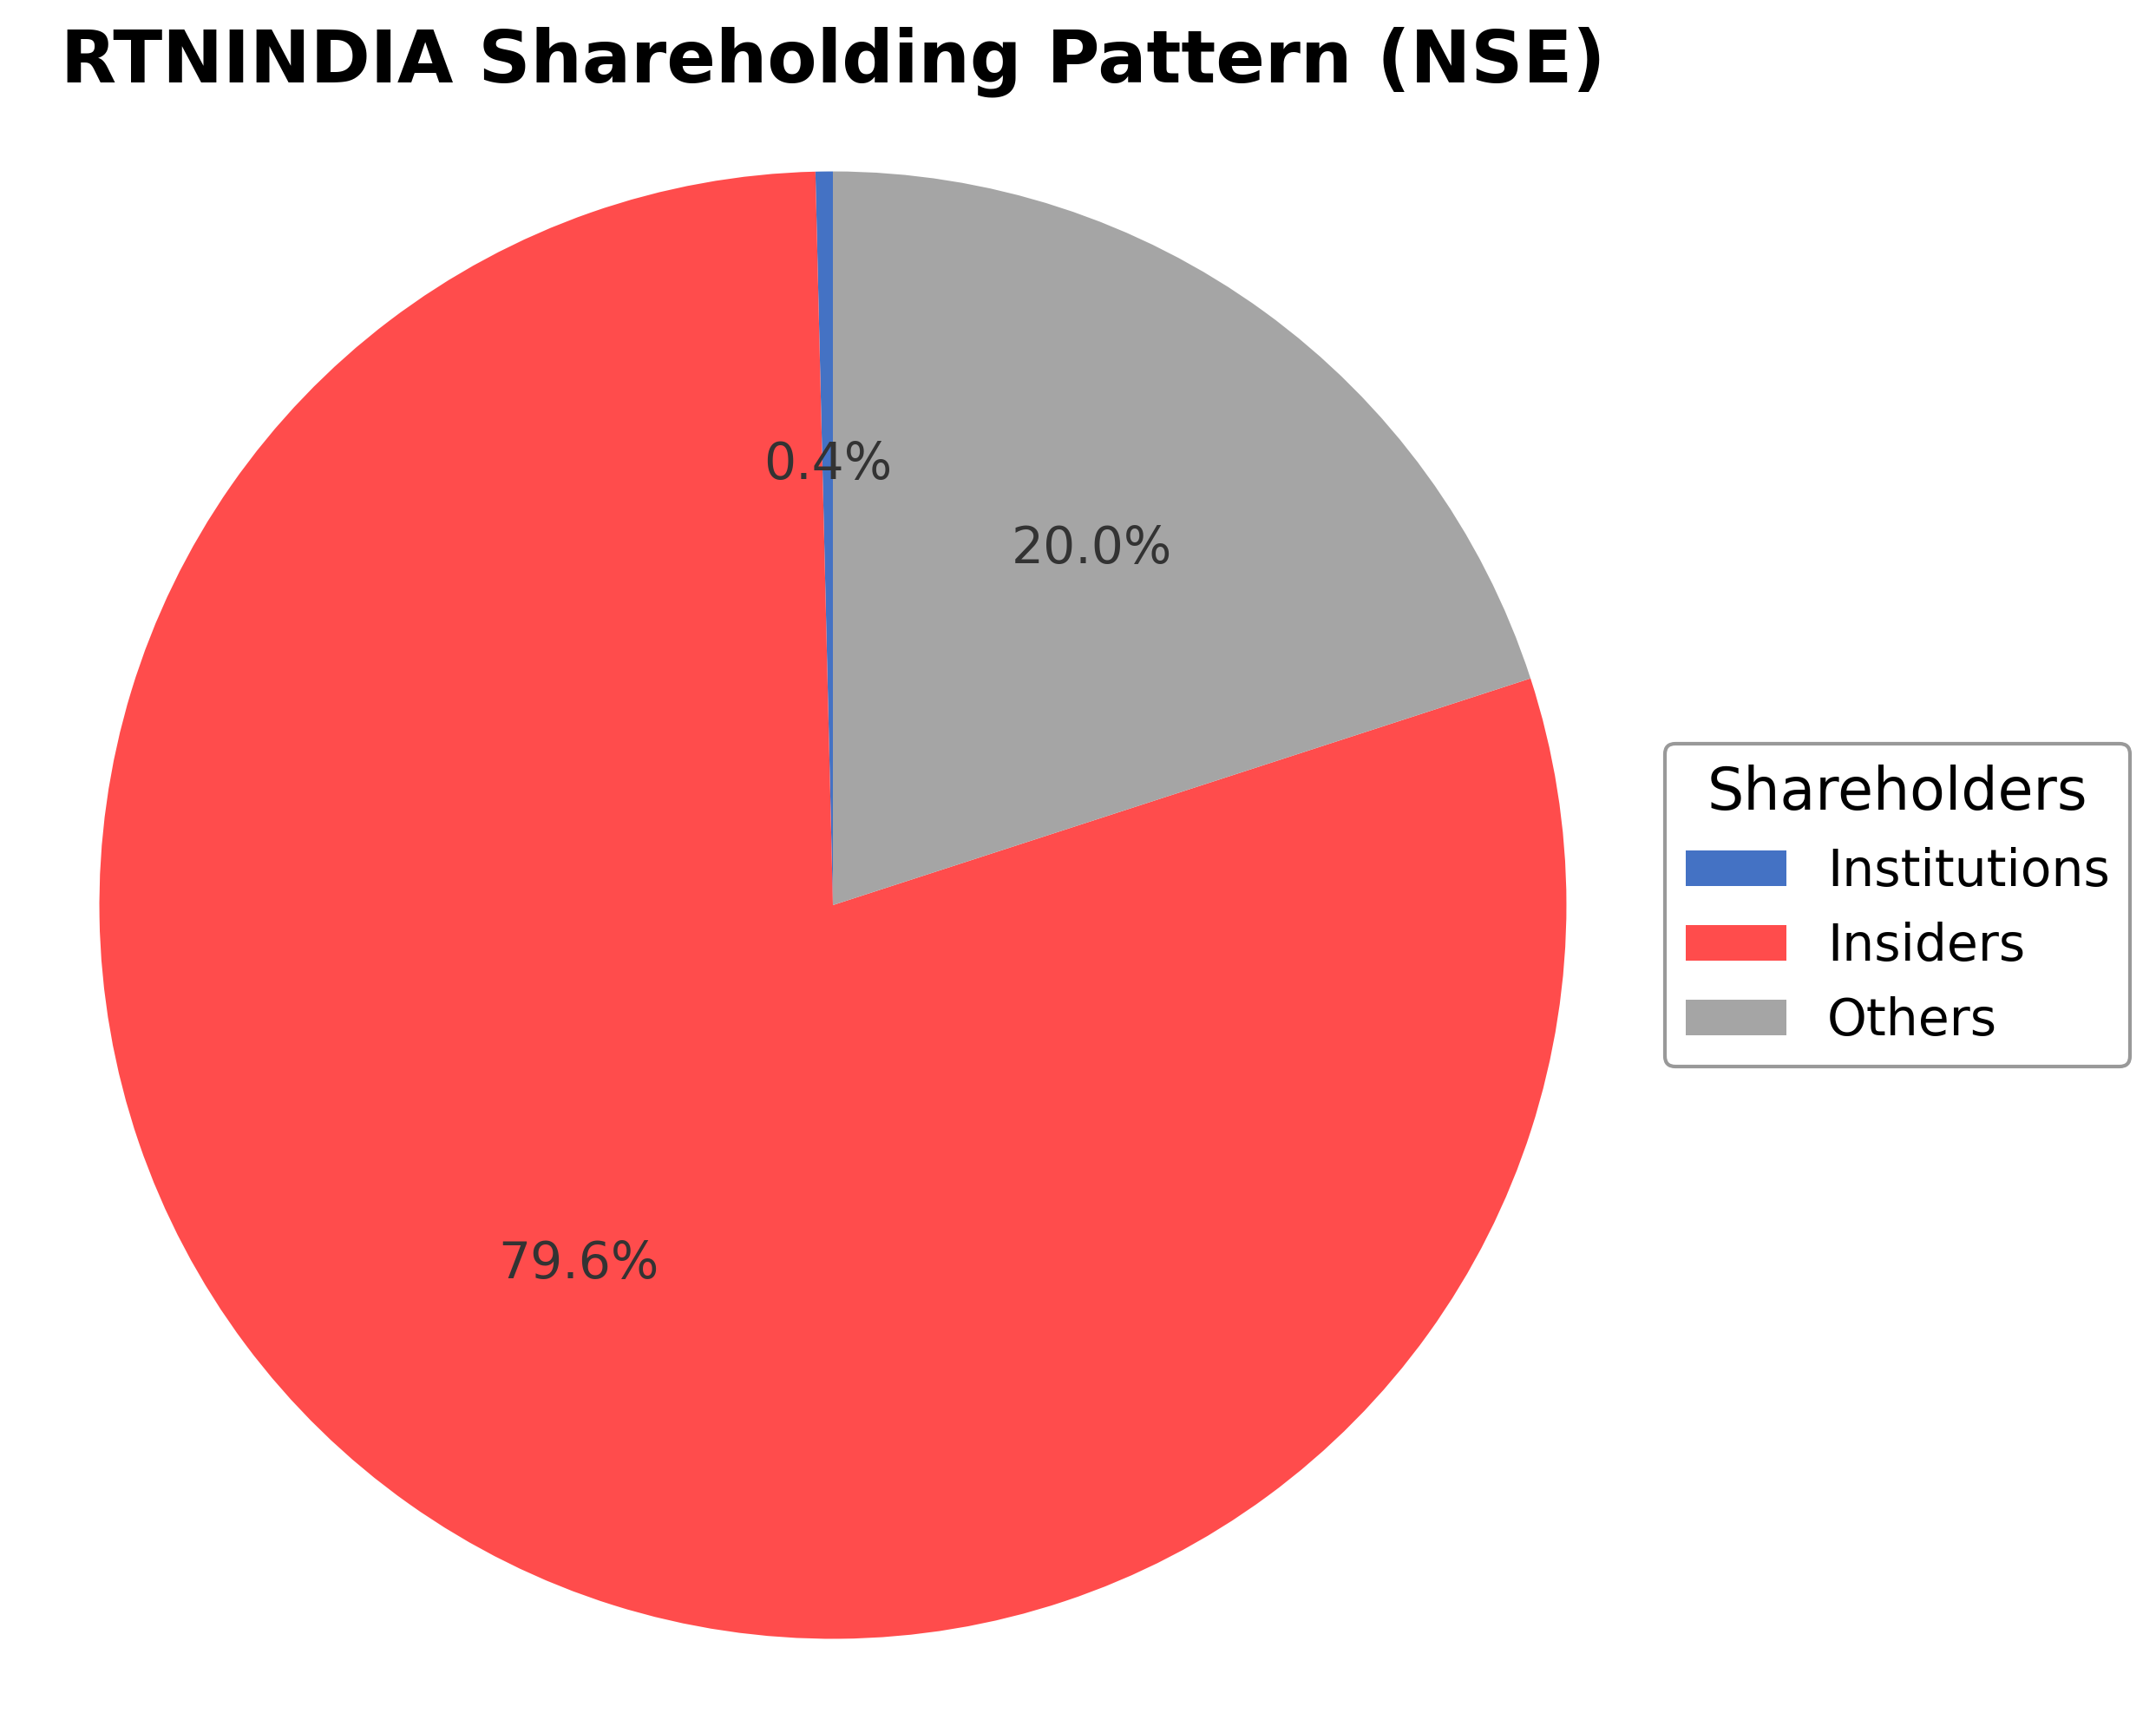
RattanIndia Enterprises Ltd. exhibits a dominant insider ownership structure with promoters holding approximately 79.62% of shares, reflecting strong control by executives and board members. Institutional investors maintain a minimal stake at 0.38%, indicating limited external institutional accumulation or distribution in recent periods. The public and other shareholders collectively hold around 20%, comprising retail investors and employee stock plans. There have been no significant shifts in major ownership positions over the past 12 to 24 months. This concentrated promoter ownership suggests a governance model heavily influenced by insiders, potentially facilitating strategic agility but also concentrating decision-making power. The low institutional presence may impact liquidity and external oversight, while the ownership pattern aligns with the company’s strategic focus on renewable energy and digital ventures within the Indian market.
Sector and Industry Analysis
RattanIndia Enterprises Ltd. operates within the Indian financial services sector, which encompasses banking, non-banking financial companies (NBFCs), and investment services. This sector has witnessed robust growth driven by increasing financial inclusion, digital adoption, and rising demand for credit and investment products. Major players include HDFC Bank, ICICI Bank, Bajaj Finance, and other diversified NBFCs that dominate lending and asset management segments.
The industry is experiencing significant shifts with digital transformation accelerating customer acquisition and service delivery. Competitive dynamics are shaped by technology integration, product innovation, and consolidation trends. Barriers to entry remain high due to capital requirements, regulatory compliance, and the need for strong risk management frameworks, which favor established entities with extensive distribution networks and brand recognition.
Regulatory oversight in the financial services sector is stringent, governed by the Reserve Bank of India (RBI) and Securities and Exchange Board of India (SEBI). Recent regulations focus on strengthening risk controls, enhancing transparency, and promoting responsible lending practices. Ongoing reforms aim to balance growth with financial stability, impacting capital adequacy norms, lending guidelines, and disclosure requirements for companies like RattanIndia Enterprises.
Note: Analysis synthesized from industry research, market reports, and regulatory filings. Information is subject to change based on market conditions.
Financial Ratios Dashboard
Illustrative Scenario Analysis
DCF Assumptions:
Method: Two-Stage EPS-Priority Model
Financials
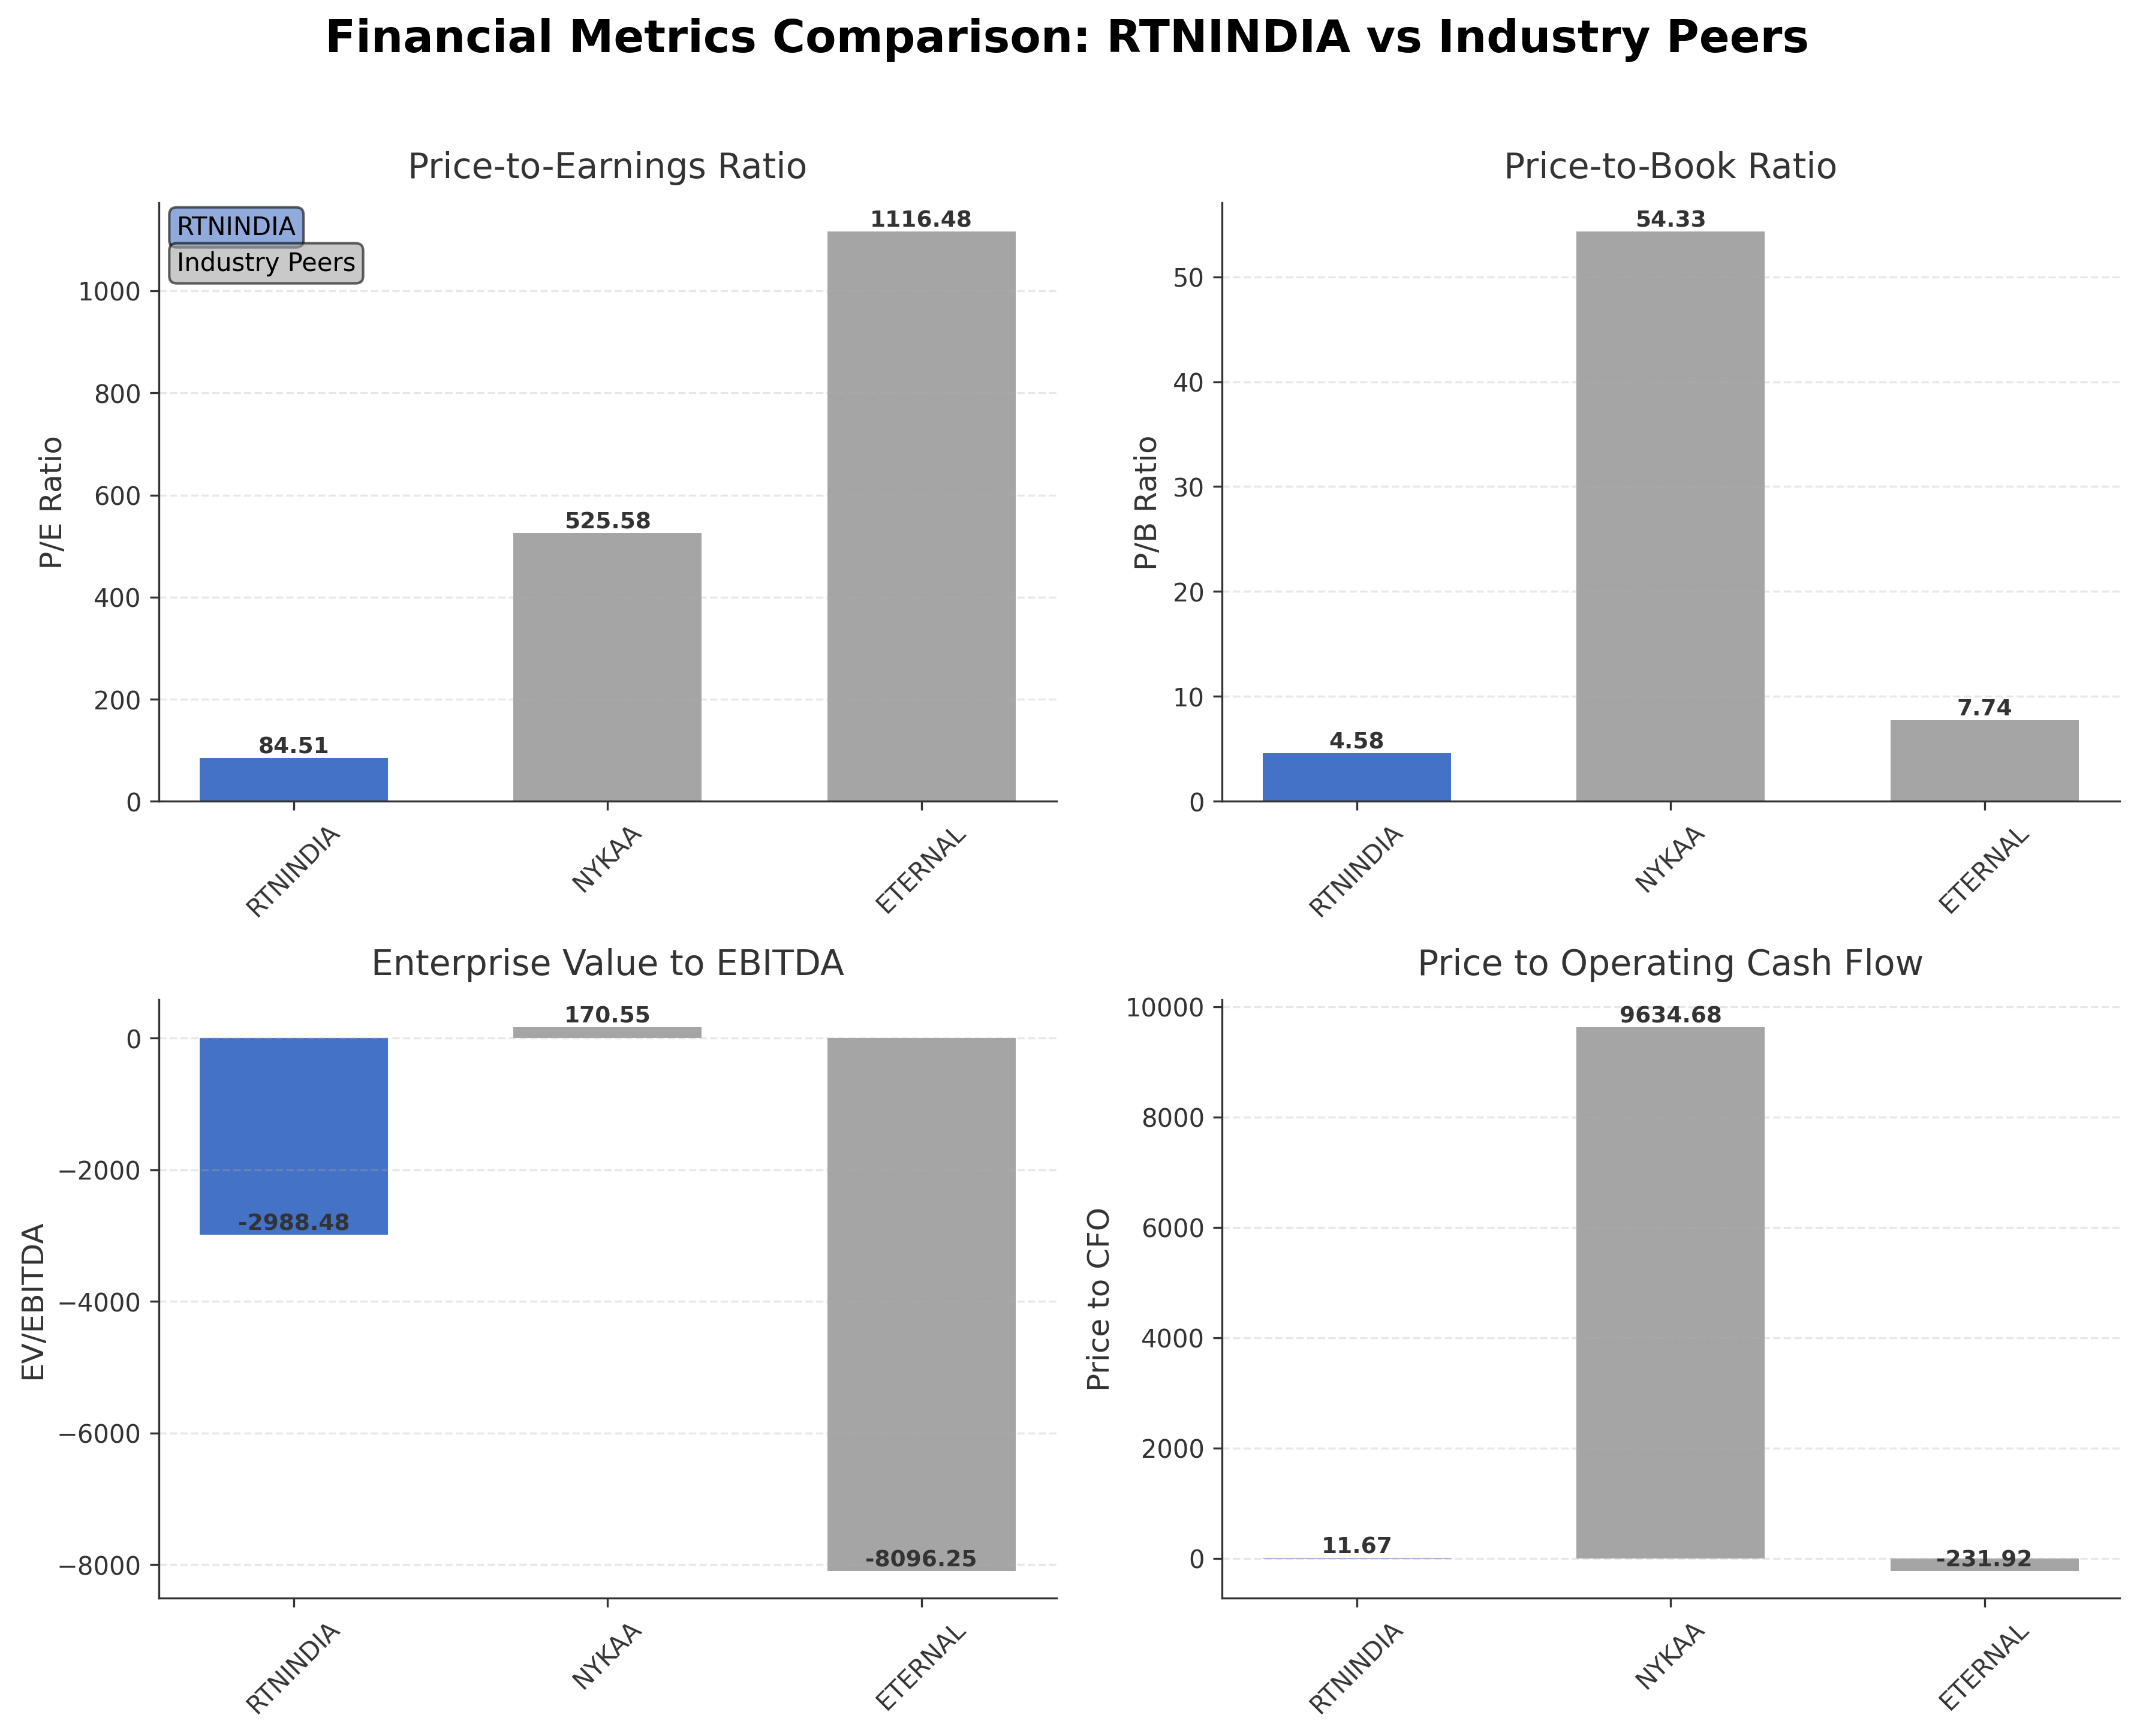
Peer Analysis
| Company Name | Market Cap | P/E Ratio | P/B Ratio | EV/EBITDA | Price to CFO |
|---|---|---|---|---|---|
| RattanIndia Enterprises Ltd. | ₹47.30B | 84.51 | 4.58 | -2988.48 | 11.67 |
| Fsn E-Commerce Ventures Ltd. | ₹752.47B | 525.58 | 54.33 | 170.55 | 9634.68 |
| Eternal Limited | ₹2.36T | 1116.48 | 7.74 | -8096.25 | -231.92 |
Comparison Analysis: RattanIndia Enterprises Ltd. trades at a significantly lower market capitalization compared to its peers Fsn E-Commerce Ventures Ltd. and Eternal Limited, which are valued at ₹752.47 billion and ₹2.36 trillion respectively. Its P/E ratio of 84.51 is substantially lower than the extremely elevated multiples of its peers, suggesting a relatively more moderate earnings valuation. The P/B ratio of 4.58 is also below Nykaa’s 54.33 but higher than Eternal’s 7.74, indicating a mixed valuation perspective. The EV/EBITDA ratio is negative for RattanIndia and Eternal, reflecting EBITDA challenges, while Nykaa maintains a positive ratio. Return on equity for RattanIndia at 0.09% is marginally better than peers, though all show low profitability. Overall, RattanIndia appears more reasonably valued but faces profitability and cash flow challenges relative to its larger, more expensive peers.
Financial Metrics Comparison with Peers
Financial Statements
Comprehensive financial data including income, balance sheet, and cash flow metrics
Income Statement
| fiscal_date | 2025-03-31 | 2024-03-31 | 2023-03-31 | 2022-03-31 | 2021-03-31 |
|---|---|---|---|---|---|
| Sales | 65.86B | 55.27B | 40.63B | 139.93M | 1.00M |
| Cost Of Goods | 54.21B | 46.83B | 34.39B | 90.71M | 0.00 |
| Gross Profit | 11.65B | 8.45B | 6.23B | 49.22M | 1.00M |
| Operating Expense Selling General And Administrative | 722.96M | 653.82M | 551.51M | 34.63M | 3.22M |
| Operating Expense Other Operating Expenses | 396.65M | 6.81B | 5.01B | 34.26M | 4.37M |
| Operating Income | 9.89B | 402.23M | 432.28M | -97.58M | -16.76M |
| Non Operating Interest Income | 84.50M | 107.99M | 31.90M | 1.79M | 4.36M |
| Non Operating Interest Expense | 873.30M | 1.07B | 469.18M | 18.22M | 1.00K |
| Pretax Income | 1.52B | 4.53B | -2.73B | 5.54B | 70.00K |
| Income Tax | 711.96M | 280.51M | 127.55M | 2.03M | 0.00 |
| Net Income | 807.15M | 4.24B | -2.86B | 5.54B | 70.00K |
| Eps Basic | 0.61 | 3.09 | -2.06 | 4.01 | 0.00 |
| Eps Diluted | 0.61 | 3.09 | -2.06 | 4.01 | 0.00 |
| Basic Shares Outstanding | 1.38B | 1.38B | 1.38B | 1.38B | 1.38B |
| Diluted Shares Outstanding | 1.38B | 1.38B | 1.38B | 1.38B | 1.38B |
| Ebit | 2.39B | 5.60B | -2.26B | 5.56B | 71.00K |
| Ebitda | 917.71M | 587.07M | 288.06M | 5.10B | -12.75M |
| Net Income Continuous Operations | 1.52B | 4.53B | -2.73B | 5.54B | 70.00K |
| Minority Interests | 37.20M | 16.99M | 15.34M | 0.00 | N/A |
| Preferred Stock Dividends | 0.00 | 0.00 | 0.00 | 0.00 | 0.00 |
| Operating Expense Research And Development | N/A | N/A | N/A | 117.00K | 0.00 |
Source: Financial statements and regulatory filings
Balance Sheet
| fiscal_date | 2025-03-31 | 2024-03-31 | 2023-03-31 | 2022-03-31 | 2021-03-31 |
|---|---|---|---|---|---|
| Cash And Cash Equivalents | 300.80M | 662.58M | 321.40M | 18.07M | 428.00K |
| Accounts Receivable | 505.68M | 445.09M | 482.96M | 18.30M | 0.00 |
| Total Assets | 26.36B | 26.92B | 21.92B | 9.08B | 851.90M |
| Total Liabilities | 17.12B | 18.47B | 17.75B | 2.10B | 6.28M |
| Long Term Debt | 413.02M | 233.77M | 303.06M | 345.02M | 0.00 |
| Shareholders Equity | 9.24B | 8.45B | 4.17B | 6.99B | 845.61M |
Source: Financial statements and regulatory filings
Cash Flow Statement
| fiscal_date | 2025-03-31 | 2024-03-31 | 2023-03-31 | 2022-03-31 | 2021-03-31 |
|---|---|---|---|---|---|
| Operating Activities Net Income | 1.52B | 4.53B | -2.73B | 5.54B | 70.00K |
| Operating Activities Stock Based Compensation | -25.38M | 29.97M | 0.00 | N/A | N/A |
| Operating Activities Other Non Cash Items | 850.30M | 1.03B | 460.72M | 16.52M | -4.23M |
| Operating Activities Accounts Receivable | -71.58M | -38.82M | -453.60M | -16.75M | 0.00 |
| Operating Activities Other Assets Liabilities | 1.78B | 734.01M | -12.11B | -481.95M | 687.32M |
| Operating Activities Operating Cash Flow | 4.05B | 6.28B | -14.83B | 5.06B | 683.16M |
| Investing Activities Capital Expenditures | -20.95M | -22.81M | -70.62M | -6.15M | 0.00 |
| Investing Activities Net Intangibles | -69.53M | -25.37M | -59.50M | 0.00 | N/A |
| Investing Activities Net Acquisitions | -100.00K | -1.10M | -769.99M | -999.56M | 0.00 |
| Investing Activities Investing Cash Flow | -21.05M | -314.00M | -202.66M | -1.02B | -676.06M |
| Financing Activities Other Financing Charges | -1.08B | N/A | N/A | N/A | N/A |
| Financing Activities Financing Cash Flow | -1.08B | 1.92B | 7.84B | 1.19B | 0.00 |
| End Cash Position | 300.80M | 662.58M | 321.40M | 18.07M | 428.00K |
| Free Cash Flow | 2.97B | -416.04M | -6.91B | -141.29M | 670.90M |
| Investing Activities Purchase Of Investments | N/A | -302.47M | -1.01B | -710.43M | -830.66M |
| Investing Activities Sale Of Investments | N/A | 12.38M | 1.65B | 693.97M | 154.60M |
| Financing Activities Long Term Debt Issuance | N/A | 376.42M | 2.35B | 1.19B | 0.00 |
| Financing Activities Long Term Debt Payments | N/A | 0.00 | -22.42M | 0.00 | N/A |
| Financing Activities Short Term Debt Issuance | N/A | 1.55B | 5.61B | N/A | N/A |
| Financing Activities Common Stock Issuance | N/A | 0.00 | -48.99M | 0.00 | N/A |
| Financing Activities Common Stock Repurchase | N/A | N/A | -48.99M | 0.00 | N/A |
Source: Financial statements and regulatory filings
Technical Analysis
Key Insights
- The current trend shows consolidation with price trading between the 50-day moving average (INR 29.69) and below the 200-day moving average (INR 43.23), indicating mixed momentum.
- Key support levels are near INR 24.40 (52-week low) and INR 29.00, while resistance is observed around INR 43.00 and the recent high of INR 69.70.
- The stock price is above the 50-day moving average but below the 200-day moving average, suggesting intermediate-term support but longer-term resistance.
- Momentum indicators such as RSI and MACD show moderate positive momentum with no extreme overbought or oversold conditions currently.
- Multi-timeframe analysis reveals daily and weekly charts showing sideways movement, while monthly trends indicate a longer-term downtrend from the 52-week high.
- Potential market scenarios include a range-bound movement with possible upward momentum if the price breaks above the 200-day moving average, or further downside if support near INR 24.40 fails.
Trending News
1. Headline: RattanIndia Enterprises Q4 Results 2026: Date, Revenue, PAT and Analyst Outlook
Summary: RattanIndia Enterprises Q4 FY26 results scheduled for May 2026 (Expected). Check revenue estimates, PAT forecast, analyst ratings, and key factors driving the Diversified EV Fintech company's Q4 FY26 performance. April 2026.
Sentiment: neutral
2. Headline: RattanIndia Power Ltd Sees Exceptional Volume Surge Amid Strong Sell Rating
Summary: RattanIndia Power Ltd (RTNPOWER) emerged as one of the most actively traded stocks on 27 Apr 2026, registering a remarkable volume surge that outpaced its sector and benchmark indices. Despite a strong intraday price rally of 7.28%, the stock remains under a cautious outlook with a recent downgrade ...
Sentiment: positive
3. Headline: RattanIndia Power Ltd Surges 7.7% to Day's High — Outperforms Sector by 4.68 Percentage Points
Summary: The Sensex advanced 0.83% on 27 Apr 2026, yet RattanIndia Power Ltd outpaced the broader market with a robust 7.7% gain, outperforming its sector by 4.68 percentage points. This sharp intraday rally stands out as a significant stock-specific event amid a generally positive market backdrop.
Sentiment: positive
4. Headline: SBI, Tata Consumer, BEL Ratnamani Metals: Stocks to buy — price target, stop loss & more - BusinessToday
Summary: Bajaj Broking said that Bharat Electronics is in structural up trend forming higher high and higher low in all time frame signaling strength and continuation of the uptrend.
Sentiment: positive
5. Headline: RattanIndia Power Ltd Falls 3.07%: 3 Key Factors Driving the Weekly Decline
Summary: RattanIndia Power Ltd closed the week ending 24 April 2026 at Rs.9.48, down 3.07% from the previous Friday’s close of Rs.9.78. This underperformance contrasted with the Sensex’s more modest 1.31% decline over the same period, reflecting a challenging week marked by volatile price swings, ...
Sentiment: negative
Recent Updates
News Summary
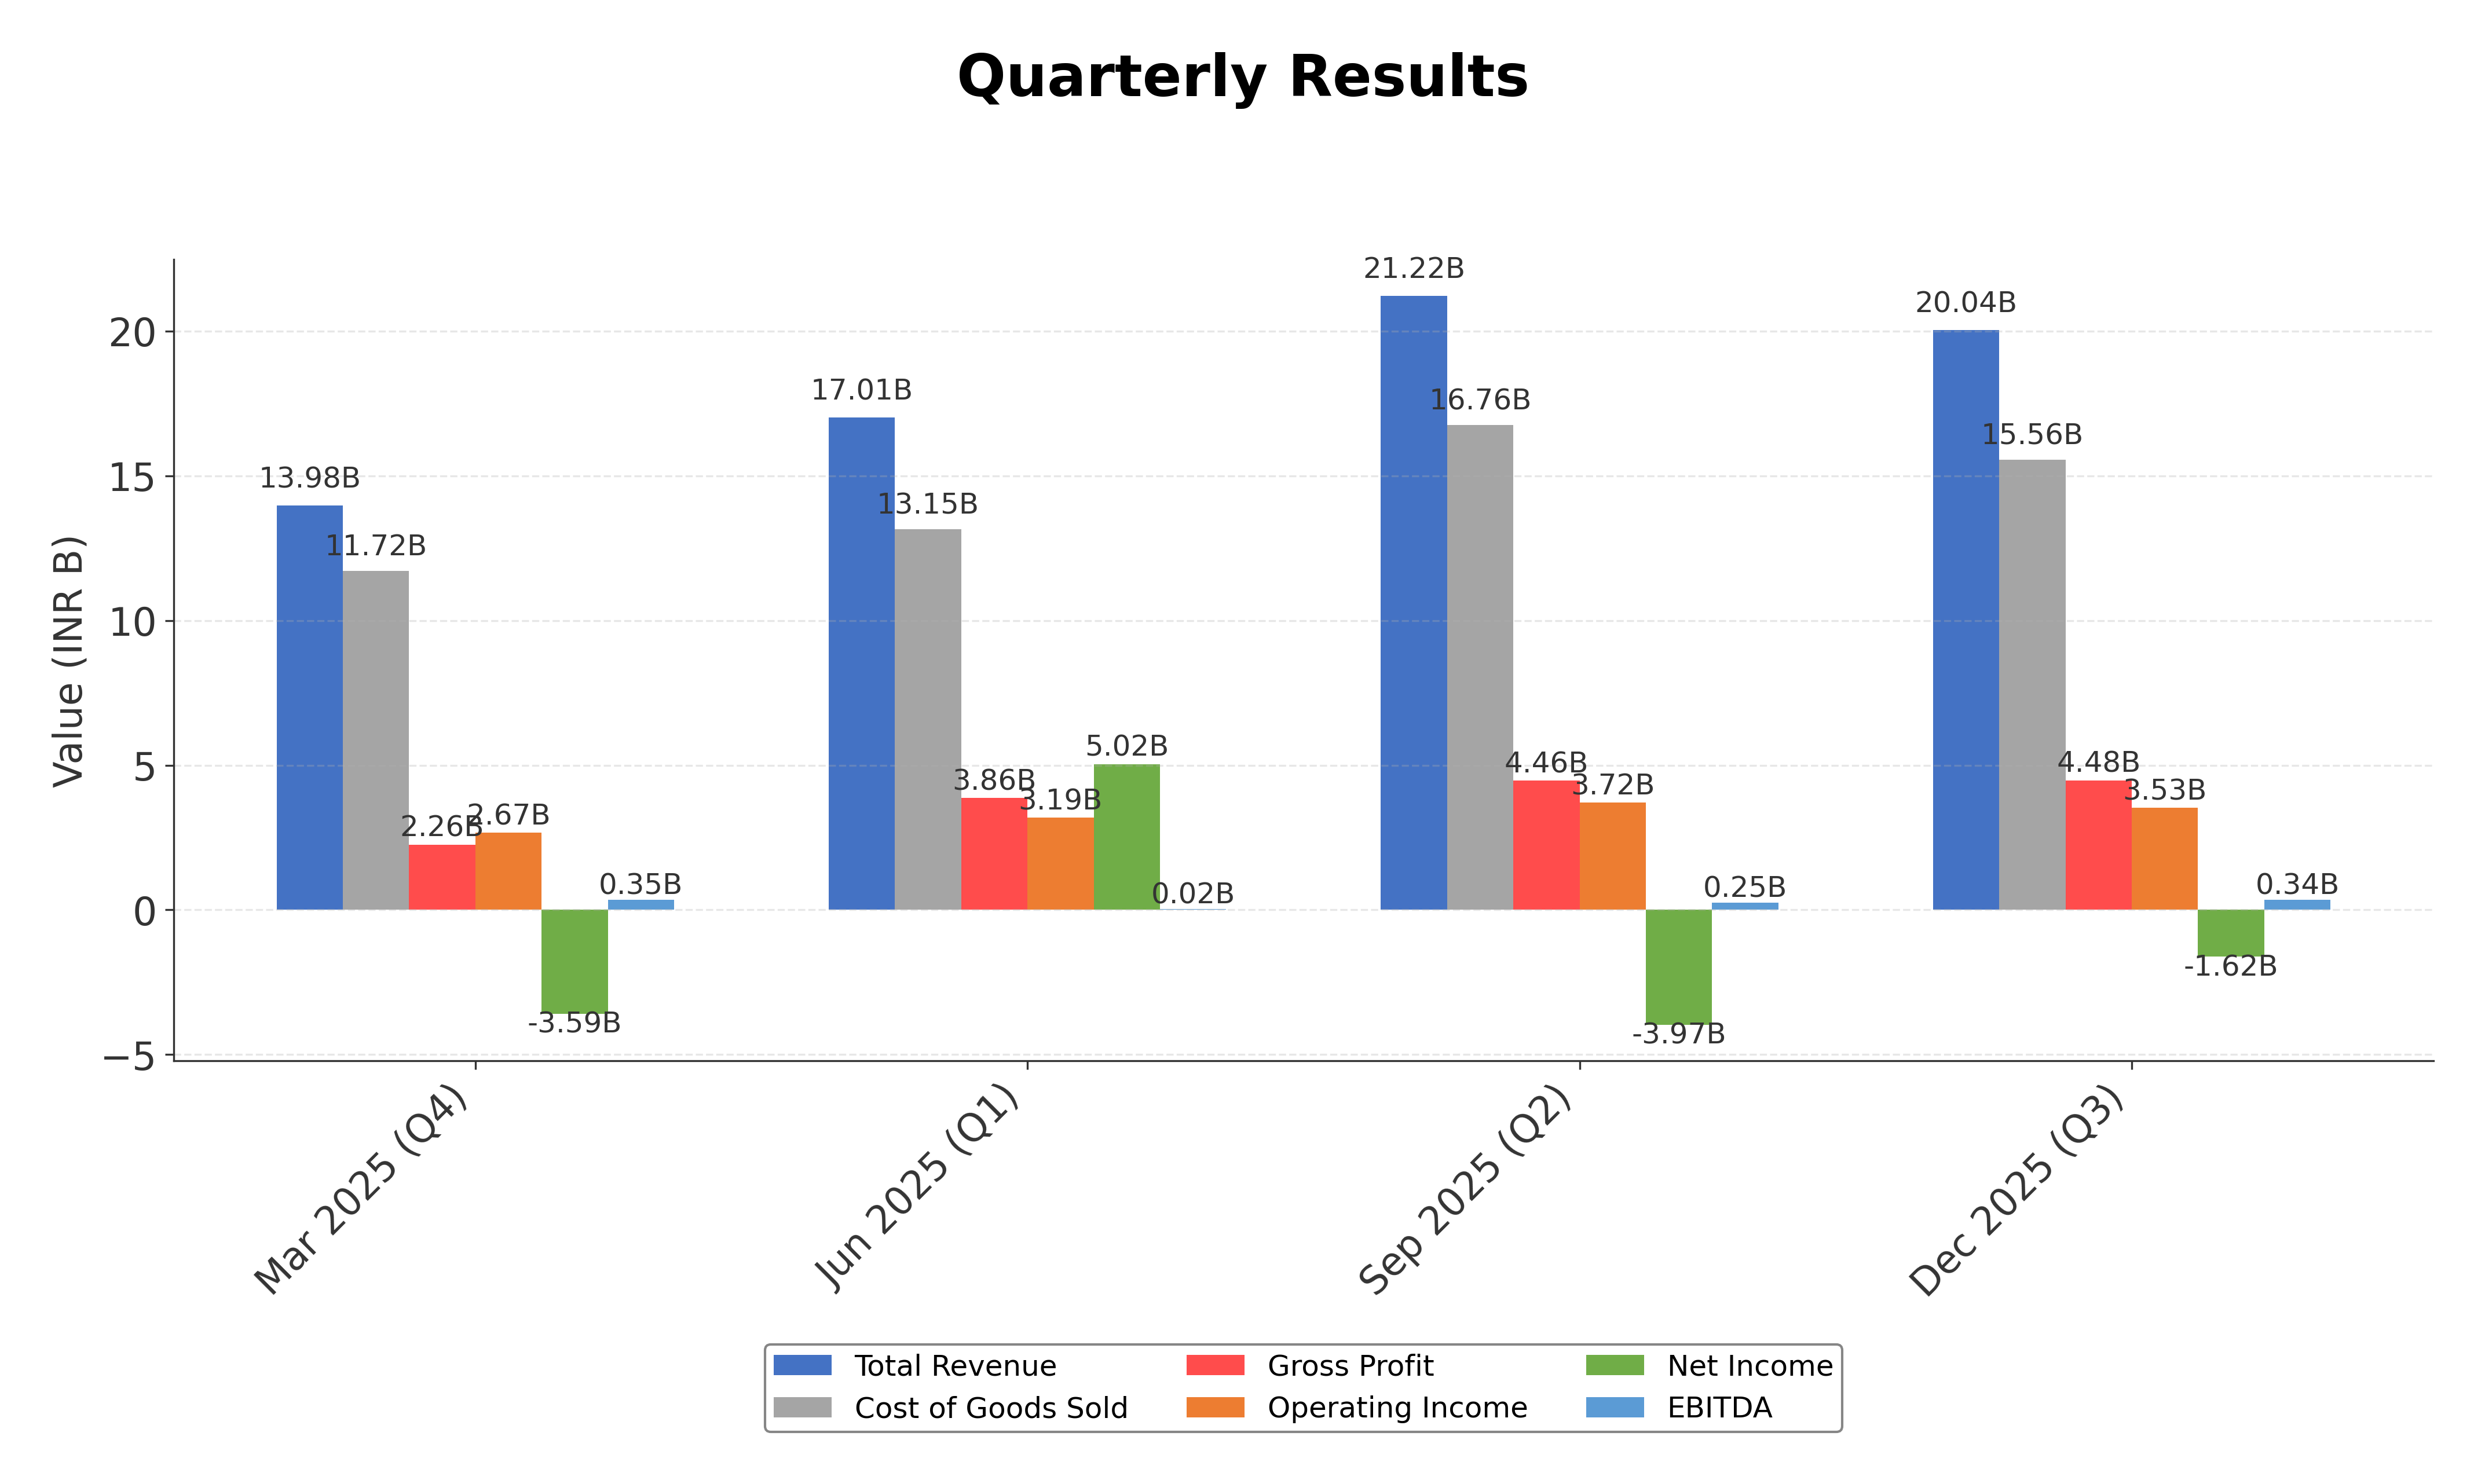
As of November 11, 2025. Recent updates for RattanIndia Enterprises Ltd. highlight scheduled board meetings to approve unaudited financial results for the quarter ending December 31, 2025, reflecting ongoing corporate governance activities. The company’s financial disclosures indicate steady revenue growth with quarterly sales reaching approximately INR 2,006 crore in December 2025, showing a 4.4% increase in quarterly revenue. The annual report and financial statements underscore the company’s focus on expanding its tech-focused new age businesses including e-commerce and electric vehicles through subsidiaries like Cocoblu. These developments demonstrate continued strategic diversification and operational progress within its core sectors. No significant changes in dividend policy or capital structure were reported during this period.
News Sentiment
The overall sentiment from recent updates is cautiously positive, driven by steady revenue growth, active corporate governance, and strategic expansion into emerging business segments. Financial disclosures and annual reports reflect operational progress despite ongoing challenges in profitability. Neutral tones in corporate filings and earnings previews balance the positive momentum from business diversification and technical improvements. The absence of dividend payouts and persistent net losses temper enthusiasm, suggesting a measured outlook grounded in fundamental developments.
Source List
- https://rattanindia.com/ril/financials/
- https://trendlyne.com/latest-news/all/578/RTNINDIA/rattanindia-enterprises-ltd/
- https://trendlyne.com/fundamentals/quarterly-results/578/RTNINDIA/rattanindia-enterprises-ltd/
- https://www.screener.in/company/RTNINDIA/consolidated/
- https://trendlyne.com/latest-news/BSE-Announcements/578/RTNINDIA/rattanindia-enterprises-ltd/
Analytical Overview
Analysis Summary
RattanIndia Enterprises Ltd. exhibits a trailing P/E ratio of 84.51, which is in line with the industry average but indicates a high valuation relative to earnings. The absence of a forward P/E ratio limits forward-looking valuation assessment. Revenue growth is modest at 4.4% quarterly, supported by positive operating cash flow of INR 4.05 billion, indicating a stable growth trajectory. The company’s financial health shows a high debt-to-equity ratio of 107.3%, suggesting leverage risks, although cash reserves of INR 13.29 billion provide liquidity support. Sector-specific challenges include competitive pressures in internet retail and renewable energy, while opportunities arise from government policies favoring green energy and digital innovation in India.
Overall Business and Market Assessment
Supporting Factors: steady revenue growth, positive operating cash flow, and strategic diversification into e-commerce and renewable energy sectors
Risk Factors: the elevated debt levels, ongoing net losses, and valuation premiums
SWOT Analysis
Strengths
- Strong cash reserves totaling approximately INR 13.29 billion.
- Diversified business model spanning renewable energy and digital sectors.
- Positive operating cash flow of INR 4.05 billion indicating operational efficiency.
- Significant promoter ownership providing strategic control.
Weaknesses
- High debt-to-equity ratio of 107.3% indicating leverage risk.
- Negative net income with a loss of approximately INR 6.63 billion.
- Low current ratio of 0.70 suggesting liquidity constraints.
- Absence of dividend payouts despite reported profits.
Opportunities
- Growing demand for renewable energy aligned with government policies.
- Expansion potential in e-commerce and FinTech segments.
- Increasing market interest driven by technical momentum improvements.
- Potential for operational scale through strategic partnerships.
Threats
- Regulatory risks in energy and digital sectors.
- Intense competition in internet retail and renewable energy markets.
- Volatility in stock price with significant downside risk.
- Economic uncertainties impacting capital-intensive projects.
Company Description
RattanIndia Enterprises Ltd. is a prominent player in the Indian infrastructure and renewable energy sectors. The company primarily focuses on developing and managing solar power projects, reflecting its commitment to sustainable energy solutions. With a diverse portfolio of projects, RattanIndia Enterprises is instrumental in contributing to India's ambitious renewable energy goals and reducing carbon emissions. Beyond energy, the firm has expanded its reach into new-age digital technologies and FinTech, positioning itself as a multifaceted enterprise influencing various industries. This diversification strategy underscores its role in catalyzing growth across emerging segments in the Indian market. Established with the vision to align with global sustainability trends, RattanIndia Enterprises Ltd. leverages its strategic insights to drive value in both traditional and digital spaces, making it a significant figure in India's economic landscape. The company's initiatives align with governmental policies promoting green energy and technological innovation, reinforcing its relevance in shaping the industry's future.