
Ratnamani Metals & Tubes Ltd (RATNAMANI)
Stock Analysis Report
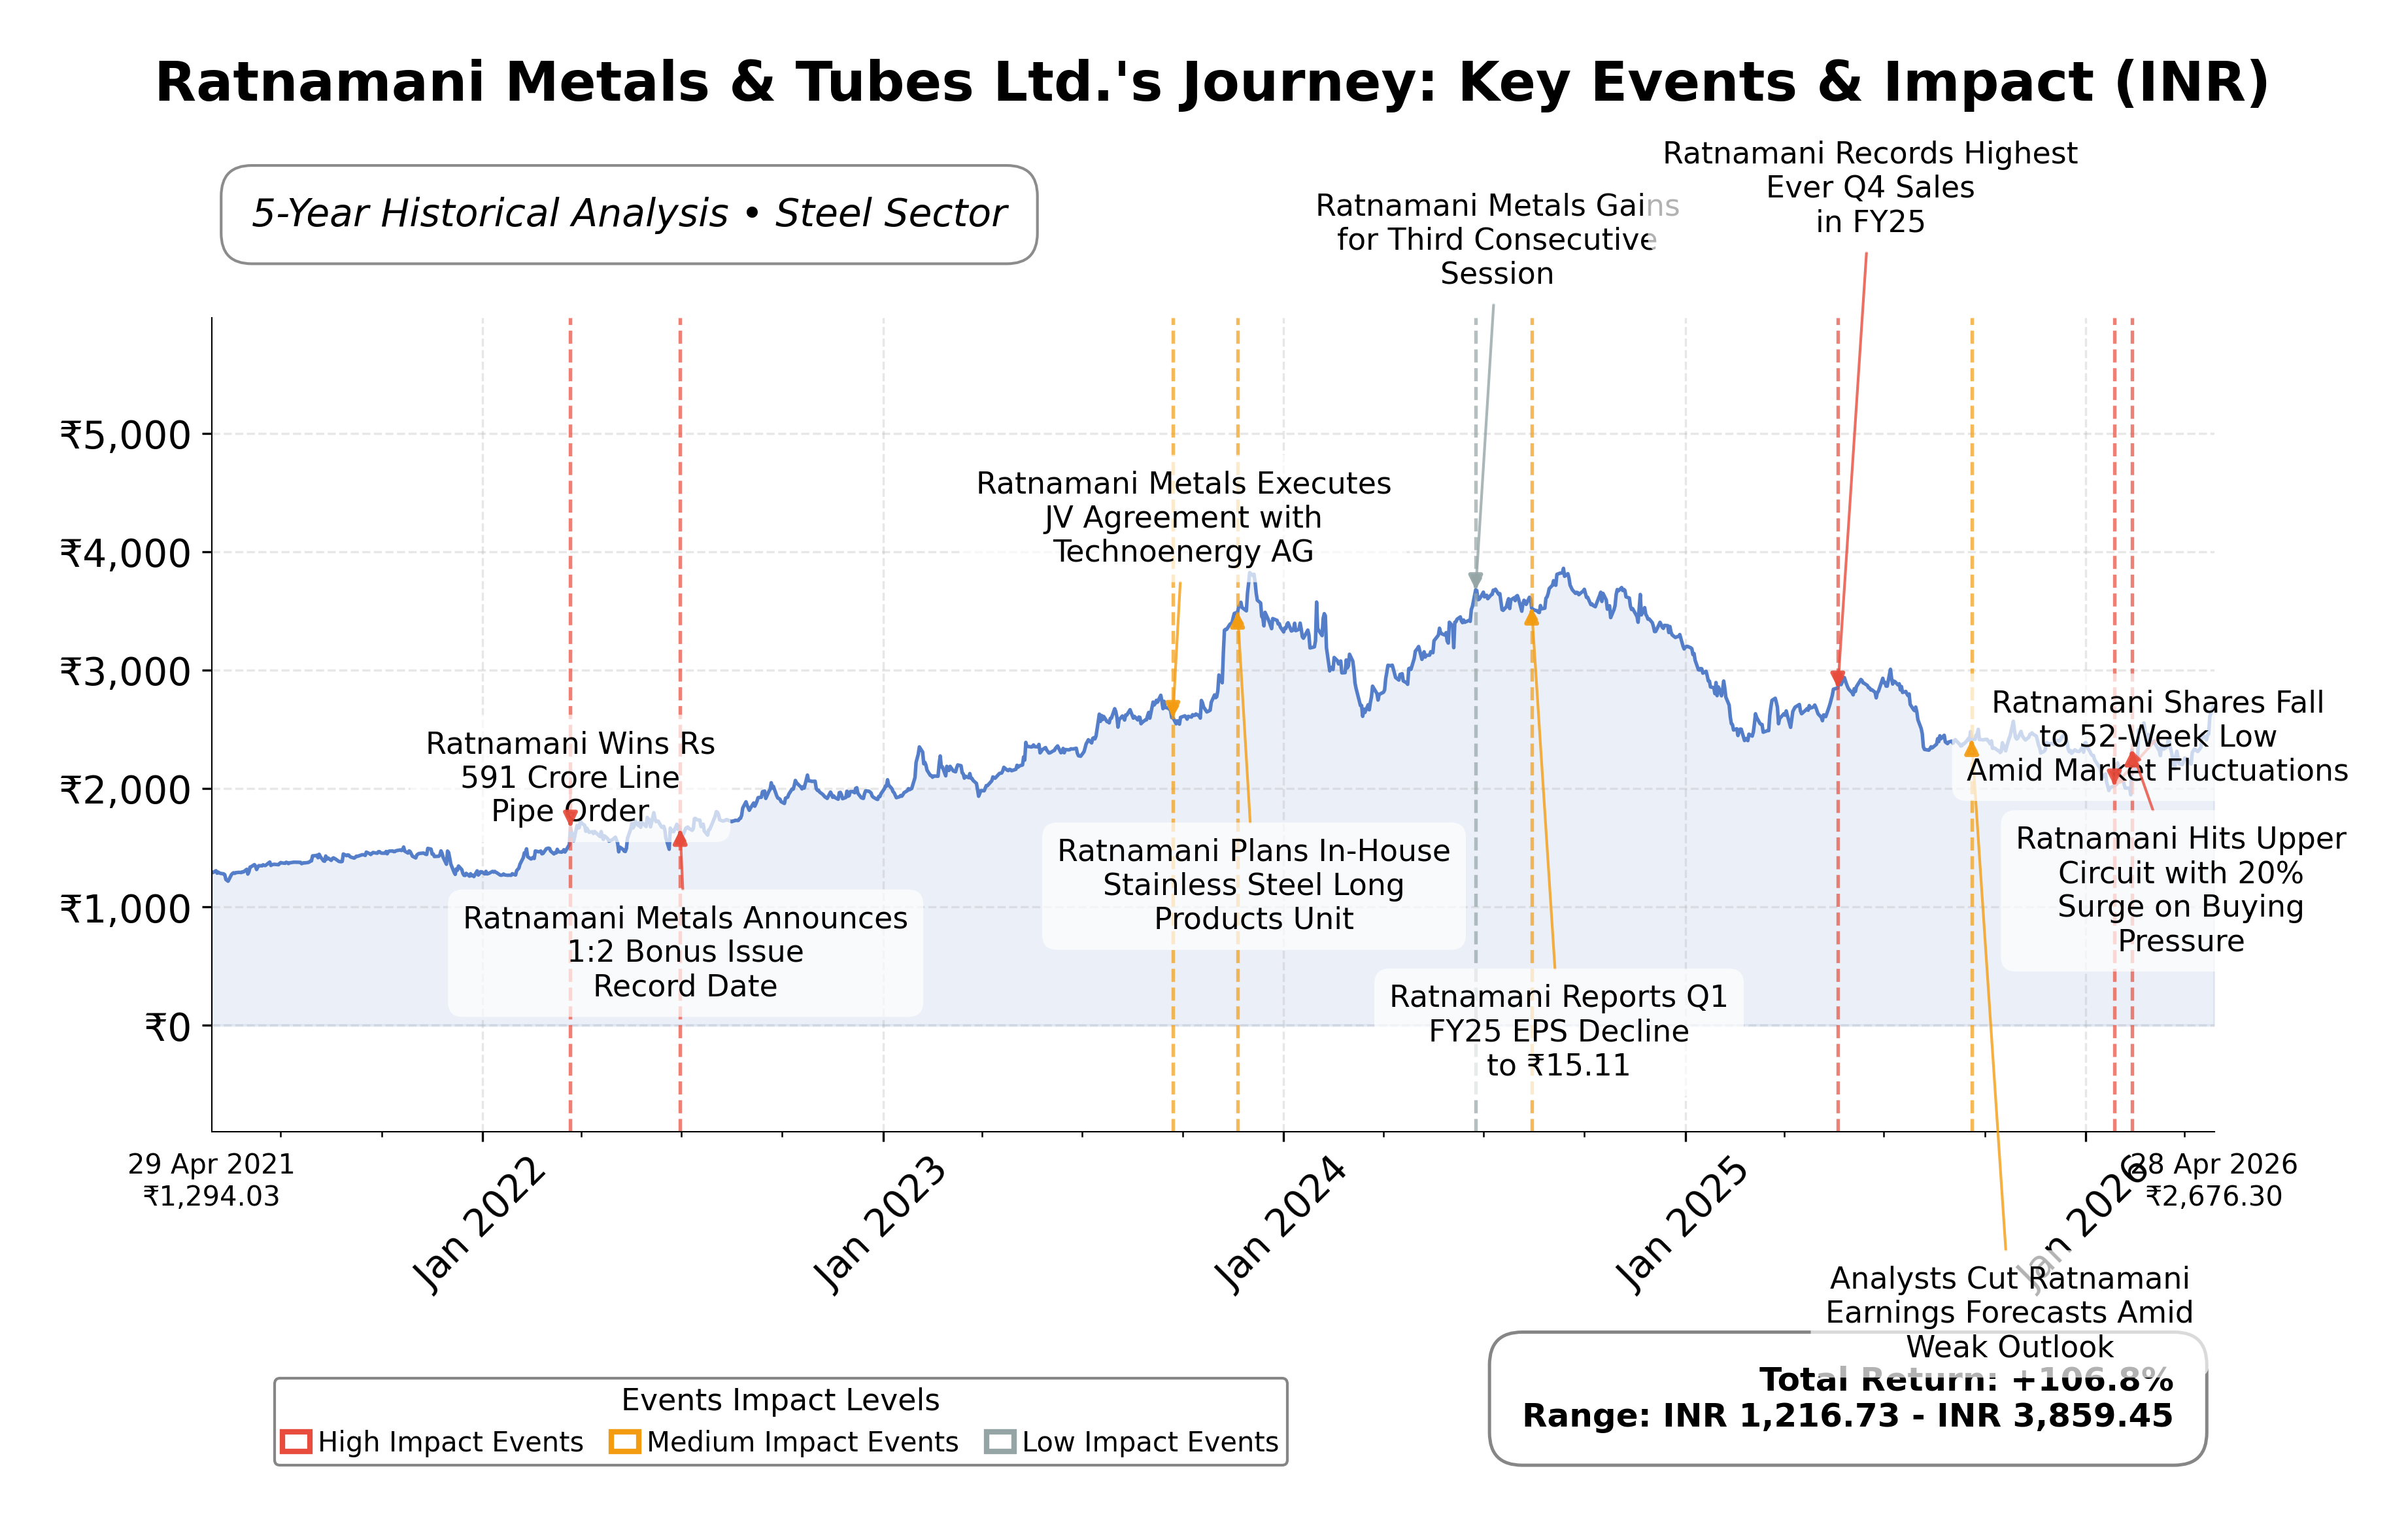
Stock Journey
Key Positives and Key Risks
Pros
- Strong profitability with a gross margin of 43.31% and net profit margin of 11.42%, indicating efficient operations.
- Low debt-to-equity ratio of 0.06 and a high current ratio of 3.66, reflecting solid financial health and liquidity.
- Robust free cash flow of INR 5.44 billion supports operational flexibility and potential for shareholder returns.
Cons
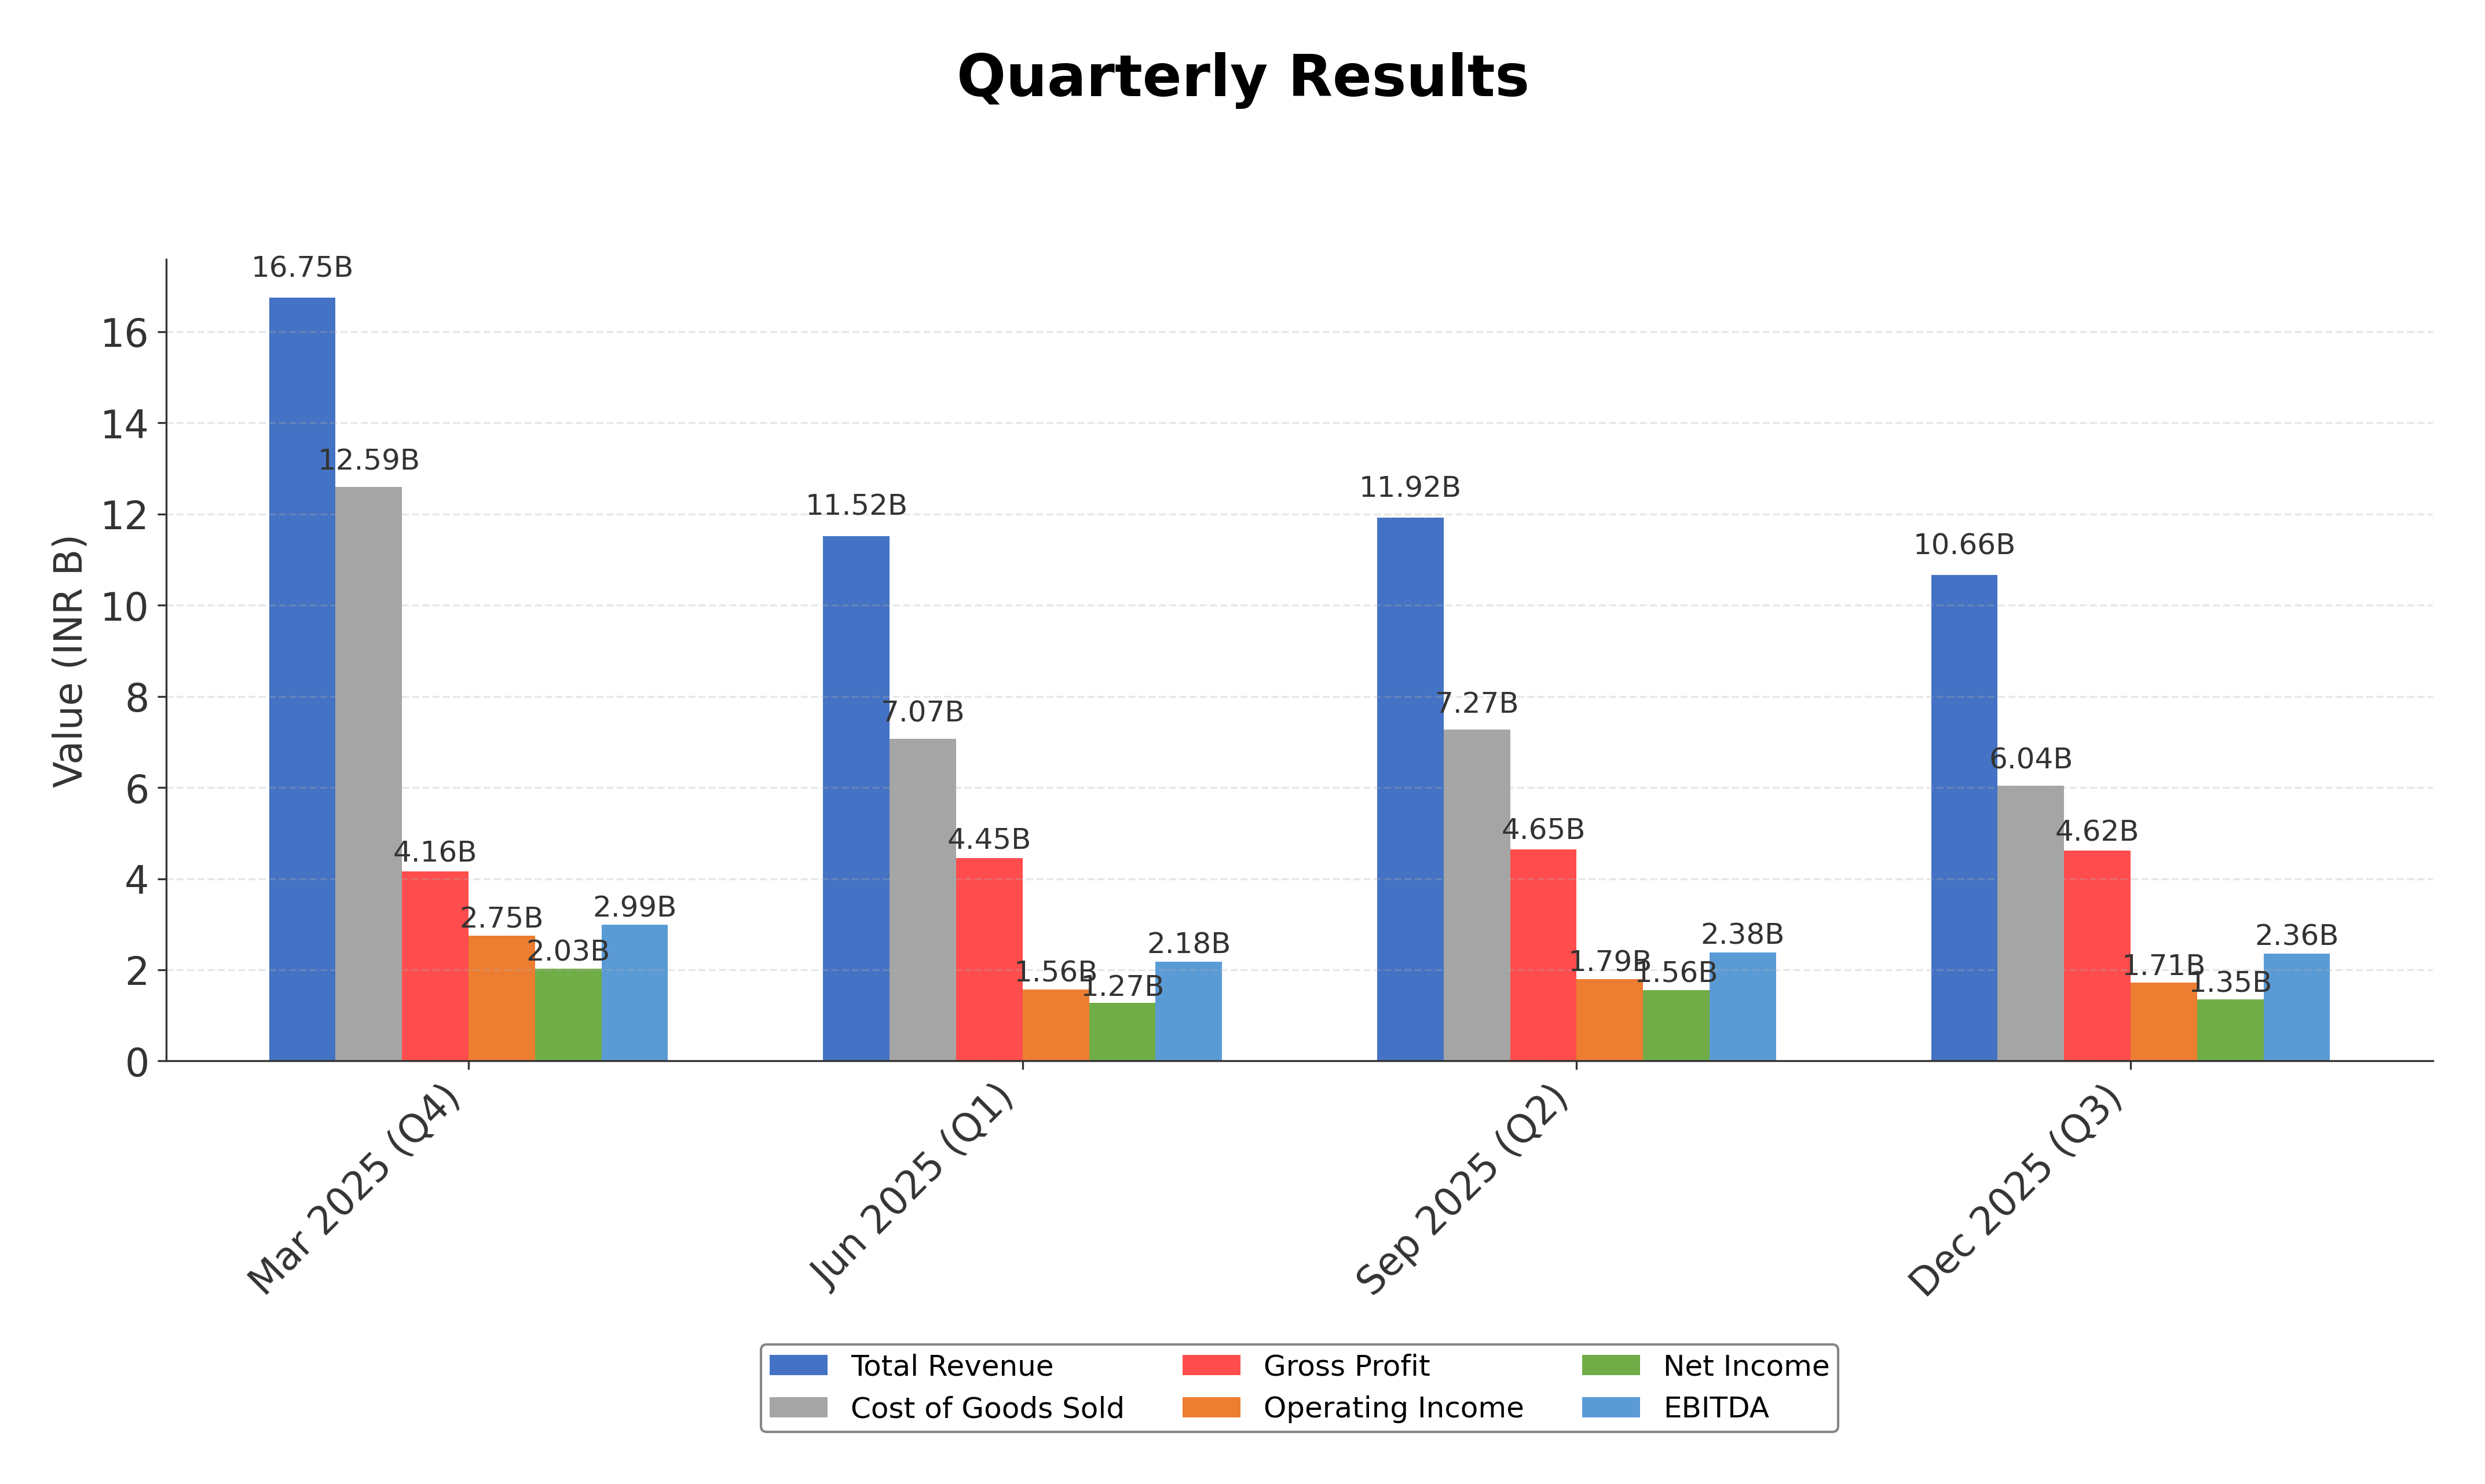
- Recent quarterly revenue decline of 19% signals potential near-term growth challenges.
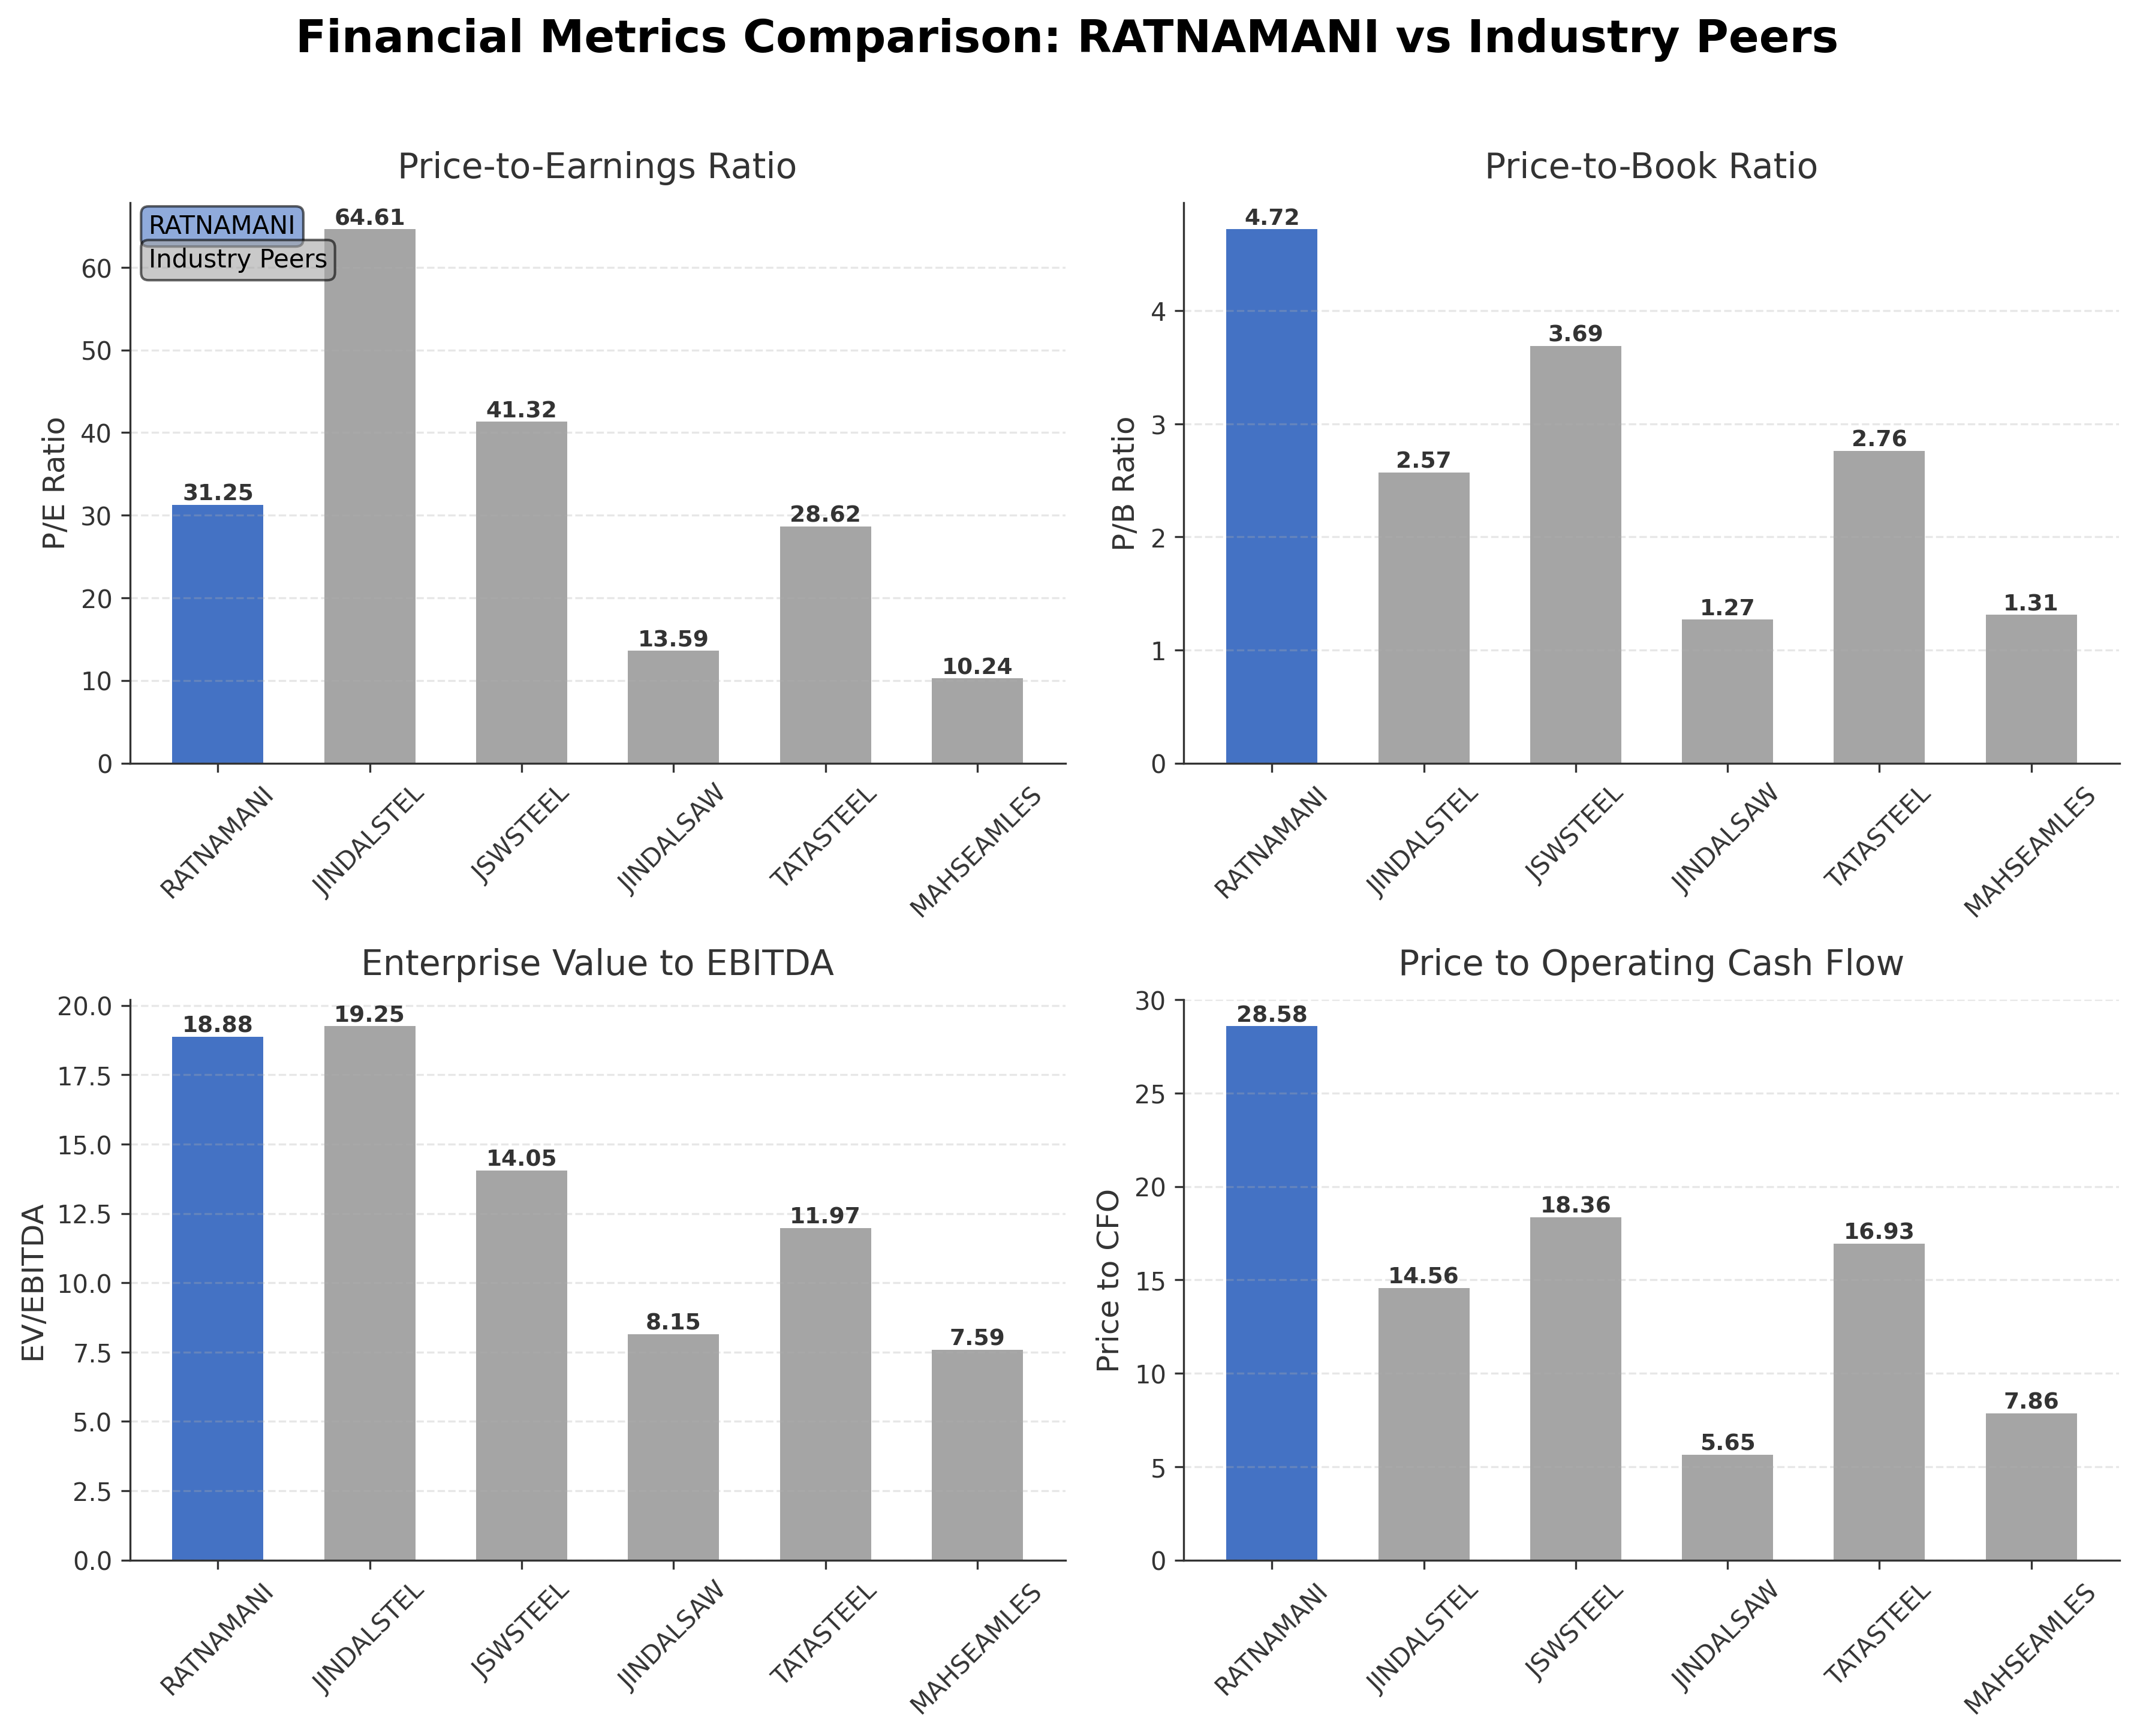
- Premium valuation multiples with a P/E ratio of 31.25 and P/B ratio of 4.72 compared to peers may limit upside.
- Negative PEG ratio (-1.91) suggests inconsistent earnings growth expectations.
Disclosure: This information is for general awareness and does not constitute investment advice
Report Summary
Ratnamani Metals & Tubes Ltd. is a leading manufacturer and distributor of high-quality metal pipes and tubes, specializing in stainless steel and carbon steel products. The company operates primarily in the steel sector within the Basic Materials industry and is listed on the National Stock Exchange of India (NSE). Ratnamani serves diverse sectors including oil and gas, petrochemicals, power, water distribution, and defense, with manufacturing facilities located in Gujarat, India. Its market positioning is strengthened by advanced production capabilities and a commitment to innovation, catering to both domestic and international markets.
Financially, Ratnamani reported trailing twelve months (TTM) revenue of approximately INR 51.24 billion, with a gross margin of 43.31%, operating margin of 16.09%, and a net profit margin of 11.42%. The company demonstrates solid profitability and operational efficiency, reflected in a return on equity (ROE) of 14.84% and return on assets (ROA) of 11.09%. Its return on invested capital (ROIC) is robust at 21.5%, indicating effective capital utilization. Despite a recent quarterly revenue decline of 19%, the company maintains strong cash flows with operating cash flow of INR 6.39 billion and free cash flow of INR 5.44 billion.
Valuation metrics show a trailing price-to-earnings (P/E) ratio of 31.25 and a forward P/E of 28.58, which are in line with the industry average of 31.25. The price-to-book (P/B) ratio stands at 4.72, and the enterprise value to EBITDA (EV/EBITDA) ratio is 18.88, suggesting the stock is priced at a premium relative to some peers. The current market capitalization is approximately INR 182.65 billion, with the stock trading at INR 2,650 within a 52-week range of INR 1,936.50 to INR 3,050. The stock price is closer to the upper end of this range, reflecting recent market confidence.
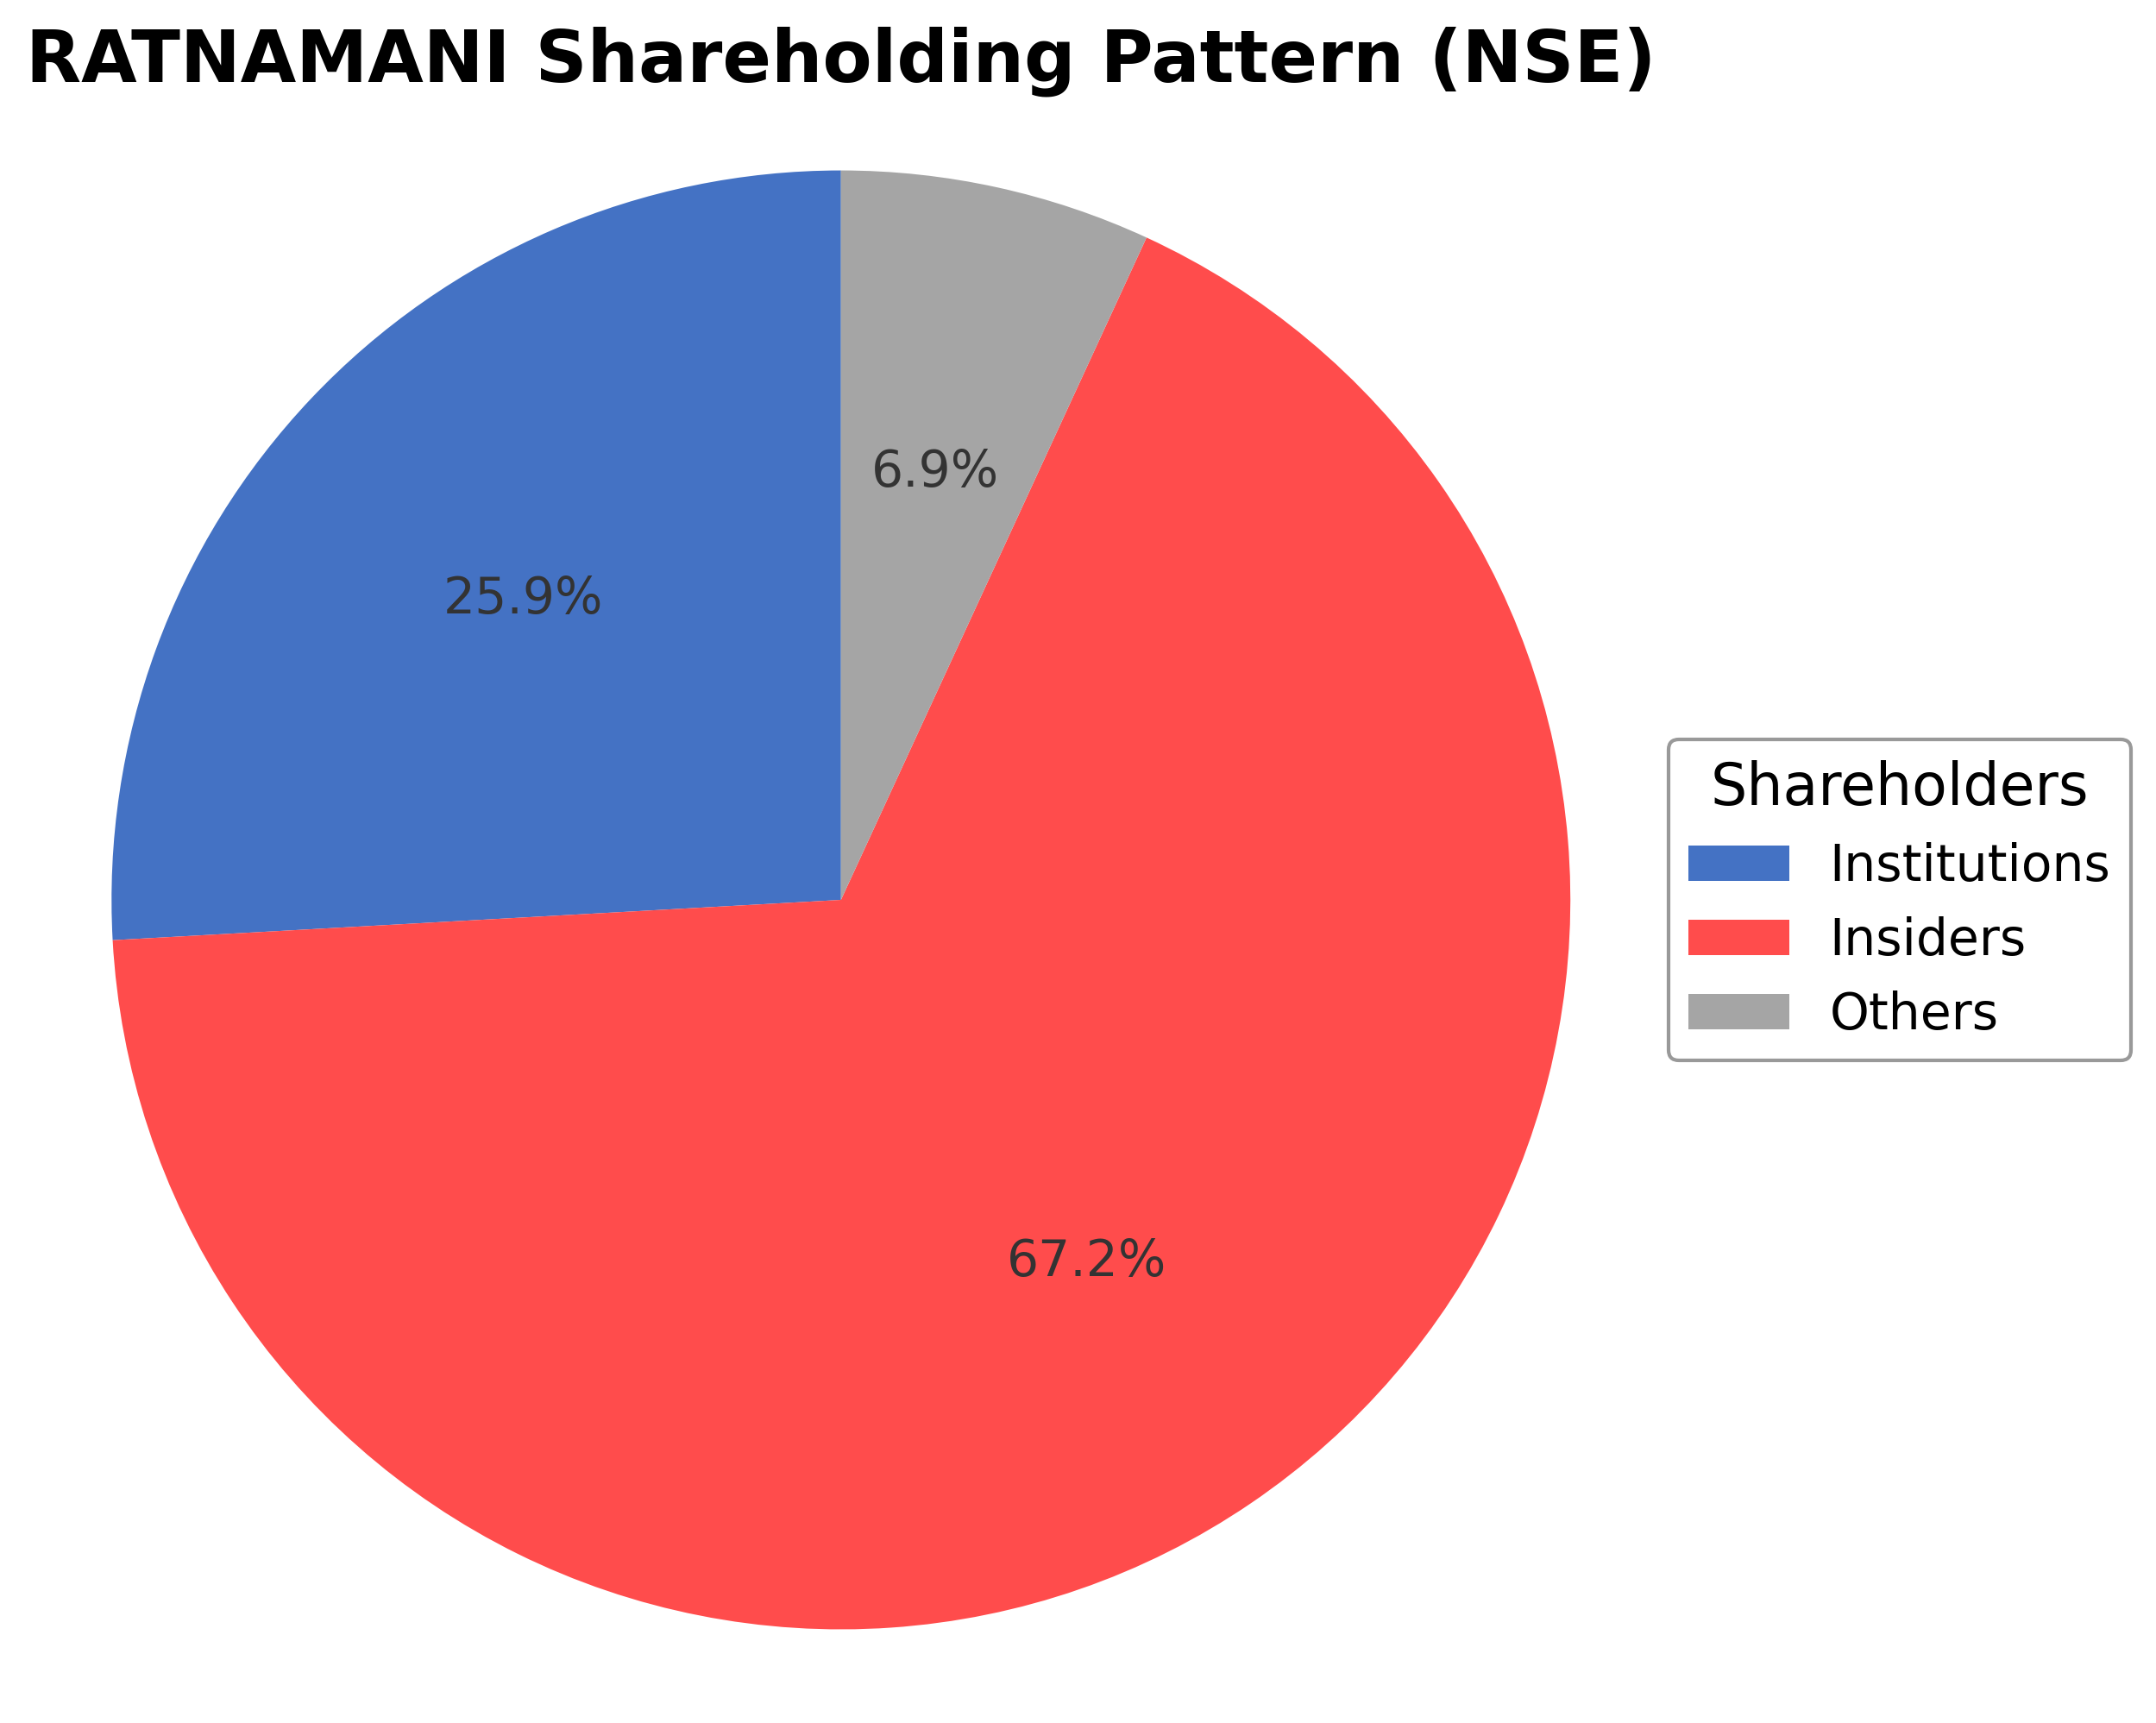
Ratnamani’s strengths include a strong balance sheet with low debt (debt-to-equity ratio of 0.06), a high current ratio of 3.66 indicating liquidity, and consistent free cash flow generation. Key risks involve exposure to cyclical steel industry dynamics, potential regulatory changes, and competitive pressures. Recent strategic actions emphasize operational excellence and customer-centric innovation, supported by stable leadership and adherence to corporate governance policies. The company’s shareholding pattern shows significant insider and institutional ownership, reflecting confidence in governance.
Technically, the stock is trading near its 50-day and 200-day moving averages, with momentum indicators suggesting a neutral to slightly positive trend. Market conditions and geopolitical factors may influence near-term price action. Overall, the data suggests a balanced stance with potential for accumulation under favorable conditions, while monitoring sectoral and macroeconomic developments remains prudent.
Company and Industry Overview
Company Basics
Price Performance
Company Size
Shareholding Pattern
Sector and Industry Analysis
The steel tubes and pipes sector in India is a significant component of the broader steel industry, catering to diverse end markets such as oil and gas, infrastructure, and automotive. The market has witnessed steady growth, driven by increasing industrialization and infrastructure development, with a compounded sales growth of around 12-15% over the past decade for leading players. Major companies in this space include Ratnamani Metals & Tubes Ltd, alongside larger peers with market capitalizations ranging from ₹14,000 crore to over ₹54,000 crore, reflecting a competitive yet expanding market.
Industry trends highlight a focus on high-quality stainless steel and carbon steel pipes, with companies investing in advanced manufacturing capabilities to meet stringent client specifications. The sector faces moderate barriers to entry due to capital intensity, technology requirements, and the need for established distribution networks. Competitive dynamics are shaped by product differentiation, operational efficiency, and the ability to serve specialized sectors like oil and gas, where demand can be volatile but lucrative.
The regulatory environment for steel pipes and tubes manufacturing in India includes adherence to quality standards and environmental norms, impacting operational costs and compliance requirements. Government initiatives promoting infrastructure and energy sectors indirectly support demand for steel pipes, while import duties and trade policies influence competitive positioning against foreign players. Ongoing emphasis on sustainability and emissions reduction is likely to shape future regulatory frameworks, affecting capital expenditure and production processes in the industry.
Note: Analysis synthesized from industry research, market reports, and regulatory filings. Information is subject to change based on market conditions.
Financial Ratios Dashboard
Illustrative Scenario Analysis
DCF Assumptions:
Method: Two-Stage EPS-Priority Model
Financials
Peer Analysis
| Company Name | Market Cap | P/E Ratio | P/B Ratio | EV/EBITDA | Price to CFO |
|---|---|---|---|---|---|
| Ratnamani Metals & Tubes Ltd. | ₹182.65B | 31.25 | 4.72 | 18.88 | 28.58 |
| Jindal Steel & Power Ltd. | ₹1.28T | 64.61 | 2.57 | 19.25 | 14.56 |
| JSW Steel Ltd. | ₹3.07T | 41.32 | 3.69 | 14.05 | 18.36 |
| Jindal Saw Ltd. | ₹152.86B | 13.59 | 1.27 | 8.15 | 5.65 |
| Tata Steel Ltd. | ₹2.62T | 28.62 | 2.76 | 11.97 | 16.93 |
| Maharashtra Seamless Ltd. | ₹86.07B | 10.24 | 1.31 | 7.59 | 7.86 |
Comparison Analysis: Ratnamani Metals & Tubes Ltd. trades at a higher P/E ratio of 31.25 compared to most peers, reflecting a premium valuation relative to companies like Jindal Saw and Maharashtra Seamless, which have P/E ratios below 14. The company’s P/B ratio of 4.72 is also elevated, indicating market expectations for strong growth or quality. Its EV/EBITDA ratio of 18.88 is above the peer median, suggesting relatively higher enterprise valuation. Ratnamani’s return on equity at 14.84% is competitive, outperforming larger peers such as JSW Steel and Tata Steel, which have ROEs around 4%. Overall, Ratnamani demonstrates solid profitability metrics but commands premium valuation multiples compared to regional steel industry peers.
Financial Metrics Comparison with Peers
Financial Statements
Comprehensive financial data including income, balance sheet, and cash flow metrics
Income Statement
| fiscal_date | 2025-03-31 | 2024-03-31 | 2023-03-31 | 2022-03-31 | 2021-03-31 |
|---|---|---|---|---|---|
| Sales | 51.46B | 50.28B | 44.61B | 31.22B | 22.89B |
| Cost Of Goods | 35.11B | 34.52B | 30.57B | 21.87B | 15.37B |
| Gross Profit | 16.35B | 15.76B | 14.04B | 9.35B | 7.52B |
| Operating Expense Selling General And Administrative | 2.28B | 1.77B | 2.27B | 1.56B | 979.53M |
| Operating Expense Other Operating Expenses | 1.80B | 1.61B | 1.41B | 1.04B | 825.82M |
| Operating Income | 7.17B | 8.00B | 6.92B | 4.15B | 3.45B |
| Non Operating Interest Income | 181.73M | 116.81M | 36.68M | 44.54M | 49.99M |
| Non Operating Interest Expense | 247.34M | 306.77M | 213.29M | 172.78M | 201.70M |
| Pretax Income | 7.38B | 8.28B | 6.94B | 4.31B | 3.63B |
| Income Tax | 1.96B | 2.03B | 1.81B | 1.08B | 874.58M |
| Net Income | 5.42B | 6.25B | 5.12B | 3.23B | 2.76B |
| Eps Basic | 77.61 | 88.85 | 7.28K | 46.03 | 39.38 |
| Eps Diluted | 77.59 | 88.85 | 7.28K | 46.03 | 39.38 |
| Basic Shares Outstanding | 70.09M | 70.09M | 700.92K | 70.09M | 70.09M |
| Diluted Shares Outstanding | 70.09M | 70.09M | 700.92K | 70.09M | 70.09M |
| Ebit | 7.63B | 8.58B | 7.15B | 4.48B | 3.84B |
| Ebitda | 8.58B | 9.17B | 7.92B | 5.10B | 4.18B |
| Net Income Continuous Operations | 7.38B | 8.28B | 6.94B | 4.31B | 3.63B |
| Minority Interests | 24.07M | -23.14M | -17.98M | 0.00 | 0.00 |
| Preferred Stock Dividends | 0.00 | 0.00 | 0.00 | 0.00 | 0.00 |
Source: Financial statements and regulatory filings
Balance Sheet
| fiscal_date | 2025-03-31 | 2024-03-31 | 2023-03-31 | 2022-03-31 | 2021-03-31 |
|---|---|---|---|---|---|
| Cash And Cash Equivalents | 2.24B | 2.03B | 264.98M | 386.36M | 421.32M |
| Accounts Receivable | 12.65B | 9.41B | 10.09B | 6.01B | 4.03B |
| Total Assets | 49.06B | 40.20B | 37.80B | 29.62B | 26.17B |
| Total Liabilities | 12.41B | 8.04B | 11.04B | 7.14B | 6.29B |
| Long Term Debt | 781.78M | 301.39M | 689.39M | 1.04B | 1.55B |
| Shareholders Equity | 36.65B | 32.16B | 26.76B | 22.48B | 19.88B |
Source: Financial statements and regulatory filings
Cash Flow Statement
| fiscal_date | 2025-03-31 | 2024-03-31 | 2023-03-31 | 2022-03-31 | 2021-03-31 |
|---|---|---|---|---|---|
| Operating Activities Net Income | 7.38B | 8.28B | 6.94B | 4.31B | 3.63B |
| Operating Activities Stock Based Compensation | 101.09M | N/A | N/A | N/A | N/A |
| Operating Activities Other Non Cash Items | 14.41M | -88.03M | 168.08M | -51.58M | -77.22M |
| Operating Activities Accounts Receivable | -2.96B | 600.66M | -3.65B | -1.96B | -307.75M |
| Operating Activities Other Assets Liabilities | 1.85B | -2.29B | 118.92M | -5.41B | 2.45B |
| Operating Activities Operating Cash Flow | 6.39B | 6.50B | 3.57B | -3.11B | 5.70B |
| Investing Activities Capital Expenditures | -3.06B | -2.09B | -1.38B | -1.44B | -1.29B |
| Investing Activities Purchase Of Investments | -1.24B | -19.07M | -802.96M | 0.00 | -4.82B |
| Investing Activities Investing Cash Flow | -4.30B | -1.65B | -2.18B | 3.96B | -5.04B |
| Financing Activities Long Term Debt Payments | -339.13M | -446.59M | -718.23M | -499.59M | -839.07M |
| Financing Activities Short Term Debt Issuance | 282.67M | -318.46M | 434.01M | -7.96M | -435.60M |
| Financing Activities Common Stock Issuance | 26.83M | 27.00M | 0.00 | N/A | N/A |
| Financing Activities Common Dividends | -981.29M | -841.10M | -654.19M | -654.19M | N/A |
| Financing Activities Financing Cash Flow | -1.01B | -1.58B | -938.42M | -1.16B | -1.02B |
| End Cash Position | 2.25B | 2.07B | 341.23M | 437.80M | 436.43M |
| Free Cash Flow | 2.07B | 2.98B | 1.69B | -4.27B | 4.16B |
| Investing Activities Sale Of Investments | N/A | 464.11M | N/A | 5.39B | 1.06B |
| Investing Activities Other Investing Activity | N/A | N/A | N/A | -3.00K | N/A |
| Financing Activities Long Term Debt Issuance | N/A | N/A | N/A | 0.00 | 250.00M |
| Financing Activities Other Financing Charges | N/A | N/A | N/A | N/A | N/A |
Source: Financial statements and regulatory filings
Technical Analysis
Key Insights
- The current trend shows consolidation with price trading near the 50-day (₹2341) and 200-day (₹2357) moving averages, indicating a neutral to slightly bullish momentum.
- Key support levels are identified around ₹2300 and ₹2200, while resistance is observed near the 52-week high at ₹3050.
- The stock price is slightly above the 10-day moving average, suggesting short-term strength, but remains close to longer-term averages, indicating no strong directional bias.
- Momentum indicators show RSI near neutral levels around 50, MACD histogram is flat, and Stochastic oscillators indicate neither overbought nor oversold conditions.
- Multi-timeframe analysis reveals stable price action on daily and weekly charts, with monthly charts showing sideways movement, reflecting market indecision.
- Potential market scenarios include a range-bound phase with possible breakout if volume increases, or a pullback to support levels if broader market conditions weaken.
Trending News
1. Headline: Notice of AGM | Company Announcement | Investegate
Summary: Comprehensive details of regulatory and non regulatory announcements from FTSE 100, 250, AIM and techMARK quoted companies
Sentiment: neutral
2. Headline: Disclosure Table | Company Announcement | Investegate
Summary: Comprehensive details of regulatory and non regulatory announcements from FTSE 100, 250, AIM and techMARK quoted companies
Sentiment: neutral
3. Headline: OnEMI Technology IPO opens tomorrow: GMP, price band, and Analyst view - The Economic Times
Summary: OnEMI Technology Solutions' Rs 925.92 crore IPO opens April 30, closing May 5, with a price band of Rs 162-171. The digital lending platform, operating under Kissht and Ring, aims to strengthen its subsidiary's capital base. The issue shows modest grey market interest, trading at a Rs 4 premium.
Sentiment: neutral
4. Headline: Stocks retreat on Iran, AI concerns as Fed meeting looms By Reuters
Summary: Stocks retreat on Iran, AI concerns as Fed meeting looms
Sentiment: negative
5. Headline: Greenland, the $835M Bet, and a Long Process Toward the Promised Land
Summary: Critical Metals' $835M deal for Greenland critical minerals faces Arctic infrastructure, metallurgy barriers despite U.S.-EU push for China alternatives.
Sentiment: neutral
Recent Updates
News Summary
As of April 29, 2026. Ratnamani Metals & Tubes Ltd continues to demonstrate operational resilience with a focus on customer-centric engineering solutions across multiple high-impact sectors such as oil and gas, petrochemicals, and power. The company maintains a strong financial position, highlighted by a low debt-to-equity ratio and robust cash flows. Recent quarterly results show a slight decline in revenue growth, yet profitability metrics remain solid with gross margins above 43% and net margins over 11%. Corporate governance updates emphasize adherence to comprehensive policies including anti-bribery, equal opportunity, and dividend distribution, reflecting a commitment to ethical standards. Investor relations communications have been streamlined to enhance transparency and stakeholder engagement.
News Sentiment
The overall sentiment from recent updates is positive, driven by stable financial performance, strong governance practices, and clear communication with shareholders. While revenue growth has experienced a modest decline, the company’s profitability and cash flow generation remain robust, supporting a constructive outlook. No significant negative developments or regulatory challenges have been reported, and the company’s strategic focus on innovation and customer service underpins confidence. This positive tone is balanced by cautious observation of sectoral headwinds and macroeconomic factors, suggesting a measured but optimistic market perception.
Source List
- https://www.ratnamani.com/investors_relations.html
- https://www.screener.in/company/RATNAMANI/consolidated/
- https://economictimes.indiatimes.com/ratnamani-metals-tubes-ltd/stocksupdate/companyid-10915.cms
- https://www.indiainfoline.com/company/ratnamani-metals-tubes-ltd/profit-and-loss
- https://www.research360.in/stocks/ratnamani-metals-tubes-ltd/news-and-announcements
Analytical Overview
Analysis Summary
Ratnamani Metals & Tubes Ltd’s valuation metrics, including a trailing P/E of 31.25 and forward P/E of 28.58, align closely with the steel industry average of 31.25, indicating fair market pricing relative to peers. The company’s revenue growth has recently declined by 19% quarter-over-quarter, but cash flow trends remain positive with operating cash flow of INR 6.39 billion and free cash flow of INR 5.44 billion, supporting financial stability. The debt-to-cash ratio is low at approximately 0.35, reflecting strong financial health and liquidity, while the current ratio of 3.66 further underscores the company’s ability to meet short-term obligations. Sector-specific challenges include cyclical demand fluctuations and raw material cost volatility, but opportunities arise from infrastructure development and diversified end-market exposure. Considering India-specific factors, the regulatory environment remains supportive of manufacturing growth, with increasing infrastructure investments and evolving consumer demand patterns bolstering the company’s market positioning.
Overall Business and Market Assessment
Supporting Factors: No data
Risk Factors: the recent slowdown in revenue growth and exposure to steel industry cyclicality, which could impact near-term earnings
SWOT Analysis
Strengths
- Strong profitability with gross margin above 43% and net margin over 11%.
- Low debt-to-equity ratio of 0.06 indicating conservative financial leverage.
- Robust cash flow generation with free cash flow of INR 5.44 billion.
- Diverse product portfolio serving multiple high-impact sectors.
Weaknesses
- Recent quarterly revenue decline of 19% indicating short-term growth challenges.
- Premium valuation multiples relative to some industry peers.
- Limited public float with high insider ownership concentration.
- Negative PEG ratio reflecting inconsistent earnings growth expectations.
Opportunities
- Expansion in infrastructure and industrial development projects in India.
- Growing demand in oil and gas, petrochemicals, and power sectors.
- Potential to increase market share through innovation and tailored solutions.
- Favorable regulatory environment supporting manufacturing growth.
Threats
- Cyclical nature of the steel industry affecting demand and pricing.
- Raw material cost volatility impacting margins.
- Competitive pressures from larger steel manufacturers.
- Geopolitical and macroeconomic uncertainties influencing market conditions.
Company Description
Ratnamani Metals & Tubes Ltd. is a prominent player in the manufacturing and distribution of high-quality metal pipes and tubes. Specializing in stainless steel and carbon steel products, the company serves a diverse range of sectors including oil and gas, petrochemicals, power, water distribution, and defense. With advanced production capabilities and a focus on innovation, Ratnamani provides tailored solutions that meet stringent industry standards and customer specifications. Headquartered in India, the company has established a significant market presence both domestically and internationally, reflecting its commitment to quality and customer satisfaction. By continuously expanding its product range and geographic reach, Ratnamani Metals & Tubes Ltd. plays a vital role in supporting infrastructure and industrial development projects across varied markets.