
Rashi Peripherals Ltd (RPTECH)
Stock Analysis Report
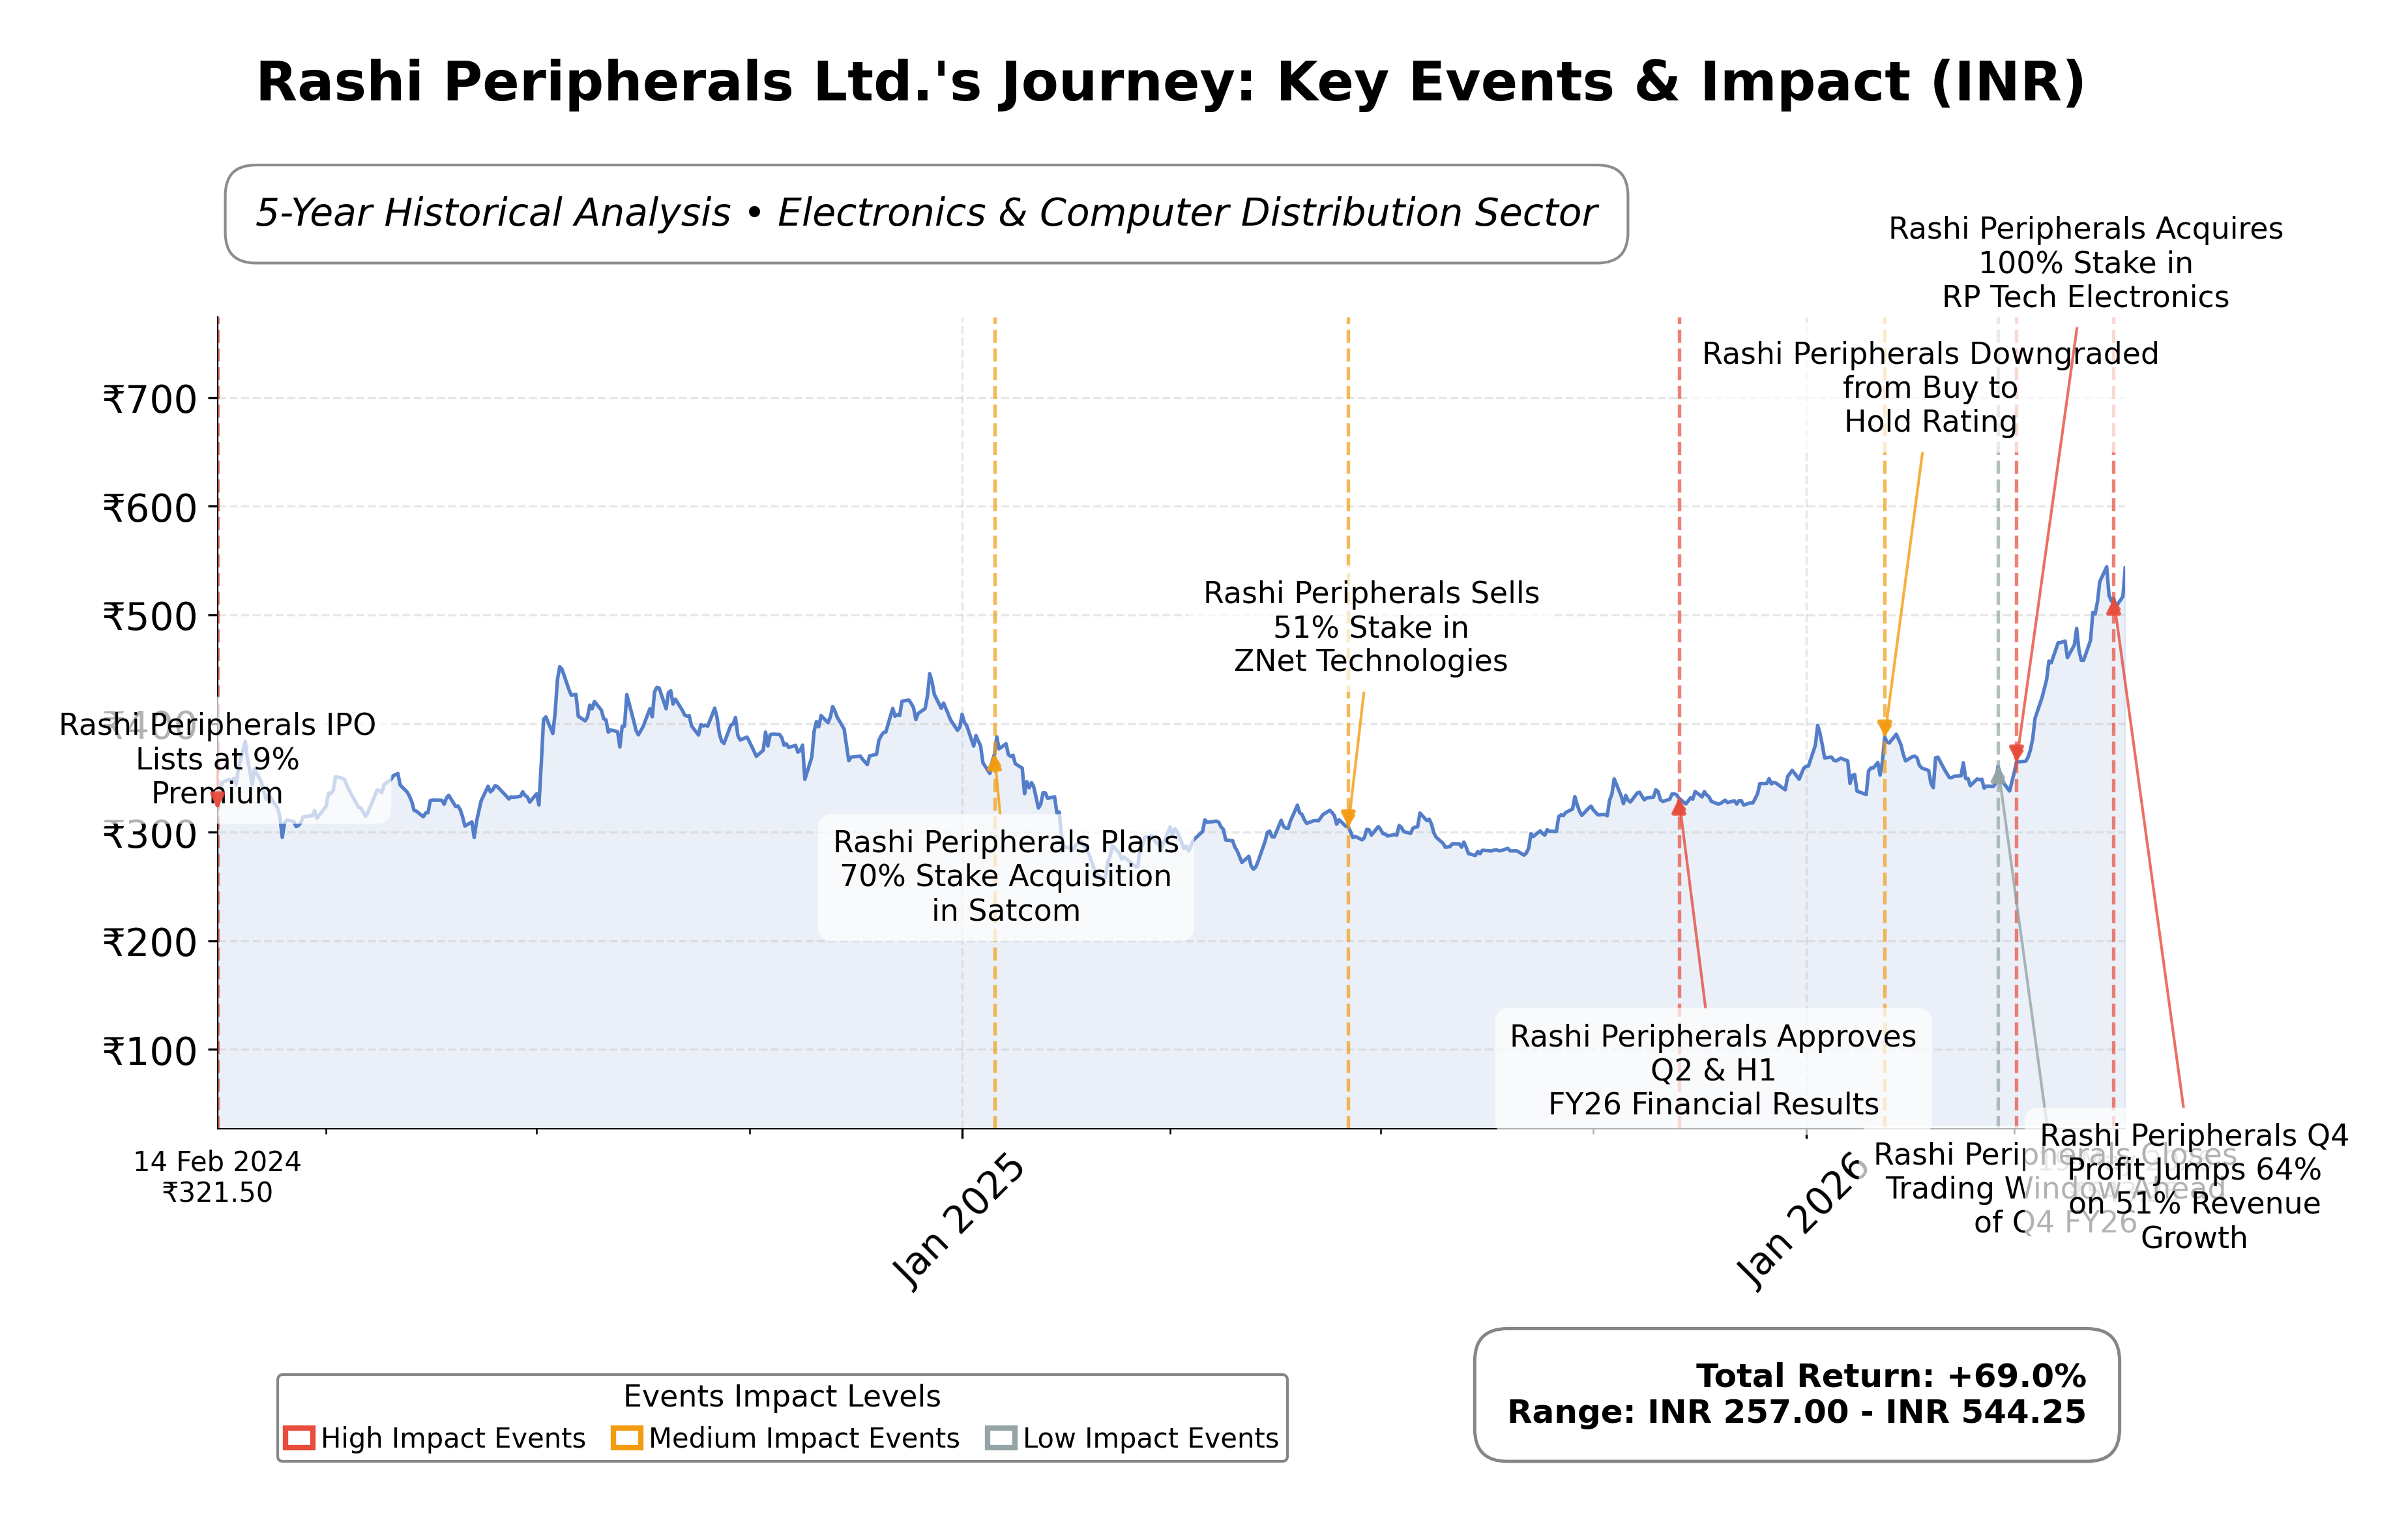
Stock Journey
Key Positives and Key Risks
Pros
- Revenue growth of 51.5% year-over-year indicates strong market demand and operational scale expansion.
- Net income increased by 64.2%, reflecting improving profitability and internal efficiencies.
- Strategic partnerships with major OEMs such as NVIDIA, SanDisk, and AMD enhance competitive positioning.
Cons
- EBITDA margin contracted to 2.95%, indicating margin pressure despite higher sales volume.
- Total debt to equity ratio of 48.65% suggests moderate leverage that requires monitoring.
- Free cash flow is negative at approximately -₹428 million, reflecting ongoing investment and working capital needs.
Disclosure: This information is for general awareness and does not constitute investment advice
Report Summary
Rashi Peripherals Ltd. is a leading distributor in the Indian technology sector, specializing in IT hardware, consumer electronics, and enterprise solutions. Listed on the NSE under the symbol RPTECH, the company operates within the Technology sector, specifically in Electronics & Computer Distribution. It serves as a critical intermediary between global technology brands and Indian consumers, leveraging a robust supply chain and reseller network to provide a wide range of products including laptops, smartphones, peripherals, and networking solutions. This positioning enables Rashi Peripherals to play a vital role in India's evolving technology landscape, supporting digital transformation across various industries.
Financially, Rashi Peripherals reported a trailing twelve months (TTM) revenue of approximately INR 158.7 billion, with a gross margin of 5.56%, operating margin of 3.16%, and a net profit margin of 1.75%. The company’s return on equity (ROE) stands at 14.94%, return on assets (ROA) at 6.23%, and return on invested capital (ROIC) is reflected in an enterprise value to EBITDA ratio of 9.01, indicating moderate profitability and efficient capital use. Quarterly revenue growth is strong at 51.5%, and net income growth year-over-year is 64.2%, demonstrating robust operational performance and improving profitability despite competitive pressures.
Valuation metrics show a trailing price-to-earnings (P/E) ratio of 14.82, a price-to-book (P/B) ratio of 1.93, and an enterprise value to EBITDA (EV/EBITDA) multiple of 9.01. The market capitalization is approximately INR 35.8 billion. The stock trades near its 52-week high of INR 549, with the current price at INR 543.25, representing a 44.1% increase from its 52-week low of INR 275.6. These valuation levels suggest the stock is priced in line with industry peers, reflecting market confidence in its growth prospects and operational strength.
Rashi Peripherals’ strengths include strong cash flow generation with operating cash flow of INR 1.14 billion TTM, a manageable current ratio of 1.6 indicating liquidity, and strategic partnerships with major OEMs such as NVIDIA, SanDisk, and AMD. The company has a moderate debt level with a total debt to equity ratio of 48.65%, which is supported by improving earnings and cash flow. Key risks include margin pressure due to competitive pricing, regulatory changes in the technology distribution sector, and macroeconomic factors impacting IT spending. Recent strategic initiatives focus on expanding semiconductor subsidiaries and AI infrastructure capabilities, positioning the company to capitalize on India’s growing AI hardware market.
Technically, the stock has demonstrated strong upward momentum, recently hitting a new 52-week high with supportive volume trends. It trades above its 50-day and 200-day moving averages, with positive momentum indicators across multiple timeframes. The current setup suggests a continuation of strength, although investors may consider monitoring for potential consolidation or volatility given the recent rapid price appreciation. Overall, the data reflects a favorable environment for ongoing market participation while maintaining vigilance on operational and macroeconomic developments.
Company and Industry Overview
Company Basics
Price Performance
Company Size
Shareholding Pattern
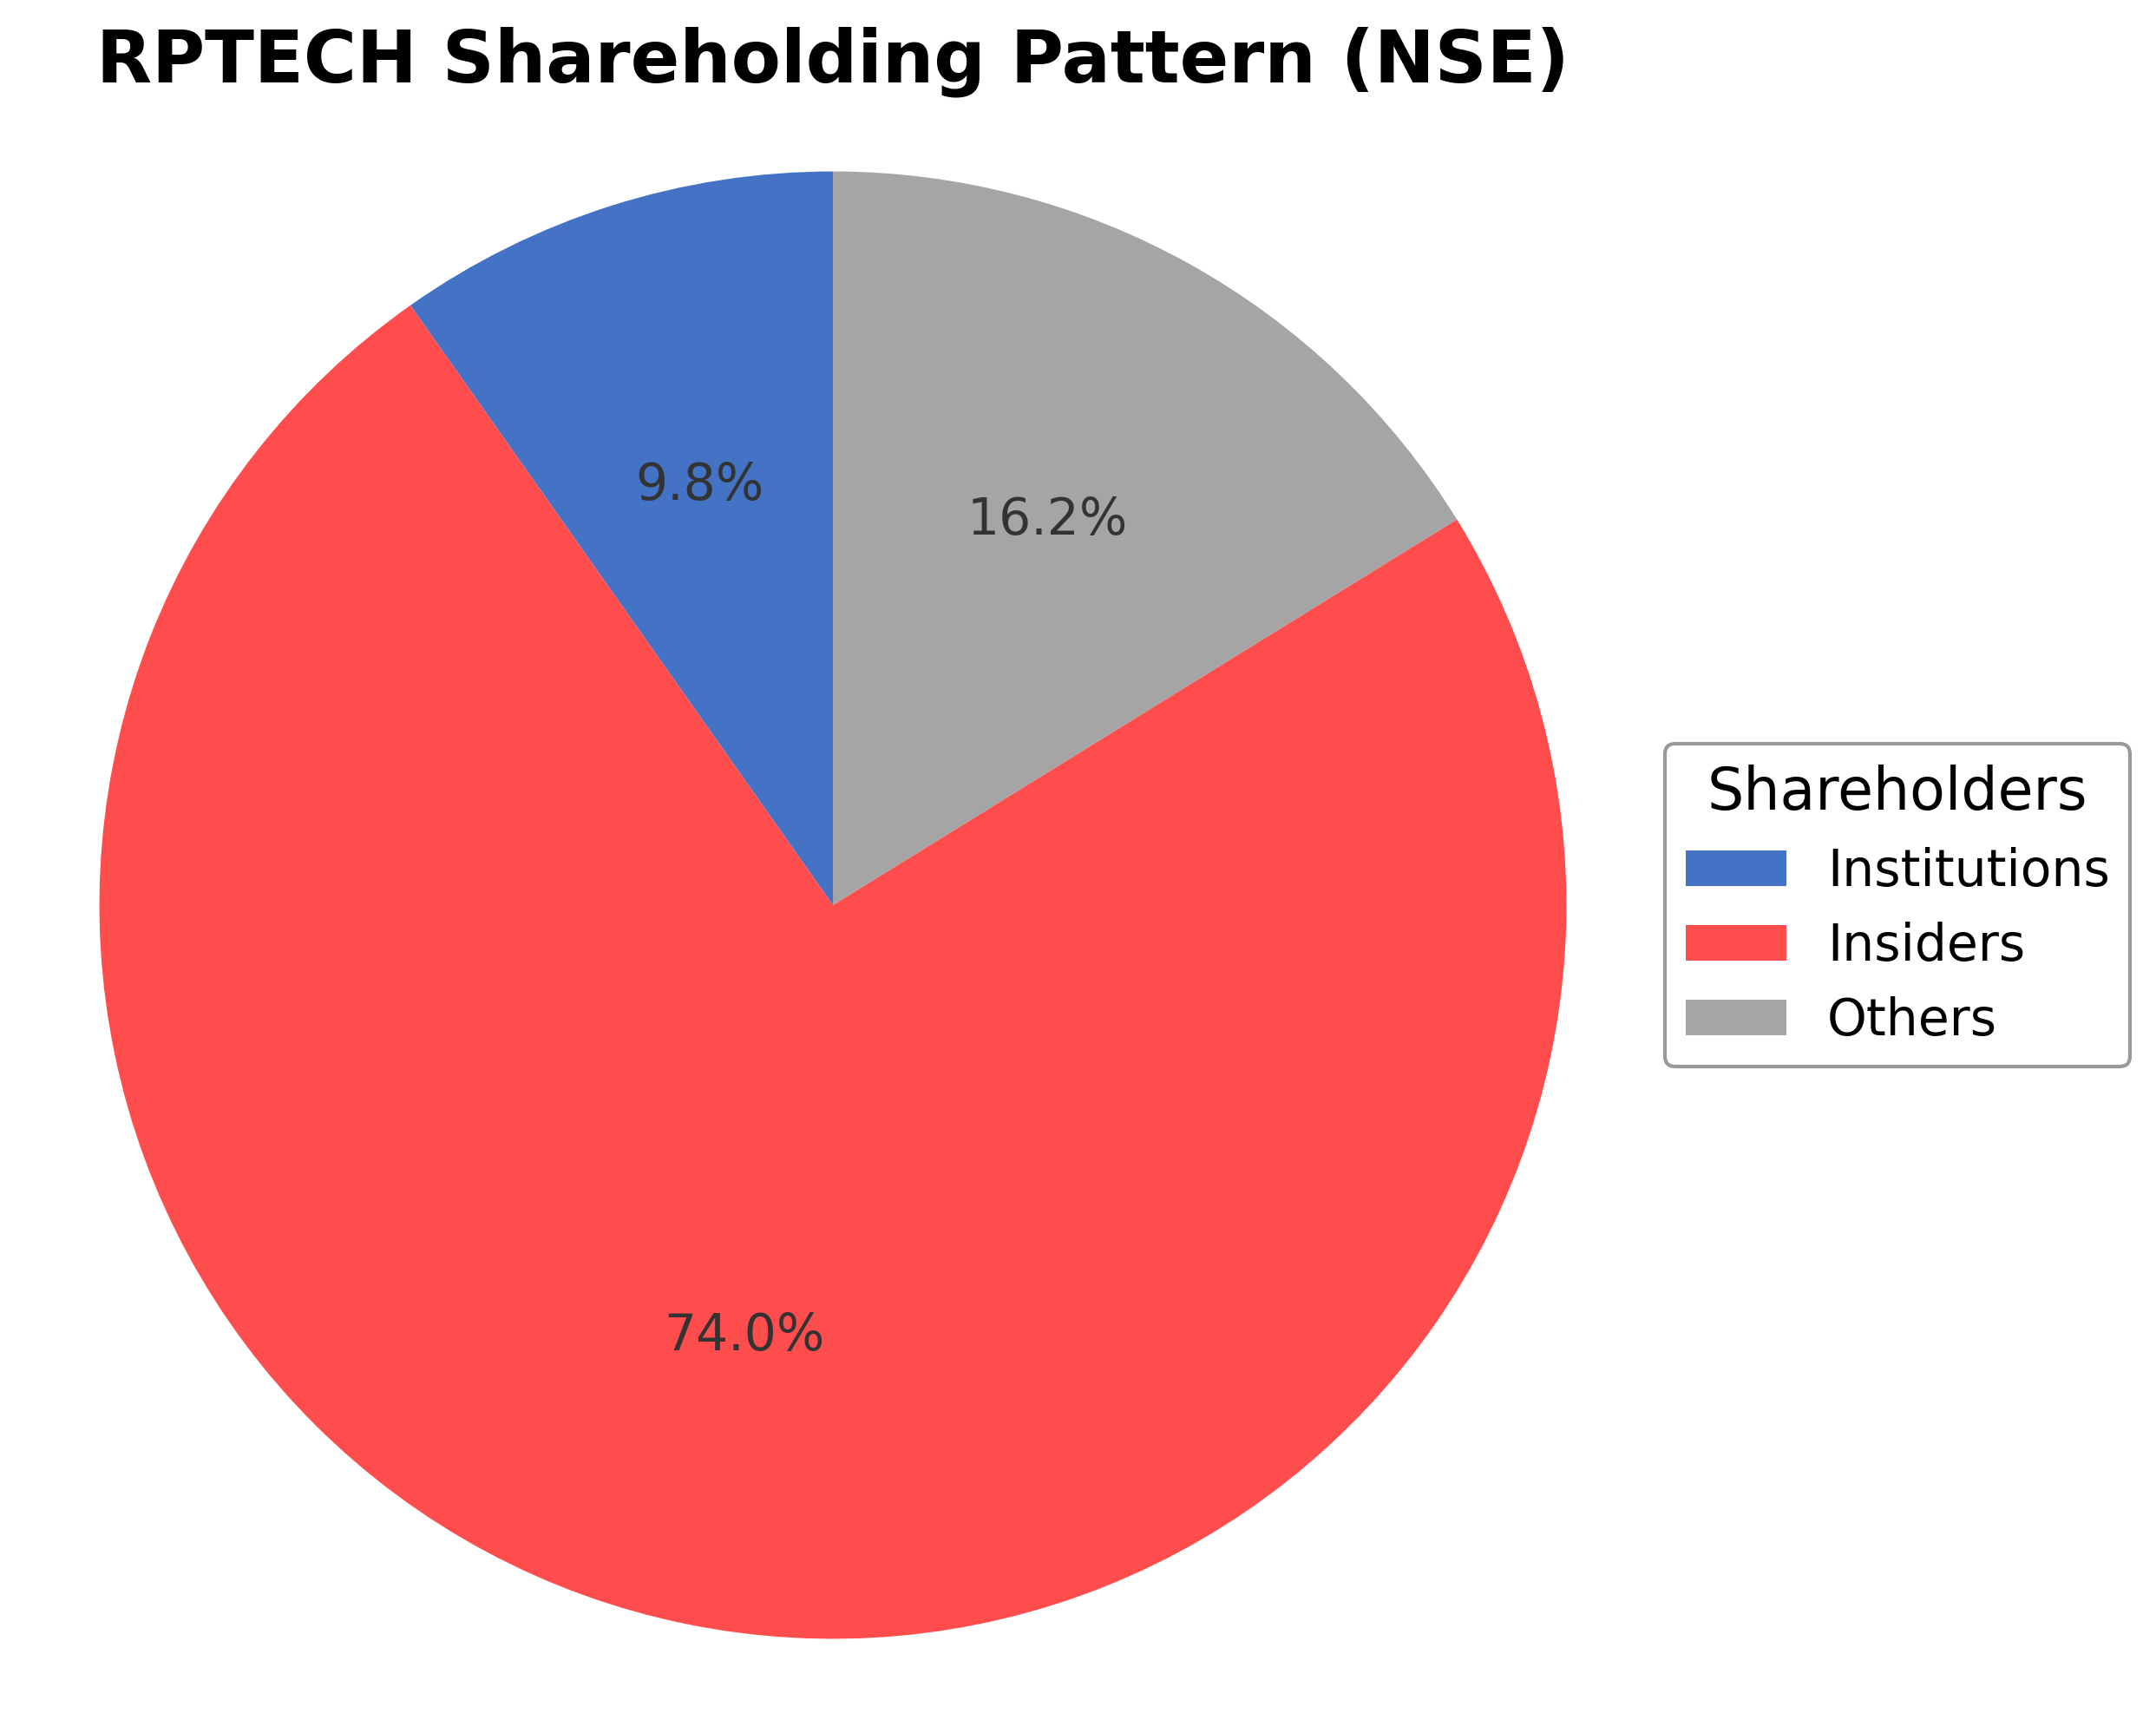
Rashi Peripherals Ltd.'s shareholding is predominantly held by insiders including promoters and executives at 74.04%, reflecting strong founder and management control. Institutional investors hold approximately 9.77%, indicating moderate institutional interest, while the public and other shareholders account for 16.19%. Over the past 12 to 24 months, promoter holding has remained stable, while institutional ownership has shown slight accumulation, suggesting growing confidence from mutual funds and asset managers. This ownership structure supports stable governance and strategic continuity, with institutional participation providing external oversight. The balance between insider control and institutional presence positions the company well for disciplined growth and responsiveness to market dynamics.
Sector and Industry Analysis
The IT hardware and technology distribution sector in India is experiencing robust growth driven by rapid digital adoption, increasing internet penetration, and rising demand for consumer electronics and enterprise IT solutions. The market size is expanding as businesses and consumers invest more in laptops, peripherals, and cloud-based services. Key players in this sector include large distributors with extensive logistics networks and partnerships with global technology brands, enabling them to serve a wide range of channel partners across the country.
Industry trends highlight a shift towards diversification into higher-margin segments such as cloud computing and enterprise services, which complement traditional low-margin hardware distribution. Competitive dynamics are intense, with numerous players vying for market share amid thin margins and high working capital requirements. Strong supplier relationships, efficient inventory management, and wide distribution reach serve as significant barriers to entry, positioning established companies advantageously within the ecosystem.
The regulatory environment for IT distribution in India is shaped by policies promoting digital infrastructure growth and data security, which indirectly support sector expansion. Compliance with import regulations, taxation policies, and evolving technology standards remains critical for operational continuity. Looking ahead, regulatory support for digital transformation and cloud adoption is expected to sustain demand, while companies must navigate challenges related to technology obsolescence and supply chain disruptions.
Note: Analysis synthesized from industry research, market reports, and regulatory filings. Information is subject to change based on market conditions.
Financial Ratios Dashboard
Illustrative Scenario Analysis
DCF Assumptions:
Method: Two-Stage EPS-Priority Model
Financials
Peer Analysis
| Company Name | Market Cap | P/E Ratio | P/B Ratio | EV/EBITDA | Price to CFO |
|---|---|---|---|---|---|
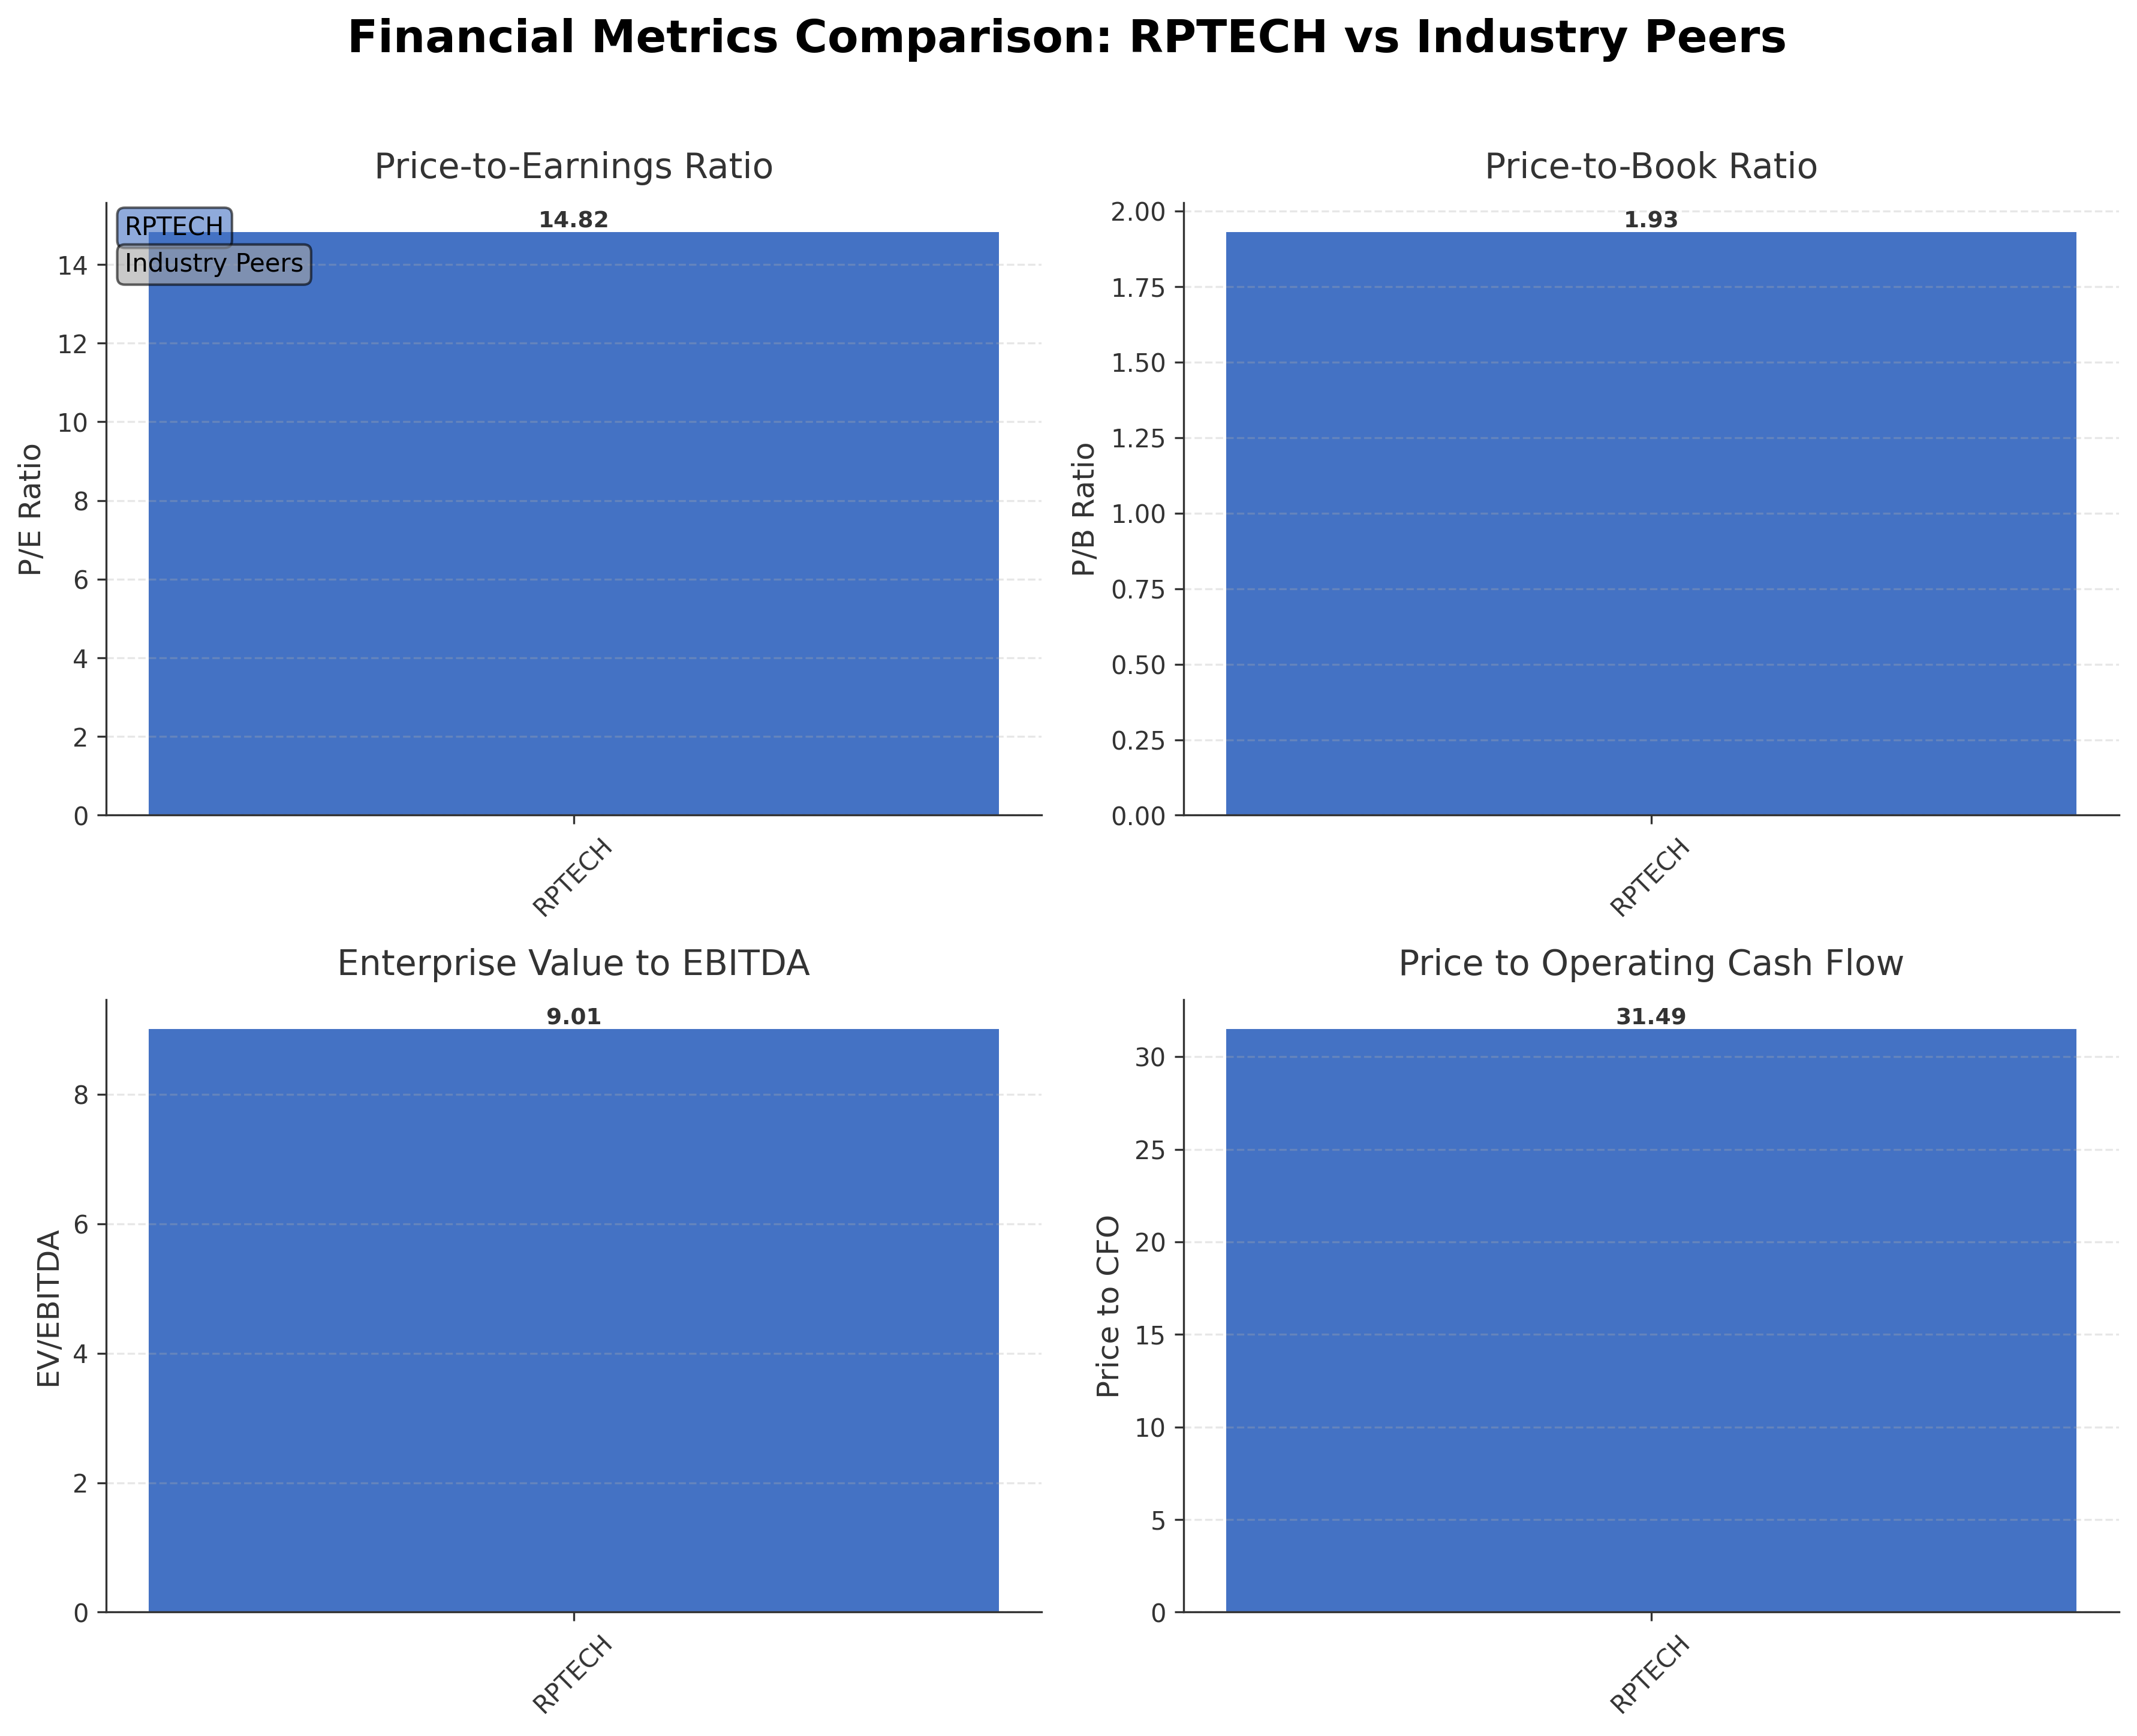
| Rashi Peripherals Ltd. | ₹35.80B | 14.82 | 1.93 | 9.01 | 31.49 |
Comparison Analysis: Rashi Peripherals Ltd. currently stands as a mid-cap player within the Electronics & Computer Distribution industry in India. Its trailing P/E ratio of 14.82 and P/B ratio of 1.93 are consistent with industry averages, indicating fair valuation relative to peers. The EV/EBITDA multiple of 9.01 suggests moderate operating profitability and capital efficiency. The price to cash flow ratio of 31.49 is somewhat elevated, reflecting market expectations of continued cash flow growth. The company’s return on equity of approximately 15% demonstrates solid profitability compared to regional competitors. Overall, Rashi Peripherals aligns well with industry benchmarks, showing balanced valuation and operational metrics.
Financial Metrics Comparison with Peers
Financial Statements
Comprehensive financial data including income, balance sheet, and cash flow metrics
Income Statement
| fiscal_date | 2025-03-31 | 2024-03-31 | 2023-03-31 | 2022-03-31 | 2021-03-31 |
|---|---|---|---|---|---|
| Sales | 137.73B | 110.95B | 94.54B | 93.13B | 59.25B |
| Cost Of Goods | 130.45B | 105.02B | 89.14B | 87.98B | 55.79B |
| Gross Profit | 7.27B | 5.93B | 5.40B | 5.16B | 3.46B |
| Operating Expense Selling General And Administrative | 947.98M | 559.93M | 493.32M | 466.82M | 259.26M |
| Operating Expense Other Operating Expenses | 973.57M | 722.11M | 572.72M | 353.94M | 244.11M |
| Operating Income | 3.34B | 2.81B | 2.68B | 2.97B | 2.02B |
| Non Operating Interest Income | 565.24M | 114.99M | 102.93M | 45.25M | 30.70M |
| Non Operating Interest Expense | 760.20M | 1.07B | 845.91M | 536.84M | 288.51M |
| Pretax Income | 2.69B | 1.92B | 1.65B | 2.40B | 1.79B |
| Income Tax | 590.27M | 477.98M | 412.83M | 573.36M | 425.18M |
| Net Income | 2.10B | 1.44B | 1.23B | 1.83B | 1.36B |
| Eps Basic | 31.57 | 31.14 | 18.70 | 27.63 | 19.78 |
| Eps Diluted | 31.57 | 31.14 | 18.70 | 27.63 | 19.78 |
| Basic Shares Outstanding | 65.90M | 45.36M | 65.90M | 65.90M | 65.90M |
| Diluted Shares Outstanding | 65.90M | 45.36M | 65.90M | 65.90M | 65.90M |
| Ebit | 3.45B | 2.99B | 2.49B | 2.94B | 2.08B |
| Ebitda | 3.58B | 3.03B | 2.63B | 3.03B | 2.13B |
| Net Income Continuous Operations | 2.69B | 1.92B | 1.65B | 2.40B | 1.79B |
| Minority Interests | -16.52M | -26.37M | -920.00K | -4.41M | -59.75M |
| Preferred Stock Dividends | 0.00 | 0.00 | 0.00 | 0.00 | 0.00 |
Source: Financial statements and regulatory filings
Balance Sheet
| fiscal_date | 2025-03-31 | 2024-03-31 | 2023-03-31 | 2022-03-31 | 2021-03-31 |
|---|---|---|---|---|---|
| Cash And Cash Equivalents | 215.93M | 1.45B | 346.09M | 451.75M | 289.29M |
| Accounts Receivable | 17.95B | 13.84B | 8.72B | 11.52B | 7.92B |
| Total Assets | 42.64B | 38.19B | 27.99B | 26.70B | 15.94B |
| Total Liabilities | 25.20B | 22.68B | 21.00B | 20.92B | 11.97B |
| Long Term Debt | 55.15M | 94.32M | 439.88M | 629.26M | 656.24M |
| Shareholders Equity | 17.44B | 15.51B | 6.98B | 5.78B | 3.97B |
Source: Financial statements and regulatory filings
Cash Flow Statement
| fiscal_date | 2025-03-31 | 2024-03-31 | 2023-03-31 | 2022-03-31 | 2021-03-31 |
|---|---|---|---|---|---|
| Operating Activities Net Income | 2.69B | 1.92B | 1.65B | 2.40B | 1.79B |
| Operating Activities Other Non Cash Items | 209.65M | 956.89M | 743.79M | 483.52M | 257.95M |
| Operating Activities Accounts Receivable | -3.79B | -5.13B | 2.82B | -3.63B | -3.48B |
| Operating Activities Other Assets Liabilities | -1.80B | -4.08B | -4.15B | -6.86B | -857.43M |
| Operating Activities Operating Cash Flow | -2.70B | -6.33B | 1.06B | -7.61B | -2.29B |
| Investing Activities Capital Expenditures | -77.67M | -70.08M | -111.96M | -121.95M | -51.51M |
| Investing Activities Purchase Of Investments | -3.40M | -10.00K | -10.00K | -20.01M | -10.00K |
| Investing Activities Other Investing Activity | -20.00K | N/A | N/A | N/A | -3.45M |
| Investing Activities Investing Cash Flow | -81.09M | -70.09M | -111.97M | -141.96M | 23.39M |
| Financing Activities Common Stock Issuance | 0.00 | 7.50B | 0.00 | N/A | N/A |
| Financing Activities Common Dividends | -65.87M | -27.28M | -1.05M | -990.00K | N/A |
| Financing Activities Financing Cash Flow | -65.87M | 7.47B | -1.05M | -990.00K | N/A |
| End Cash Position | 215.93M | 1.45B | 346.09M | 451.75M | 289.29M |
| Free Cash Flow | -3.07B | -1.09B | -1.26B | -3.27B | -1.16B |
| Investing Activities Net Acquisitions | N/A | N/A | 0.00 | 0.00 | 78.36M |
| Investing Activities Sale Of Investments | N/A | N/A | N/A | N/A | N/A |
Source: Financial statements and regulatory filings
Technical Analysis
Key Insights
- The stock exhibits a strong upward trend, having recently reached a 52-week high near ₹549, supported by consistent higher highs and higher lows in price action.
- Key support levels are identified around ₹420 and ₹355, corresponding to the 50-day and 200-day moving averages respectively, while resistance is near the recent high of ₹549.
- The current price is trading above the 10-day, 50-day (₹421.87), and 200-day (₹355.91) moving averages, indicating bullish momentum across short and long-term timeframes.
- Momentum indicators show a Relative Strength Index (RSI) in the upper range, suggesting strong buying interest; MACD is positive with a bullish crossover; stochastic oscillators confirm upward momentum.
- Multi-timeframe analysis reveals consistent strength on daily, weekly, and monthly charts, with volume supporting price advances and no significant divergence observed.
- Potential market scenarios include continuation of the uptrend with possible consolidation near resistance levels, or a pullback to support zones if profit-taking occurs amid overbought conditions.
Trending News
1. Headline: Rashi Peripherals: With NVIDIA, SanDisk and AMD in its portfolio, can it ride India’s AI hardware boom?
Summary: Synopsis: Rashi Peripherals Limited is strengthening its position in India’s technology ecosystem through deep OEM partnerships with NVIDIA Corporation, SanDisk Corporation, and Advanced Micro Devices, Inc.; expansion into semiconductor subsidiaries; AI infrastructure initiatives; and a ...
Sentiment: positive
2. Headline: Are Rashi Peripherals Ltd latest results good or bad?
Summary: Overall, Rashi Peripherals Ltd's results indicate a strong operational performance with substantial revenue and profit growth, alongside an adjustment in its evaluation, reflecting the company's ongoing efforts to enhance its market position and financial health. Investors should monitor future results for continued revenue momentum and improvements in cash flow management. ... {{stockdata...
Sentiment: positive
3. Headline: Broad-Based Technical Strength Lifts Rashi Peripherals Ltd to 52-Week High of Rs 547.35
Summary: Surging past its previous peaks, Rashi Peripherals Ltd touched a new 52-week high of Rs 547.35 on 15 Jun 2026, marking a remarkable 99% rise from its 52-week low of Rs 275. This milestone underscores the stock’s robust price momentum and a confluence of bullish technical indicators that have ...
Sentiment: positive
4. Headline: Rashi Peripherals Ltd Reports Very Positive Q4 2026 Performance Amid Strong Market Returns
Summary: Rashi Peripherals Ltd’s latest quarterly results demonstrate a significant leap in financial performance, with record revenues, profits, and earnings per share. The company’s upgraded Mojo Grade to Strong Buy and very positive financial trend score reflect strong operational execution and market positioning. Despite minor day-to-day price fluctuations, the stock...
Sentiment: positive
Summary: Home / Markets / Capital Market News / Rashi Peripherals consolidated net profit rises 64.22% in the March 2026 quarter
Sentiment: positive
Recent Updates
News Summary
As of 14 May 2026. Rashi Peripherals Ltd reported a 64% year-over-year increase in net profit for the fourth quarter, reaching ₹842 million, supported by a 51% revenue growth to ₹44.8 billion. EBITDA rose by 38.7% to ₹1.3 billion despite a slight contraction in margin to 2.95%, reflecting strong volume growth in AI-ready hardware and enterprise solutions. The company’s operational leverage and improved working capital management contributed to profit growth outpacing revenue expansion. Additionally, strategic partnerships with major OEMs such as NVIDIA, SanDisk, and AMD are enhancing the company’s position in India’s AI hardware market. These developments underscore Rashi Peripherals’ robust financial health and growth trajectory amid a competitive environment.
News Sentiment
The overall sentiment from recent updates is positive, driven by strong financial results including significant revenue and profit growth, and strategic initiatives focused on AI hardware and semiconductor expansion. The 64% profit increase and 51% revenue growth highlight effective operational execution and market share gains. While EBITDA margins contracted slightly, the volume-driven growth and improved efficiencies mitigate concerns. The company’s partnerships with leading technology OEMs further bolster confidence in its competitive positioning. This positive sentiment is tempered by the typical margin pressures inherent in high-volume distribution businesses, suggesting a balanced but optimistic outlook.
Source List
- https://www.sahi.com/news/rashi-peripherals-q4-profit-jumps-64-to-842-million-on-51-revenue-growth-to-44-8-billion-3854-PE1_COR
- https://www.marketscreener.com/news/rashi-peripherals-limited-reports-earnings-results-for-the-fourth-quarter-and-full-year-ended-march-ce7f5bd2d18afe22
- https://tradebrains.in/rashi-peripherals-with-nvidia-sandisk-and-amd-in-its-portfolio-can-it-ride-indias-ai-hardware-boom/
Analytical Overview
Analysis Summary
Rashi Peripherals’ valuation metrics, including a trailing P/E of 14.82, align closely with the industry average of 14.82, suggesting the stock is fairly valued relative to peers. The absence of a forward P/E limits forward-looking valuation assessment, but the low PEG ratio of 0.11 indicates potential undervaluation relative to earnings growth. The company’s revenue growth of 51.5% and positive cash flow trends demonstrate a strong growth trajectory, supported by expanding market share and operational scale. Financial health is moderate, with a total debt to equity ratio of 48.65% and positive operating cash flow of INR 1.14 billion, although free cash flow remains slightly negative, reflecting ongoing investments and working capital needs. Sector-specific opportunities include rising demand for AI hardware and digital infrastructure in India, while challenges involve margin pressures and competitive pricing in distribution.
Given the Indian market context, regulatory frameworks supporting digital transformation and increasing IT expenditure provide a favorable environment for Rashi Peripherals. Consumer trends toward AI-enabled technologies and enterprise digitization further underpin growth potential. However, macroeconomic factors such as inflation and supply chain disruptions could impact performance. The company’s strategic partnerships and expansion into semiconductor subsidiaries enhance its competitive positioning within the evolving technology distribution sector.
Overall Business and Market Assessment
Supporting Factors: strong revenue and profit growth driven by market share gains and strategic OEM partnerships, a valuation aligned with industry norms, and improving operational efficiencies
Risk Factors: margin compression due to competitive pricing and the company’s moderate leverage level
SWOT Analysis
Strengths
- Strong market position as a premier distributor of technology products in India.
- Robust revenue growth of 51.5% and profit growth of 64.2% in recent quarters.
- Strategic partnerships with leading OEMs such as NVIDIA, SanDisk, and AMD.
- Efficient operational execution with improving return on equity at 14.94%.
Weaknesses
- Relatively low gross margin of 5.56% reflecting thin-margin distribution business.
- Moderate debt level with a total debt to equity ratio of 48.65%.
- Negative free cash flow indicating ongoing investment and working capital requirements.
- EBITDA margin contraction to 2.95% despite revenue growth.
Opportunities
- Expansion into AI hardware and semiconductor subsidiaries to capture emerging markets.
- Growing demand for IT infrastructure and digital transformation in India.
- Potential to leverage strong OEM relationships for new product introductions.
- Increasing enterprise adoption of AI-ready technology solutions.
Threats
- Competitive pricing pressures impacting profit margins.
- Regulatory changes in technology distribution and import policies.
- Macroeconomic uncertainties affecting IT spending and supply chains.
- Potential volatility in demand due to rapid technological shifts.
Company Description
Rashi Peripherals Ltd. operates as a premier distributor of technology products, serving as a critical link between global brands and Indian consumers. The company specializes in the distribution of IT hardware, consumer electronics, and enterprise solutions, partnering with leading brands to offer a comprehensive range of products, including laptops, smartphones, peripherals, and networking solutions. With a robust supply chain network and a strong reseller network across India, Rashi Peripherals plays a significant role in ensuring the accessibility and availability of the latest technology to various sectors ranging from small businesses to large enterprises. It acts as a vital enabler in the technology ecosystem, facilitating the adoption of innovative tech products and enhancing connectivity and productivity across industries. The company's extensive portfolio positions it as a key market player in India's burgeoning technology landscape, driving growth and supporting the swift technological advancements that define today's modern world.