


Rajesh Exports Ltd (RAJESHEXPO)
Stock Analysis Report
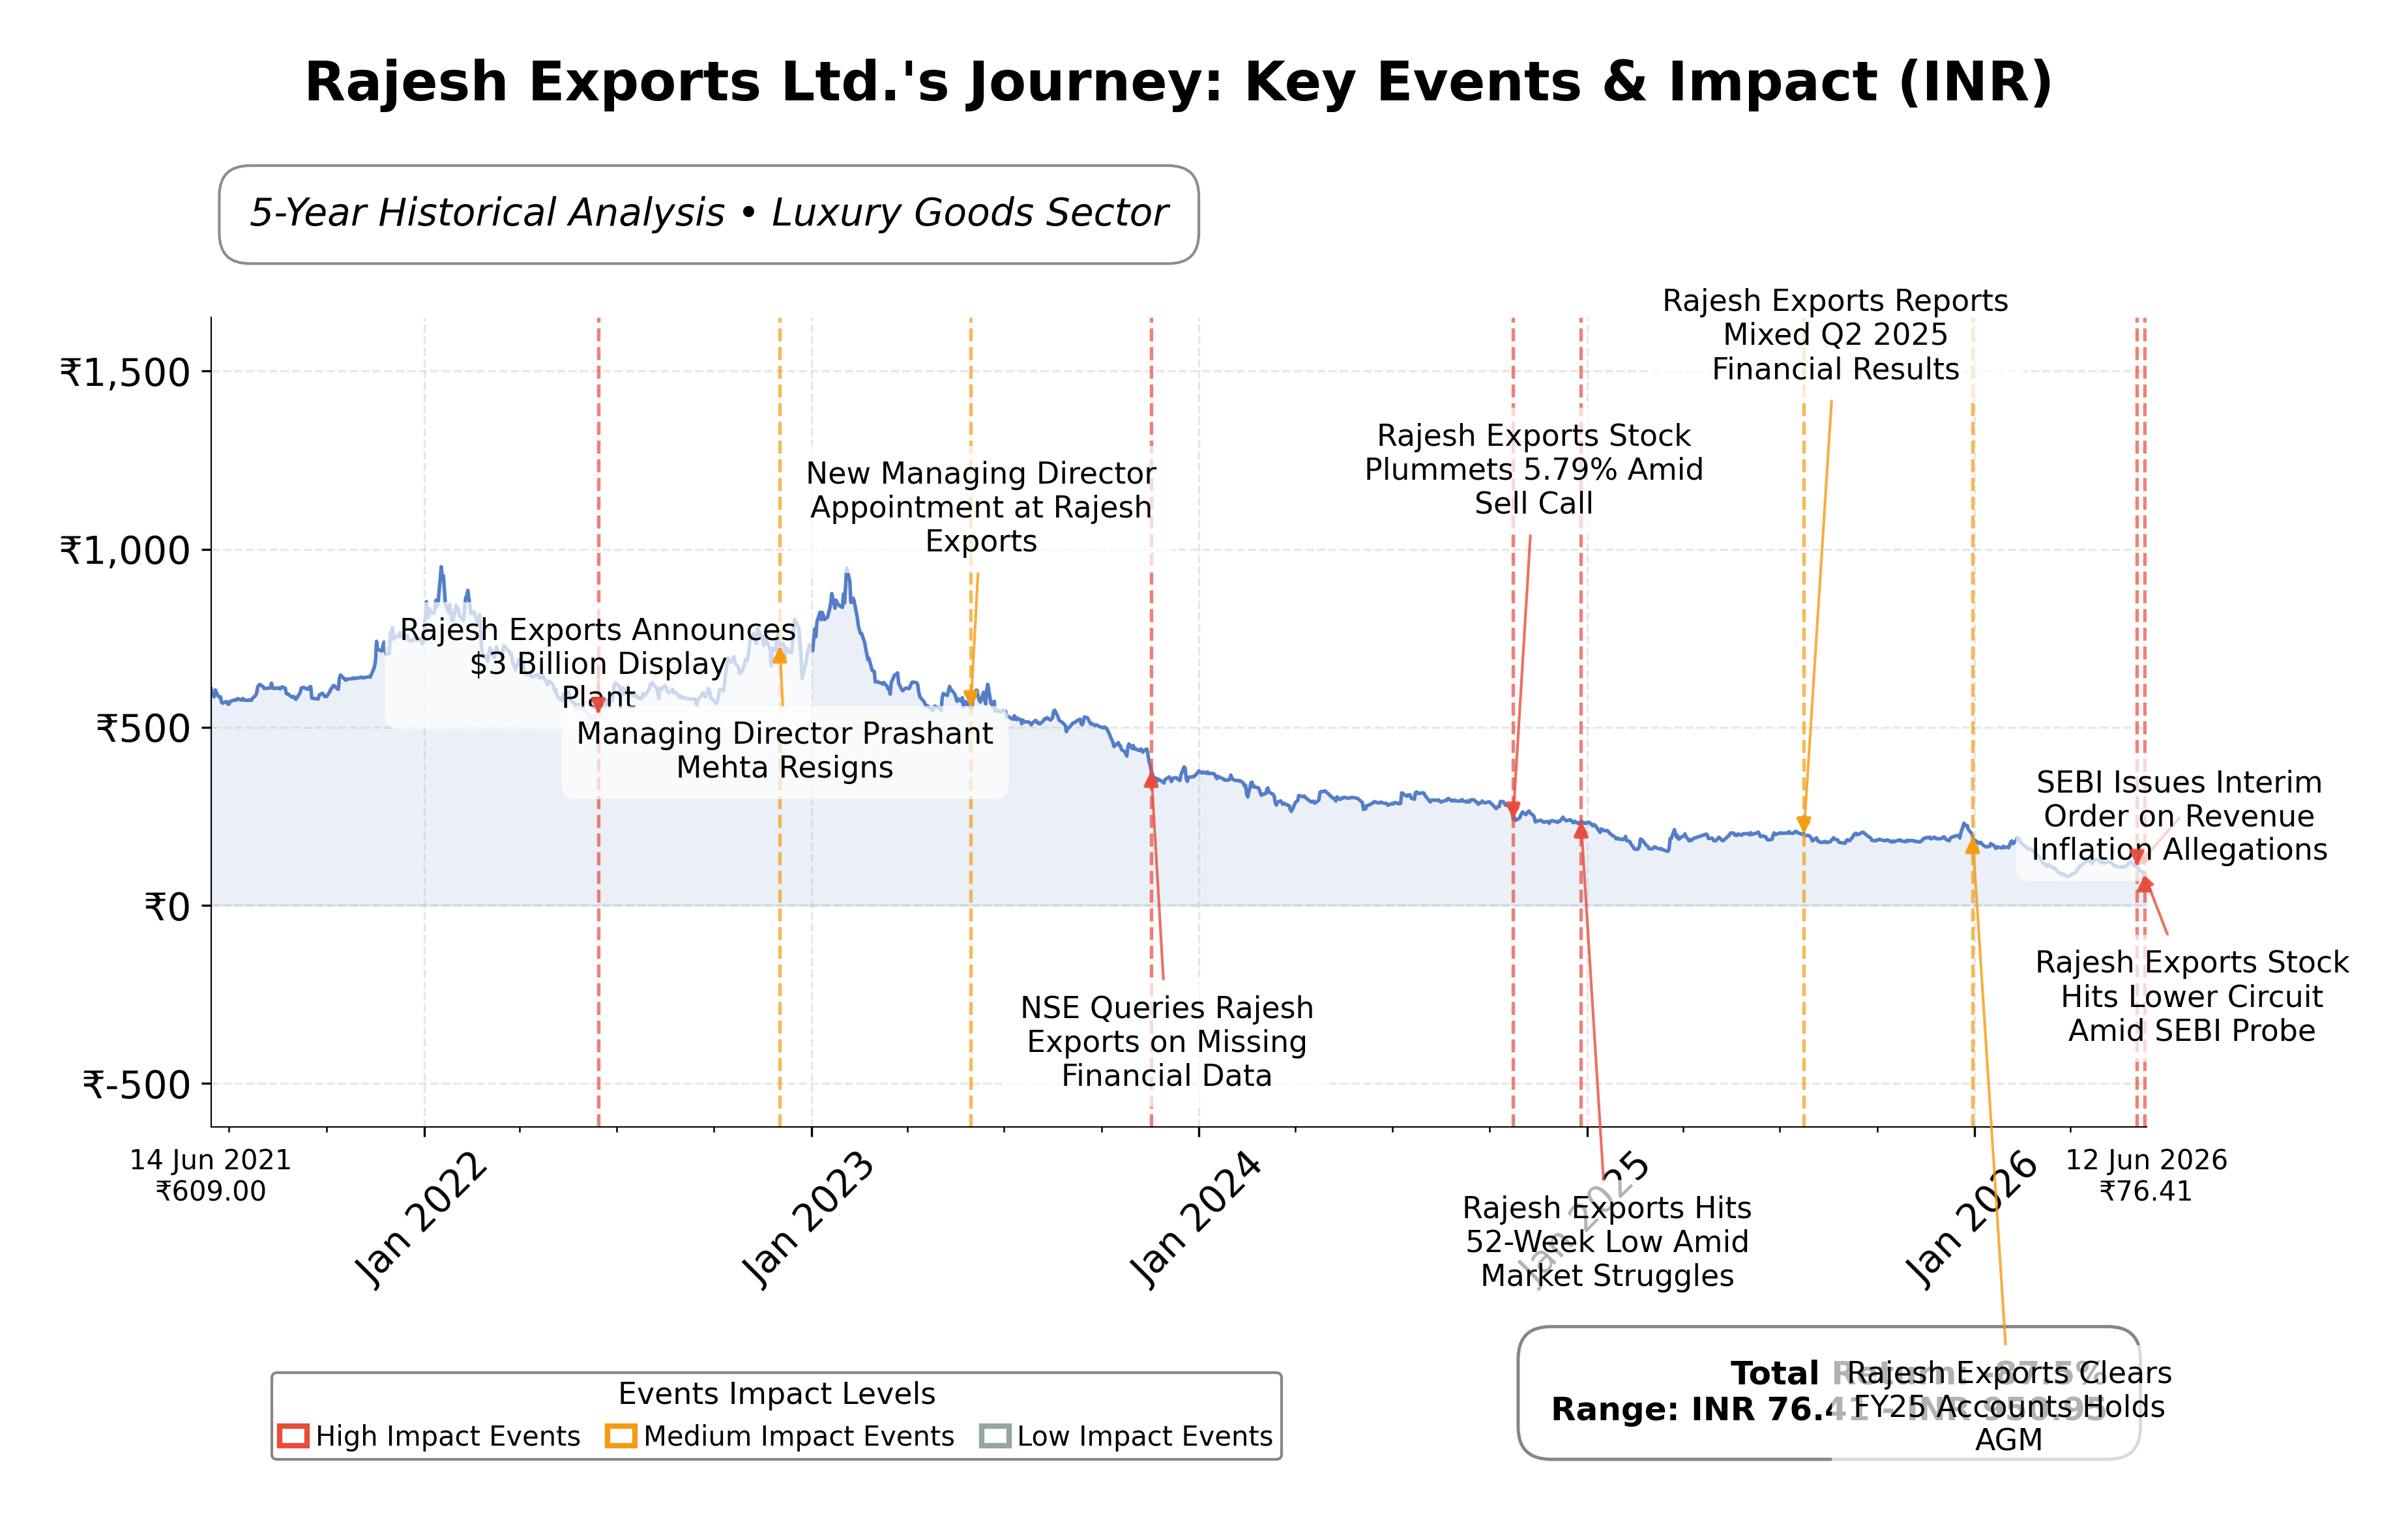
Stock Journey
Key Positives and Key Risks
Pros
- Strong cash position of INR 25.9 billion supports liquidity and operational flexibility amid market challenges.
- Low debt level with a debt-to-equity ratio of 5.25 indicates conservative financial leverage.
- Valuation metrics show a low price-to-book ratio of 0.18 and EV/EBITDA of 5.36, suggesting potential undervaluation relative to peers.
Cons
- Ongoing SEBI regulatory investigation has led to a nearly 30% share price decline and trading restrictions on key executives.
- Profit margins are extremely thin, with net margin at 0.023%, reflecting limited profitability.
- Negative operating cash flow of INR -96.3 billion signals potential cash flow management issues despite positive free cash flow.
Disclosure: This information is for general awareness and does not constitute investment advice
Report Summary
Rajesh Exports Ltd. is a prominent player in the gold refining and manufacturing industry, specializing in transforming raw gold into finished products such as gold bars, coins, and jewelry. Listed on the NSE under the consumer cyclical sector, the company operates one of the world's largest gold refineries and has a significant presence in the Indian market with exports to international destinations. Its business model integrates refining, manufacturing, and retail operations, positioning it as a key contributor to the luxury goods segment.
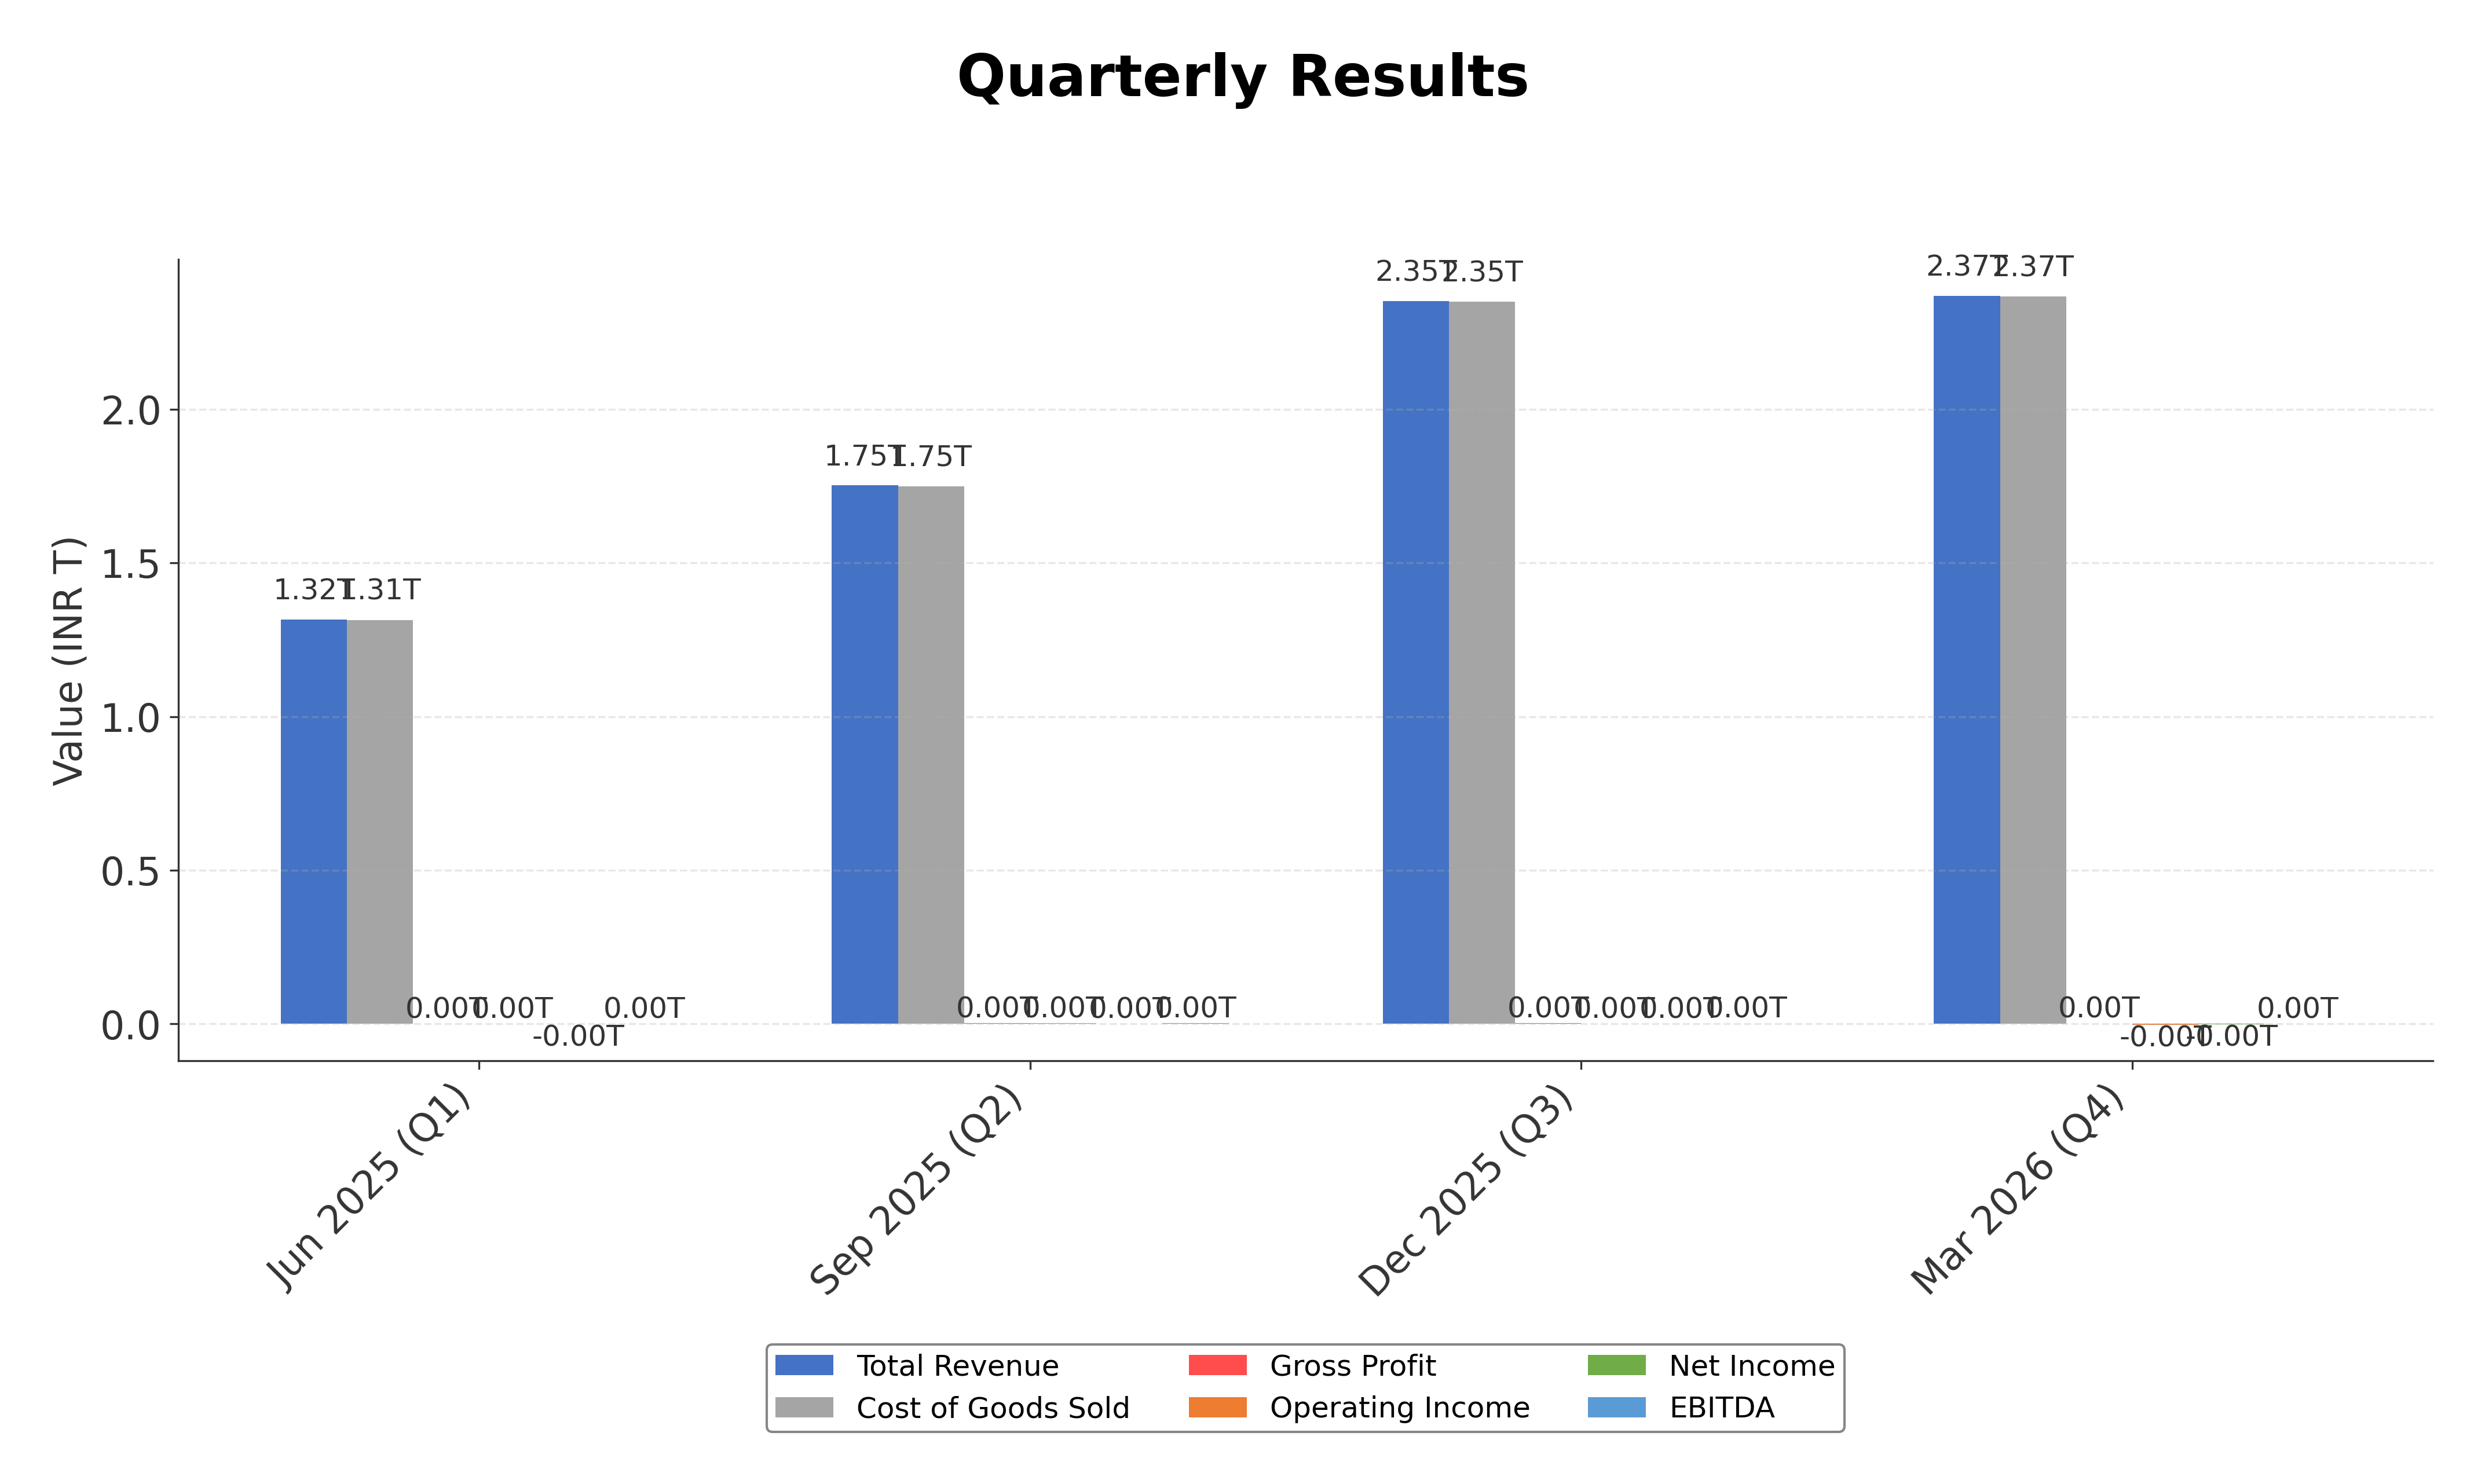
Financially, Rajesh Exports reported a trailing twelve months (TTM) revenue of approximately INR 7.41 trillion with a gross margin of 0.058%, operating margin of 0.043%, and a net profit margin of 0.023%. The company’s return on equity (ROE) stands at 0.65%, and return on assets (ROA) at 0.28%, reflecting modest profitability and asset efficiency. Despite a high revenue base, margins remain thin, which is typical for commodity-based businesses, while the return on invested capital (ROIC) is not explicitly stated but can be inferred as low given the margin profile.
Valuation metrics show a trailing price-to-earnings (P/E) ratio of 25.91 and a forward P/E of 1.97, indicating a significant expected earnings growth or re-rating. The price-to-book (P/B) ratio is notably low at 0.18, and the enterprise value to EBITDA (EV/EBITDA) ratio is 5.36, suggesting the stock may be undervalued relative to its book value and earnings. The market capitalization is approximately INR 29.15 billion, with the current share price at INR 76.41, near its 52-week low of INR 80.38 and well below the 52-week high of INR 237.88, reflecting recent price weakness.
Rajesh Exports’ strengths include a strong cash position with INR 25.9 billion in cash and equivalents, low debt levels with a total debt of INR 8.79 billion, and market leadership in gold refining. However, the company faces significant risks from ongoing regulatory scrutiny by SEBI alleging financial irregularities and revenue misrepresentation, which has led to a sharp decline in share price and trading restrictions on its chairman. Recent strategic responses include public clarifications disputing the allegations and emphasizing the company’s debt-free status and transparent financials.
Technically, the stock is in a downtrend with the price below both the 50-day and 200-day moving averages, and momentum indicators suggest oversold conditions across multiple timeframes. The recent news flow and regulatory challenges have contributed to bearish sentiment, but the company’s fundamentals and cash reserves provide a buffer. Current conditions suggest a cautious stance with attention to regulatory developments and market reactions.
Company and Industry Overview
Company Basics
Price Performance
Company Size
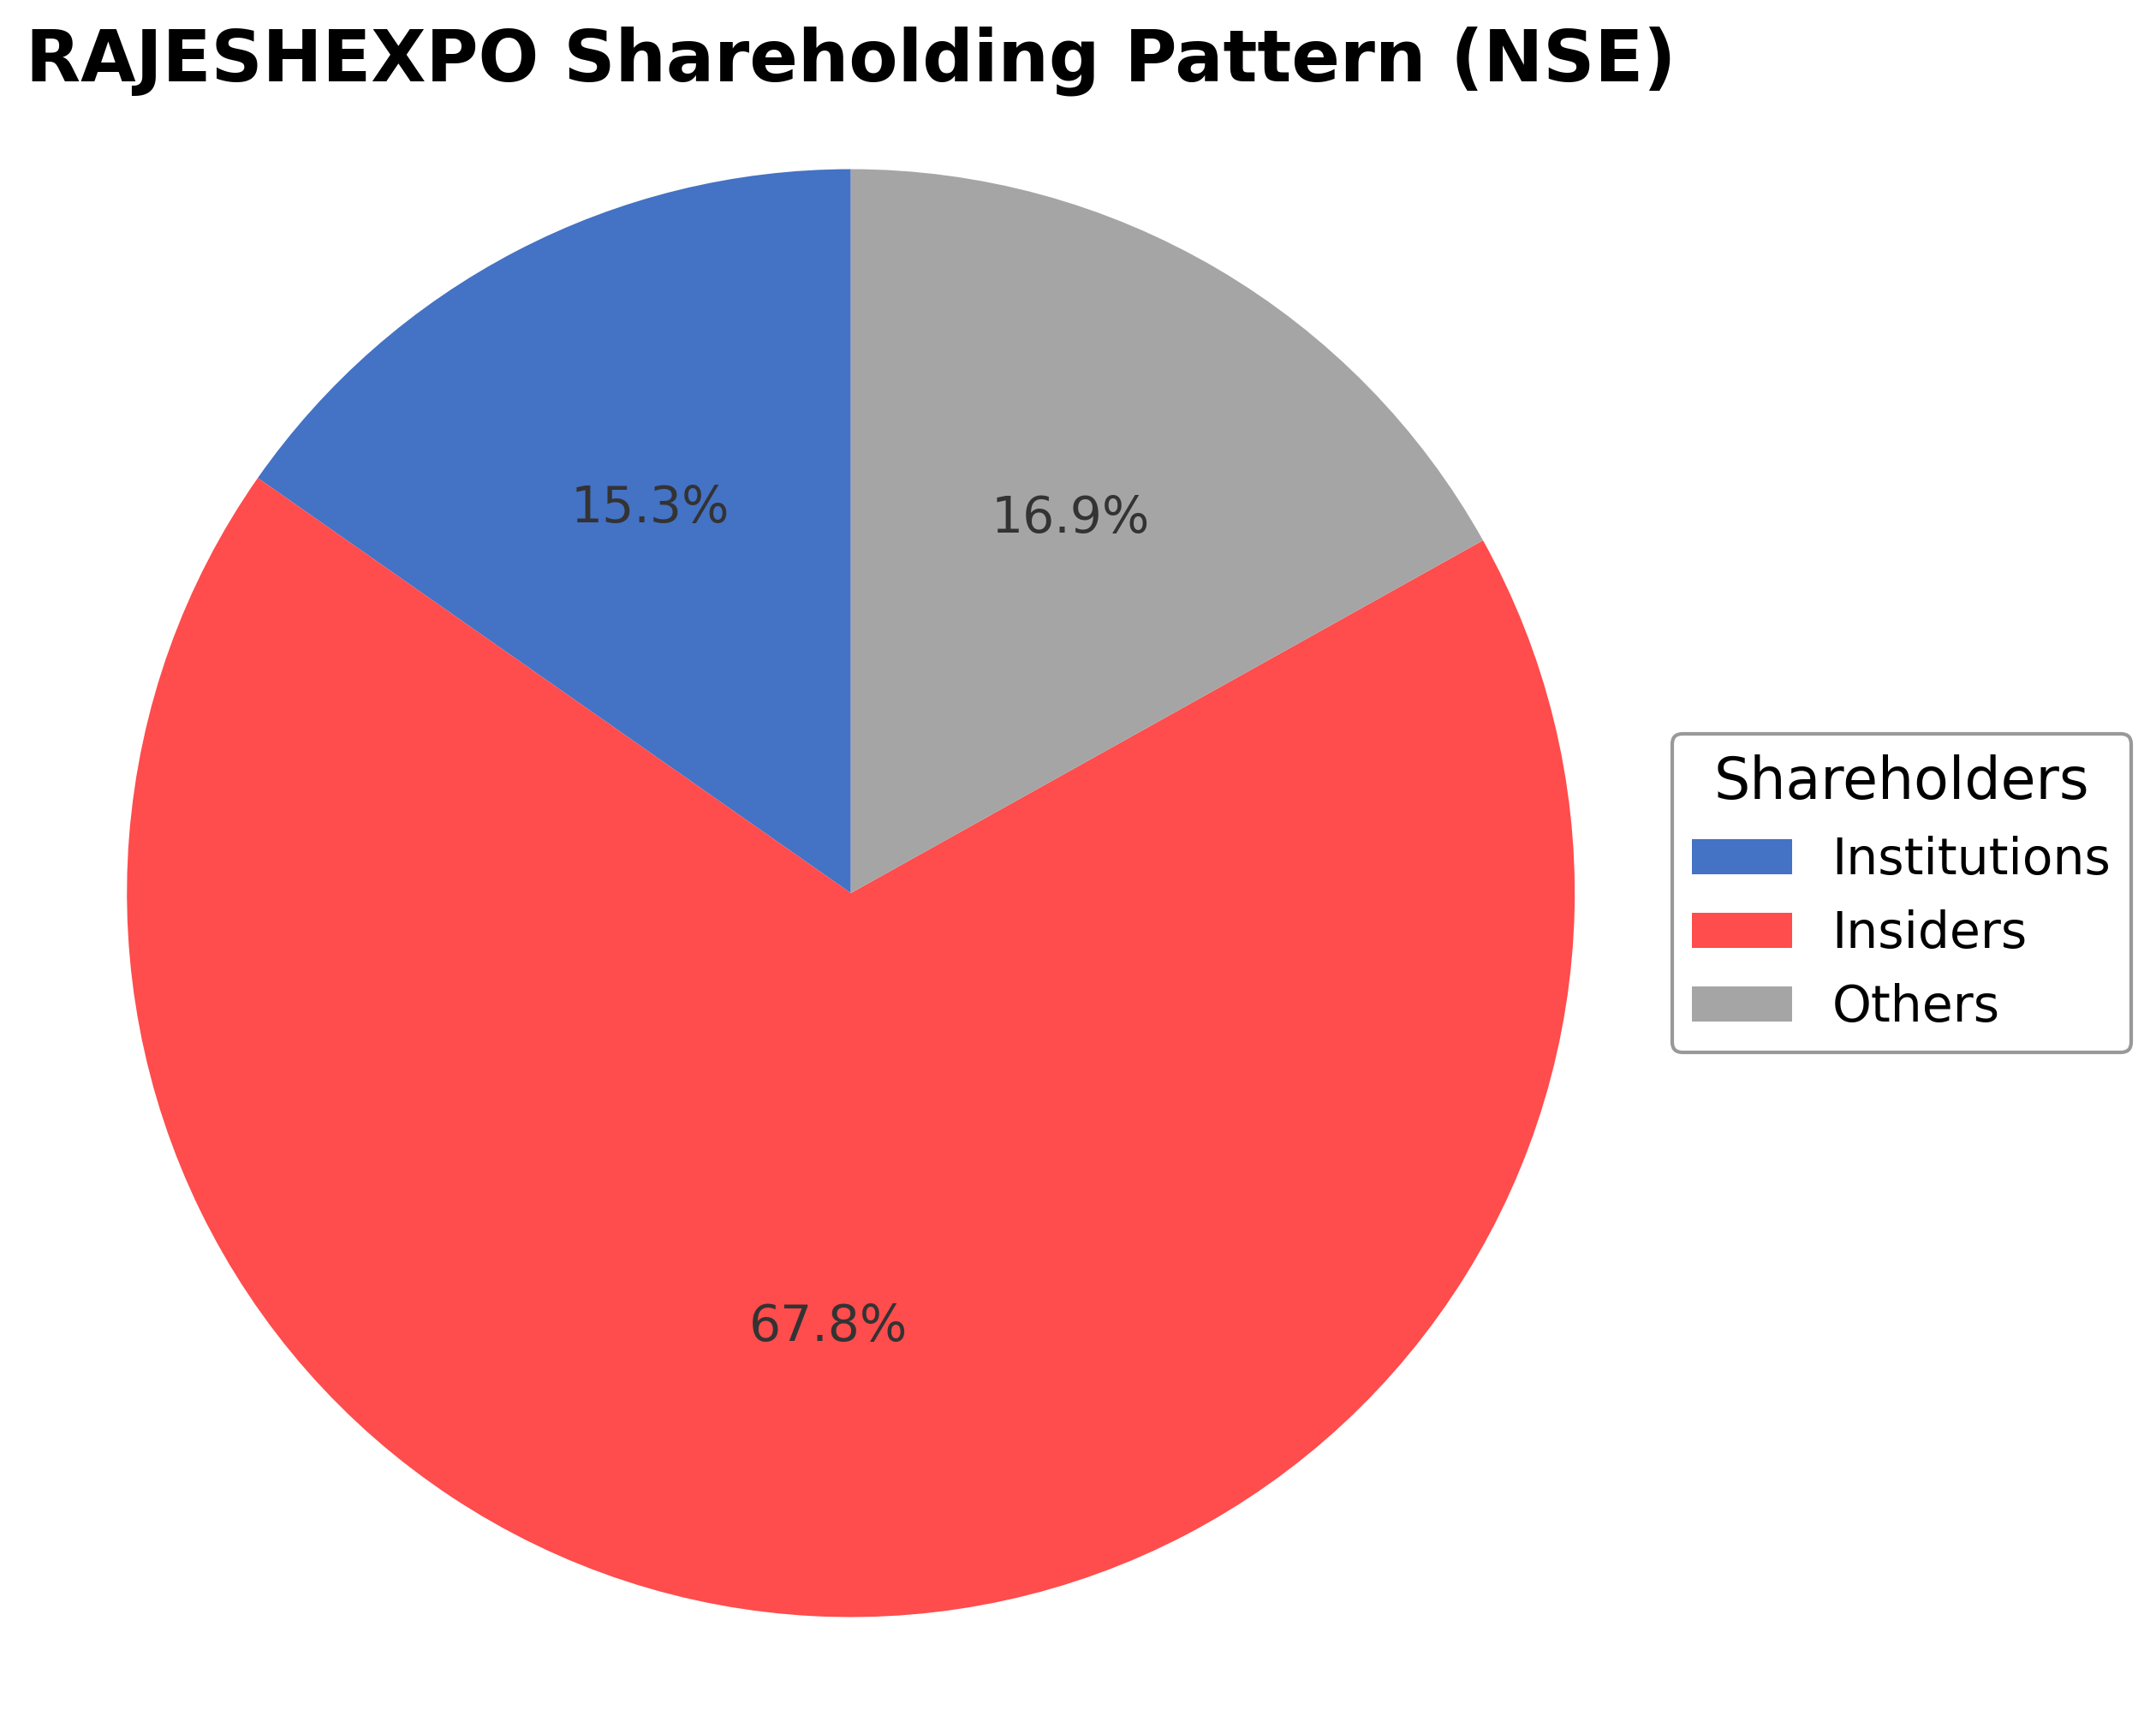
Shareholding Pattern
Sector and Industry Analysis
The gold and precious metals sector is a significant component of the global commodities market, with gold serving both as an investment asset and a raw material for jewelry and industrial applications. The sector has experienced steady growth driven by rising consumer demand, particularly in emerging markets, and geopolitical uncertainties that boost gold's appeal as a safe haven. Major global players include large refiners, miners, and jewelers, with Rajesh Exports Ltd notable for processing approximately 35% of the world's gold, indicating its substantial market presence.
Industry dynamics are shaped by vertical integration, technological advancements in refining, and shifting consumer preferences towards branded and certified gold products. Barriers to entry are high due to capital intensity, stringent quality standards, and the need for extensive distribution networks. Competitive positioning often hinges on scale, supply chain control, and brand trust, with companies like Rajesh Exports leveraging their presence across the entire gold value chain from refining to retailing to maintain a competitive edge.
The regulatory environment for the gold industry involves strict compliance with anti-money laundering (AML) laws, import-export controls, and hallmarking standards to ensure purity and authenticity. Governments also impose tariffs and taxes that can influence pricing and demand patterns. Ongoing regulatory scrutiny aims to enhance transparency and traceability in gold sourcing, which impacts operational practices and requires continuous adaptation by industry participants to maintain compliance and market access.
Note: Analysis synthesized from industry research, market reports, and regulatory filings. Information is subject to change based on market conditions.
Financial Ratios Dashboard
Illustrative Scenario Analysis
DCF Assumptions:
Method: Two-Stage EPS-Priority Model
Financials
Peer Analysis
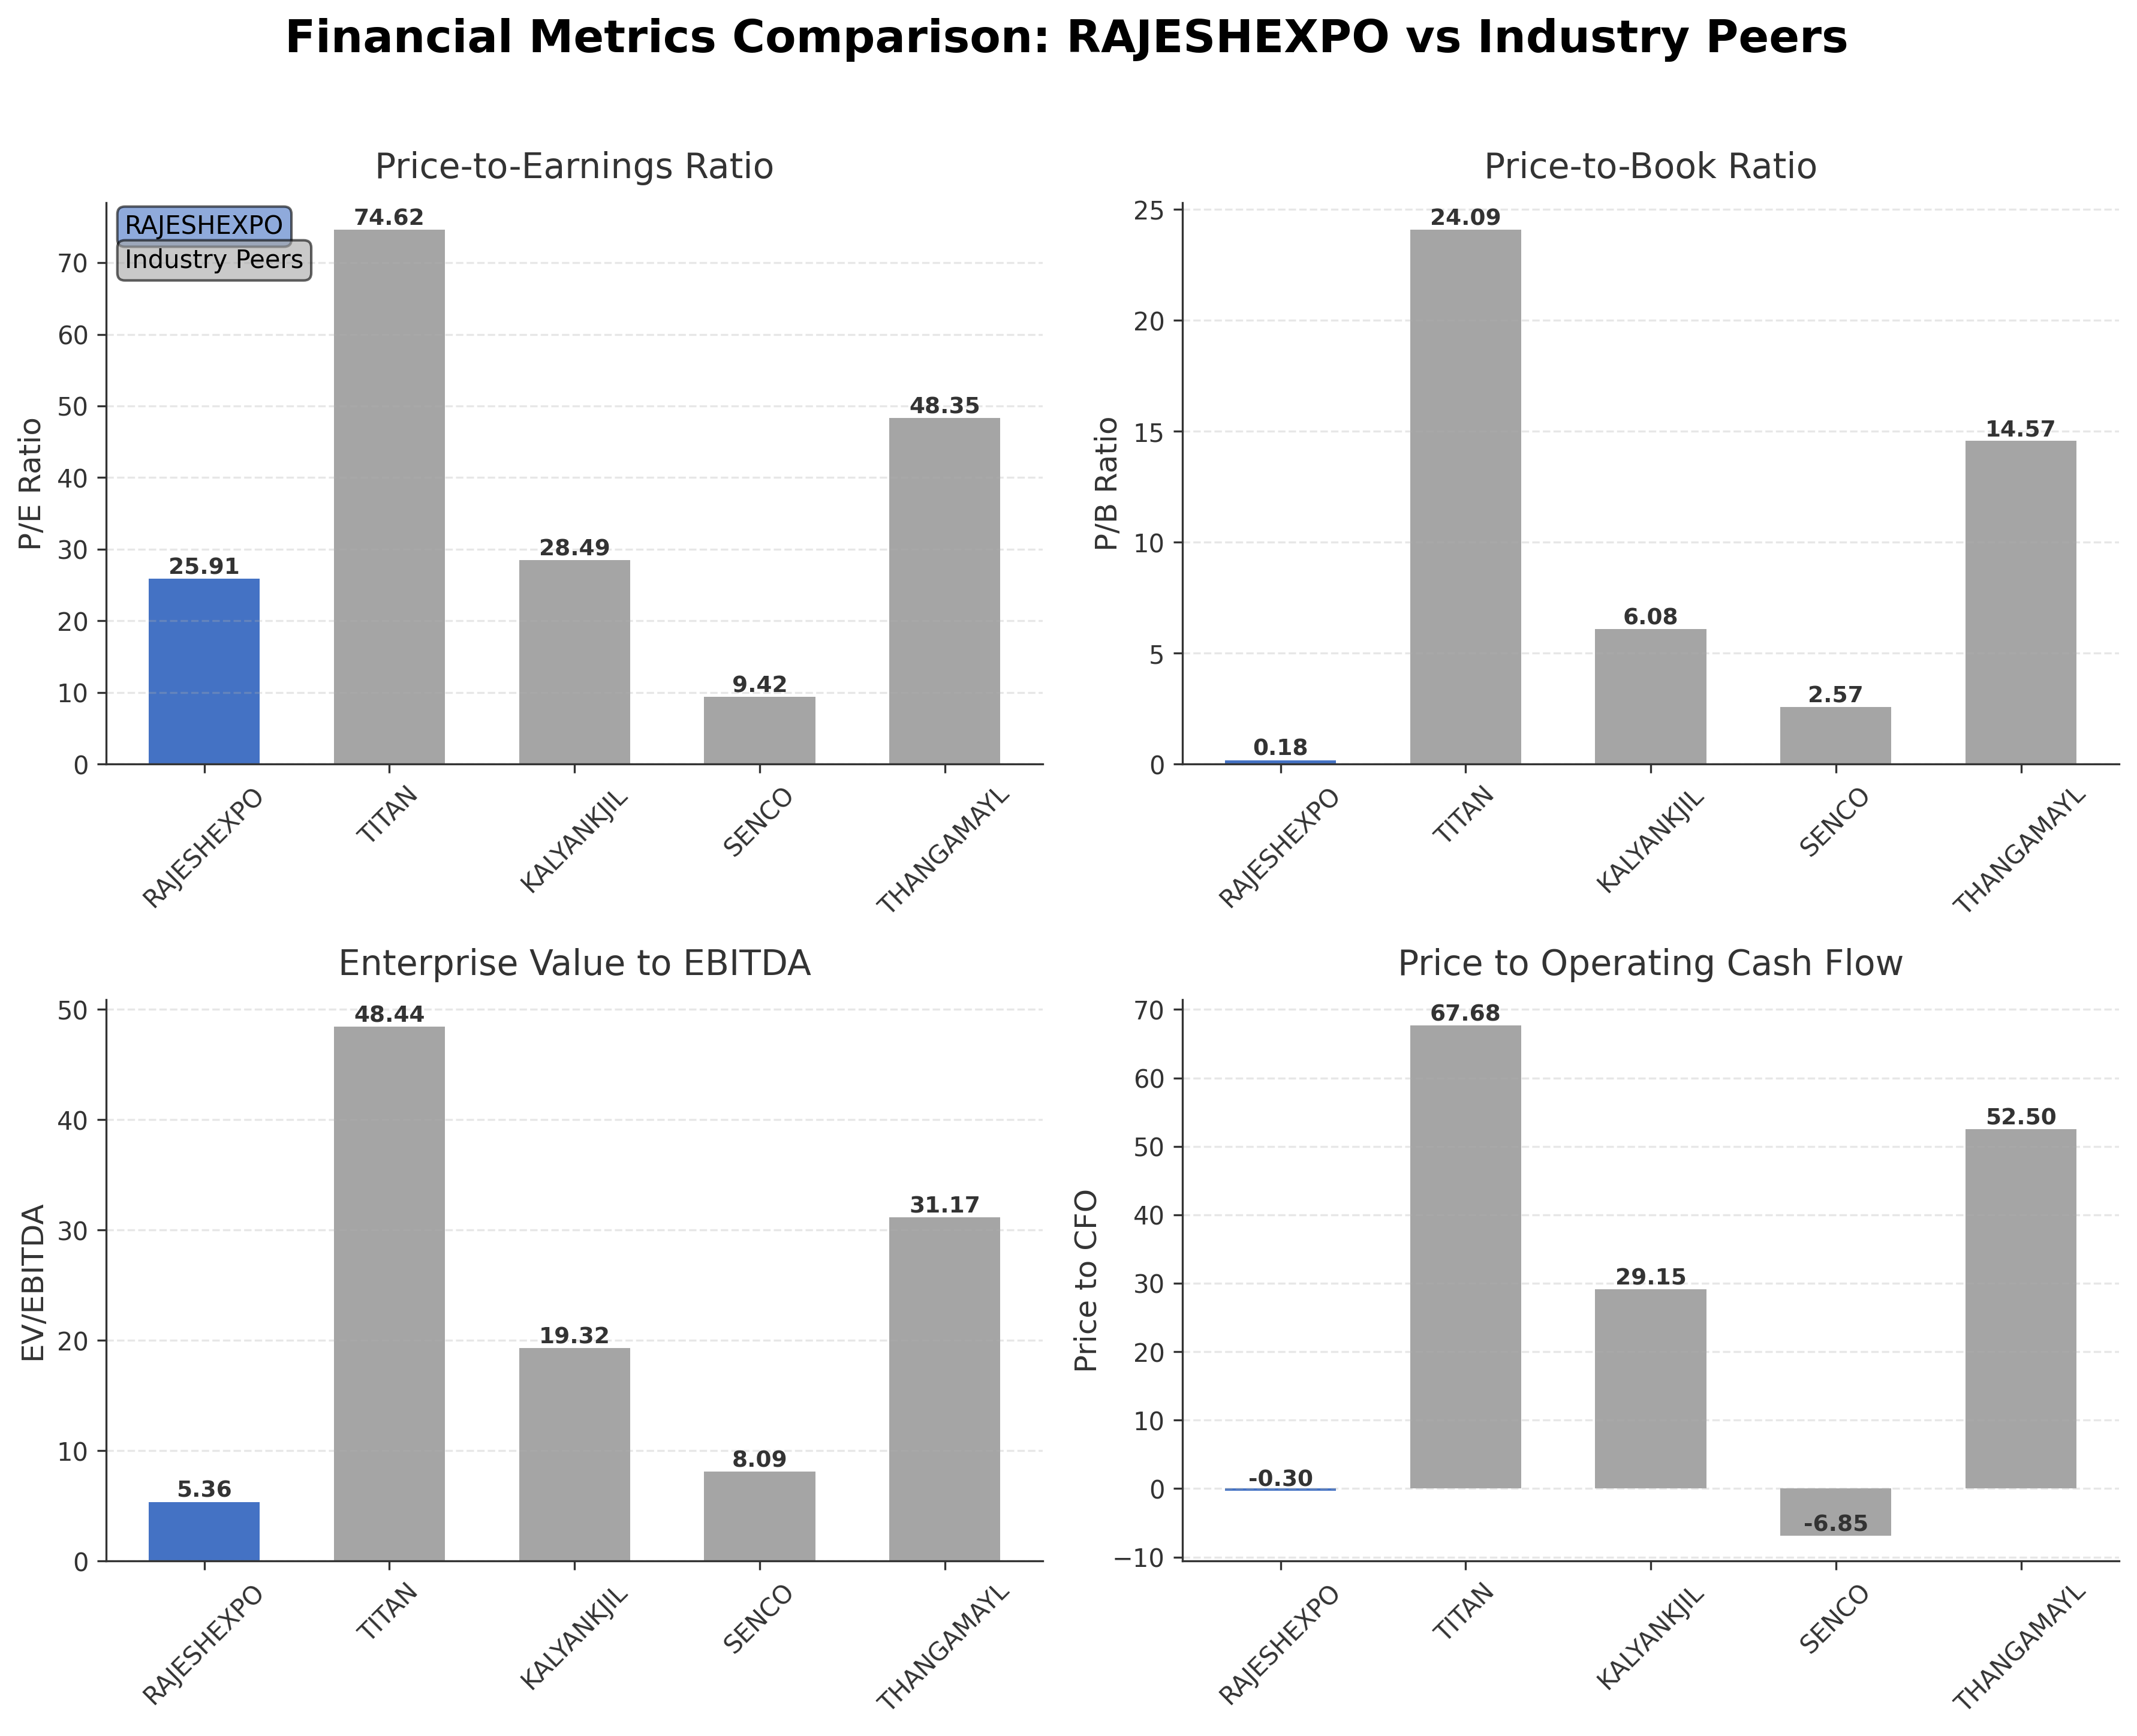
| Company Name | Market Cap | P/E Ratio | P/B Ratio | EV/EBITDA | Price to CFO |
|---|---|---|---|---|---|
| Rajesh Exports Ltd. | ₹29.15B | 25.91 | 0.18 | 5.36 | -0.30 |
| Titan Company Limited | ₹3.78T | 74.62 | 24.09 | 48.44 | 67.68 |
| Kalyan Jewellers India Ltd. | ₹384.02B | 28.49 | 6.08 | 19.32 | 29.15 |
| Senco Gold Ltd. | ₹54.10B | 9.42 | 2.57 | 8.09 | -6.85 |
| Thanga Mayil Jewellery Ltd. | ₹169.21B | 48.35 | 14.57 | 31.17 | 52.50 |
Comparison Analysis: Rajesh Exports Ltd. trades at a significantly lower price-to-book ratio (0.18) and EV/EBITDA (5.36) compared to its peers, indicating potential undervaluation relative to industry standards. However, its return on equity (0.65%) is markedly lower than peers such as Titan (37.13%) and Kalyan Jewellers (24.31%), reflecting weaker profitability. The company’s negative price to cash flow ratio contrasts with positive ratios among most peers, suggesting cash flow challenges. Overall, Rajesh Exports presents a valuation profile that is more conservative but accompanied by lower profitability metrics relative to leading luxury goods companies in India.
Financial Metrics Comparison with Peers
Financial Statements
Comprehensive financial data including income, balance sheet, and cash flow metrics
Income Statement
| fiscal_date | 2026-03-31 | 2025-03-31 | 2024-03-31 | 2023-03-31 | 2022-03-31 |
|---|---|---|---|---|---|
| Sales | 7787.16B | 4230.99B | 2806.76B | 3396.90B | 2431.28B |
| Cost Of Goods | 7780.24B | 4226.15B | 2800.31B | 3376.27B | 2415.33B |
| Gross Profit | 6.92B | 4.84B | 6.45B | 20.62B | 15.95B |
| Operating Expense Other Operating Expenses | 3.58B | 140.71M | 137.05M | 187.41M | 151.84M |
| Operating Income | 545.53M | 2.27B | 3.20B | 15.87B | 12.01B |
| Non Operating Interest Expense | 1.63B | 1.32B | 1.39B | 802.38M | 830.18M |
| Pretax Income | 1.64B | 1.07B | 3.67B | 14.78B | 10.38B |
| Income Tax | 518.61M | 119.97M | 314.12M | 461.74M | 291.45M |
| Net Income | 1.12B | 948.71M | 3.36B | 14.32B | 10.09B |
| Ebit | 3.28B | 2.39B | 5.06B | 15.59B | 11.21B |
| Ebitda | 3.80B | 3.90B | 6.26B | 17.11B | 13.25B |
| Net Income Continuous Operations | 1.64B | 1.07B | 3.67B | 14.78B | 10.38B |
| Preferred Stock Dividends | 0.00 | 0.00 | 0.00 | 0.00 | 0.00 |
| Operating Expense Selling General And Administrative | N/A | 313.64M | 636.72M | 1.38B | 1.09B |
| Non Operating Interest Income | N/A | 575.10M | 1.74B | 79.64M | 111.38M |
| Eps Basic | N/A | 3.21 | 11.36 | 48.51 | 34.18 |
| Eps Diluted | N/A | 3.21 | 11.36 | 48.51 | 34.18 |
| Basic Shares Outstanding | N/A | 295.26M | 295.26M | 295.26M | 295.26M |
| Diluted Shares Outstanding | N/A | 295.26M | 295.26M | 295.26M | 295.26M |
Data provided by Twelve Data
Balance Sheet
| fiscal_date | 2026-03-31 | 2025-03-31 | 2024-03-31 | 2023-03-31 | 2022-03-31 |
|---|---|---|---|---|---|
| Cash And Cash Equivalents | 17.31B | 11.49B | 15.97B | 10.16B | 7.40B |
| Accounts Receivable | 64.42B | 49.33B | 113.04B | 103.56B | 107.09B |
| Total Assets | 408.93B | 293.72B | 220.72B | 228.75B | 239.16B |
| Total Liabilities | 234.76B | 135.44B | 68.25B | 81.51B | 114.70B |
| Long Term Debt | N/A | N/A | N/A | N/A | N/A |
| Shareholders Equity | 174.17B | 158.28B | 152.47B | 147.24B | 124.46B |
Data provided by Twelve Data
Cash Flow Statement
| fiscal_date | 2026-03-31 | 2025-03-31 | 2024-03-31 | 2023-03-31 | 2022-03-31 |
|---|---|---|---|---|---|
| Operating Activities Net Income | 1.64B | 1.07B | 3.67B | 14.78B | 10.38B |
| Operating Activities Other Non Cash Items | -1.05B | 788.01M | 1.39B | 796.54M | 892.25M |
| Operating Activities Accounts Receivable | -15.09B | 62.94B | -9.99B | 4.58B | -3.57B |
| Operating Activities Other Assets Liabilities | -81.83B | -53.49B | -4.21B | -11.72B | -12.73B |
| Operating Activities Operating Cash Flow | -96.32B | 11.30B | -9.14B | 8.44B | -5.02B |
| Investing Activities Capital Expenditures | -426.18M | 10.49B | -678.53M | -7.22B | -876.48M |
| Investing Activities Other Investing Activity | 14.40M | 13.23M | 12.29M | 12.98M | 7.46M |
| Investing Activities Investing Cash Flow | -411.78M | 10.50B | -666.25M | -7.21B | -869.02M |
| Financing Activities Short Term Debt Issuance | 925.54M | 2.68B | -690.41M | -913.00M | -2.06B |
| Financing Activities Other Financing Charges | 2.67B | 520.75M | -1.00K | -1.00K | N/A |
| Financing Activities Financing Cash Flow | 3.59B | 3.20B | -690.41M | -1.05B | -2.36B |
| End Cash Position | 26.15B | 18.91B | 22.67B | 20.90B | 18.09B |
| Free Cash Flow | 3.29B | 77.38B | 2.48B | -2.59B | -920.29M |
| Financing Activities Common Dividends | N/A | N/A | N/A | -135.68M | -295.26M |
Data provided by Twelve Data
Technical Analysis
Key Insights
- Rajesh Exports is currently in a pronounced downtrend with consistent lower lows and lower highs observed in recent price action.
- The stock has key support near ₹76, close to the current price, with resistance levels identified around ₹111 (50-day moving average) and ₹158 (200-day moving average).
- The share price is trading below the 10-day, 50-day, and 200-day moving averages, indicating sustained bearish momentum.
- Momentum indicators show an RSI below 30, signaling oversold conditions; MACD remains negative with no immediate crossover, and stochastic oscillators confirm bearish momentum.
- Across daily, weekly, and monthly timeframes, the trend remains downward with no significant reversal signals at present.
- Potential scenarios include continued downward pressure if support fails, or a consolidation phase if oversold conditions attract short-term technical buying.
Trending News
Summary: The recent rally has pushed the stock to record highs, making it one of the better-performing companies in the gems and jewellery segment. ... The rally in Goldiam International comes at a time when industry peer Rajesh Exports Ltd has witnessed significant weakness in its share price.
Sentiment: positive
Summary: Based on its findings, Sebi alleged that Rajesh Exports misrepresented approximately Rs 15.15 lakh crore, or 99.80 per cent of the revenues generated by its subsidiaries between FY21 and FY25. Disclaimer: Business Today provides stock market news for informational purposes only and should not ...
Sentiment: negative
3. Headline: Rajesh Exports shares hit lower circuit for 6th straight session
Summary: Shares of Rajesh Exports have plummeted nearly 27% since Sebi's June 3 interim order, hitting the lower circuit for six consecutive trading sessions.
Sentiment: negative
4. Headline: Sebi mistook Valcambi's Editda as revenue; all records submitted: REL | Company News - Business Standard
Summary: Home / Companies / News / Sebi mistook Valcambi's Editda as revenue; all records submitted: REL · Rajesh Exports (Photo: Rajesh Exports)Press Trust of India New Delhi · 4 min read Last Updated : Jun 10 2026 | 9:34 PM IST · Gold jewellery maker and exporter Rajesh Exports Ltd, currently under ...
Sentiment: neutral
Summary: Company filings, stock exchange data show differing share counts and unusual voting patterns. Rajesh Exports says the voting process was conducted in a fair and transparent manner and the underlying voting data and reports were sourced directly from the NSDL platform.
Sentiment: neutral
Powered by Brave
Recent Updates
News Summary
As of 2026-06-12. Rajesh Exports has experienced a significant decline in its share price, falling nearly 30% over seven trading sessions following SEBI's interim order barring the company and its chairman from securities market access amid an investigation into alleged financial irregularities. The regulator alleges misrepresentation of revenues and diversion of funds, which the company has strongly denied, emphasizing its debt-free status and transparency. The chairman has also been banned from trading in the company's securities, further impacting market confidence. Despite these challenges, Rajesh Exports has submitted clarifications and records to SEBI, disputing the allegations and highlighting the role of its subsidiary Valcambi in revenue reporting. The stock has hit multiple lower circuit limits, reflecting heightened selling pressure and regulatory uncertainty.
News Sentiment
The overall sentiment from recent updates is predominantly negative due to regulatory actions and allegations of financial misreporting, which have led to sharp share price declines and trading restrictions on key executives. However, the company's clarifications and denial of wrongdoing introduce a neutral tone, suggesting ongoing dispute and investigation rather than conclusive findings. Positive sentiment is limited to competitor gains and the company's assertions of transparency and debt-free operations. This mixed sentiment underscores heightened uncertainty and cautious market behavior surrounding Rajesh Exports.
Source List
Analytical Overview
Analysis Summary
Rajesh Exports’ trailing P/E ratio of 25.91 is in line with the industry average of 25.91, but the forward P/E of 1.97 suggests expectations of substantial earnings growth or re-rating, which contrasts with peers exhibiting higher valuations. The company’s revenue growth rate of 1.433 indicates moderate expansion, though operating cash flow is negative, reflecting potential liquidity pressures despite positive free cash flow. Financial health shows a low debt-to-equity ratio of 5.25, supported by a strong cash balance of INR 25.9 billion, indicating solid liquidity and low leverage. Sector-specific challenges include regulatory scrutiny and market volatility impacting investor confidence, while opportunities lie in the company’s market leadership in gold refining and export capabilities. Considering India-specific factors, regulatory investigations and compliance requirements are critical, alongside evolving consumer demand in the luxury goods segment.
Overall Business and Market Assessment
Supporting Factors: Rajesh Exports’ strong cash position and low debt, its leadership in the gold refining industry, and a valuation profile suggesting potential undervaluation relative to book value
Risk Factors: ongoing regulatory investigations by SEBI, allegations of financial misrepresentation, and resultant market volatility
SWOT Analysis
Strengths
- Rajesh Exports operates one of the largest gold refineries globally, ensuring high product quality.
- The company maintains a strong cash position with low debt levels, supporting financial stability.
- Market leadership in gold refining and manufacturing provides competitive advantages.
- Robust export operations diversify revenue streams beyond the domestic market.
Weaknesses
- Profit margins are extremely thin, limiting earnings scalability.
- Negative operating cash flow indicates potential liquidity management challenges.
- Return on equity and assets are low compared to industry peers.
- Recent regulatory scrutiny has adversely affected market confidence.
Opportunities
- Growing demand for gold products in India and international markets offers expansion potential.
- Innovation in jewelry design and retail branding can enhance market share.
- Potential to leverage global refinery reputation to attract new clients.
- Improved regulatory compliance could restore investor confidence.
Threats
- Ongoing SEBI investigation poses regulatory and reputational risks.
- Market volatility and price fluctuations in gold impact profitability.
- Competitive pressure from other established luxury goods companies.
- Potential disruptions in supply chain or export regulations.
Company Description
Rajesh Exports Ltd. is a renowned company involved in the gold industry, specializing in gold refining and product manufacturing. It plays a crucial role in transforming raw gold into a diverse range of finished goods, such as gold bars, coins, and intricate jewelry designs. Rajesh Exports operates one of the largest gold refineries in the world, giving it a significant position within the market by ensuring the purity and quality of its gold products. Additionally, its operations extend to retail through its branded stores, focusing primarily on the Indian market while also exporting to various international destinations. By continuously innovating and adhering to high-quality standards, Rajesh Exports Ltd. contributes significantly to the gold market, impacting both consumer demand and supply chain dynamics.