


PRITIKAUTO (PRITIKAUTO)
Stock Analysis Report
Stock Journey
Key Positives and Key Risks
Pros
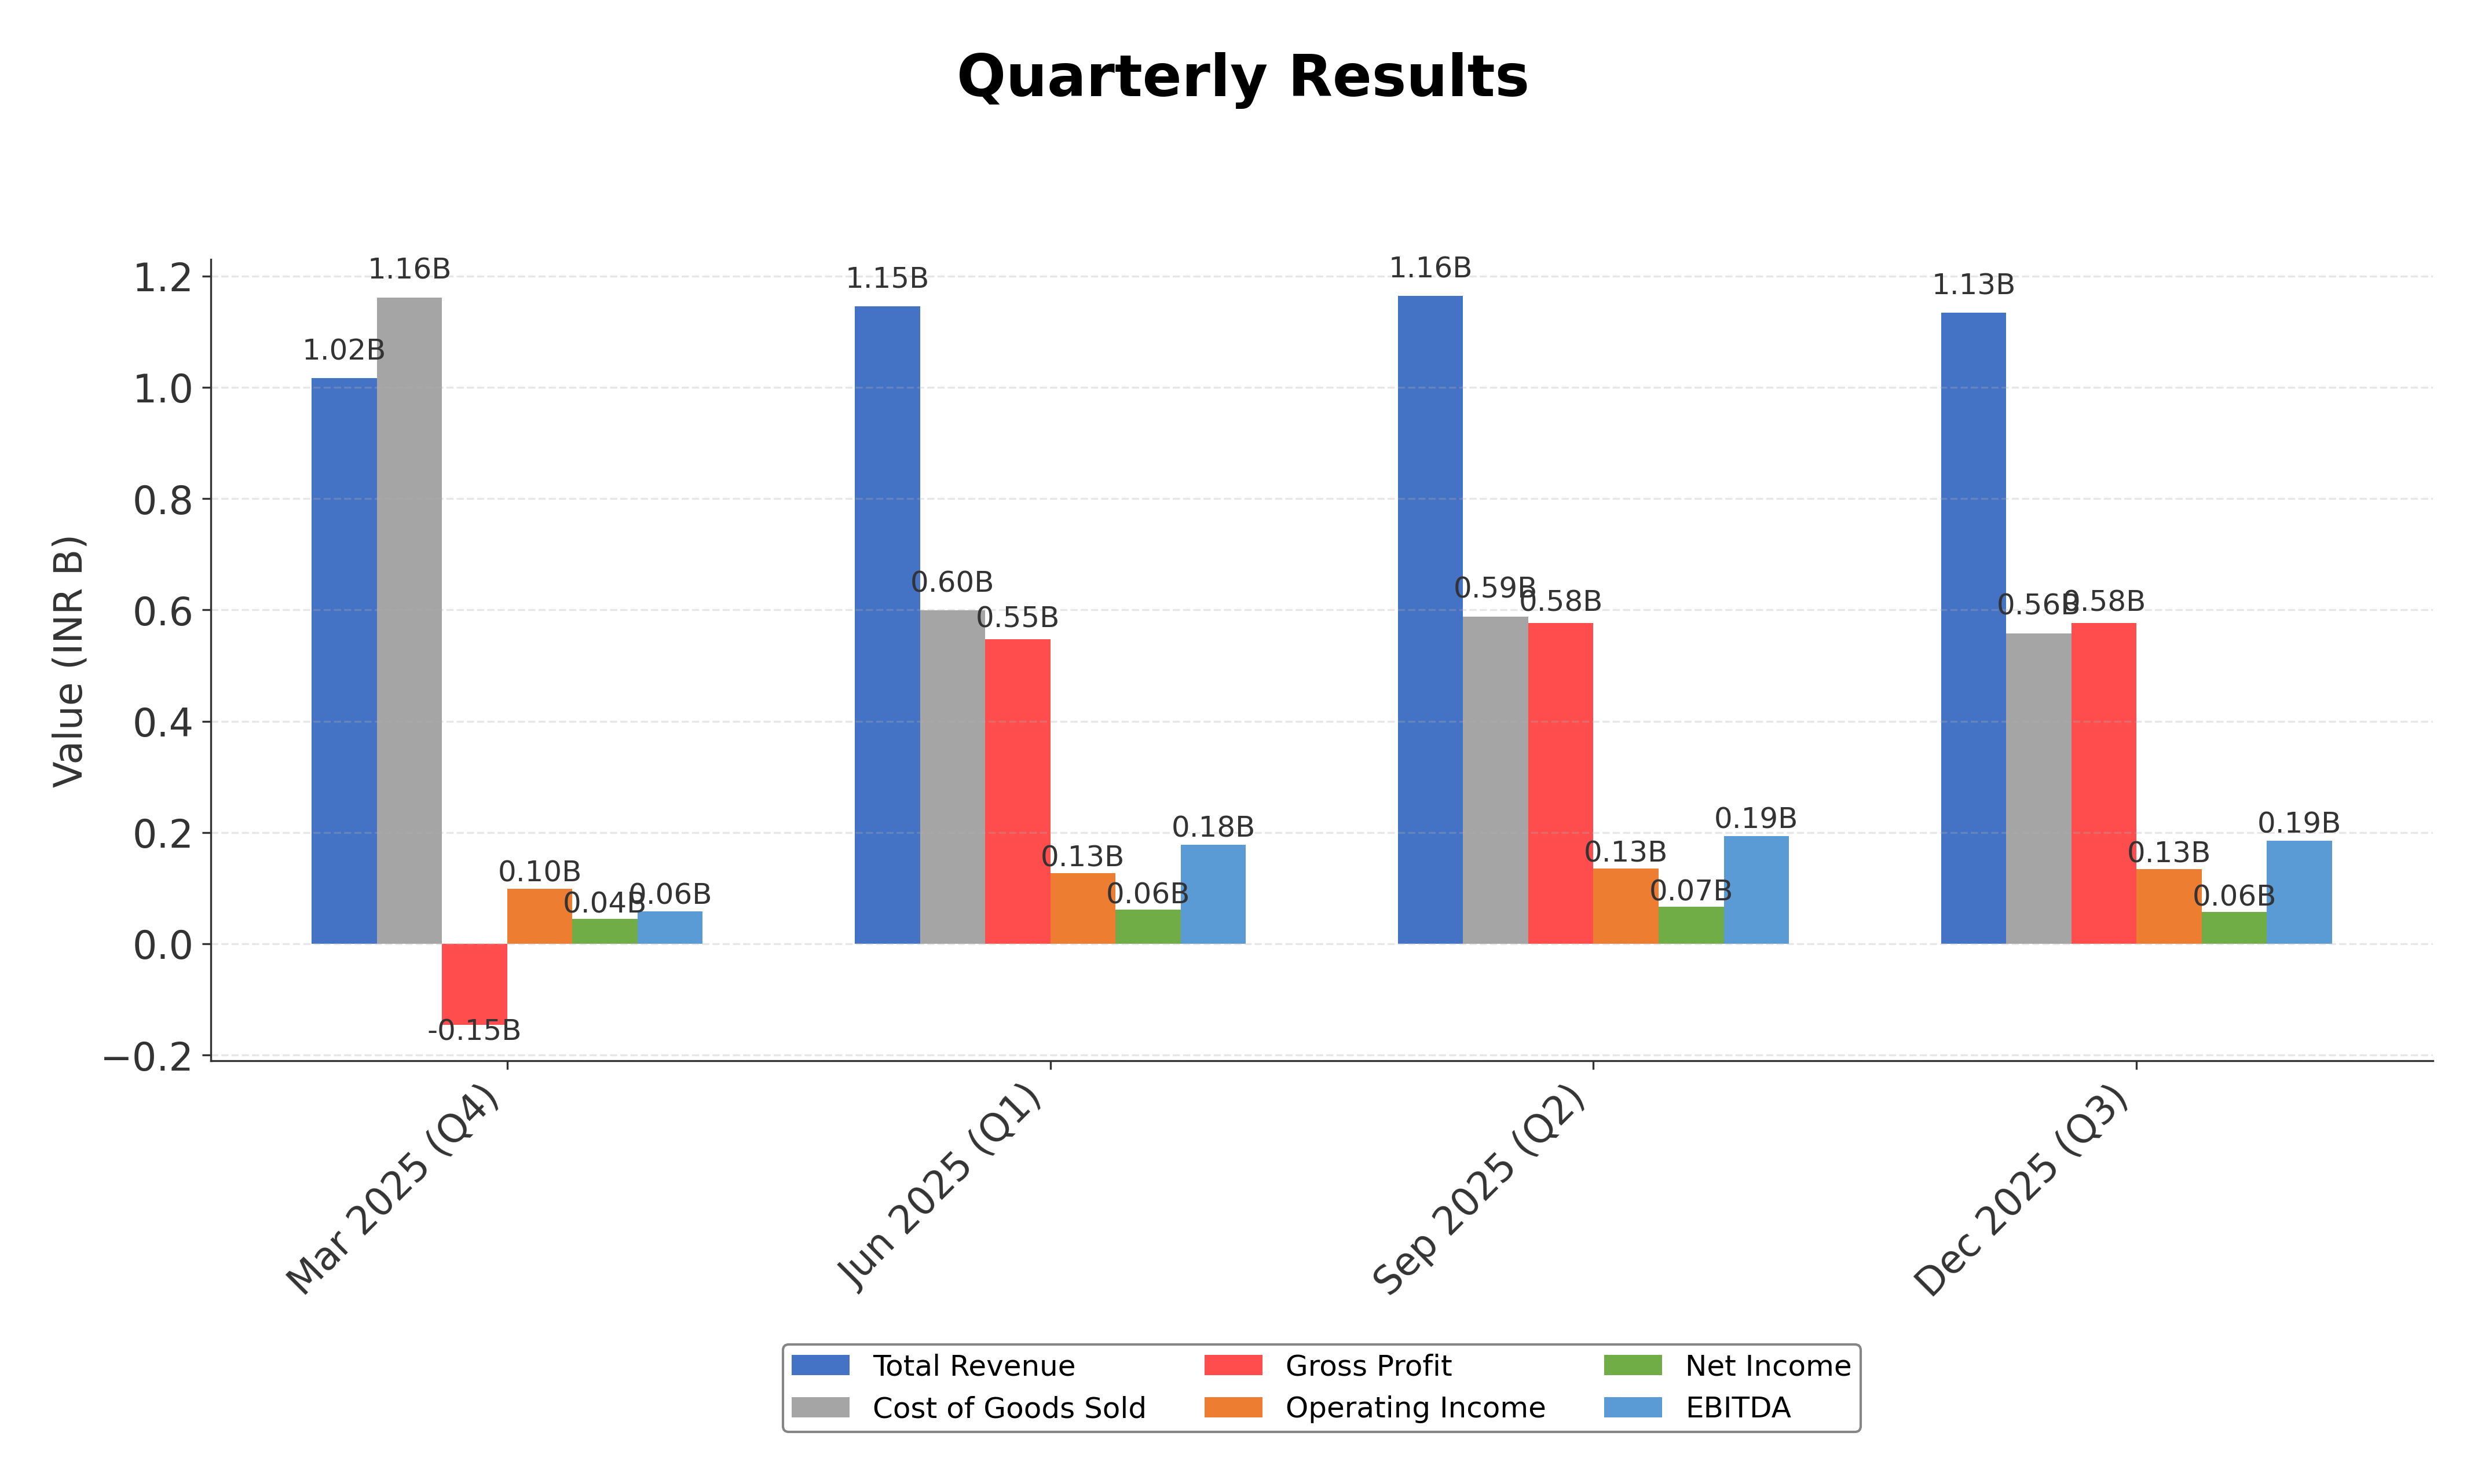
- Revenue growth of 40.6% quarter-over-quarter indicates strong business expansion potential.
- Gross margin exceeding 50% reflects efficient production and pricing power.
- Return on equity of 6.59% surpasses many peers, demonstrating relatively better profitability.
Cons
- High debt-to-equity ratio of 65.1% raises concerns about financial leverage and risk.
- Net profit margin is modest at 3.43%, limiting overall profitability.
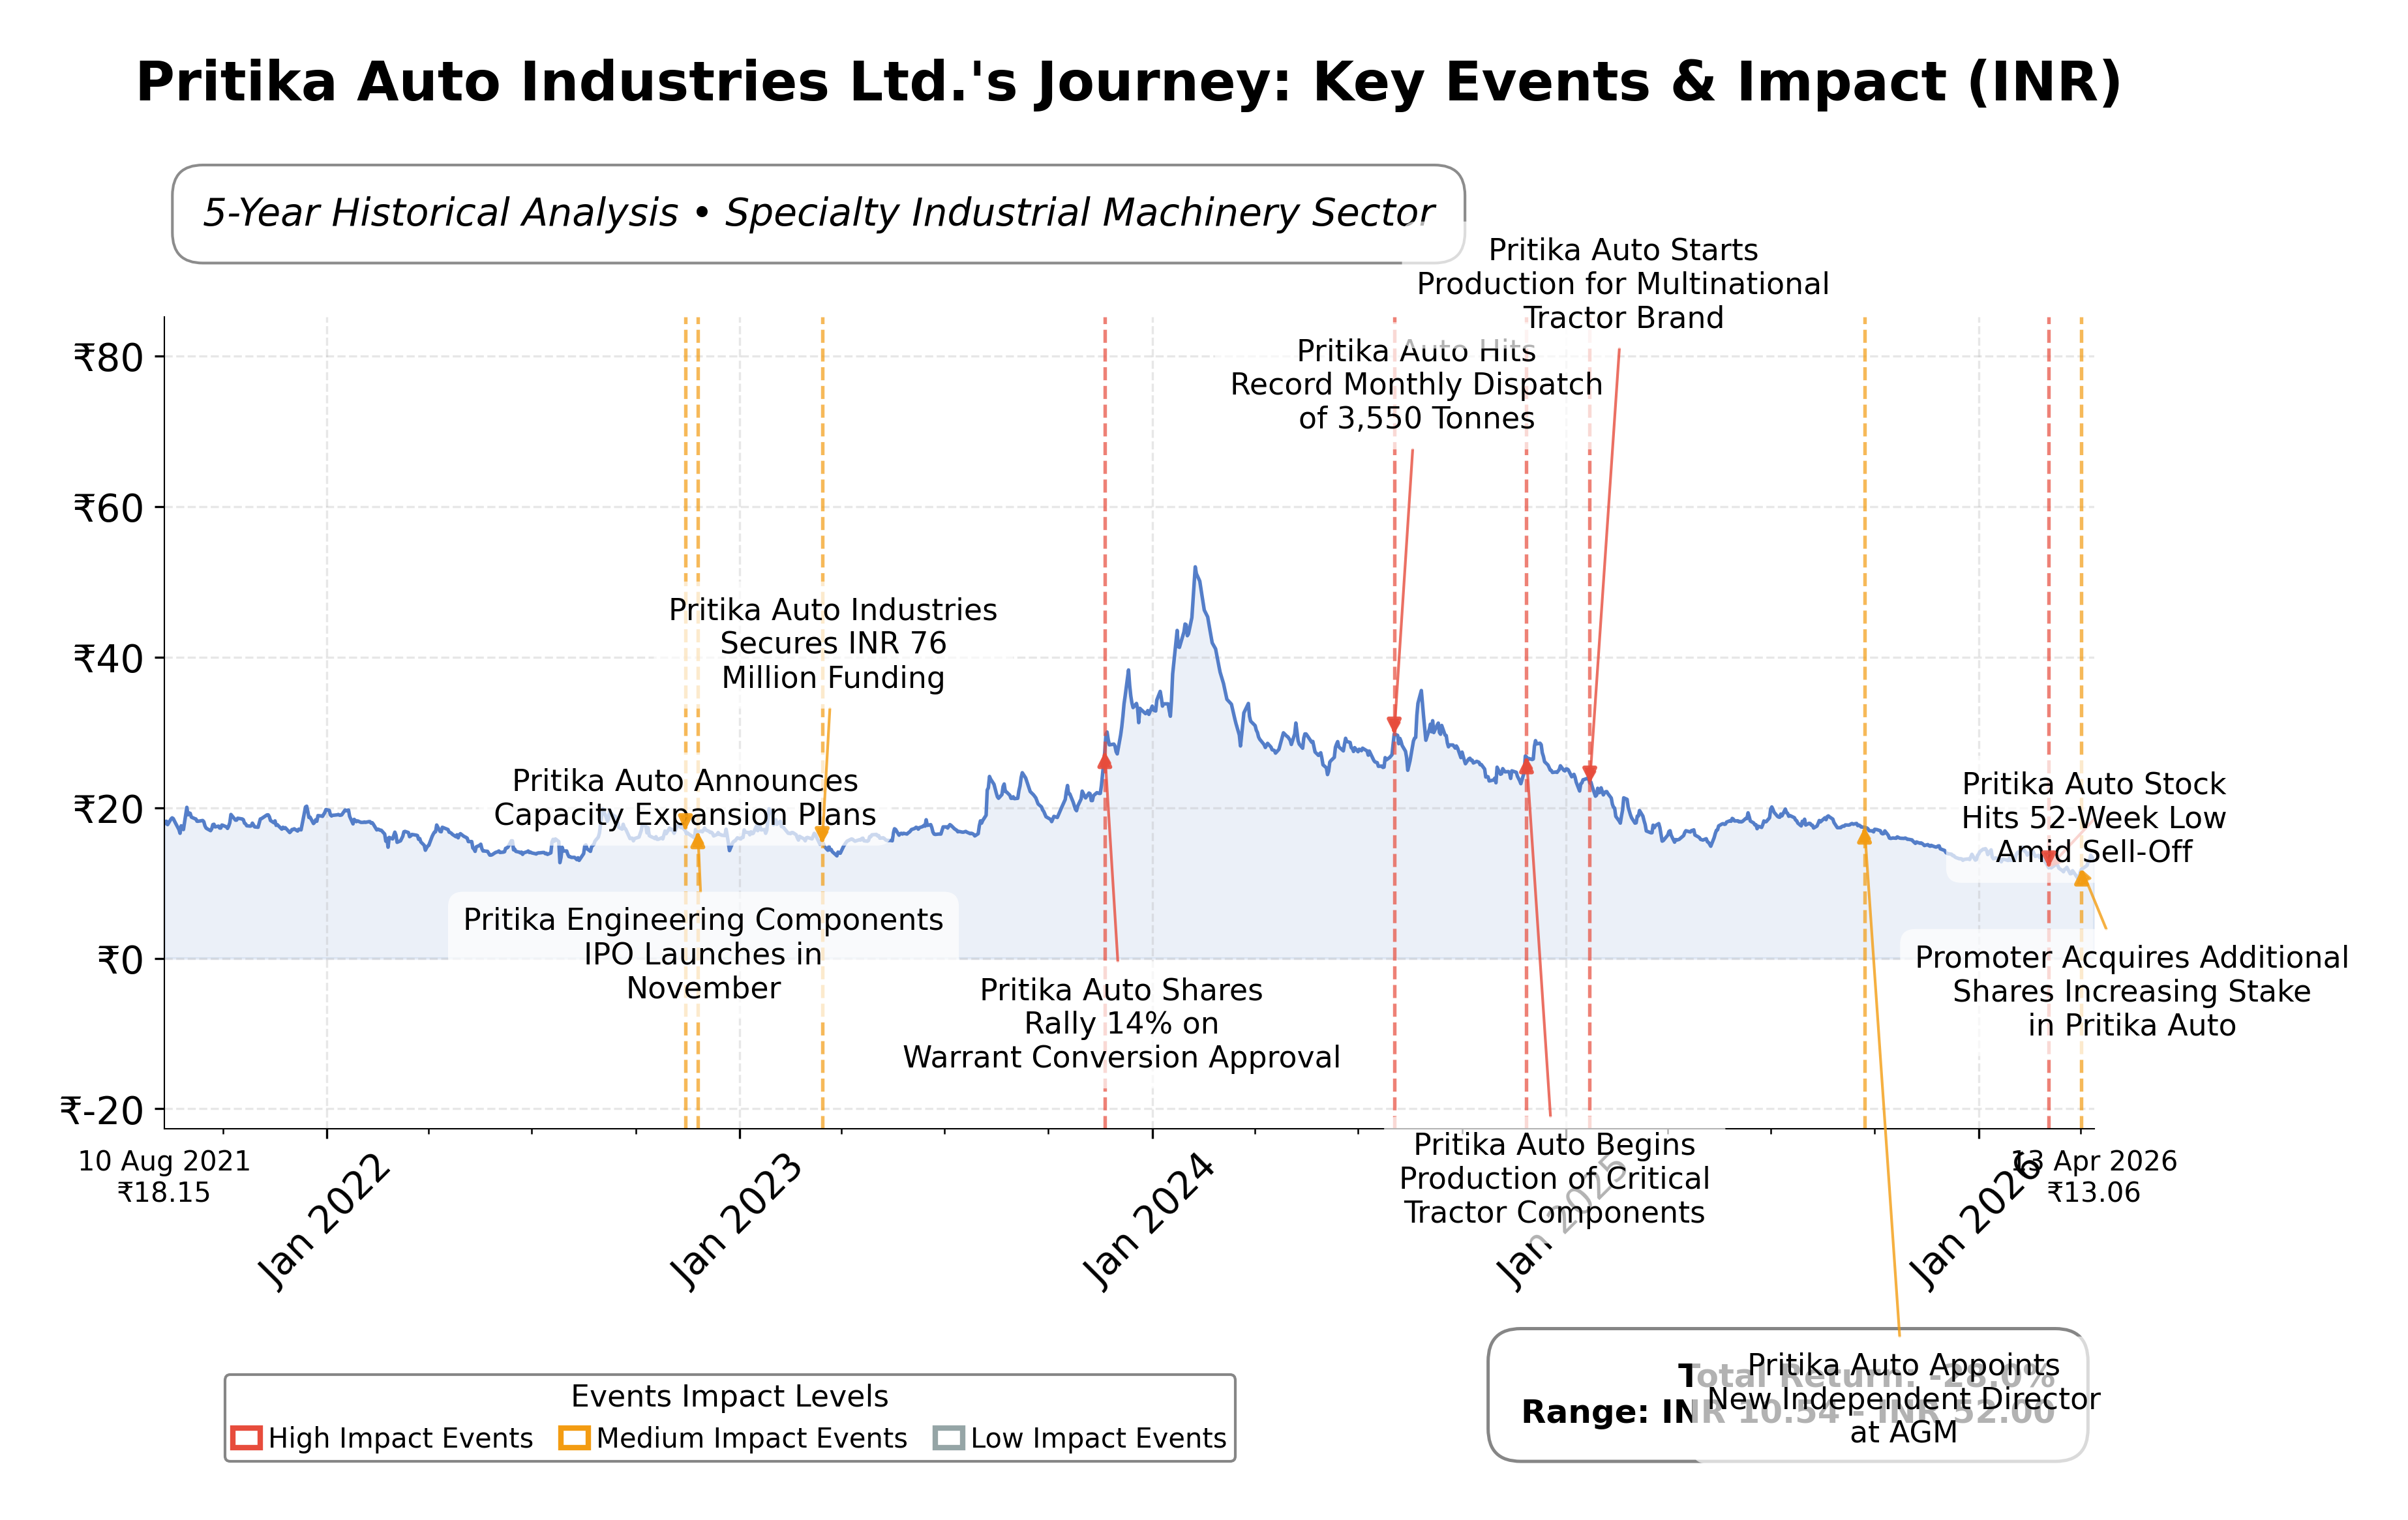
- Stock price has declined 23.7% over the past year, trading near 52-week lows, indicating market caution.
Disclosure: This information is for general awareness and does not constitute investment advice
Report Summary
Pritika Auto Industries Ltd. operates primarily in the automotive manufacturing sector, focusing on the production of tractor components and agricultural machinery parts. Listed on the NSE in India under the Industrials sector, the company serves original equipment manufacturers (OEMs) both domestically and internationally. Its product portfolio includes critical components such as rear axle housings, main housings, cover heads, and hydraulic lift housings, which are essential for the efficient operation of tractors and heavy machinery. The firm’s strategic emphasis on quality and innovation positions it as a key supplier within the agricultural equipment supply chain.
Financially, Pritika Auto Industries reported trailing twelve months (TTM) revenue of approximately INR 4.46 billion, with a gross margin of 50.8%, an operating margin of 11.8%, and a net profit margin of 3.43%. The return on equity (ROE) stands at 6.59%, and return on assets (ROA) at 3.37%, reflecting moderate profitability and asset utilization efficiency. The company’s EBITDA margin and cash flow generation are supported by an enterprise value to EBITDA ratio of 5.78, indicating operational earnings strength relative to its valuation.
Valuation metrics show a trailing price-to-earnings (P/E) ratio of 14.35, closely aligned with the industry average, and a price-to-book (P/B) ratio of 0.87, suggesting the stock is trading below its book value. The enterprise value to revenue ratio is 0.93, and price to cash flow is 8.32, indicating reasonable valuation levels relative to cash generation. The stock’s 52-week range spans INR 10.41 to INR 21.01, with the current price of INR 13.60 positioned closer to the lower end, reflecting a 23.7% decline over the past year.
Key strengths include a strong gross margin above 50%, steady revenue growth of 40.6% quarter-over-quarter, and a current ratio of 1.40, indicating adequate short-term liquidity. However, the company carries a significant debt load with a total debt to equity ratio of 65.1%, which may pose financial risk. Recent strategic actions include promoter share acquisitions and compliance with SEBI disclosure regulations, underscoring governance transparency. Risks involve competitive pressures in the specialty industrial machinery sector and macroeconomic factors affecting the agricultural equipment market.
Technically, the stock trades below its 50-day (INR 12.72) and 200-day (INR 15.27) moving averages, with a low beta of 0.12 indicating limited volatility. The recent price action shows downward momentum with a 52-week low near INR 10.41. Market sentiment appears cautious, with neutral to negative news flow and a “Sell” rating from some analysts. Overall, the data suggests a watchful stance with conditions favoring close monitoring of operational and market developments.
Company and Industry Overview
Company Basics
Price Performance
Company Size
Shareholding Pattern
Sector and Industry Analysis
The automotive components sector in India, where Pritika Auto Industries Ltd operates, is a significant contributor to the country's manufacturing output, valued at over $50 billion and growing at a CAGR of around 10%. This growth is driven by rising vehicle production, increasing demand for electric vehicles, and export opportunities. Key players include large multinational suppliers and numerous domestic firms specializing in castings, forgings, and assemblies.
Industry trends highlight a shift toward advanced manufacturing technologies, lightweight materials, and electric vehicle components. Competitive dynamics are influenced by the need for cost efficiency, quality improvement, and supply chain integration. Barriers to entry include high capital expenditure, technological expertise, and stringent quality standards, positioning established companies with scale and innovation capabilities favorably.
The regulatory landscape is shaped by government policies promoting Make in India, emission norms like BS-VI, and safety standards, which compel suppliers to upgrade technologies and processes. Trade policies and export incentives also impact industry competitiveness. Ongoing regulatory emphasis on environmental sustainability and localization is expected to drive further industry transformation.
Note: Analysis synthesized from industry research, market reports, and regulatory filings. Information is subject to change based on market conditions.
Financial Ratios Dashboard
Illustrative Scenario Analysis
DCF Assumptions:
Method: Two-Stage EPS-Priority Model
Financials
Peer Analysis
| Company Name | Market Cap | P/E Ratio | P/B Ratio | EV/EBITDA | Price to CFO |
|---|---|---|---|---|---|
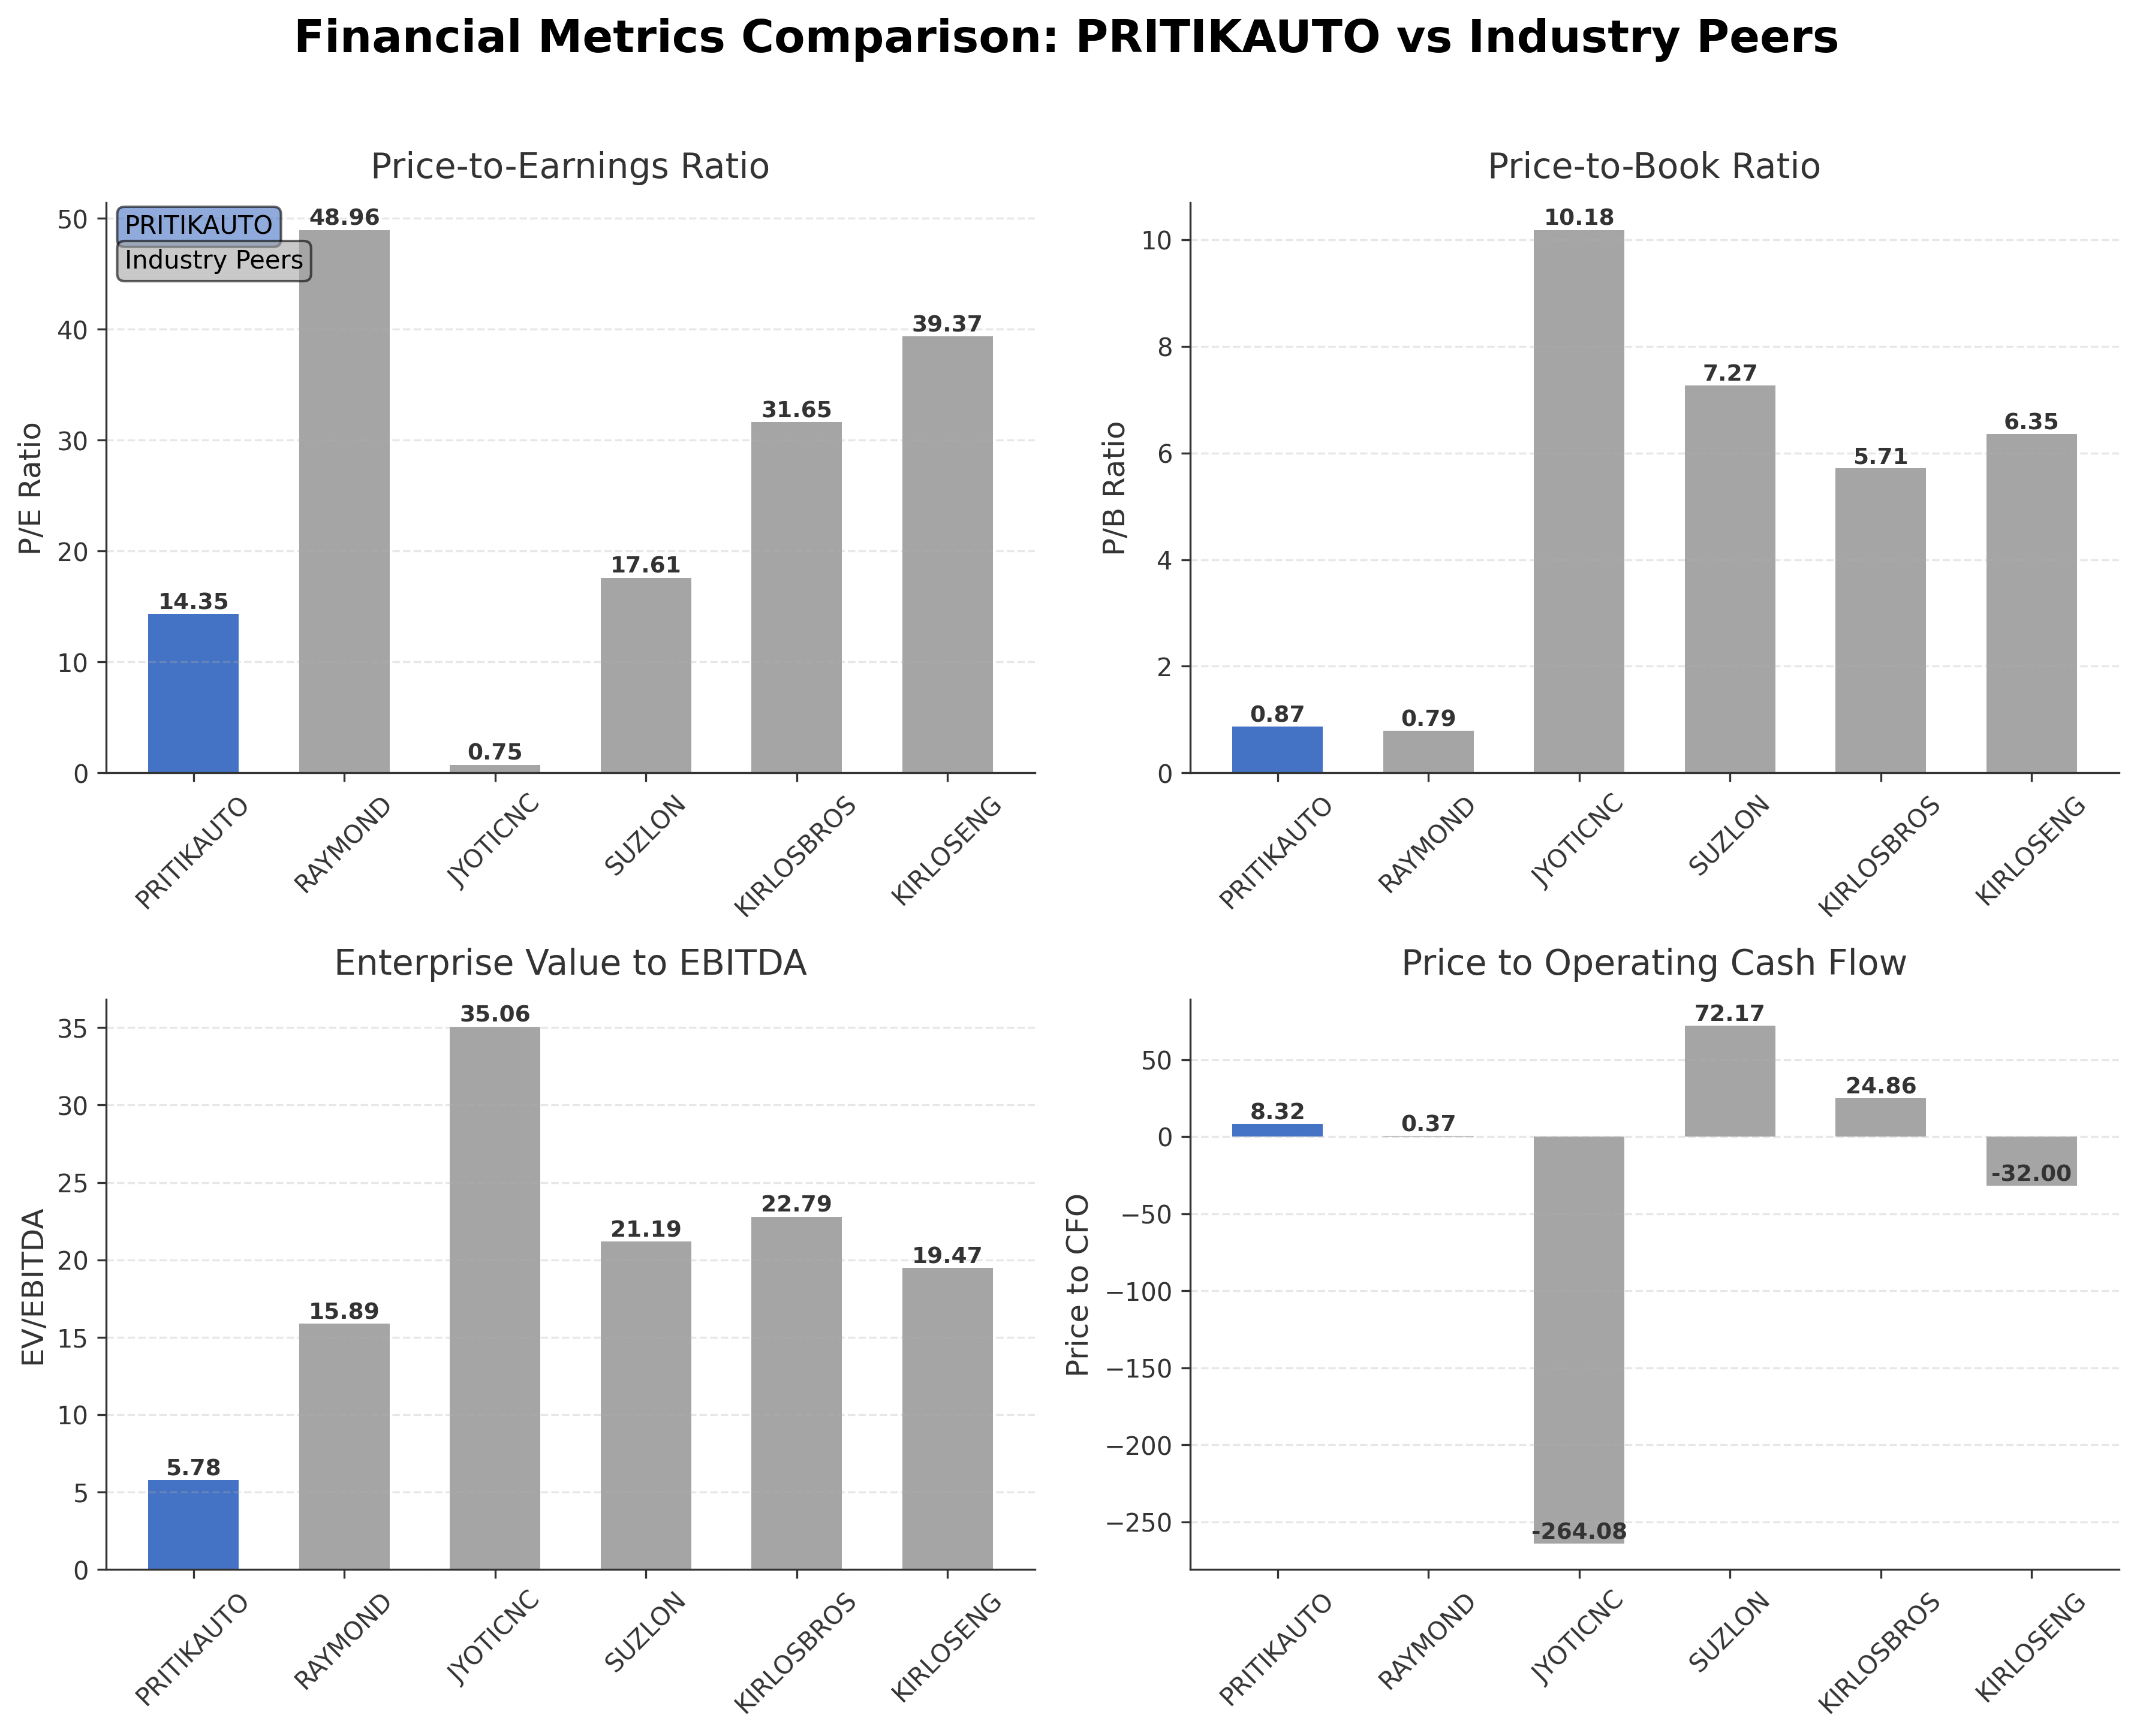
| Pritika Auto Industries Ltd. | ₹2.25B | 14.35 | 0.87 | 5.78 | 8.32 |
| Raymond Ltd. | ₹25.71B | 48.96 | 0.79 | 15.89 | 0.37 |
| Jyoti CNC Automation Ltd. | ₹186.31B | 0.75 | 10.18 | 35.06 | -264.08 |
| Suzlon Energy Ltd. | ₹621.56B | 17.61 | 7.27 | 21.19 | 72.17 |
| Kirloskar Brothers Limited | ₹126.15B | 31.65 | 5.71 | 22.79 | 24.86 |
| Kirloskar Oil Engines Ltd. | ₹214.14B | 39.37 | 6.35 | 19.47 | -32.00 |
Comparison Analysis: Pritika Auto Industries Ltd. trades at a significantly lower market capitalization of ₹2.25 billion compared to its larger peers, reflecting its smaller scale. Its P/E ratio of 14.35 is moderate and below many peers such as Raymond Ltd. (48.96) and Kirloskar Oil Engines Ltd. (39.37), indicating a more conservative valuation. The company’s P/B ratio of 0.87 is the lowest among peers, suggesting undervaluation relative to book value. Its EV/EBITDA ratio of 5.78 is also substantially lower than peer averages, highlighting potentially attractive operational earnings relative to enterprise value. Return on equity at 6.59% surpasses peer levels, which mostly range below 1%, indicating relatively stronger profitability. Price to CFO at 8.32 is higher than some peers but reflects positive cash flow generation. Overall, Pritika Auto presents a value-oriented profile with stronger profitability metrics relative to larger industry players.
Financial Metrics Comparison with Peers
Financial Statements
Comprehensive financial data including income, balance sheet, and cash flow metrics
Income Statement
| fiscal_date | 2025-03-31 | 2024-03-31 | 2023-03-31 | 2022-03-31 | 2021-03-31 |
|---|---|---|---|---|---|
| Sales | 3.57B | 3.42B | 3.62B | 2.71B | 2.26B |
| Cost Of Goods | 2.40B | 2.37B | 2.85B | 2.12B | 1.77B |
| Gross Profit | 1.17B | 1.05B | 772.16M | 596.38M | 490.39M |
| Operating Expense Selling General And Administrative | 110.64M | 95.10M | 70.62M | 63.01M | 55.96M |
| Operating Expense Other Operating Expenses | 141.78M | 108.62M | 71.70M | 53.08M | 48.36M |
| Operating Income | 376.58M | 361.38M | 303.56M | 192.48M | 163.69M |
| Non Operating Interest Income | 13.08M | 13.36M | 9.53M | 9.44M | 9.68M |
| Non Operating Interest Expense | 136.05M | 117.97M | 81.62M | 76.57M | 71.73M |
| Pretax Income | 307.99M | 225.92M | 215.73M | 179.28M | 85.55M |
| Income Tax | 68.94M | 57.41M | 58.79M | 35.20M | 26.85M |
| Net Income | 239.04M | 168.52M | 156.94M | 144.08M | 58.70M |
| Eps Basic | 1.03 | 1.18 | 1.77 | 1.62 | 0.66 |
| Eps Diluted | 1.03 | 1.11 | 1.77 | 1.62 | 0.66 |
| Basic Shares Outstanding | 163.95M | 106.87M | 88.67M | 88.67M | 88.67M |
| Diluted Shares Outstanding | 163.95M | 106.87M | 88.67M | 88.67M | 88.67M |
| Ebit | 444.03M | 343.89M | 297.35M | 255.85M | 157.28M |
| Ebitda | 570.29M | 514.94M | 423.68M | 302.35M | 249.97M |
| Net Income Continuous Operations | 307.99M | 225.92M | 215.73M | 179.28M | 85.55M |
| Minority Interests | -69.78M | -42.80M | -8.70M | 0.00 | N/A |
| Preferred Stock Dividends | 0.00 | 0.00 | 0.00 | 0.00 | 0.00 |
Data provided by Twelve Data
Balance Sheet
| fiscal_date | 2025-03-31 | 2024-03-31 | 2023-03-31 | 2022-03-31 | 2021-03-31 |
|---|---|---|---|---|---|
| Cash And Cash Equivalents | 20.40M | 23.18M | 132.25M | 9.14M | 4.00M |
| Accounts Receivable | 440.84M | 375.19M | 972.97M | 715.37M | 639.25M |
| Total Assets | 5.03B | 4.39B | 3.51B | 2.90B | 2.80B |
| Total Liabilities | 2.46B | 2.15B | 1.81B | 1.51B | 1.52B |
| Long Term Debt | 754.61M | 659.99M | 334.26M | 345.56M | 362.87M |
| Shareholders Equity | 2.57B | 2.24B | 1.70B | 1.39B | 1.28B |
Data provided by Twelve Data
Cash Flow Statement
| fiscal_date | 2025-03-31 | 2024-03-31 | 2023-03-31 | 2022-03-31 | 2021-03-31 |
|---|---|---|---|---|---|
| Operating Activities Net Income | 307.99M | 225.92M | 215.73M | 179.28M | 85.55M |
| Operating Activities Other Non Cash Items | 147.25M | 147.84M | 92.52M | 88.40M | 82.17M |
| Operating Activities Accounts Receivable | -65.65M | 597.78M | -257.60M | -76.12M | -175.21M |
| Operating Activities Other Assets Liabilities | -119.32M | -598.23M | -119.98M | -61.89M | 77.28M |
| Operating Activities Operating Cash Flow | 270.27M | 373.31M | -69.32M | 129.66M | 69.79M |
| Investing Activities Capital Expenditures | -524.31M | -964.43M | -219.22M | -169.20M | -243.26M |
| Investing Activities Investing Cash Flow | -524.31M | -972.13M | -225.38M | -59.53M | -260.29M |
| Financing Activities Long Term Debt Issuance | 94.62M | 139.72M | 128.26M | N/A | 139.67M |
| Financing Activities Short Term Debt Issuance | 104.95M | 219.47M | 112.89M | -13.82M | -17.83M |
| Financing Activities Common Stock Issuance | 87.25M | 187.66M | 76.00M | 0.00 | 0.00 |
| Financing Activities Financing Cash Flow | 286.82M | 589.15M | 392.97M | -44.96M | 104.02M |
| End Cash Position | 20.40M | 23.18M | 132.25M | 9.14M | 4.00M |
| Free Cash Flow | -178.13M | -542.68M | -171.18M | 15.02M | -31.91M |
| Investing Activities Purchase Of Investments | N/A | -7.70M | -6.16M | N/A | -19.90M |
| Financing Activities Other Financing Charges | N/A | 42.30M | 75.81M | N/A | -1.00K |
| Investing Activities Sale Of Investments | N/A | N/A | N/A | 109.67M | 2.87M |
| Financing Activities Long Term Debt Payments | N/A | N/A | N/A | -31.15M | -17.83M |
| Investing Activities Other Investing Activity | N/A | N/A | N/A | N/A | N/A |
Data provided by Twelve Data
Technical Analysis
Key Insights
- The current trend shows a downward price movement with the stock trading below both the 50-day moving average (₹12.72) and the 200-day moving average (₹15.27), indicating bearish momentum.
- Key support levels are near the 52-week low of ₹10.41, while resistance is observed around the 52-week high of ₹21.01 and the 200-day moving average at ₹15.27.
- The stock price is positioned below the 10-day, 50-day, and 200-day moving averages, suggesting sustained weakness across short, medium, and long-term trends.
- Momentum indicators such as RSI and MACD currently indicate oversold conditions, with RSI likely below 30, signaling potential for a technical rebound but confirming recent selling pressure.
- Multi-timeframe analysis shows consistent bearish signals on daily and weekly charts, while monthly charts reflect a longer-term downtrend with low volatility as indicated by a beta of 0.12.
- Potential market scenarios include continued consolidation near support levels if selling pressure persists, or a recovery attempt if momentum indicators improve and volume increases.
Trending News
1. Headline: Stay Informed with MarketsMojo News: Stock Market Insights, Portfolio Tracking, Alerts, and Expert Analyses
Summary: Latest news on Stocks in Action, Trending Stocks, Stock Analysis, Result Analysis, Corporate News, Stock Market News, IPOs, Mutual Funds, Global Markets, and Investment Ideas at MarketsMojo. Enhance your financial decisions with insightful stock market analysis, seamless portfolio tracking, ...
Sentiment: neutral
2. Headline: CAR Stock Rockets As Travel Disruptions Fuel Rental Demand
Summary: Avis Budget Group Inc. stocks have been trading up by 22.31 percent amid strong travel demand and robust earnings momentum. Key Takeaways Traders Need To Know S
Sentiment: positive
3. Headline: Group 1 Automotive, Inc. (NYSE:GPI) Receives $452.00 Consensus PT from Brokerages - Markets Daily
Summary: Group 1 Automotive, Inc. (NYSE:GPI – Get Free Report) has been assigned an average recommendation of “Moderate Buy” from the ten brokerages that are covering the company, Marketbeat Ratings reports. Three equities research analysts have rated the stock with a hold recommendation and seven ...
Sentiment: neutral
Summary: Pritika Auto Share Price: Find the latest news on Pritika Auto Stock Price. Get all the information on Pritika Auto with historic price charts for NSE / BSE. Experts & Broker view also get the Pritika Auto Ltd. buy/sell tips detailed news, announcements, Forecasts, Analysts, Valuation, Earning ...
Sentiment: neutral
5. Headline: Pritika Auto Industries Ltd is Rated Sell
Summary: Pritika Auto Industries Ltd is rated 'Sell' by MarketsMOJO, with this rating last updated on 29 September 2025. However, the analysis and financial metrics presented here reflect the stock's current position as of 04 April 2026, providing investors with the latest insights into its performance ...
Sentiment: neutral
Powered by Brave
Recent Updates
News Summary
Recent news on Pritika Auto Industries Ltd. centers around regulatory compliance, promoter shareholding stability, and market valuation concerns. The company has filed its annual SEBI disclosure for FY26, confirming promoter holdings remain steady with no pledges, reflecting governance transparency. Promoter entities have made minor incremental share acquisitions, signaling confidence in the business. Despite these positive governance signals, the stock has experienced a notable decline to a 52-week low, indicating market caution. Analyst ratings remain predominantly neutral to negative, with a 'Sell' rating noted by MarketsMojo. Overall, the news cycle highlights a balance between stable internal ownership and external market pressures.
News Sentiment
Sentiment across recent updates is largely neutral, with occasional negative tones linked to share price declines and sell-offs. Positive sentiment is minimal but present in promoter confidence and regulatory compliance disclosures. The overall sentiment suggests cautious investor outlook with emphasis on governance stability rather than growth optimism.
Analytical Overview
Analysis Summary
Pritika Auto Industries' trailing P/E ratio of 14.35 aligns closely with the industry average, indicating fair valuation relative to earnings, while the PEG ratio of 0.23 suggests undervaluation relative to growth prospects. The company’s revenue growth rate of 40.6% quarter-over-quarter and positive operating cash flow of INR 270 million demonstrate a solid growth trajectory and improving cash generation. Financial health is moderate, with a current ratio of 1.40 indicating sufficient liquidity, but a high debt-to-equity ratio of 65.1% warrants attention for leverage risk. Sector-specific challenges include competitive pressures in specialty industrial machinery and sensitivity to agricultural equipment demand cycles. Considering India-specific factors, regulatory compliance is robust, and the agricultural sector's mechanization trend supports demand, though macroeconomic volatility remains a factor.
Overall Business and Market Assessment
Supporting Factors: steady revenue growth exceeding 40%, strong gross margins above 50%, and positive operating cash flows indicating operational efficiency
Risk Factors: the elevated debt level relative to equity, potential competitive pressures, and recent stock price weakness signaling market caution
SWOT Analysis
Strengths
- Strong gross margin of over 50% indicating efficient production.
- Robust revenue growth of 40.6% quarter-over-quarter.
- Positive operating cash flow supporting business operations.
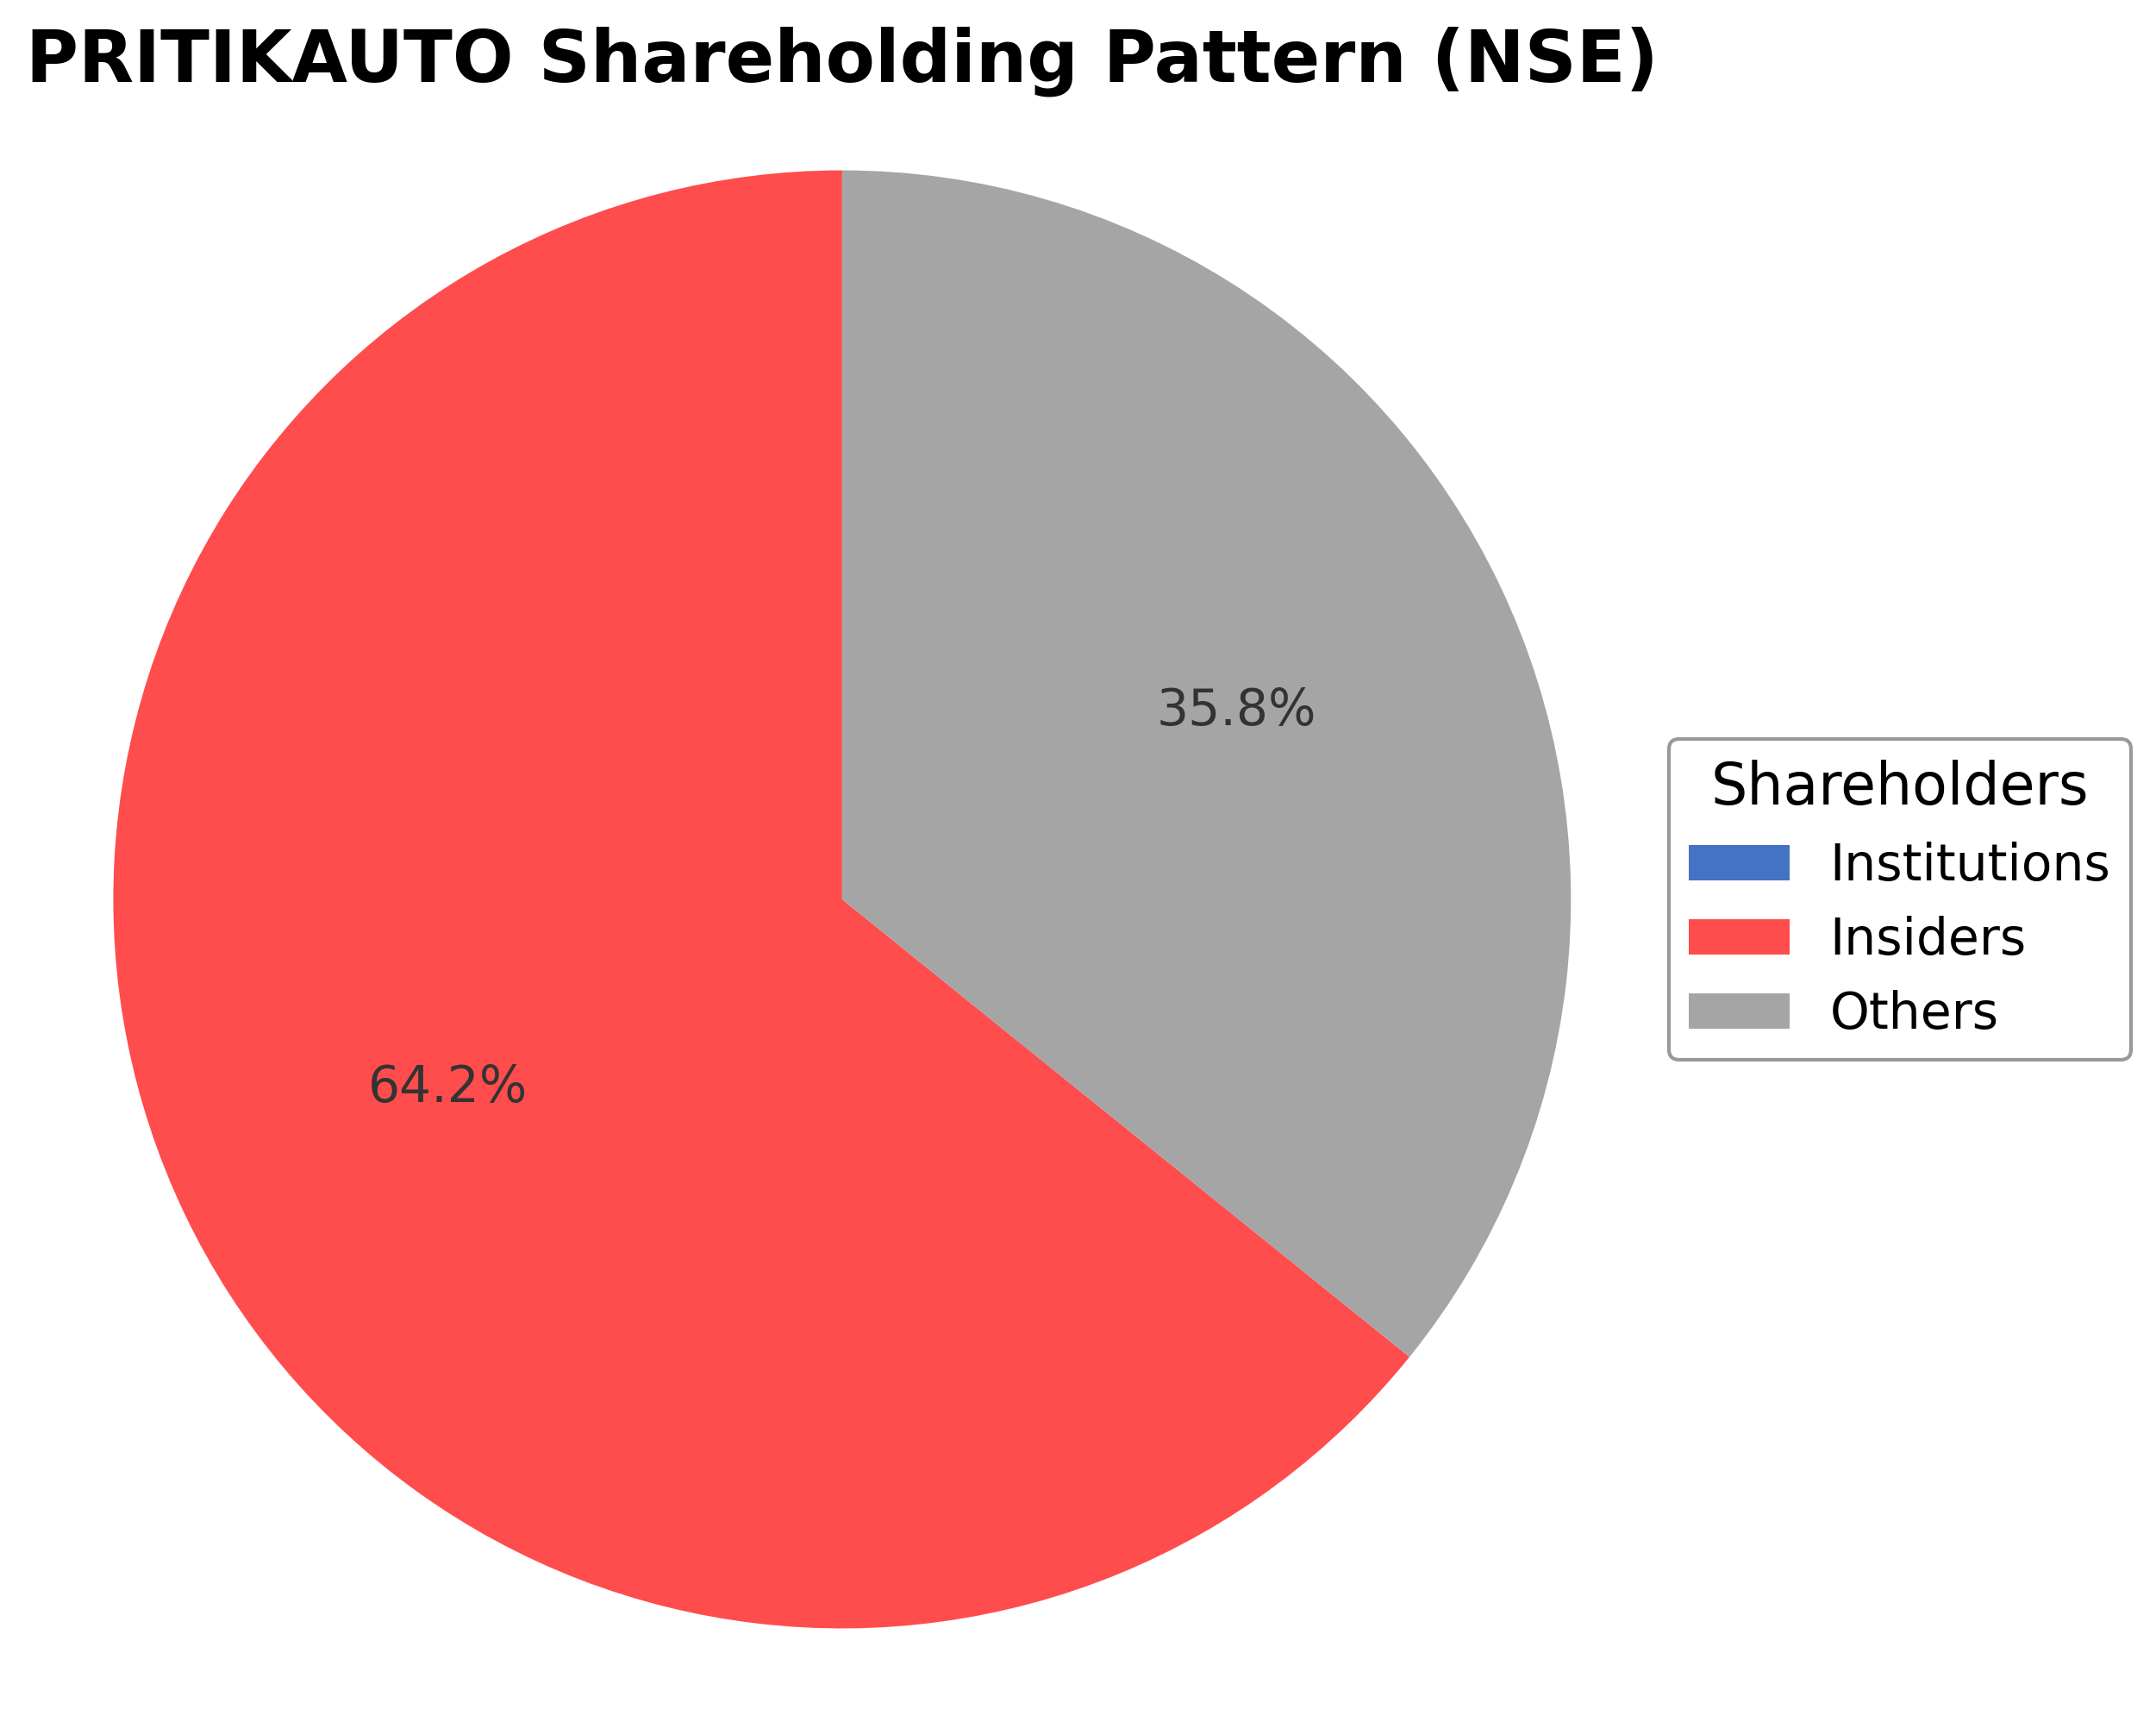
- Promoter shareholding exceeding 64% ensures stable control.
Weaknesses
- High debt-to-equity ratio of 65.1% increases financial risk.
- Net profit margin is modest at 3.43%, limiting profitability.
- Limited institutional investor presence may restrict capital access.
- Stock trading below book value suggests market undervaluation.
Opportunities
- Growing mechanization in Indian agriculture supports demand.
- Potential to expand product offerings in specialty machinery.
- Incremental promoter share acquisitions indicate confidence.
- Regulatory compliance enhances investor trust and governance.
Threats
- Competitive pressures in the specialty industrial machinery sector.
- Macroeconomic volatility impacting agricultural equipment sales.
- Stock price volatility with recent declines to 52-week lows.
- High leverage may constrain financial flexibility during downturns.
Company Description
Pritika Auto Industries Ltd. is a prominent player in the automotive manufacturing sector, specializing in the production of tractor components and agricultural machinery parts. Established with a commitment to quality and innovation, the company serves OEMs (Original Equipment Manufacturers) across India and internationally. Pritika Auto Industries Ltd. is renowned for its comprehensive product range, including rear axle housings, main housings, cover heads, and hydraulic lift housings, which are integral to the efficient functioning of tractors and other heavy machinery. The company plays a vital role in the agricultural and allied industries by providing robust and reliable components that support the mechanization of farming activities. As an integral part of the automotive supply chain, Pritika Auto Industries contributes significantly to the growth and development of the agricultural equipment sector. With a focus on technological advancement and sustainability, it continues to expand its market presence. The firm's strategic emphasis on quality assurance and customer satisfaction underpins its position as a trusted partner for major tractor manufacturers, thereby ensuring the durability and performance of agricultural machinery worldwide.