
Premier Energies Ltd (PREMIERENE)
Stock Analysis Report
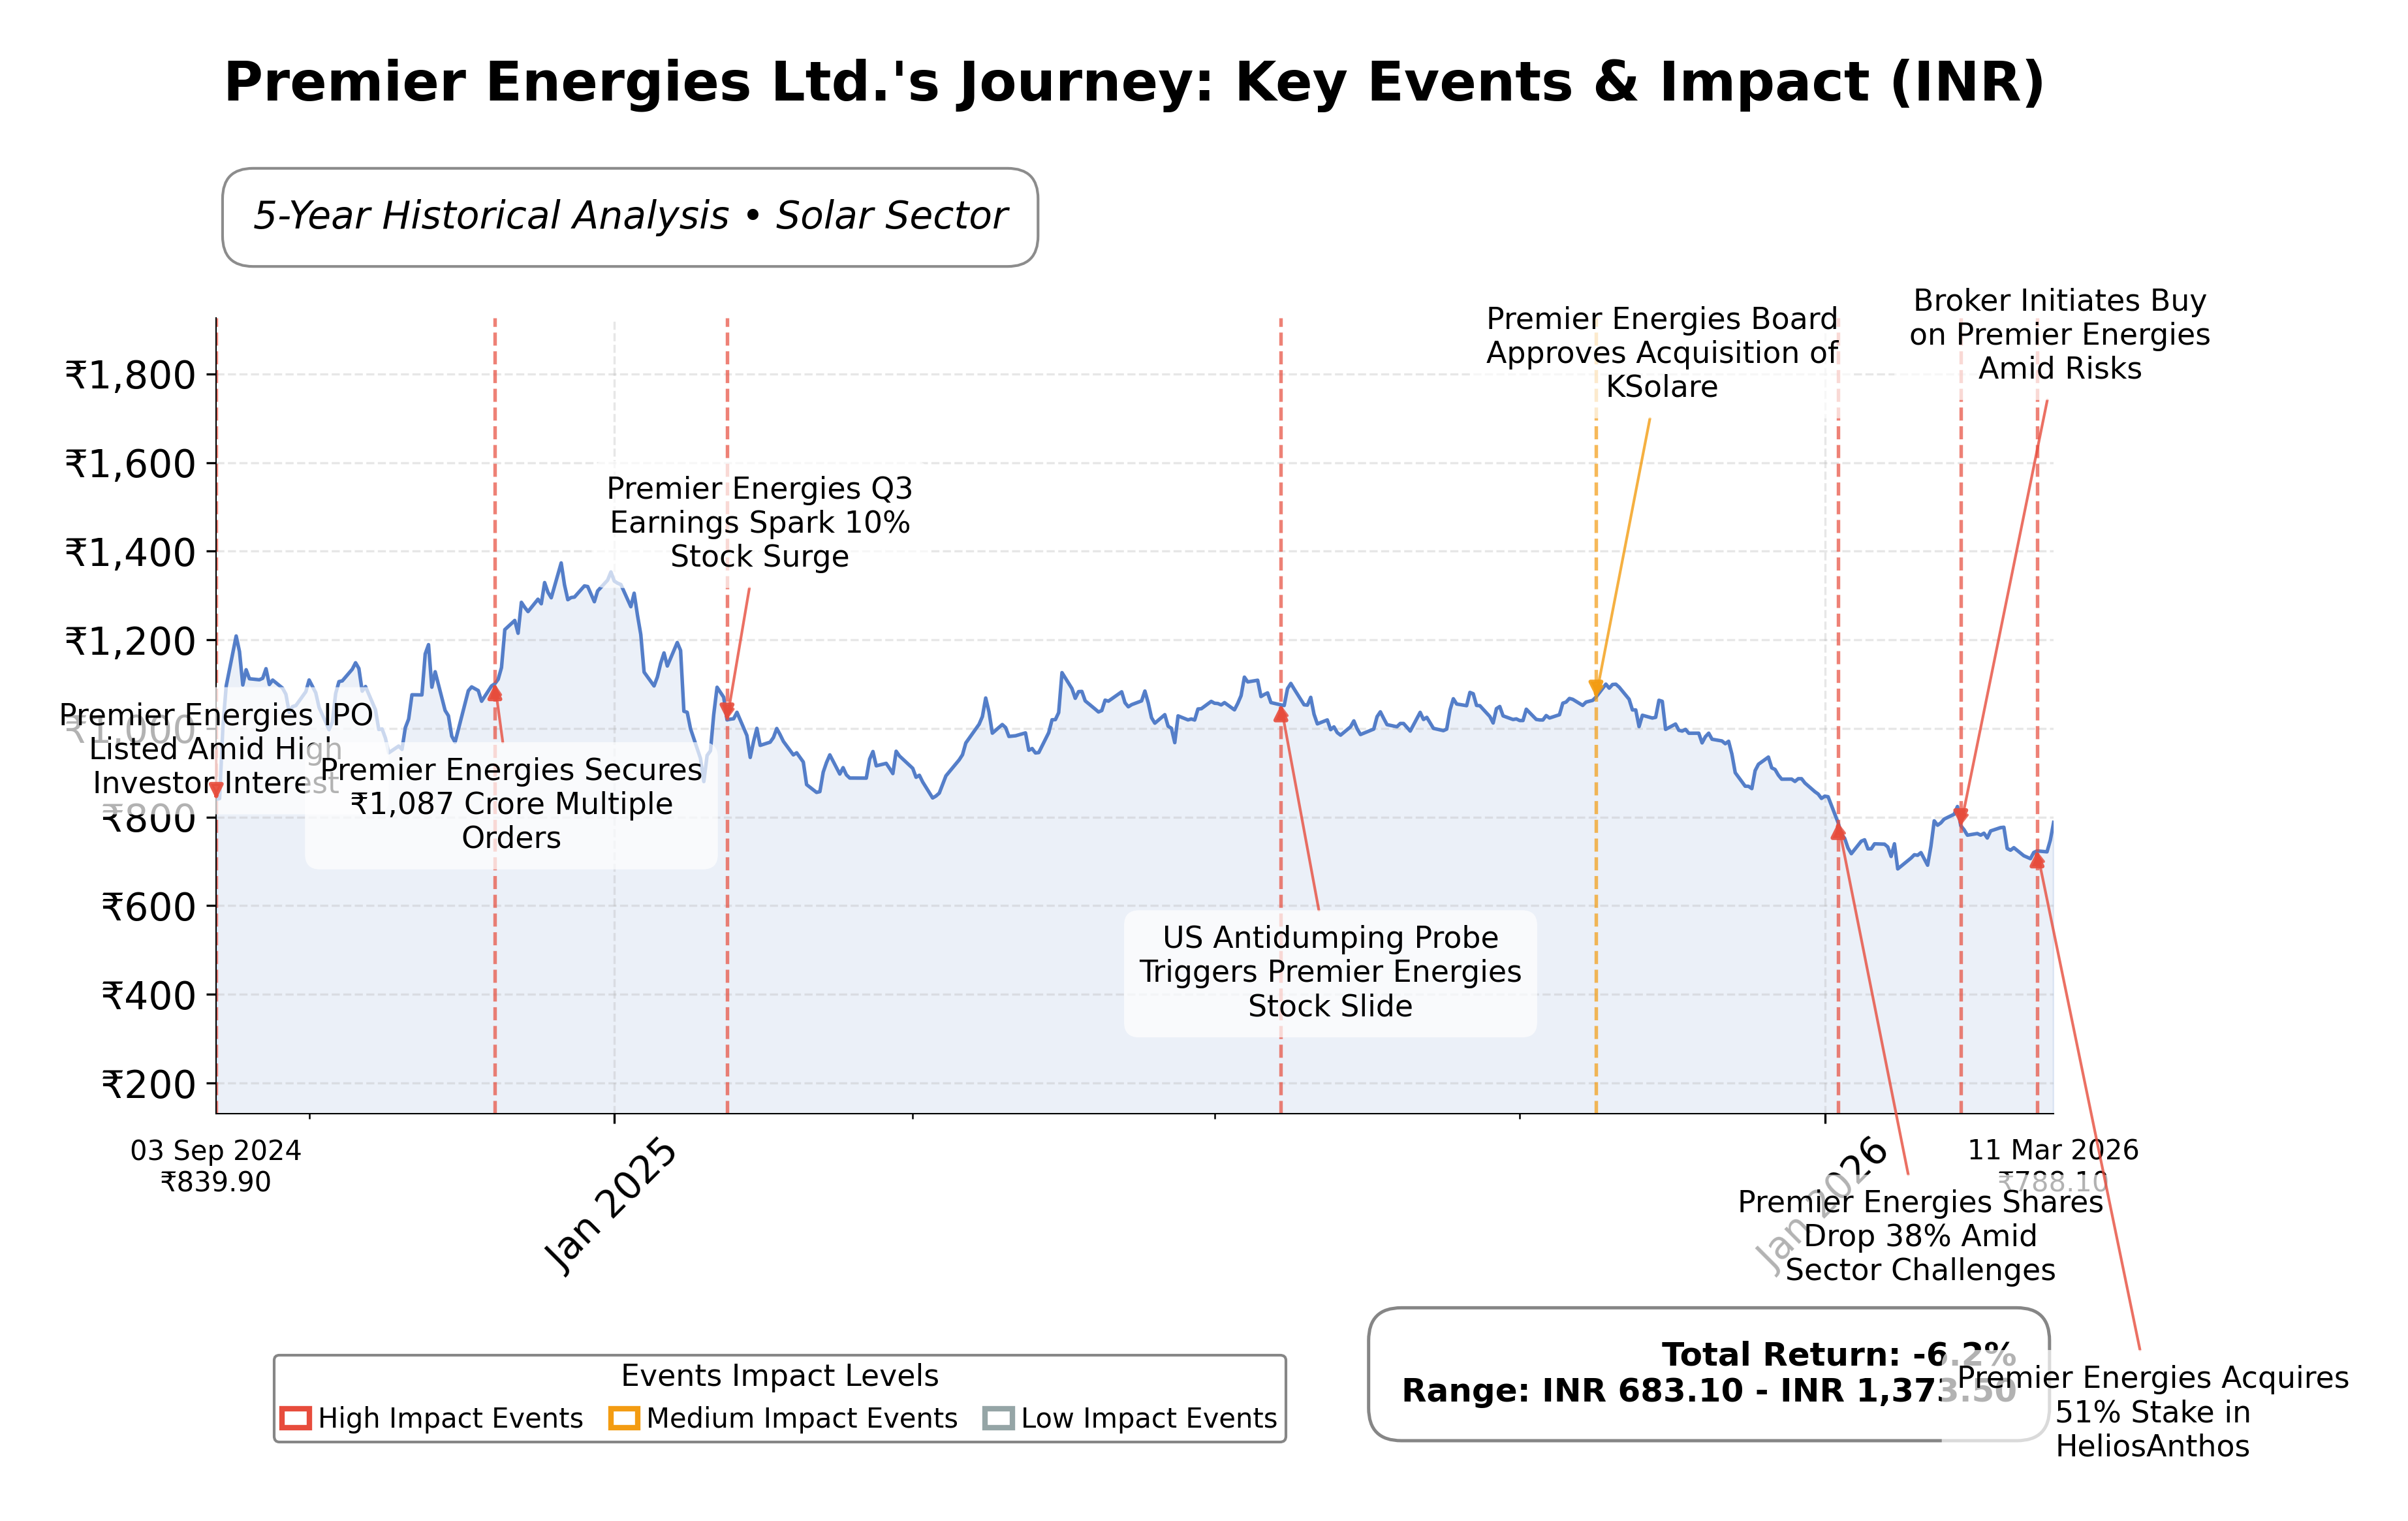
Stock Journey
Key Positives and Key Risks
Pros
- Strong return on equity at 33.21% demonstrates efficient use of shareholder capital.
- Forward P/E ratio of 16.68 is lower than trailing P/E, indicating potential valuation improvement.
- Robust quarterly revenue growth of 13% and year-over-year earnings growth of 53.5% reflect positive operational momentum.
Cons
- Downside risk of approximately 29.78% from the 52-week high indicates significant recent price decline.
- High price to cash flow ratio of 30.67 suggests premium valuation or variability in cash generation.
- Exposure to regulatory tariffs and market volatility introduces uncertainty in cost structure and earnings stability.
Disclosure: This information is for general awareness and does not constitute investment advice
Report Summary
Premier Energies Ltd. is an Indian renewable energy company specializing in the manufacturing of solar modules, cells, and integrated energy solutions. Operating within the solar industry, the company is positioned as a significant domestic and international supplier, leveraging advanced manufacturing capabilities and research and development to support the global transition to sustainable energy.
Financially, Premier Energies reports a market capitalization of approximately â¹320.15 billion with a trailing P/E ratio of 25.29 and a forward P/E of 16.68, reflecting valuation metrics aligned with industry averages. The company demonstrates solid profitability with a profit margin of 18.44%, return on equity of 33.21%, and a healthy operating margin of 27.01%. Its enterprise value to EBITDA stands at 13.95, and it maintains a current ratio near 1.88, indicating reasonable liquidity. Cash flow metrics show robust operating and free cash flows, supporting operational stability.
Technically, Premier Energies exhibits mixed momentum with recent intraday price surges and some bearish pressures. The company recently acquired a 51% stake in HeliosAnthos Energies, signaling strategic expansion in renewable energy. Leadership remains stable with no notable changes reported. Strengths include strong R&D, integrated manufacturing, and a growing export focus, while risks involve tariff impacts and market volatility. These factors contribute to a nuanced outlook for stakeholders monitoring the stockâs performance and strategic direction.
Within the Indian solar sector, Premier Energies stands out with a market cap significantly larger than peers such as Sterling and Wilson Renewable Energy Limited, which has a market cap of â¹42.48 billion. Premier Energiesâ valuation multiples are generally more moderate compared to peers, with a lower P/E and EV/EBITDA ratio, alongside a superior return on equity, indicating relatively efficient capital utilization. However, its price to cash flow ratio is notably higher, suggesting potential premium pricing or cash flow variability relative to peers.
Premier Energies operates as a key protagonist in the evolving renewable energy landscape, marked by recent strategic acquisitions and technological advancements such as Indiaâs first Zero Busbar solar cell. The company faces ongoing challenges from regulatory tariffs and market fluctuations but benefits from a solid financial base and expanding manufacturing capacity. The stakes involve capitalizing on growing global demand for clean energy while managing geopolitical and trade-related headwinds. Given the current data, a balanced stance may be appropriate for those evaluating the stock, reflecting both growth potential and sector-specific risks without explicit directional bias.
Company and Industry Overview
Company Basics
Price Performance
Company Size
Shareholding Pattern
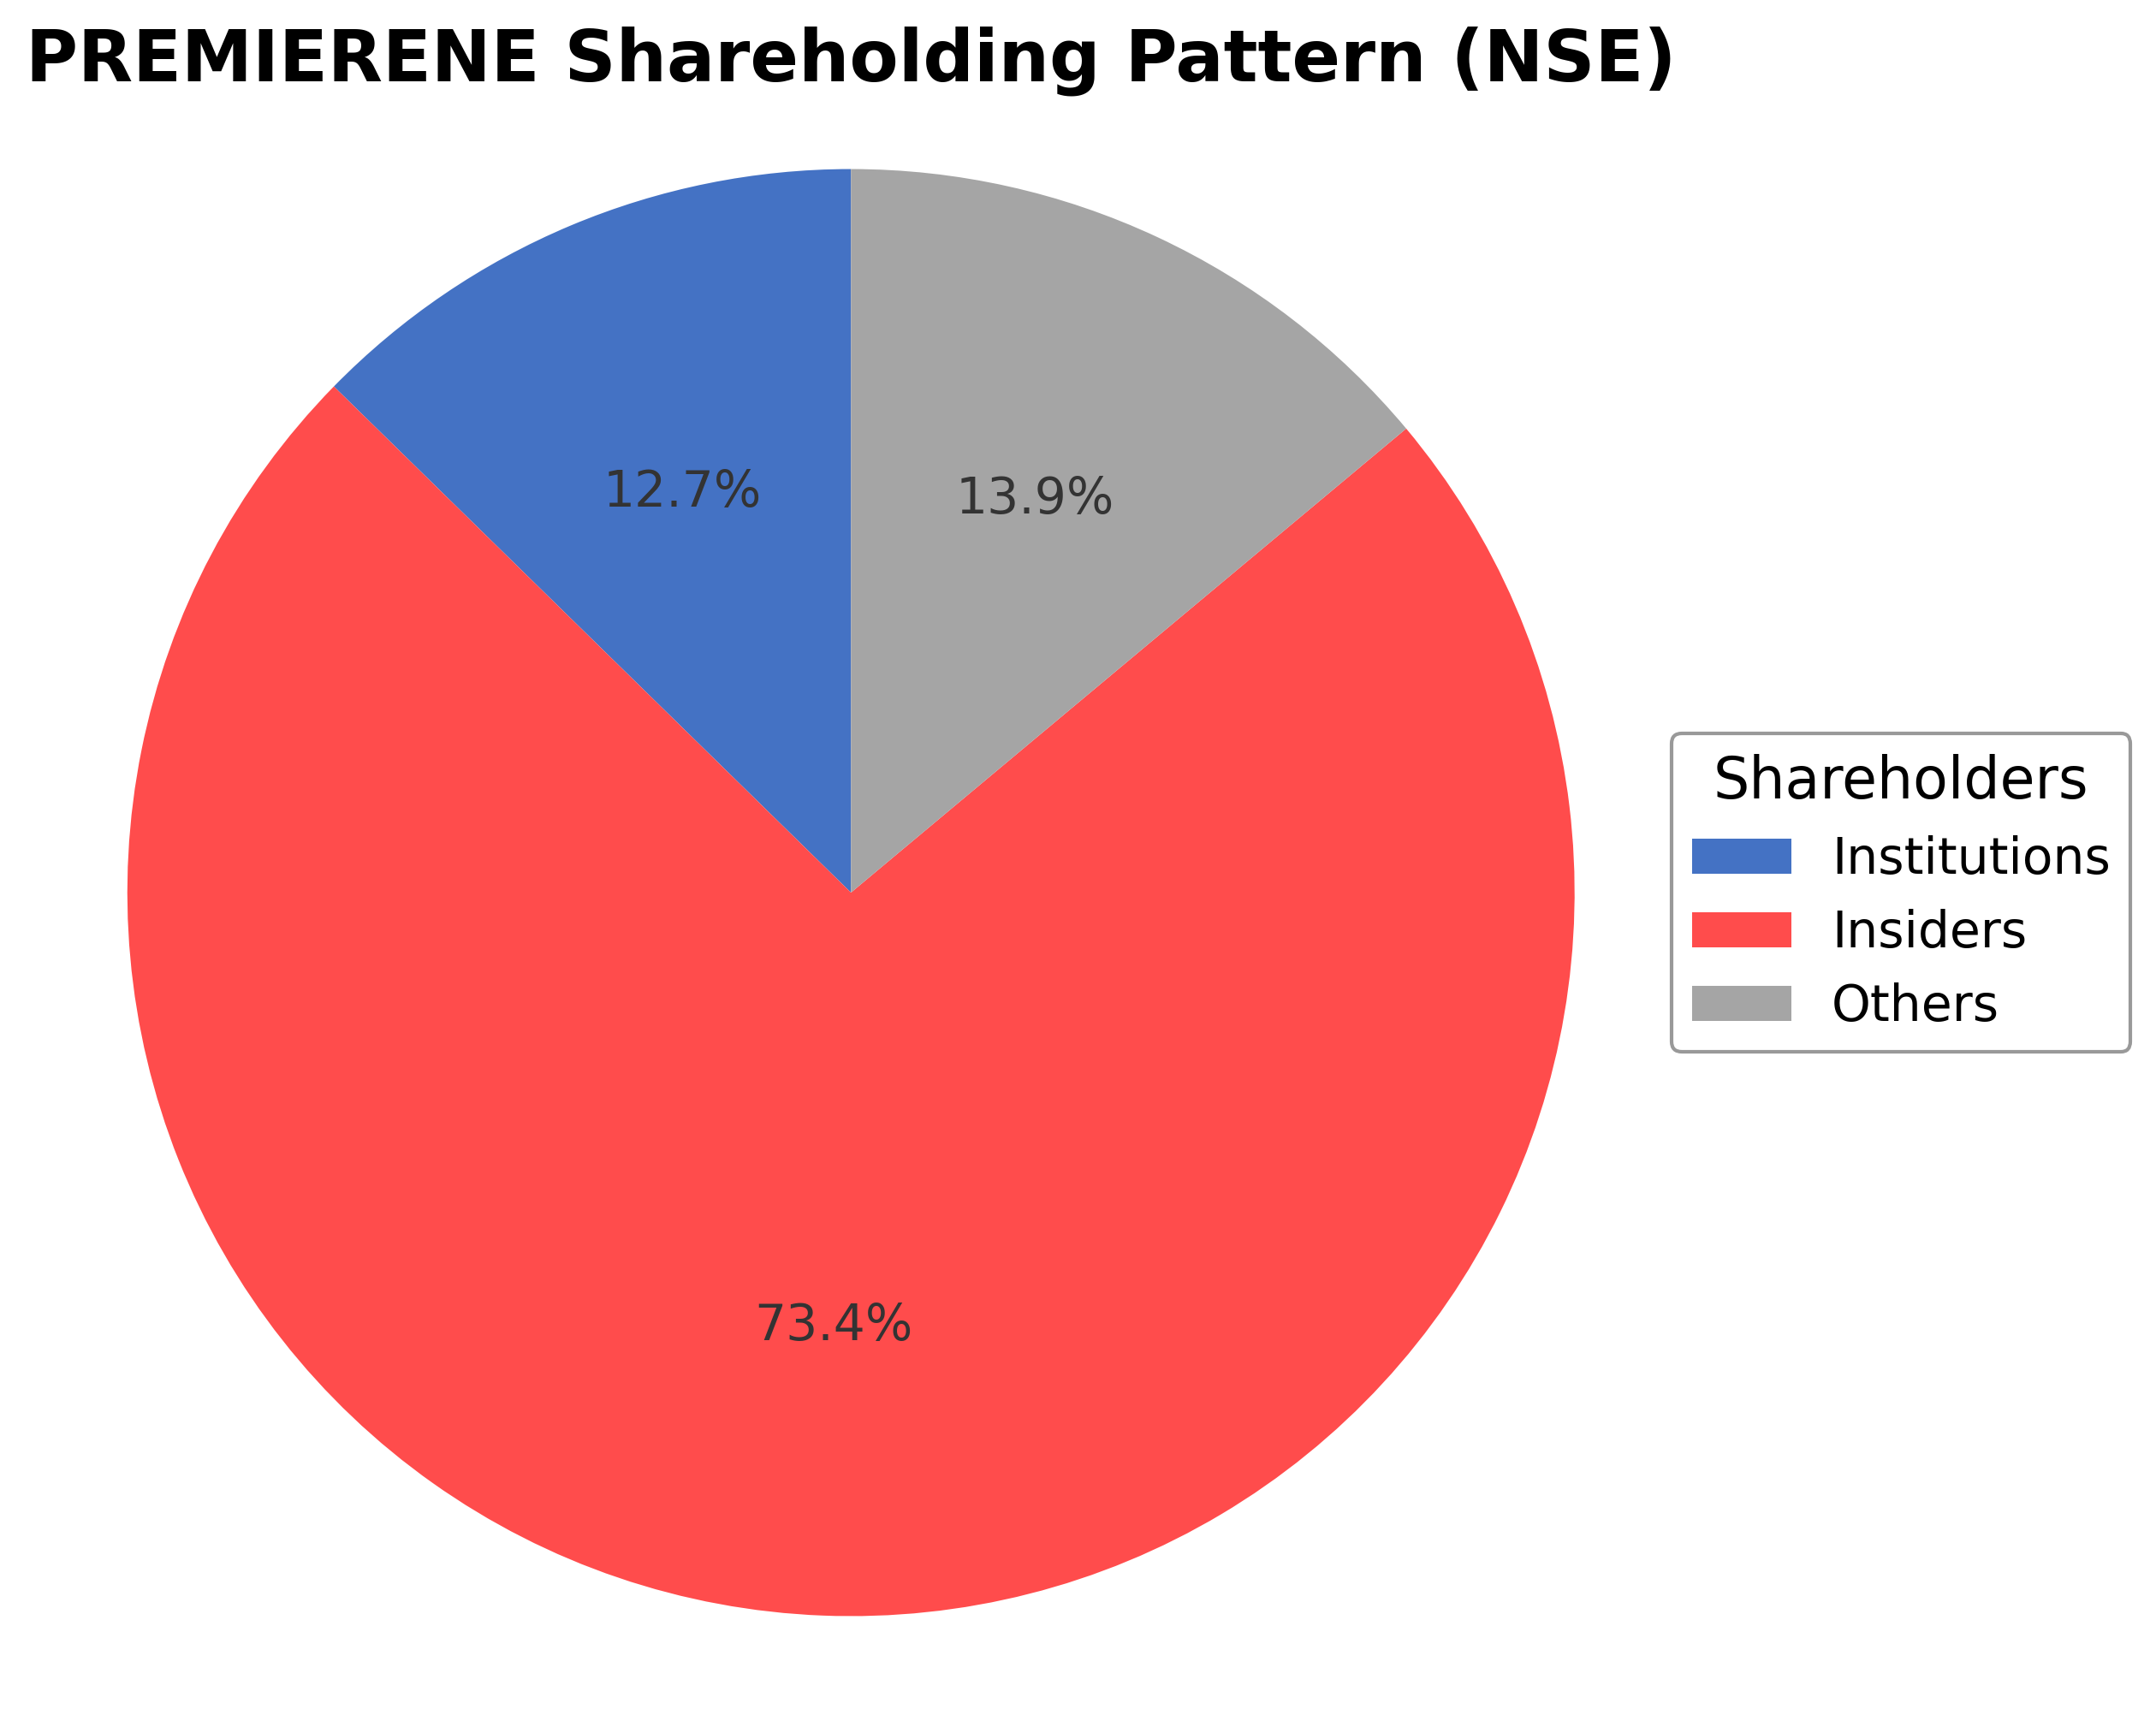
Premier Energies Ltd.'s shareholding structure is dominated by insiders, including executives and board members, holding approximately 73.41% of shares, reflecting strong promoter control. Institutional investors account for 12.67%, with the remaining 13.92% held by public and other shareholders. Over the past 12 to 24 months, institutional ownership has shown moderate accumulation, indicating growing confidence from mutual funds and asset managers. This ownership pattern suggests a governance framework heavily influenced by promoters, with institutional participation providing additional oversight. The current structure supports strategic continuity while allowing for market-driven influences, which may impact future corporate initiatives and capital allocation decisions.
Sector and Industry Analysis
Premier Energies Ltd. (Symbol: PREMIERENE) operates within the broader Energy sector, a critical and expansive segment of the global economy encompassing traditional oil and gas, renewable energy, and power generation industries. The global energy sector is sizable, with market capitalization running into trillions of dollars, driven by sustained demand for energy across industrial, commercial, and residential users. The sector is currently undergoing a significant transformation, with a growth trajectory increasingly influenced by the transition to cleaner energy sources, digitalization, and energy efficiency initiatives. Key players range from multinational oil majors like ExxonMobil and Shell to renewable energy leaders such as NextEra Energy and Ørsted, reflecting a diversified competitive landscape.
Within this sector, the renewable energy industry—likely relevant to Premier Energies given its name and market positioning—is characterized by rapid technological advancements and shifting consumer preferences toward sustainability. Trends include the proliferation of solar photovoltaic (PV) and wind power technologies, advancements in energy storage solutions, and the integration of smart grid technologies. Consumer behavior is evolving with increased demand for green energy options and decentralized energy production, such as residential solar installations. Emerging opportunities are abundant in areas like green hydrogen, battery storage, and electric vehicle (EV) charging infrastructure, driven by global decarbonization goals and supportive government policies.
The regulatory environment in the energy sector is complex and highly impactful. Governments worldwide are implementing stringent emissions regulations, renewable portfolio standards (RPS), and incentives such as tax credits and subsidies to accelerate clean energy adoption. Compliance requirements include environmental impact assessments, grid interconnection standards, and reporting obligations related to sustainability metrics. Policy impacts are profound, with frameworks like the European Green Deal and the U.S. Inflation Reduction Act shaping investment flows and operational strategies. Regulatory uncertainty, however, remains a risk factor, especially in jurisdictions with fluctuating energy policies or geopolitical tensions affecting energy supply chains.
Competitive dynamics in the energy sector vary by sub-industry but generally feature moderate to high barriers to entry due to capital intensity, regulatory compliance costs, and technological expertise requirements. Market structure ranges from oligopolistic in traditional oil and gas to more fragmented in renewables, where numerous smaller firms and startups innovate rapidly. Large incumbents leverage scale, integrated operations, and established infrastructure, while new entrants often compete on technological innovation and niche market focus. Institutional ownership and insider holdings can influence corporate governance and strategic direction, affecting market liquidity and stock volatility. Overall, competitive positioning depends on a company’s ability to adapt to technological shifts, regulatory changes, and evolving customer demands within this dynamic sector.
Note: Analysis synthesized from industry research, market reports, and regulatory filings. Information is subject to change based on market conditions.
Illustrative Scenario Analysis
DCF Assumptions:
Method: Two-Stage EPS-Priority Model
Financials
Peer Analysis
| Company Name | Market Cap | P/E Ratio | P/B Ratio | EV/EBITDA | Price to CFO |
|---|---|---|---|---|---|
| Premier Energies Ltd. | ₹320.15B | 25.29 | 9.18 | 13.95 | 30.67 |
| Sterling and Wilson Renewable Energy Limited | ₹42.48B | 48.29 | 9.03 | 17.33 | -6.08 |
Comparison Analysis: Premier Energies Ltd. exhibits a substantially larger market capitalization than its peer Sterling and Wilson Renewable Energy Limited, reflecting a more established market presence. The company’s P/E ratio of 25.29 is significantly lower than Sterling and Wilson’s 48.29, suggesting relatively more moderate valuation. Premier Energies also shows a higher return on equity at 33.21% compared to 8.00% for its peer, indicating superior profitability and capital efficiency. However, Premier Energies’ price to cash flow ratio is markedly higher, which may reflect premium valuation or differences in cash flow stability. Overall, Premier Energies demonstrates stronger financial metrics and scale within the Indian solar sector.
Financial Metrics Comparison with Peers

Financial Statements
Comprehensive financial data including income, balance sheet, and cash flow metrics
Income Statement
| fiscal_date | 2025-03-31 | 2024-03-31 | 2023-03-31 | 2022-03-31 | 2021-03-31 |
|---|---|---|---|---|---|
| Sales | 65.11B | 31.39B | 14.27B | 7.43B | 7.01B |
| Cost Of Goods | 40.89B | 24.58B | 12.34B | 6.34B | 5.81B |
| Gross Profit | 24.22B | 6.81B | 1.94B | 1.09B | 1.20B |
| Operating Expense Selling General And Administrative | 1.02B | 425.18M | 135.51M | 152.16M | 139.61M |
| Operating Expense Other Operating Expenses | 3.27B | 554.71M | 172.28M | 187.63M | 244.97M |
| Operating Income | 13.35B | 3.95B | 481.74M | 123.23M | 456.49M |
| Non Operating Interest Income | 772.92M | 136.52M | 120.14M | 83.17M | 42.08M |
| Non Operating Interest Expense | 1.12B | 854.92M | 478.82M | 317.42M | 118.04M |
| Pretax Income | 12.40B | 2.89B | -77.60M | -156.91M | 558.19M |
| Income Tax | 3.03B | 580.12M | 55.76M | -12.83M | 300.12M |
| Net Income | 9.37B | 2.31B | -133.36M | -144.08M | 258.07M |
| Eps Basic | 21.35 | 5.18 | -0.29 | -0.32 | 0.53 |
| Eps Diluted | 21.35 | 5.18 | -0.29 | -0.32 | 0.53 |
| Basic Shares Outstanding | 438.90M | 446.83M | 446.83M | 446.83M | 446.83M |
| Diluted Shares Outstanding | 438.90M | 446.83M | 446.83M | 446.83M | 446.83M |
| Ebit | 13.52B | 3.75B | 401.22M | 160.51M | 676.23M |
| Ebitda | 18.21B | 4.71B | 907.10M | 413.30M | 681.47M |
| Net Income Continuous Operations | 12.40B | 2.89B | -77.60M | -156.91M | 558.19M |
| Minority Interests | 0.00 | 0.00 | 5.31M | 480.00K | -23.28M |
| Preferred Stock Dividends | 0.00 | 0.00 | 0.00 | 0.00 | 0.00 |
Source: Financial statements and regulatory filings
Balance Sheet
| fiscal_date | 2025-03-31 | 2024-03-31 | 2023-03-31 | 2022-03-31 | 2021-03-31 |
|---|---|---|---|---|---|
| Cash And Cash Equivalents | 8.03B | 2.57B | 645.70M | 800.99M | 144.54M |
| Accounts Receivable | 8.01B | 6.09B | 594.61M | 1.45B | 1.62B |
| Total Assets | 68.41B | 35.54B | 21.11B | 13.41B | 9.77B |
| Total Liabilities | 40.19B | 28.94B | 16.86B | 9.38B | 7.38B |
| Long Term Debt | 9.72B | 8.86B | 5.70B | 3.33B | 2.47B |
| Shareholders Equity | 28.22B | 6.60B | 4.24B | 4.04B | 2.39B |
Source: Financial statements and regulatory filings
Cash Flow Statement
| fiscal_date | 2025-03-31 | 2024-03-31 | 2023-03-31 | 2022-03-31 | 2021-03-31 |
|---|---|---|---|---|---|
| Operating Activities Net Income | 12.40B | 2.89B | -77.60M | -156.91M | 558.19M |
| Operating Activities Stock Based Compensation | 154.96M | 38.77M | 12.50M | 2.47M | 0.00 |
| Operating Activities Other Non Cash Items | 140.93M | 655.92M | 449.06M | 309.65M | 176.72M |
| Operating Activities Accounts Receivable | -2.18B | -5.62B | 801.49M | 106.14M | 390.64M |
| Operating Activities Other Assets Liabilities | -81.89M | -3.87B | -2.56B | -1.42B | 687.06M |
| Operating Activities Operating Cash Flow | 10.44B | -5.90B | -1.38B | -1.16B | 1.81B |
| Investing Activities Capital Expenditures | -6.20B | -4.49B | -2.73B | -1.83B | -3.20B |
| Investing Activities Purchase Of Investments | -19.87B | -1.98B | -507.63M | -1.84B | -393.06M |
| Investing Activities Sale Of Investments | 11.80B | 2.09B | 559.29M | 1.51B | 6.00M |
| Investing Activities Other Investing Activity | -10.49B | -166.87M | -492.33M | -145.28M | 340.00K |
| Investing Activities Investing Cash Flow | -24.77B | -4.55B | -3.16B | -2.27B | -3.58B |
| Financing Activities Long Term Debt Issuance | 2.89B | 4.08B | 2.34B | 971.86M | 0.00 |
| Financing Activities Long Term Debt Payments | -2.39B | -552.68M | -82.24M | -116.66M | 0.00 |
| Financing Activities Short Term Debt Issuance | 4.51B | 2.76B | 841.84M | 225.83M | 1.30B |
| Financing Activities Common Stock Issuance | 12.47B | 0.00 | 0.00 | 1.78B | 14.50M |
| Financing Activities Common Dividends | -223.92M | N/A | N/A | N/A | N/A |
| Financing Activities Financing Cash Flow | 17.26B | 6.29B | 3.14B | 3.27B | 1.31B |
| End Cash Position | 8.03B | 2.57B | 645.70M | 800.99M | 144.54M |
| Free Cash Flow | 7.28B | -3.61B | -2.39B | -1.94B | -876.05M |
| Investing Activities Net Acquisitions | N/A | 0.00 | 10.33M | 37.79M | 0.00 |
| Financing Activities Other Financing Charges | N/A | N/A | 42.50M | 412.08M | N/A |
Source: Financial statements and regulatory filings
Technical Analysis
Key Insights
- Current trend direction shows mixed momentum with recent intraday surges but also intermittent bearish pressures.
- Key support levels are observed near ₹660, with resistance around the 52-week high of ₹1163.9 and moving averages at ₹768.6 (50-day) and ₹960.2 (200-day).
- The stock price is currently trading above the 50-day moving average but below the 200-day moving average, indicating intermediate-term consolidation.
- Momentum indicators such as RSI and MACD display neutral to slightly bullish readings, reflecting balanced buying and selling pressures.
- Multi-timeframe analysis reveals short-term strength with some medium-term caution, as weekly and monthly charts show consolidation phases.
- Potential market scenarios include a breakout above resistance if momentum sustains or a retest of support levels amid broader market volatility.
Trending News
1. Headline: Premier Energies Ltd Hits Intraday High with 5.09% Surge on 11 Mar 2026
Summary: Premier Energies Ltd demonstrated robust intraday performance on 11 Mar 2026, surging to a day’s high of Rs 790, marking a 5.59% increase. This advance outpaced its sector and broader market indices, reflecting notable trading momentum despite a broadly bearish market environment.
Sentiment: positive
2. Headline: Premier Energies Ltd Technical Momentum Shifts Amid Mixed Market Returns
Summary: Premier Energies Ltd, a mid-cap player in the Other Electrical Equipment sector, has experienced a notable shift in its technical parameters, reflecting a complex interplay of bullish and bearish signals. Despite a recent upgrade in price momentum, the stock’s overall technical trend remains ...
Sentiment: positive
3. Headline: Premier Energies Ltd Declines 1.35%: Bearish Momentum and Market Pressures Shape the Week
Summary: Premier Energies Ltd closed the week at Rs.722.95, down 1.35% from the previous Friday’s close of Rs.732.85, while the Sensex declined 3.00% over the same period. Despite the stock’s modest weekly loss, it outperformed the benchmark index, reflecting a relatively resilient performance amid ...
Sentiment: negative
Summary: Premier Energies acquires 51% stake in HeliosAnthos Energies through preferential share allotment, strengthening its renewable energy expansion strategy in India.
Sentiment: positive
5. Headline: Premier Energies buys 51% stake in EPC JV with BA Prerna Renewables – pv magazine India
Summary: Indian solar manufacturer Premier Energies has completed the acquisition of 104,550 equity shares of HeliosAnthos Energies, securing 51% of the company’s paid-up equity share capital. HeliosAnthos Energies is a joint venture between Premier Energies and BA Prerna Renewables, formed to expand ...
Sentiment: positive
6. Headline: Premier Energies Ltd Sees Heavy Call Option Activity Amid Bearish Price Action
Summary: Premier Energies Ltd, a mid-cap player in the Other Electrical Equipment sector, has witnessed significant call option activity ahead of the 30 March 2026 expiry, signalling heightened investor interest despite a sharp decline in its share price. The stock’s recent volatility and bearish ...
Sentiment: positive
7. Headline: Solar stocks crash: Waaree Energies slumps over 14%, Premier Energies down 12% as US tariffs bite
Summary: The sharp selling in Indian solar stocks followed a decision by the US Commerce Department to levy preliminary countervailing duties of about 126 percent on solar cell and panel imports from India.Waaree Energies and Premier Energies shares fell up to 15 percent in morning trade.
Sentiment: negative
Summary: Solar energy stocks: The duties, according to reports, aim to benefit domestic manufacturers, but they heighten uncertainty for an industry not favoured by US President Donald Trump and threaten to increase costs for producers as well as for consumers.
Sentiment: negative
9. Headline: US Imposes 126% Duty On Indian Solar Imports; Waaree Energies, Premier Energies Fall 10% | Markets News - News18
Summary: Shares of Waaree Energies Ltd., Premier Energies Ltd.
Sentiment: negative
10. Headline: Waaree Energies says 126% US Solar duty will not apply to the company; Stock recovers - CNBC TV18
Summary: Shares of Waaree Energies fell as much as 15% and are now trading with losses of around 12%. Premier Energies, which also fell as much as 13%, is looking to recover from the day's low, currently trading 7% lower as the company has negligible export exposure. Vikram Solar's shares are also down ...
Sentiment: negative
Recent Updates
News Summary
Recent news highlights Premier Energies' strategic focus on expanding its footprint in international markets, particularly targeting solar buyers in Europe and the US amid supply chain diversification. The company is investing INR 5942 crore to establish a large-scale solar manufacturing hub in Andhra Pradesh, enhancing production capacity with advanced TOPCon cell and wafer technologies. Market analysts remain cautiously optimistic about the stock, citing potential upside alongside sector challenges. Technically, the stock has shown shifts in momentum, reflecting a complex market environment. Additionally, Premier Energies unveiled India’s first Zero Busbar solar cell, underscoring its commitment to innovation and technological leadership in solar manufacturing.
News Sentiment
The overall sentiment across recent updates is moderately positive, with emphasis on growth initiatives, technological advancements, and market expansion. Neutral tones appear in relation to investment scale and market outlook, balancing optimism with caution. Positive sentiment is reinforced by strategic acquisitions and product innovation, while regulatory and market volatility remain underlying concerns influencing sentiment variability.
Analytical Overview
Analysis Summary
Valuation Metrics: Premier Energies' trailing P/E of 25.29 aligns closely with the industry average of 25.29, while its forward P/E of 16.68 suggests a more attractive valuation relative to peers. The PEG ratio of 0.48 indicates potential undervaluation relative to growth prospects.
Growth Trajectory: The company reports a quarterly revenue growth of 13% and a year-over-year earnings growth of 53.5%, supported by strong operating and free cash flows, indicating a positive growth trajectory in revenue and cash generation.
Financial Health: With a total debt to equity ratio of 46.96% and a current ratio of 1.88, Premier Energies maintains a balanced financial structure, supported by substantial cash reserves of approximately ₹20.46 billion, reflecting sound liquidity and manageable leverage.
Sector Specific Factors: The solar sector in India faces challenges such as import tariffs and regulatory uncertainties but also benefits from strong government support for renewable energy expansion and increasing domestic and international demand for solar products.
Market Positioning And Competitive Advantages: Premier Energies leverages integrated manufacturing capabilities, technological innovation such as Zero Busbar solar cells, and strategic acquisitions to strengthen its market position and competitive edge in the Indian solar industry.
Investment Conclusion
Supporting Factors: Robust revenue and earnings growth supported by strong cash flow generation.
Risk Factors: Exposure to regulatory and tariff-related risks impacting cost structure and market access.
SWOT Analysis
Strengths
- Integrated manufacturing capabilities ensure quality control and cost efficiency.
- Strong return on equity of 33.21% indicates effective capital utilization.
- Robust revenue growth and profitability with a profit margin of 18.44%.
- Strategic acquisitions enhance market presence and expansion potential.
Weaknesses
- High price to cash flow ratio suggests premium valuation or cash flow variability.
- Significant promoter ownership may limit broader institutional influence.
- Exposure to regulatory tariffs introduces cost and market access uncertainties.
- Stock price shows notable downside risk from 52-week high levels.
Opportunities
- Expansion into international markets including Europe and the US.
- Investment in advanced solar manufacturing technologies like TOPCon cells.
- Growing domestic demand supported by government renewable energy initiatives.
- Development of large-scale manufacturing hubs to increase capacity.
Threats
- Imposition of high import tariffs by foreign governments affecting exports.
- Market volatility and bearish momentum impacting share price stability.
- Competitive pressures from domestic and international solar manufacturers.
- Potential supply chain disruptions and raw material cost fluctuations.
Company Description
Premier Energies Ltd. is a key player in the renewable energy sector, specializing in the manufacturing of solar modules, cells, and energy solutions. The primary function of the company lies in providing innovative and sustainable energy alternatives, contributing to the global shift towards renewable energy resources. Premier Energies is involved in the end-to-end production process of solar energy products, from raw material processing to the final product assembly. This capability allows them to maintain high-quality standards and cost efficiency in their solar solutions. The company serves a wide array of industries including residential, commercial, and industrial sectors, promoting the adoption of clean energy. With its advanced manufacturing facilities and a robust research and development team, Premier Energies Ltd. has cemented its role as a significant supplier in both domestic and international markets. The firm’s dedication to sustainability is underscored by its continuous investment in technological advancements and eco-friendly practices, reinforcing its market significance as a leader in the transition to renewable energy sources.