
Power Grid Corporation of India Ltd (POWERGRID)
Stock Analysis Report
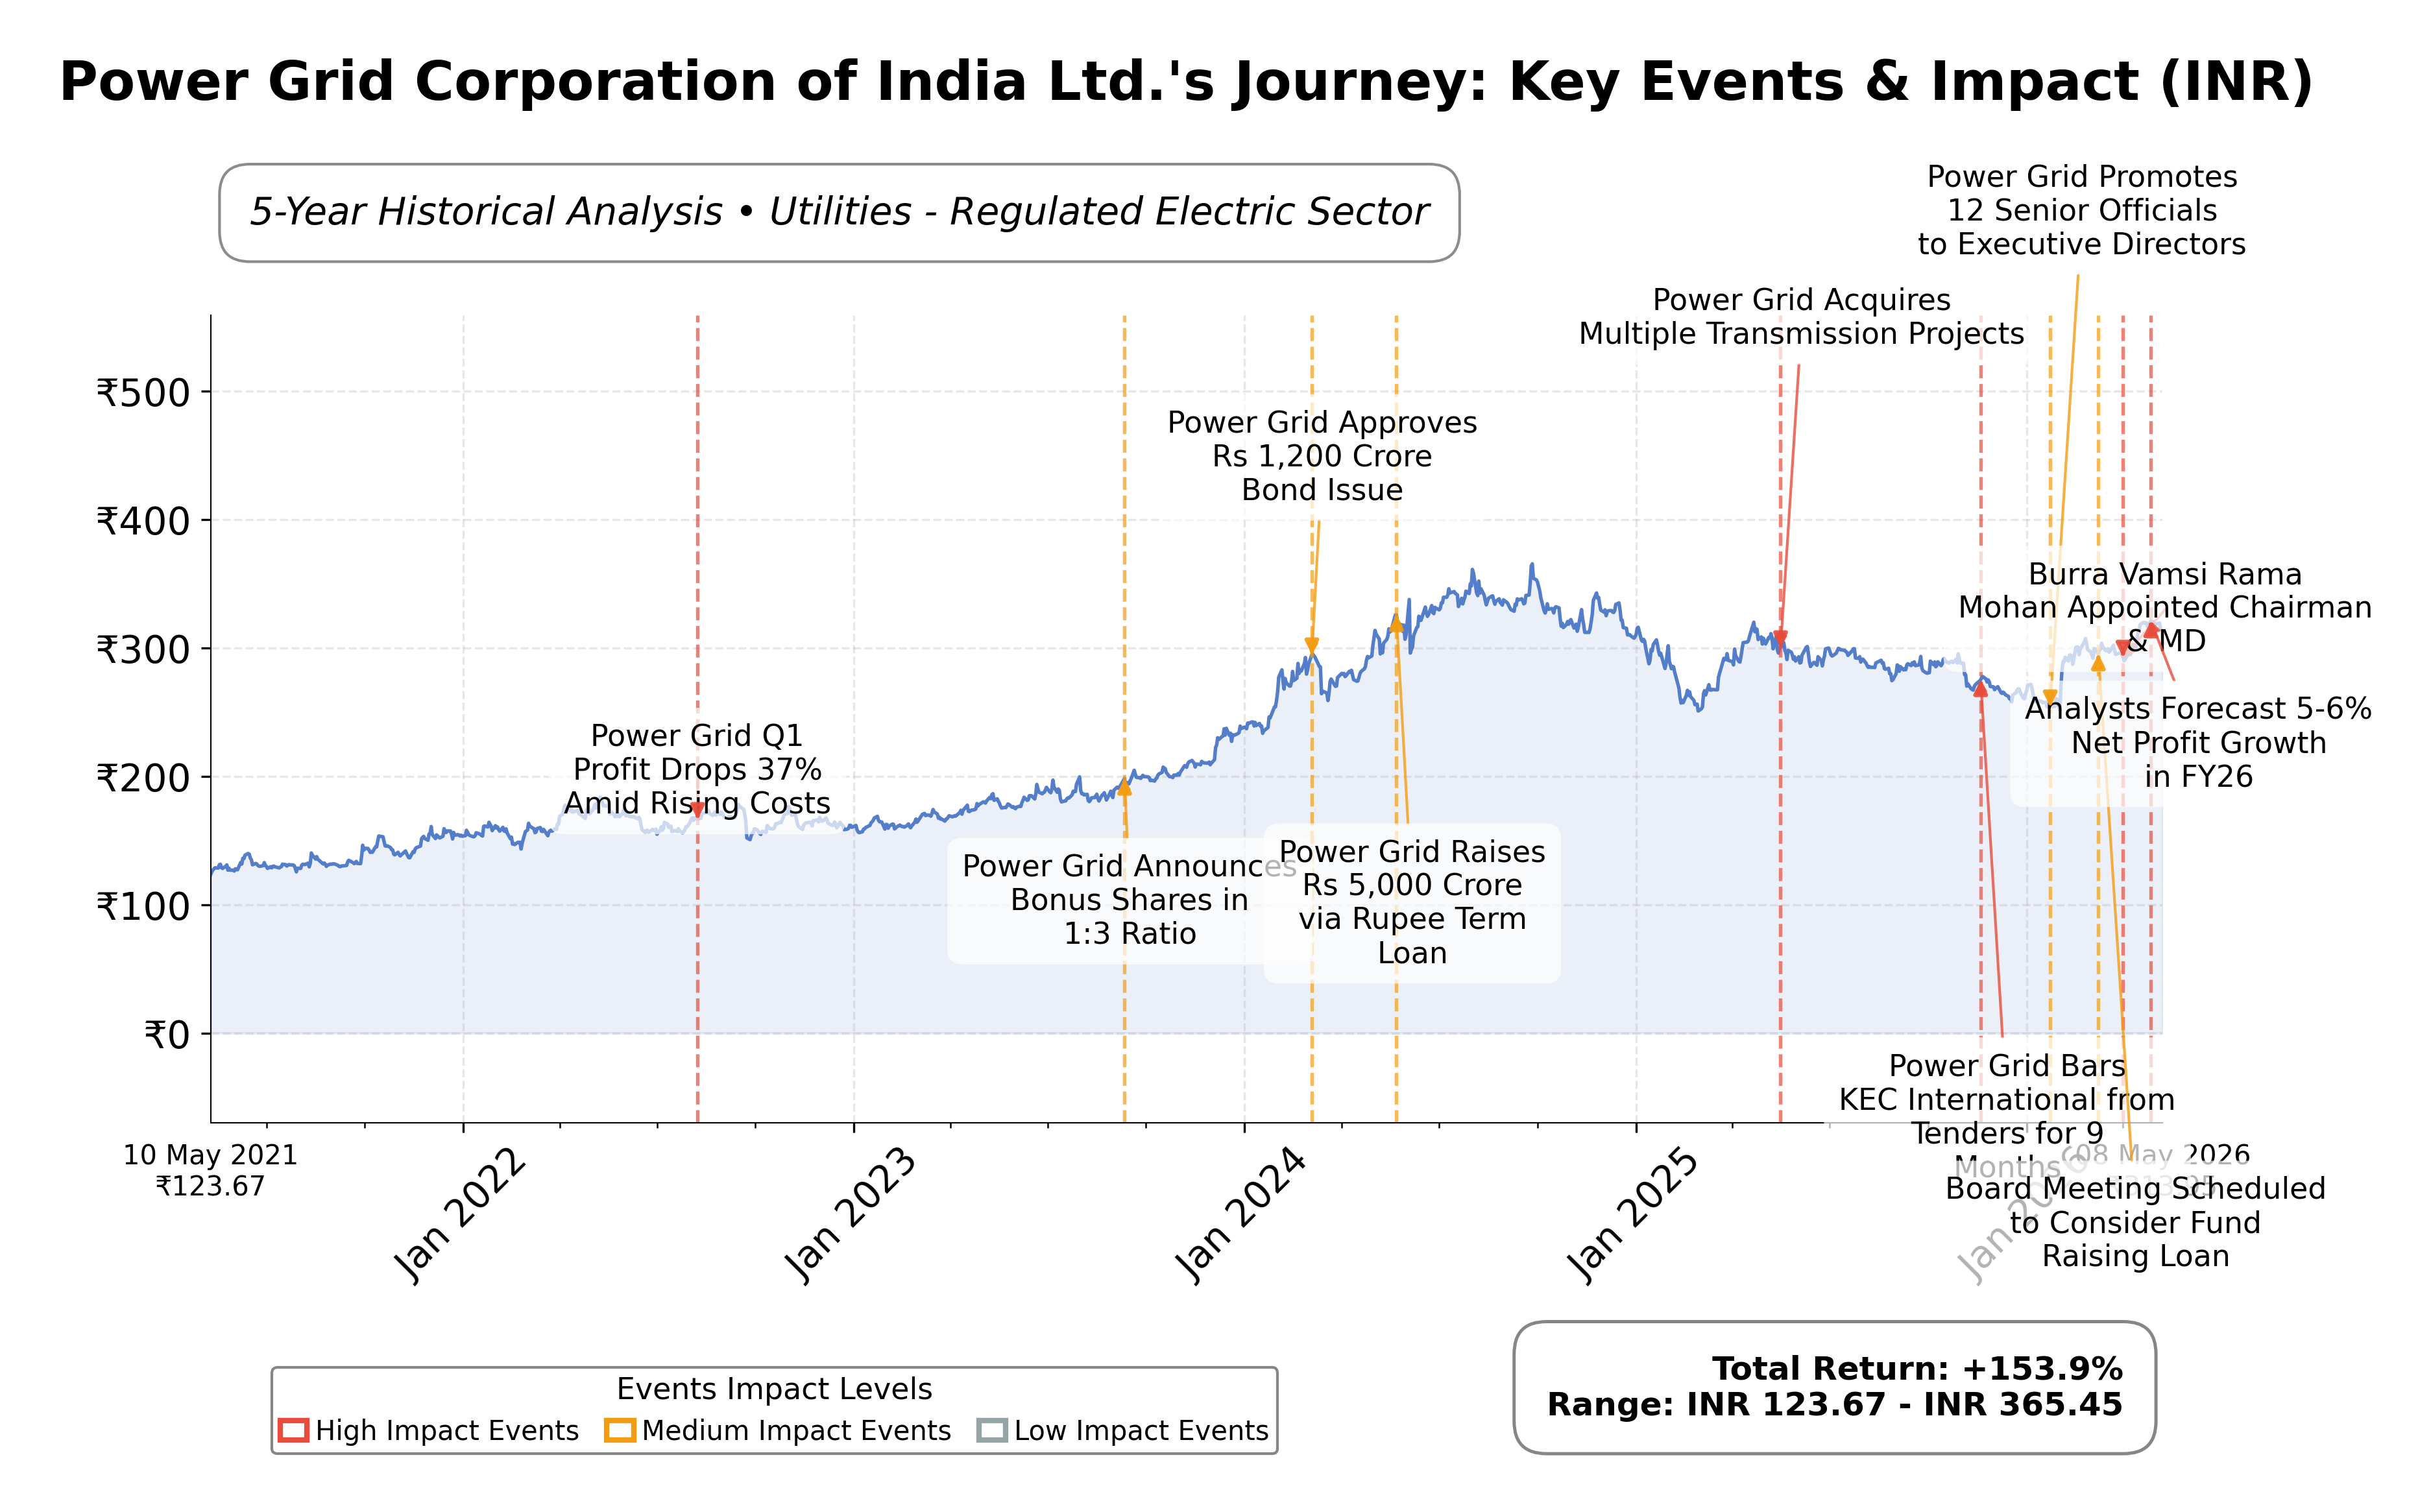
Stock Journey
Key Positives and Key Risks
Pros
- Strong operating margin of 58.67% demonstrates efficient operations supporting profitability.
- Robust operating cash flow of ₹267.7 billion underpins financial stability and dividend capacity.
- Return on equity of 16.75% indicates effective use of shareholder capital.
Cons
- High debt-to-equity ratio of 141.19 raises concerns about financial leverage and risk.
- Current ratio of 0.73 suggests potential liquidity constraints in the short term.
- Price-to-book ratio of 2.94 reflects a premium valuation that may limit upside potential.
Disclosure: This information is for general awareness and does not constitute investment advice
Report Summary
Power Grid Corporation of India Ltd. (POWERGRID) operates as one of India's largest electric power transmission companies, primarily engaged in planning, implementing, owning, and maintaining high-voltage transmission systems. Listed on the NSE under the Utilities sector, it plays a critical role in connecting power generation zones to consumption areas nationwide. The company also offers consultancy services and telecommunication ventures, positioning itself as a key infrastructure player supporting India's energy security and grid stability.
Financially, POWERGRID reported trailing twelve months (TTM) revenue of approximately ₹473.4 billion with a profit margin of 32.79%, indicating strong profitability. Operating margin stands at 58.67%, reflecting operational efficiency. The company’s return on equity (ROE) is 16.75%, and return on assets (ROA) is 5.83%, demonstrating effective use of shareholder equity and assets. Its operating cash flow for the TTM period is ₹267.7 billion, with free cash flow of ₹155.2 billion, underscoring robust cash generation.
Valuation metrics show a trailing P/E ratio of 20.10 and a forward P/E of 16.94, with a price-to-book ratio of 2.94 and an EV/EBITDA of 10.68. The market capitalization is approximately ₹2.92 trillion. The stock price currently trades near ₹313.90, within a 52-week range of ₹250 to ₹324.95, indicating it is near its recent high. The PEG ratio of 1.95 suggests moderate growth expectations relative to earnings.
Key strengths include a stable, regulated business model with strong cash flows and market leadership in India’s power transmission sector. However, the company carries significant debt, with a debt-to-equity ratio exceeding 140%, which poses leverage risks. Recent strategic actions include ongoing capital expenditure and asset capitalization supporting growth. The company is scheduled to announce Q4 results and dividend payout on 16 May 2026, reflecting active investor engagement.
Technically, POWERGRID’s stock is trading above its 50-day and 200-day moving averages, indicating an upward trend. Momentum indicators suggest moderate strength, but the relatively low beta of 0.24 points to lower volatility. Market sentiment appears cautiously optimistic amid steady earnings growth and sector tailwinds, though leverage concerns warrant monitoring. Overall, the data suggests a balanced stance with attention to evolving fundamentals and market conditions.
Company and Industry Overview
Company Basics
Price Performance
Company Size
Shareholding Pattern
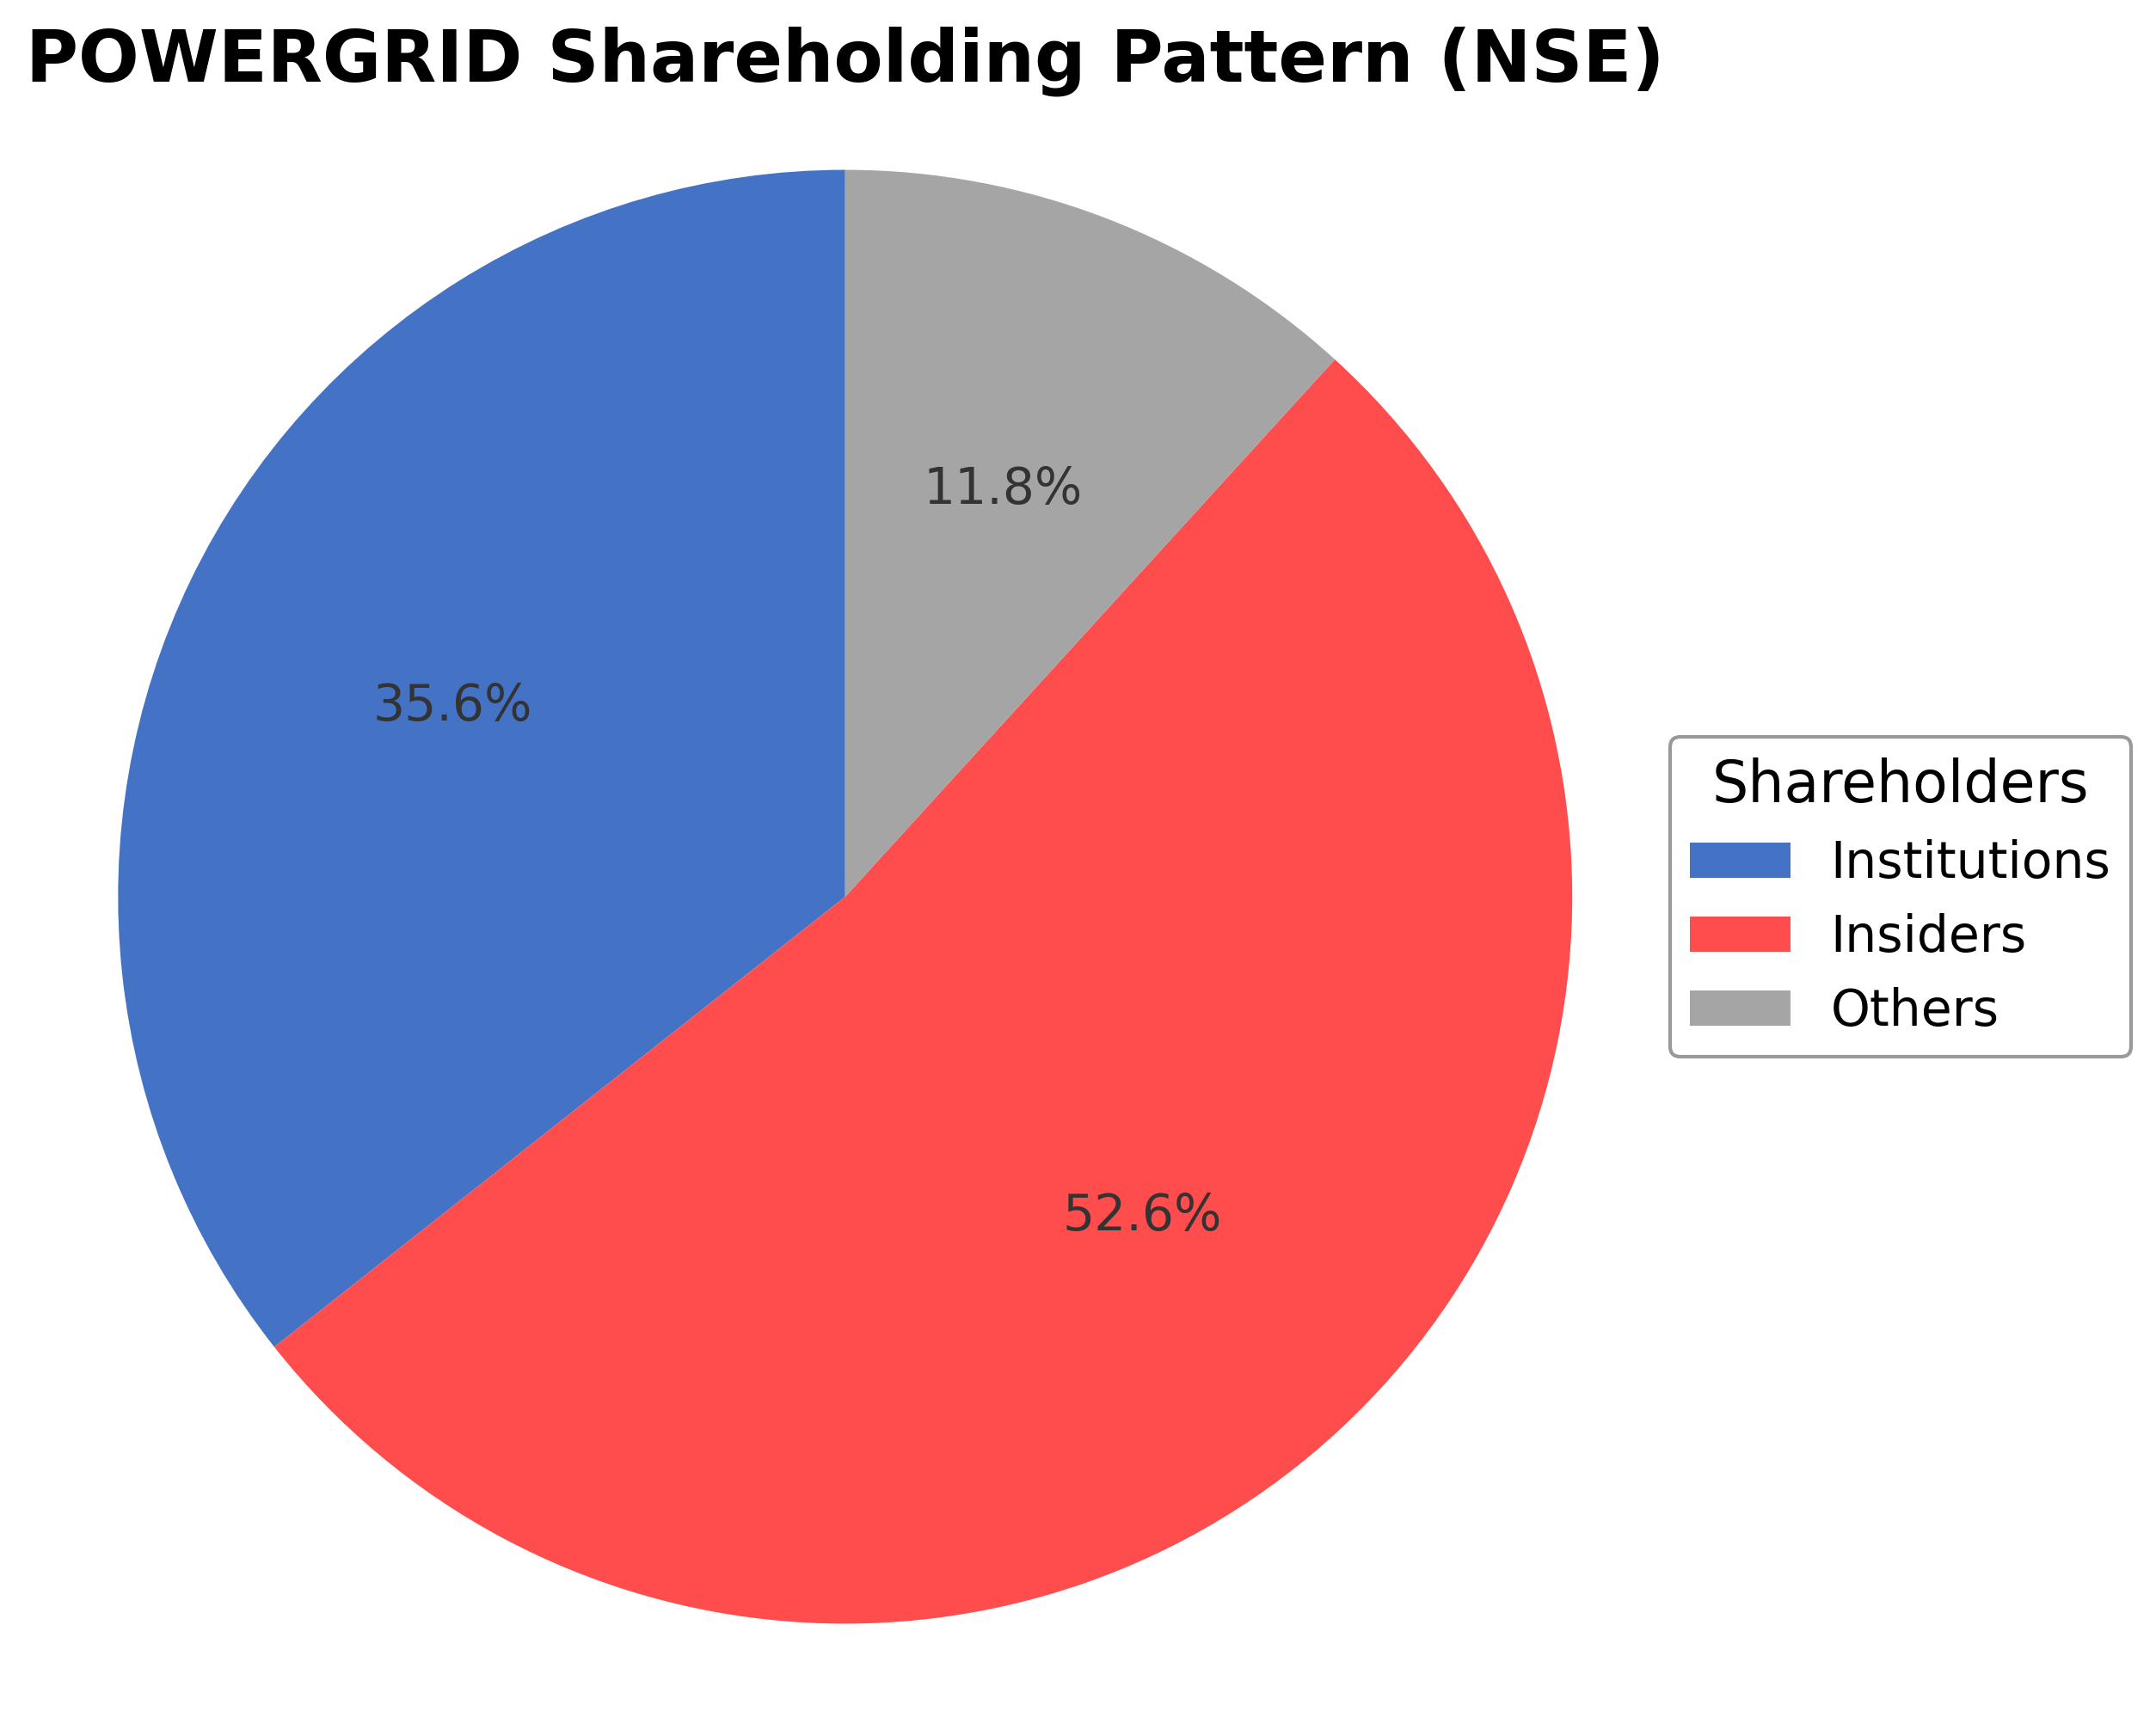
Power Grid Corporation of India Ltd. has a shareholding structure dominated by insiders, including promoters holding 52.61%, reflecting strong government and executive ownership. Institutional investors account for 35.63%, comprising mutual funds, pension funds, and asset managers, indicating significant institutional confidence. Public and other shareholders hold the remaining 11.76%. Over the past 12-24 months, institutional ownership has remained relatively stable with no major shifts reported, suggesting steady market sentiment. This ownership pattern supports governance aligned with strategic national energy objectives and provides a stable shareholder base influencing long-term corporate actions.
Sector and Industry Analysis
The Indian power grids sector is valued at approximately USD 11.3 billion as of 2025 and is projected to grow at a compound annual growth rate (CAGR) of 5.74% to reach USD 19.0 billion by 2034. This growth is driven by increasing electricity demand from urbanization and industrialization. Major players include Power Grid Corporation of India Ltd (POWERGRID), which is actively involved in expanding transmission infrastructure and integrating renewable energy sources.
Industry trends highlight a significant shift towards renewable energy integration, with solar, wind, and biopower constituting about 35% of India’s installed capacity. The sector is witnessing investments in high-voltage direct current (HVDC) technology to enhance grid efficiency and stability, exemplified by POWERGRID’s recent contract for a ±800 kV, 6,000 MW HVDC link. Competitive dynamics are shaped by technological advancements and government incentives, although barriers such as high capital expenditure and complex grid modernization challenges remain.
The regulatory environment strongly supports grid modernization and renewable energy integration through policies promoting smart grid technologies and transmission infrastructure upgrades. Government initiatives aim to improve grid reliability and reduce transmission losses, facilitating the integration of 500 GW of renewable capacity by enhancing long-distance transmission capabilities. These regulations are expected to sustain sector growth and encourage continued investment in advanced power transmission solutions.
Note: Analysis synthesized from industry research, market reports, and regulatory filings. Information is subject to change based on market conditions.
Financial Ratios Dashboard
Illustrative Scenario Analysis
DCF Assumptions:
Method: Two-Stage EPS-Priority Model
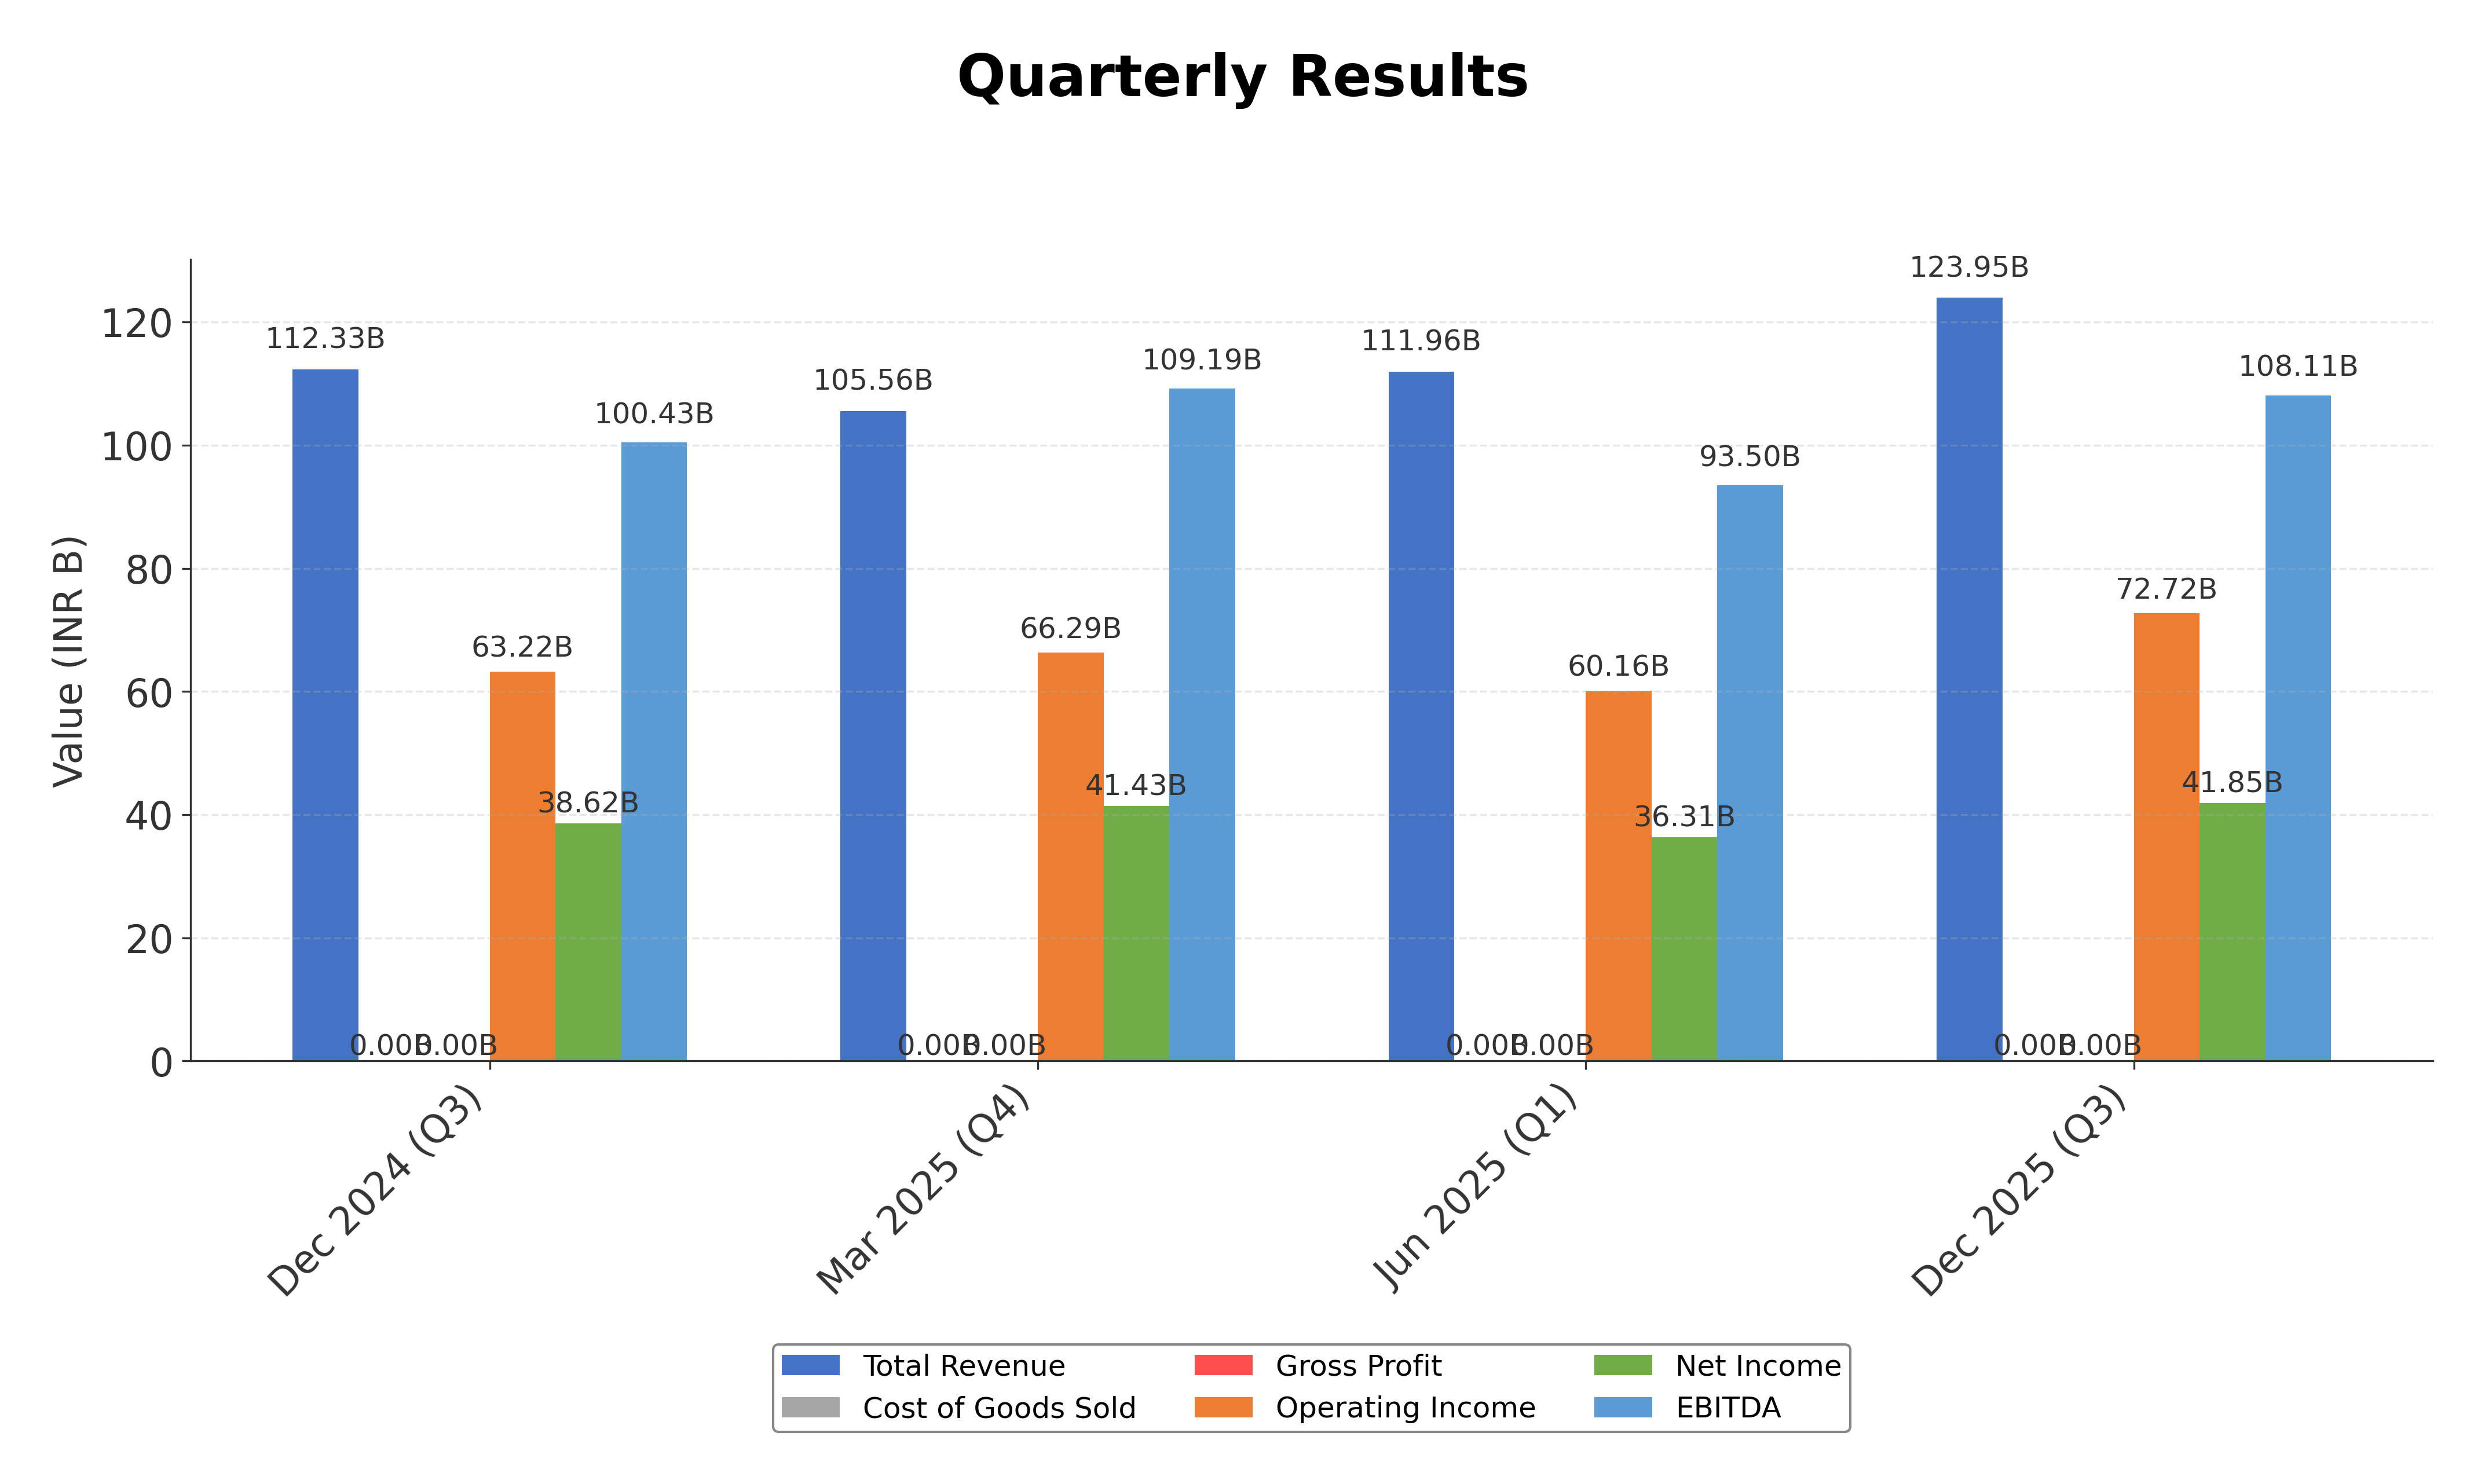
Financials
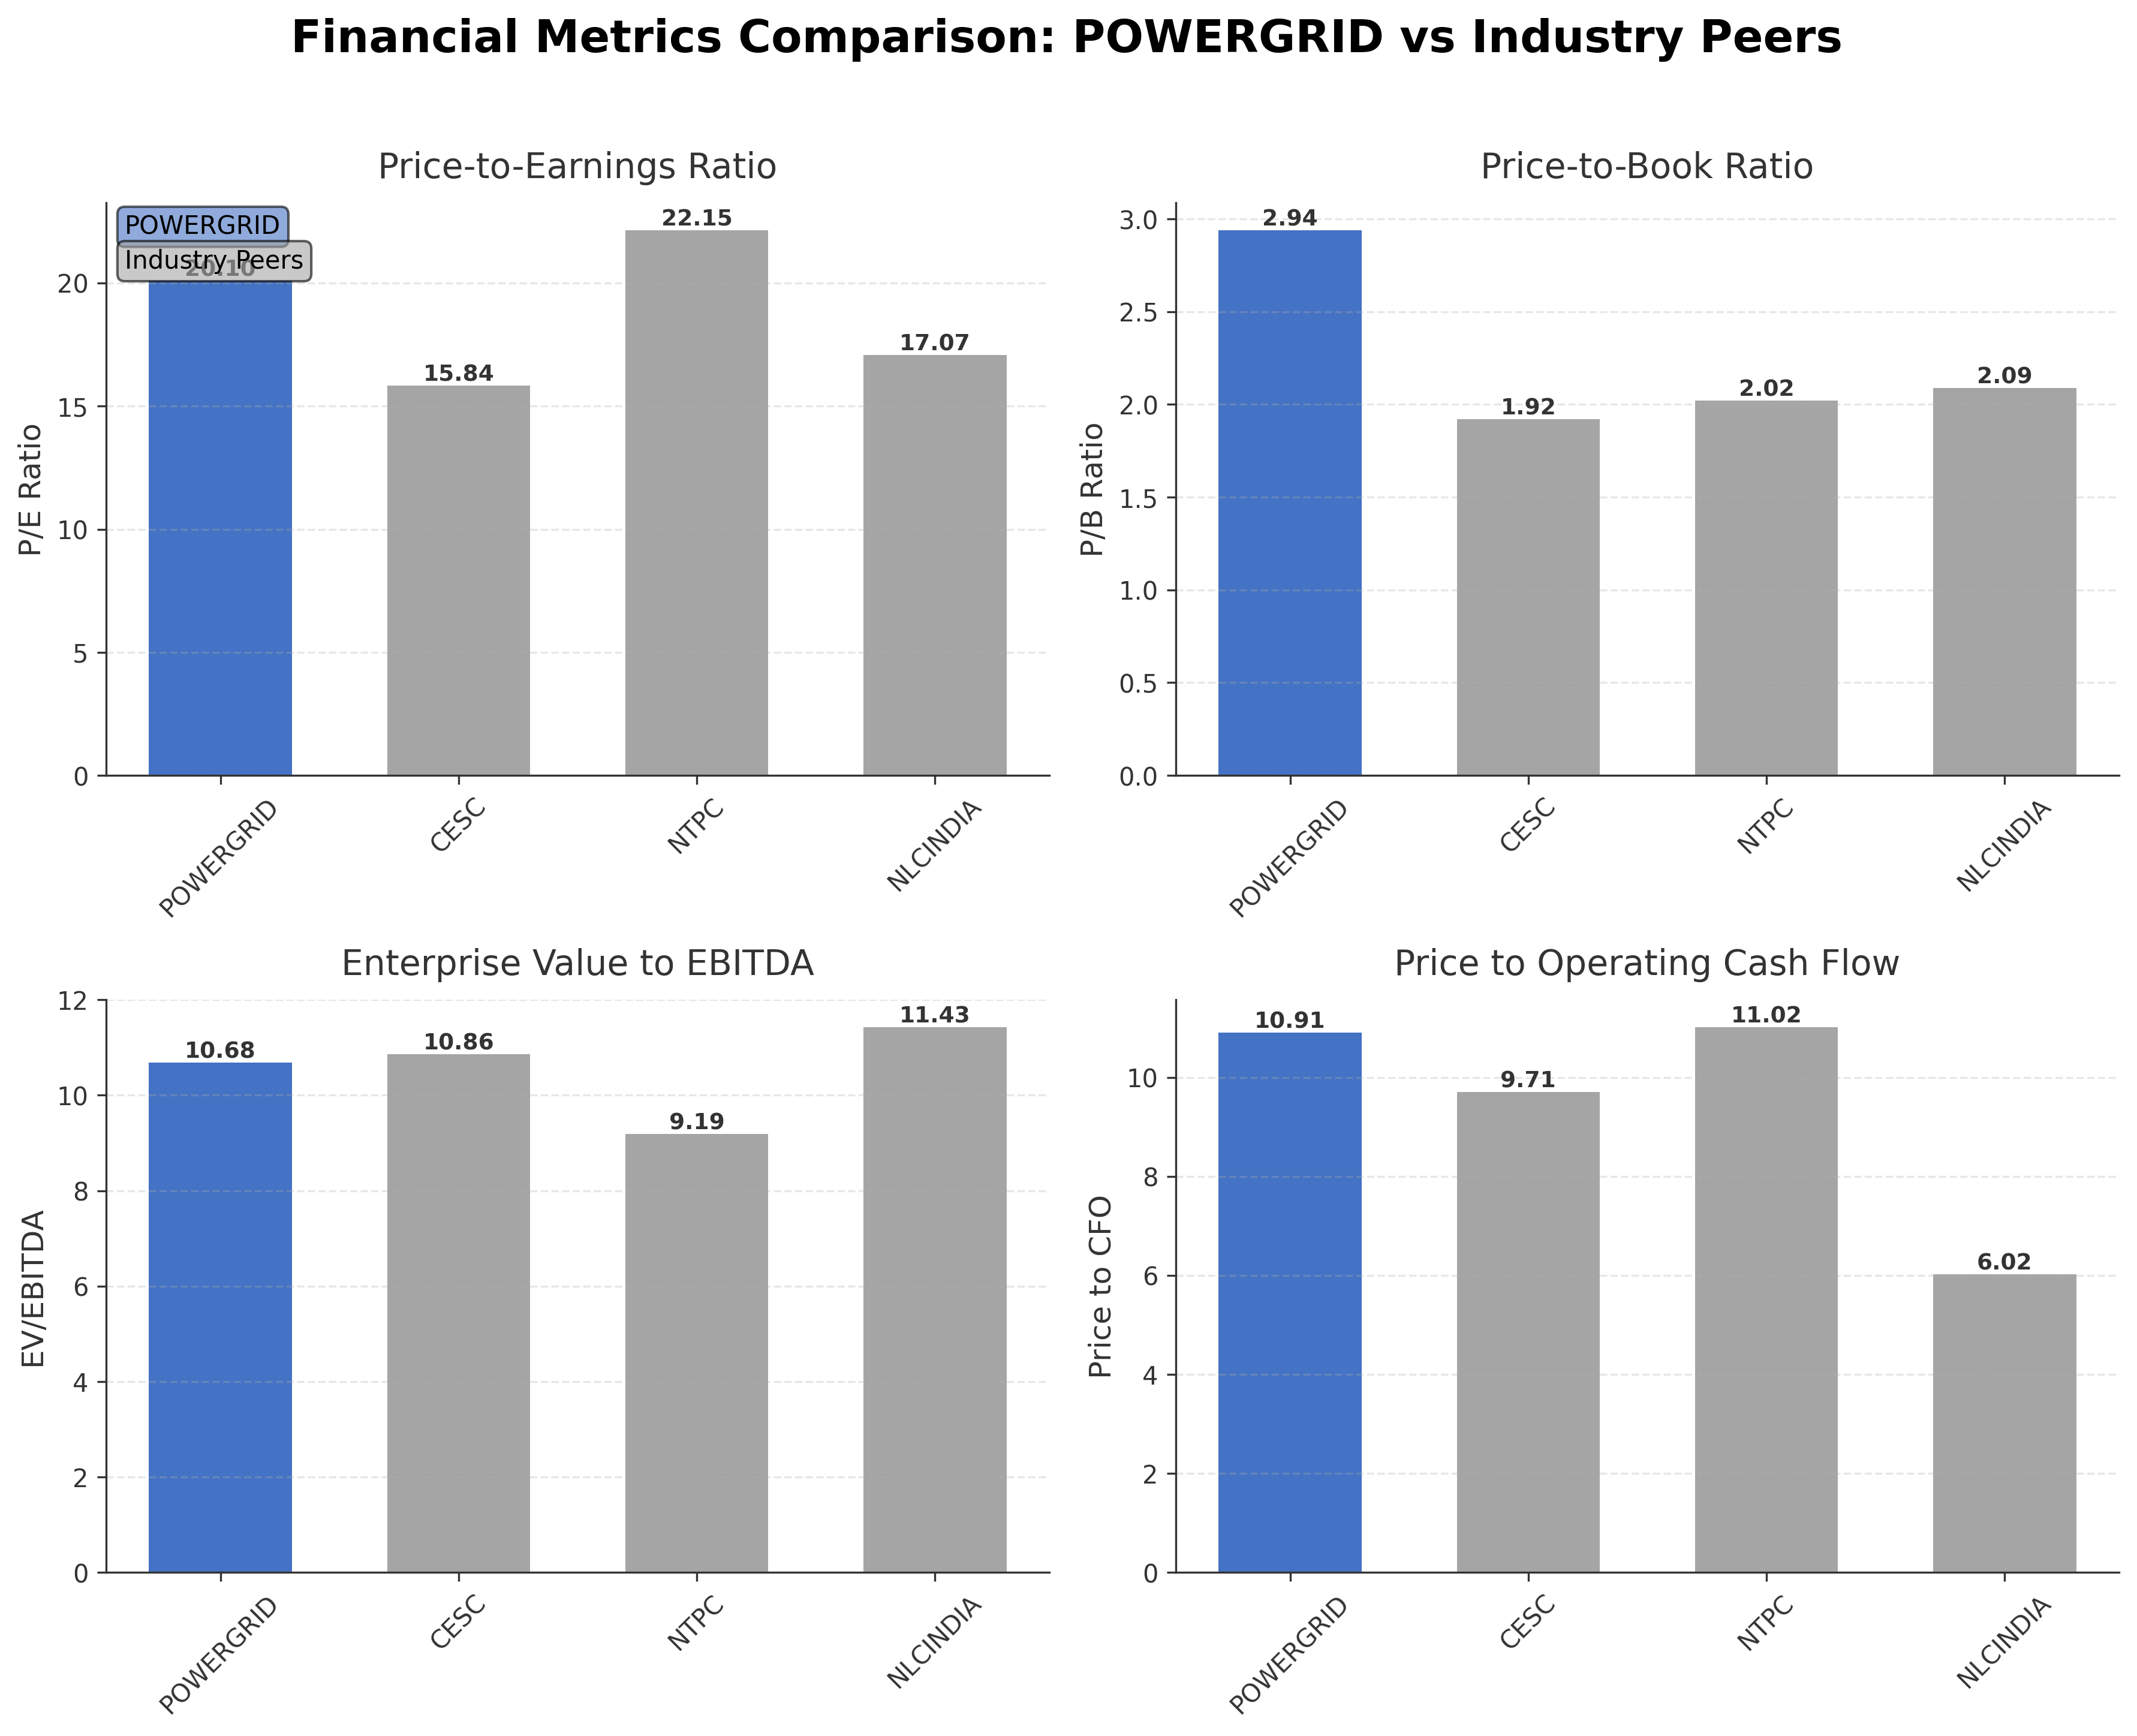
Peer Analysis
| Company Name | Market Cap | P/E Ratio | P/B Ratio | EV/EBITDA | Price to CFO |
|---|---|---|---|---|---|
| Power Grid Corporation of India Ltd. | ₹2.92T | 20.10 | 2.94 | 10.68 | 10.91 |
| CESC Ltd. | ₹244.45B | 15.84 | 1.92 | 10.86 | 9.71 |
| Ntpc Ltd. | ₹3.90T | 22.15 | 2.02 | 9.19 | 11.02 |
| NLC India Ltd. | ₹455.09B | 17.07 | 2.09 | 11.43 | 6.02 |
Comparison Analysis: Power Grid Corporation of India Ltd. holds a leading market capitalization of ₹2.92 trillion among its peers, with a P/E ratio of 20.10 that is moderate compared to NTPC's higher 22.15 and above CESC's 15.84. Its price-to-book ratio of 2.94 is the highest among peers, indicating a premium valuation relative to book value. The EV/EBITDA multiple of 10.68 is in line with industry standards, slightly lower than NLC India's 11.43 but higher than NTPC's 9.19. POWERGRID’s return on equity at 16.75% surpasses its peers, reflecting superior profitability. The price to CFO ratio of 10.91 suggests reasonable cash flow valuation compared to peers. Overall, POWERGRID demonstrates strong financial metrics with a premium valuation consistent with its market leadership.
Financial Metrics Comparison with Peers
Financial Statements
Comprehensive financial data including income, balance sheet, and cash flow metrics
Income Statement
| fiscal_date | 2025-03-31 | 2024-03-31 | 2023-03-31 | 2022-03-31 | 2021-03-31 |
|---|---|---|---|---|---|
| Sales | 440.73B | 442.03B | 440.05B | 407.90B | 393.01B |
| Cost Of Goods | 16.17B | 14.97B | 13.26B | 13.17B | 11.70B |
| Gross Profit | 424.56B | 427.06B | 426.79B | 394.73B | 381.31B |
| Operating Expense Selling General And Administrative | 8.76B | 5.28B | 4.62B | 3.43B | 2.80B |
| Operating Expense Other Operating Expenses | 14.70B | 13.01B | 13.01B | 10.74B | 9.40B |
| Operating Income | 257.62B | 260.34B | 255.21B | 232.66B | 230.52B |
| Non Operating Interest Income | 16.65B | 15.98B | 16.74B | 8.62B | 2.72B |
| Non Operating Interest Expense | 91.10B | 89.45B | 84.64B | 79.10B | 87.28B |
| Pretax Income | 190.18B | 190.85B | 174.53B | 201.39B | 151.39B |
| Income Tax | 37.73B | 29.41B | 22.82B | 27.86B | 34.64B |
| Net Income | 155.21B | 155.73B | 154.20B | 168.24B | 120.36B |
| Eps Basic | 16.69 | 16.74 | 16.58 | 18.09 | 12.95 |
| Eps Diluted | 16.69 | 16.74 | 16.58 | 18.09 | 12.95 |
| Basic Shares Outstanding | 9.30B | 9.30B | 9.30B | 9.30B | 9.30B |
| Diluted Shares Outstanding | 9.30B | 9.30B | 9.30B | 9.30B | 9.30B |
| Ebit | 281.28B | 280.30B | 259.17B | 280.50B | 238.67B |
| Ebitda | 407.22B | 411.30B | 393.94B | 375.92B | 369.66B |
| Net Income Continuous Operations | 193.53B | 183.93B | 177.54B | 194.97B | 155.75B |
| Preferred Stock Dividends | 0.00 | 0.00 | 0.00 | 0.00 | 0.00 |
| Operating Expense Research And Development | N/A | N/A | N/A | 3.40M | 45.50M |
Source: Financial statements and regulatory filings
Balance Sheet
| fiscal_date | 2025-03-31 | 2024-03-31 | 2023-03-31 | 2022-03-31 | 2021-03-31 |
|---|---|---|---|---|---|
| Cash And Cash Equivalents | 31.38B | 28.41B | 41.44B | 25.77B | 44.87B |
| Accounts Receivable | 79.65B | 115.40B | 148.84B | 133.70B | 86.29B |
| Total Assets | 2661.07B | 2508.91B | 2522.73B | 2551.98B | 2556.90B |
| Total Liabilities | 1734.44B | 1637.45B | 1692.47B | 1789.42B | 1857.53B |
| Long Term Debt | 1133.98B | 1086.17B | 1174.41B | 1142.27B | 1326.80B |
| Shareholders Equity | 926.63B | 871.45B | 830.26B | 762.56B | 699.36B |
Source: Financial statements and regulatory filings
Cash Flow Statement
| fiscal_date | 2025-03-31 | 2024-03-31 | 2023-03-31 | 2022-03-31 | 2021-03-31 |
|---|---|---|---|---|---|
| Operating Activities Net Income | 193.53B | 183.93B | 177.54B | 194.97B | 155.75B |
| Operating Activities Other Non Cash Items | 67.09B | 80.52B | 82.22B | 74.82B | 63.09B |
| Operating Activities Accounts Receivable | 34.53B | 36.02B | -21.20B | -5.67B | -34.24B |
| Operating Activities Other Assets Liabilities | -27.44B | -25.49B | 46.69B | -57.84B | 10.95B |
| Operating Activities Operating Cash Flow | 267.71B | 274.99B | 285.25B | 206.29B | 195.55B |
| Investing Activities Capital Expenditures | -241.11B | -114.04B | -82.43B | -79.66B | -96.17B |
| Investing Activities Net Acquisitions | 4.70B | -3.70B | -16.60M | 26.88B | -3.41B |
| Investing Activities Purchase Of Investments | -17.04B | -20.80B | 0.00 | -14.70B | 0.00 |
| Investing Activities Sale Of Investments | 23.38B | 14.84B | 0.00 | 14.86B | 0.00 |
| Investing Activities Other Investing Activity | -12.46B | -11.47B | 7.10B | 5.26B | 6.55B |
| Investing Activities Investing Cash Flow | -242.54B | -135.16B | -75.34B | -47.36B | -93.02B |
| Financing Activities Long Term Debt Issuance | 193.24B | 80.53B | 91.40B | 25.85B | 78.40B |
| Financing Activities Long Term Debt Payments | -157.02B | -134.41B | -155.41B | -193.11B | -241.69B |
| Financing Activities Short Term Debt Issuance | 30.16B | 709.10M | -68.58B | 35.00B | -12.00B |
| Financing Activities Common Dividends | -97.66B | -112.19B | -85.45B | -108.12B | -68.22B |
| Financing Activities Financing Cash Flow | -31.27B | -165.36B | -218.03B | -240.38B | -243.10B |
| End Cash Position | 37.97B | 34.64B | 51.92B | 25.77B | 44.87B |
| Free Cash Flow | 120.89B | 258.86B | 319.60B | 181.57B | 197.86B |
| Financing Activities Other Financing Charges | N/A | N/A | N/A | N/A | 409.30M |
Source: Financial statements and regulatory filings
Technical Analysis
Key Insights
- The current trend direction is upward, with the stock price trading above both the 50-day moving average (₹304.22) and the 200-day moving average (₹284.74), indicating bullish momentum.
- Key support levels are identified near ₹300 and ₹285, while resistance is observed close to the 52-week high of ₹324.95.
- The stock is positioned above its 10-day, 50-day, and 200-day moving averages, suggesting sustained strength across short and long-term horizons.
- Momentum indicators show the RSI in a moderate range, indicating neither overbought nor oversold conditions; MACD signals a positive crossover, supporting upward momentum.
- Analysis across daily, weekly, and monthly timeframes confirms a consistent bullish trend with no significant divergence.
- Potential market scenarios include continuation of the upward trend if support holds, while a breach below key support levels could signal consolidation or correction.
Trending News
1. Headline: Q4 Results Next Week: Bharti Airtel, HAL, Tata Motors, Cochin Shipyard, Premier Energies, ITC Hotels And More
Summary: PVR Inox, Dixon Technologies, Dr Reddys Laboratories, Tata Steel, Cipla, JSW Steel and NCC, among others will declare earnings from May 11 and 16.
Sentiment: neutral
2. Headline: North America’s power grid watchdog warns data centers are putting pressure on power supply - The Times of India
Summary: Tech News News: The North American Electric Reliability Corporation (NERC), the organization responsible for monitoring the reliability of the power grid across the U.
Sentiment: negative
Summary: A new International Institute for Sustainable Development report says India’s state-run energy firms can strengthen energy security by shifting over ₹2 trillion annually from fossil fuels to clean energy investments.
Sentiment: positive
4. Headline: Maharatna PSU Power Grid Corporation of India sets board meeting date to declare Q4 results 2026 | Stock Market News
Summary: Maharatna PSU Power Grid has set Saturday, 16 May, as the date to consider Q4 results along with dividend payout.
Sentiment: neutral
5. Headline: Power Grid: steady returns ride power boom, but debt clouds outlook | Stock Market News
Summary: India’s transmission giant benefits from a regulated, cash-flow-stable model and rising electricity demand, but fresh borrowing plans put the spotlight on leverage risks
Sentiment: positive
Recent Updates
News Summary
As of 6 May 2026. Power Grid Corporation of India has scheduled its board meeting for 16 May 2026 to approve the audited financial results for the fiscal year ending March 2026 and to consider the final dividend payout. Analysts from Kotak Institutional Equities and Motilal Oswal Financial Services anticipate a modest profit growth of approximately 5-6% year-on-year for Q4 FY26, supported by improved asset capitalization and increased capital expenditure. The company has demonstrated steady revenue growth and consistent dividend declarations, with 44 dividends announced since 2008. Despite the positive earnings outlook and stable cash flows, concerns remain regarding the company's high leverage, as fresh borrowing plans highlight potential debt risks. The stock has shown an 8% increase over the last three months and an 18% gain year-to-date, reflecting investor interest amid a volatile market environment.
News Sentiment
The overall sentiment from recent updates is cautiously positive. Earnings growth expectations and steady dividend history contribute to a favorable view, while the company's regulated business model and rising electricity demand provide structural support. However, the elevated debt levels and new borrowing plans introduce a note of caution, tempering enthusiasm. Market participants appear to be balancing optimism about growth prospects with vigilance regarding financial leverage, resulting in a measured outlook.
Source List
- https://www.livemint.com/market/stock-market-news/maharatna-psu-power-grid-corporation-of-india-sets-board-meeting-date-to-declare-q4-results-2026-11778063256308.html
- https://www.livemint.com/market/stock-market-news/power-grid-steady-returns-ride-power-boom-but-debt-clouds-outlook-11777891955028.html
Analytical Overview
Analysis Summary
Power Grid Corporation of India Ltd. trades at a trailing P/E of 20.10 and a forward P/E of 16.94, which are in line with the industry average of approximately 20.10, indicating fair valuation relative to peers. The PEG ratio of 1.95 suggests moderate growth expectations relative to earnings. The company exhibits a positive growth trajectory with a quarterly revenue growth rate of 10.3% and an 8.4% year-over-year increase in quarterly earnings, supported by increased asset capitalization and capital expenditure.
Financial health shows a high debt-to-equity ratio of 141.19, reflecting significant leverage, but the company maintains strong operating cash flow of ₹267.7 billion and free cash flow of ₹155.2 billion, indicating solid cash generation capacity. Sector-specific challenges include managing leverage amid ongoing infrastructure investments, while opportunities arise from India’s expanding electricity demand and renewable energy integration. The regulatory environment in India favors utilities with stable cash flows, but evolving energy policies and capital allocation priorities require careful monitoring.
Overall Business and Market Assessment
Supporting Factors: No data
Risk Factors: Power Grid’s strengths lie in its regulated business model, steady revenue growth, and robust cash flow generation, which support operational stability and dividend payouts. Key risks include the high leverage ratio and potential impacts of fresh borrowing on financial flexibility. The company is well-positioned to benefit from India’s power sector growth over the medium to long term, but debt management remains a critical factor. Overall, the investment profile reflects a balanced risk-reward scenario suitable for investors with a medium-term horizon.
SWOT Analysis
Strengths
- Market leadership in India’s electric power transmission sector.
- Strong operating margin of 58.67% indicating operational efficiency.
- Robust cash flow generation with operating cash flow of ₹267.7 billion.
- Consistent dividend history supporting shareholder returns.
Weaknesses
- High debt-to-equity ratio of 141.19 indicating significant leverage.
- Current ratio below 1 at 0.73, suggesting liquidity constraints.
- Price-to-book ratio of 2.94 reflects premium valuation which may limit upside.
- Dependence on regulatory environment for revenue stability.
Opportunities
- Growing electricity demand in India supports transmission capacity expansion.
- Strategic capital reallocation towards renewable energy integration.
- Potential for increased asset capitalization driving profit growth.
- Government support for infrastructure development and energy security.
Threats
- Rising leverage may increase financial risk amid borrowing plans.
- Regulatory changes could impact tariff structures and profitability.
- Competition from emerging transmission players and alternative energy sources.
- Macroeconomic factors affecting capital expenditure and project timelines.
Company Description
Power Grid Corporation of India Ltd. operates as one of India's largest electric power transmission organizations. Its primary function is to plan, implement, own, and maintain high-voltage transmission systems that ensure reliable and efficient electricity supply across the nation. With a focus on inter-regional transmission projects, the company connects power from different generation zones to various consumption areas in the country, playing a vital role in national energy security and grid stability. Power Grid also offers consultancy services and is involved in telecommunication ventures through its widespread network of overhead optical ground wires. With significant investments in grid expansion and renewable energy integration, the company is pivotal to India's energy infrastructure, supporting industries, commercial sectors, and domestic users alike. Headquartered in Gurugram, Haryana, Power Grid is a cornerstone entity in India's utility sector, actively contributing to the nation's economic growth through enhanced electricity transmission capabilities.