
Pondy Oxides & Chemicals Ltd (POCL)
Stock Analysis Report
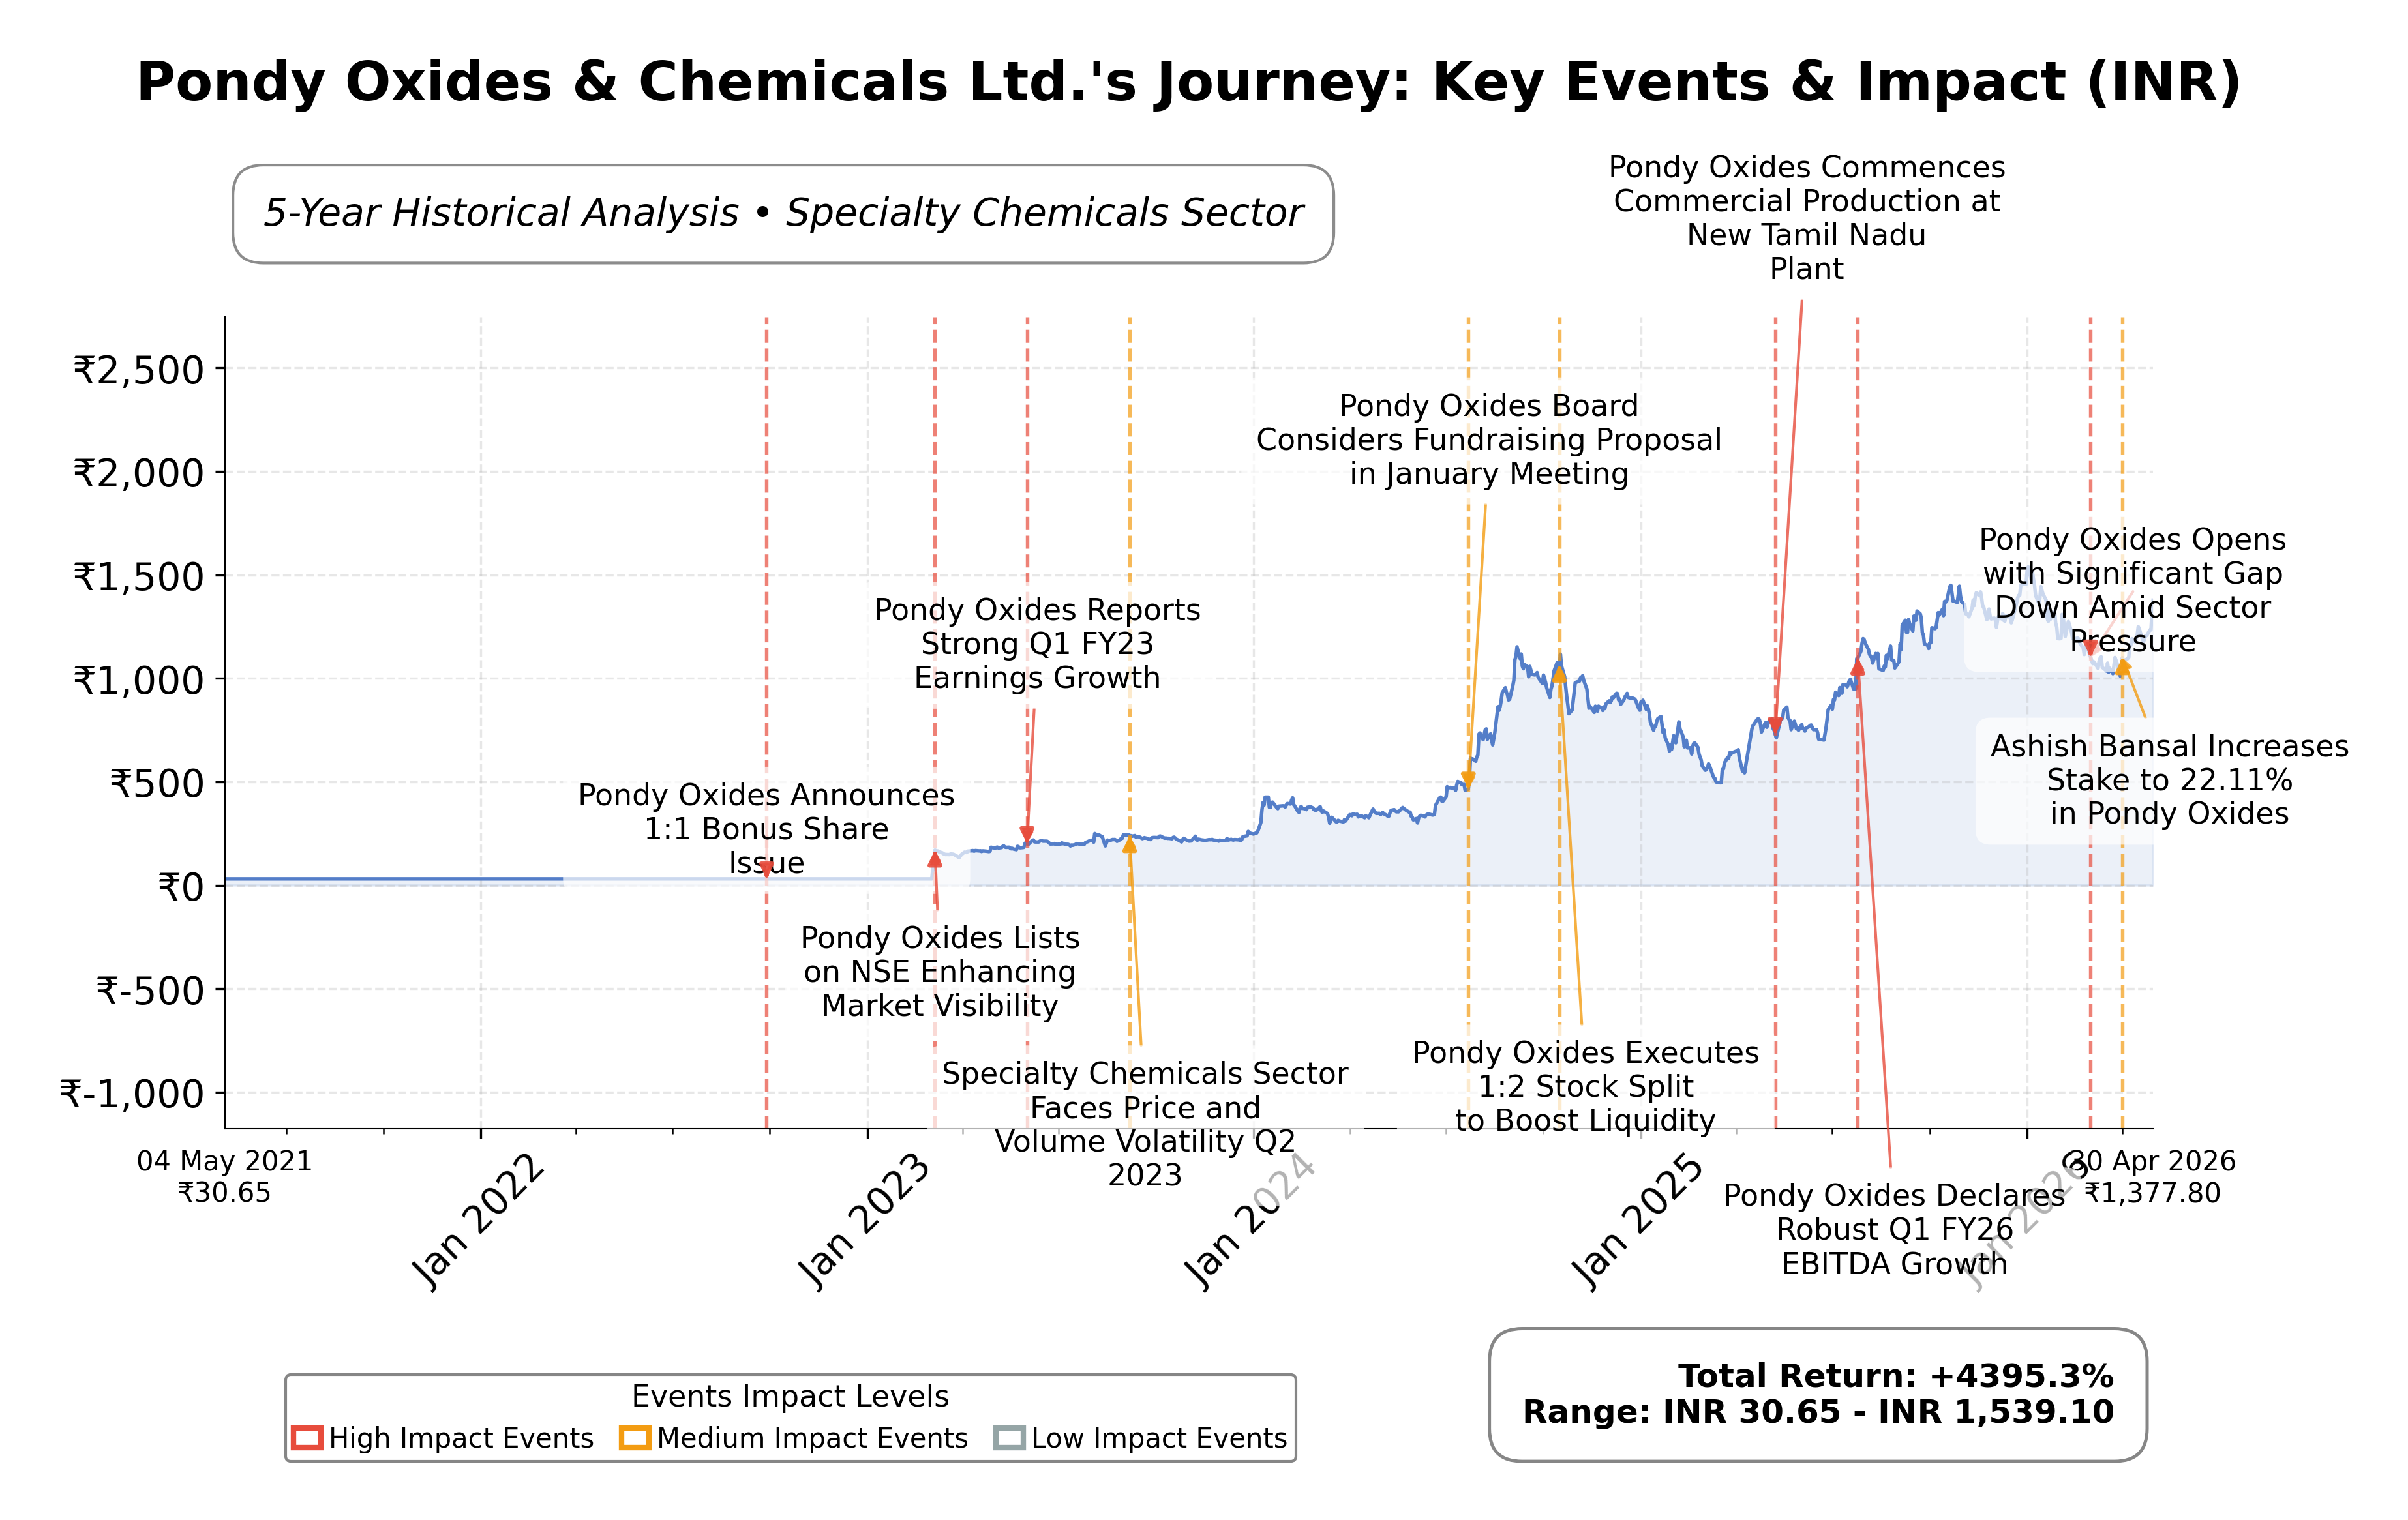
Stock Journey
Key Positives and Key Risks
Pros
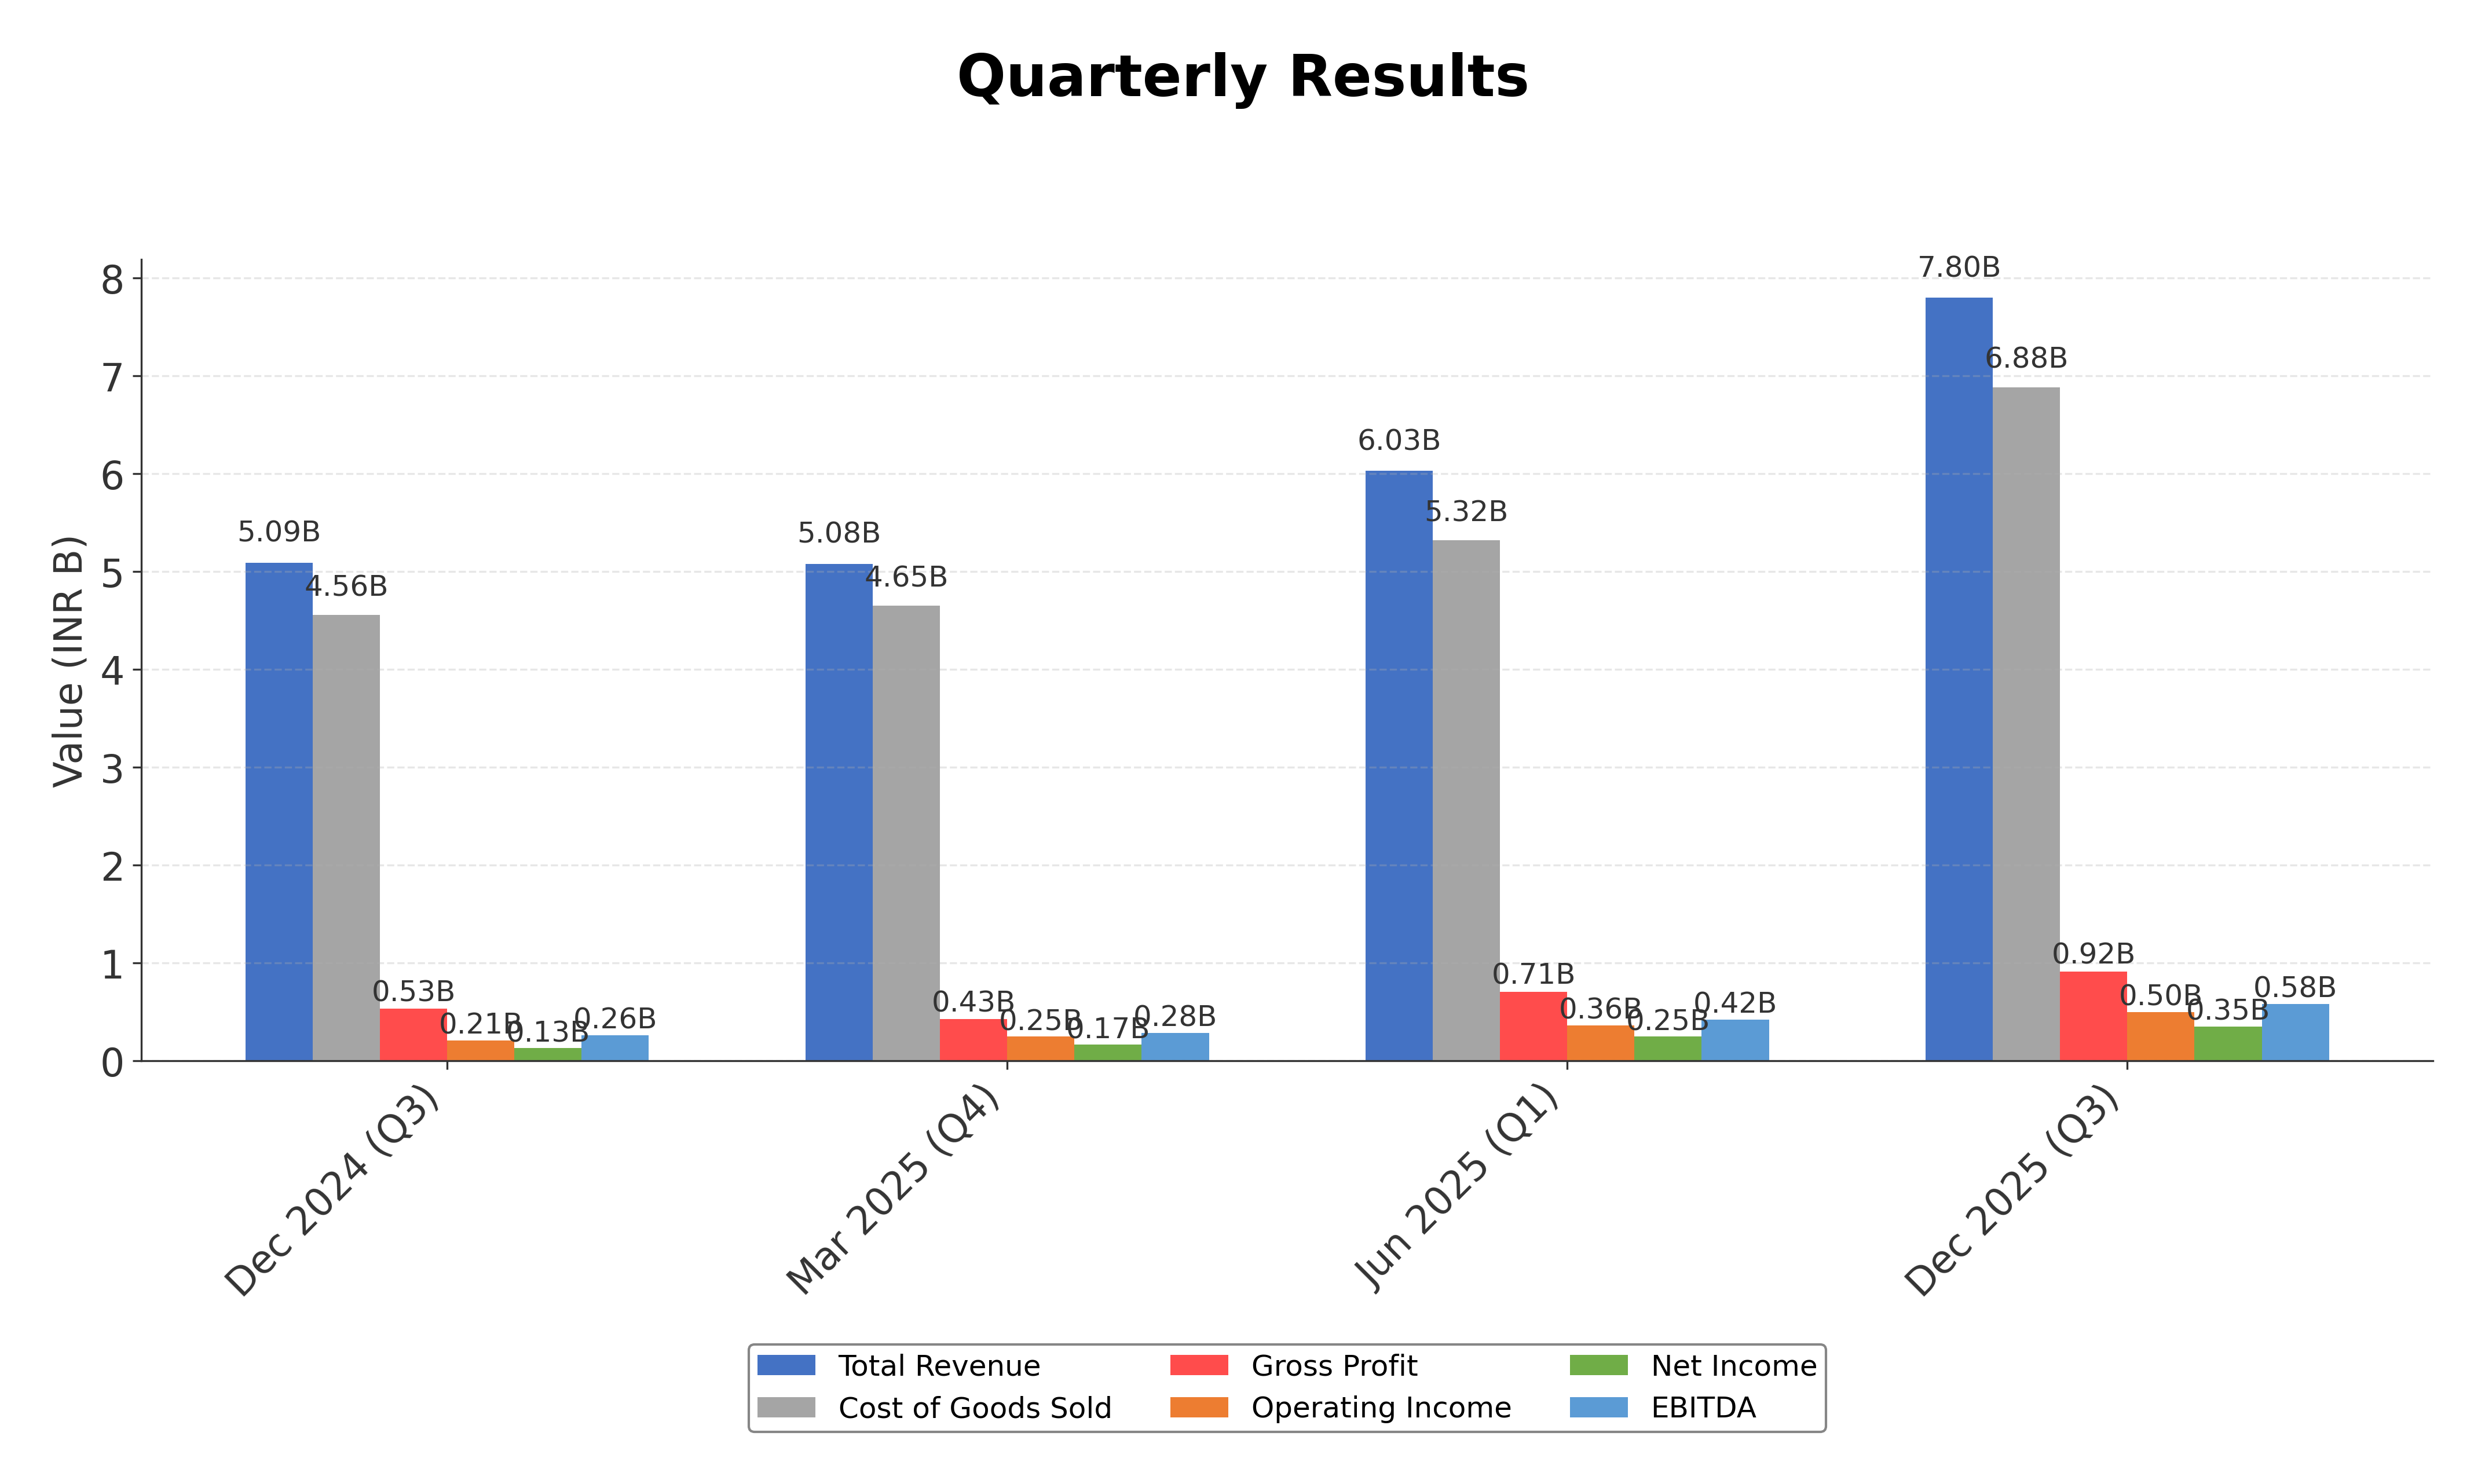
- Pondy Oxides exhibits strong quarterly revenue growth of 53.2%, indicating robust demand expansion.
- The company maintains a low debt-to-equity ratio of 0.053, reflecting a conservative capital structure and financial stability.
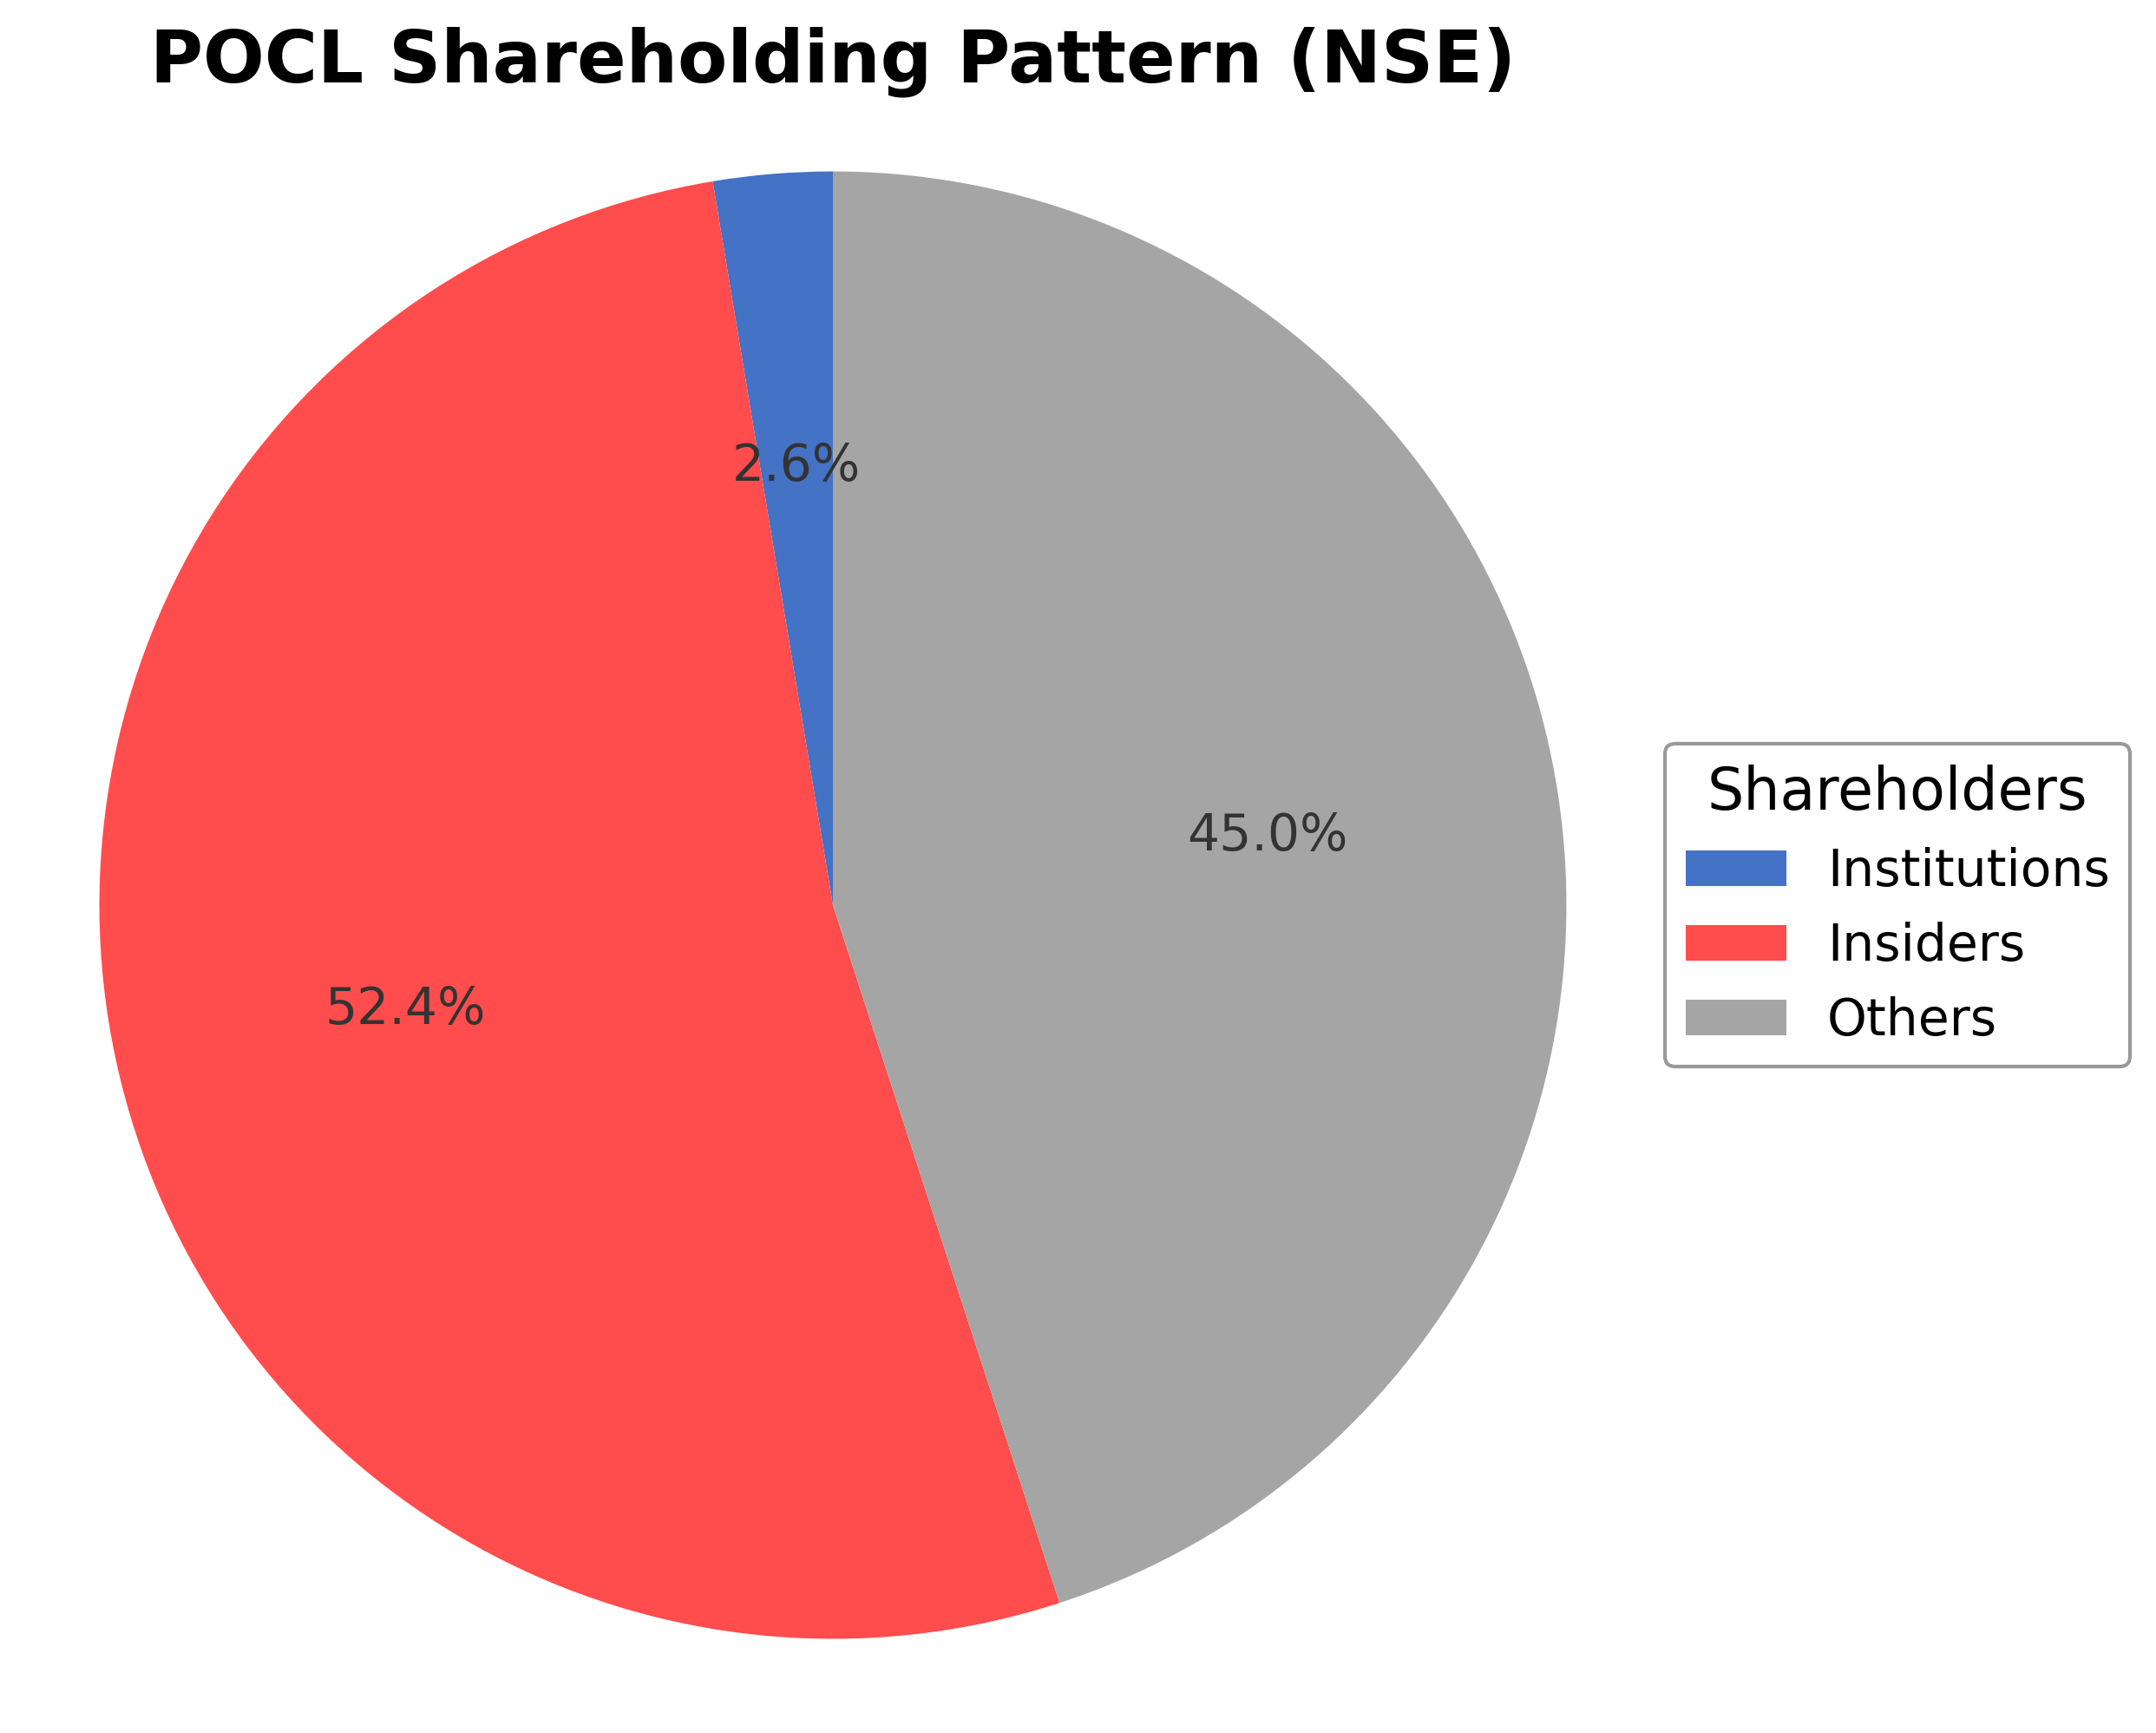
- Promoter shareholding consolidation to 52.38% supports governance continuity and strategic control.
Cons
- Operating cash flow is negative at INR -845 million, highlighting potential liquidity and cash management concerns.
- Price to cash flow ratio is negative (-49.59), contrasting with positive cash flow metrics among peers.
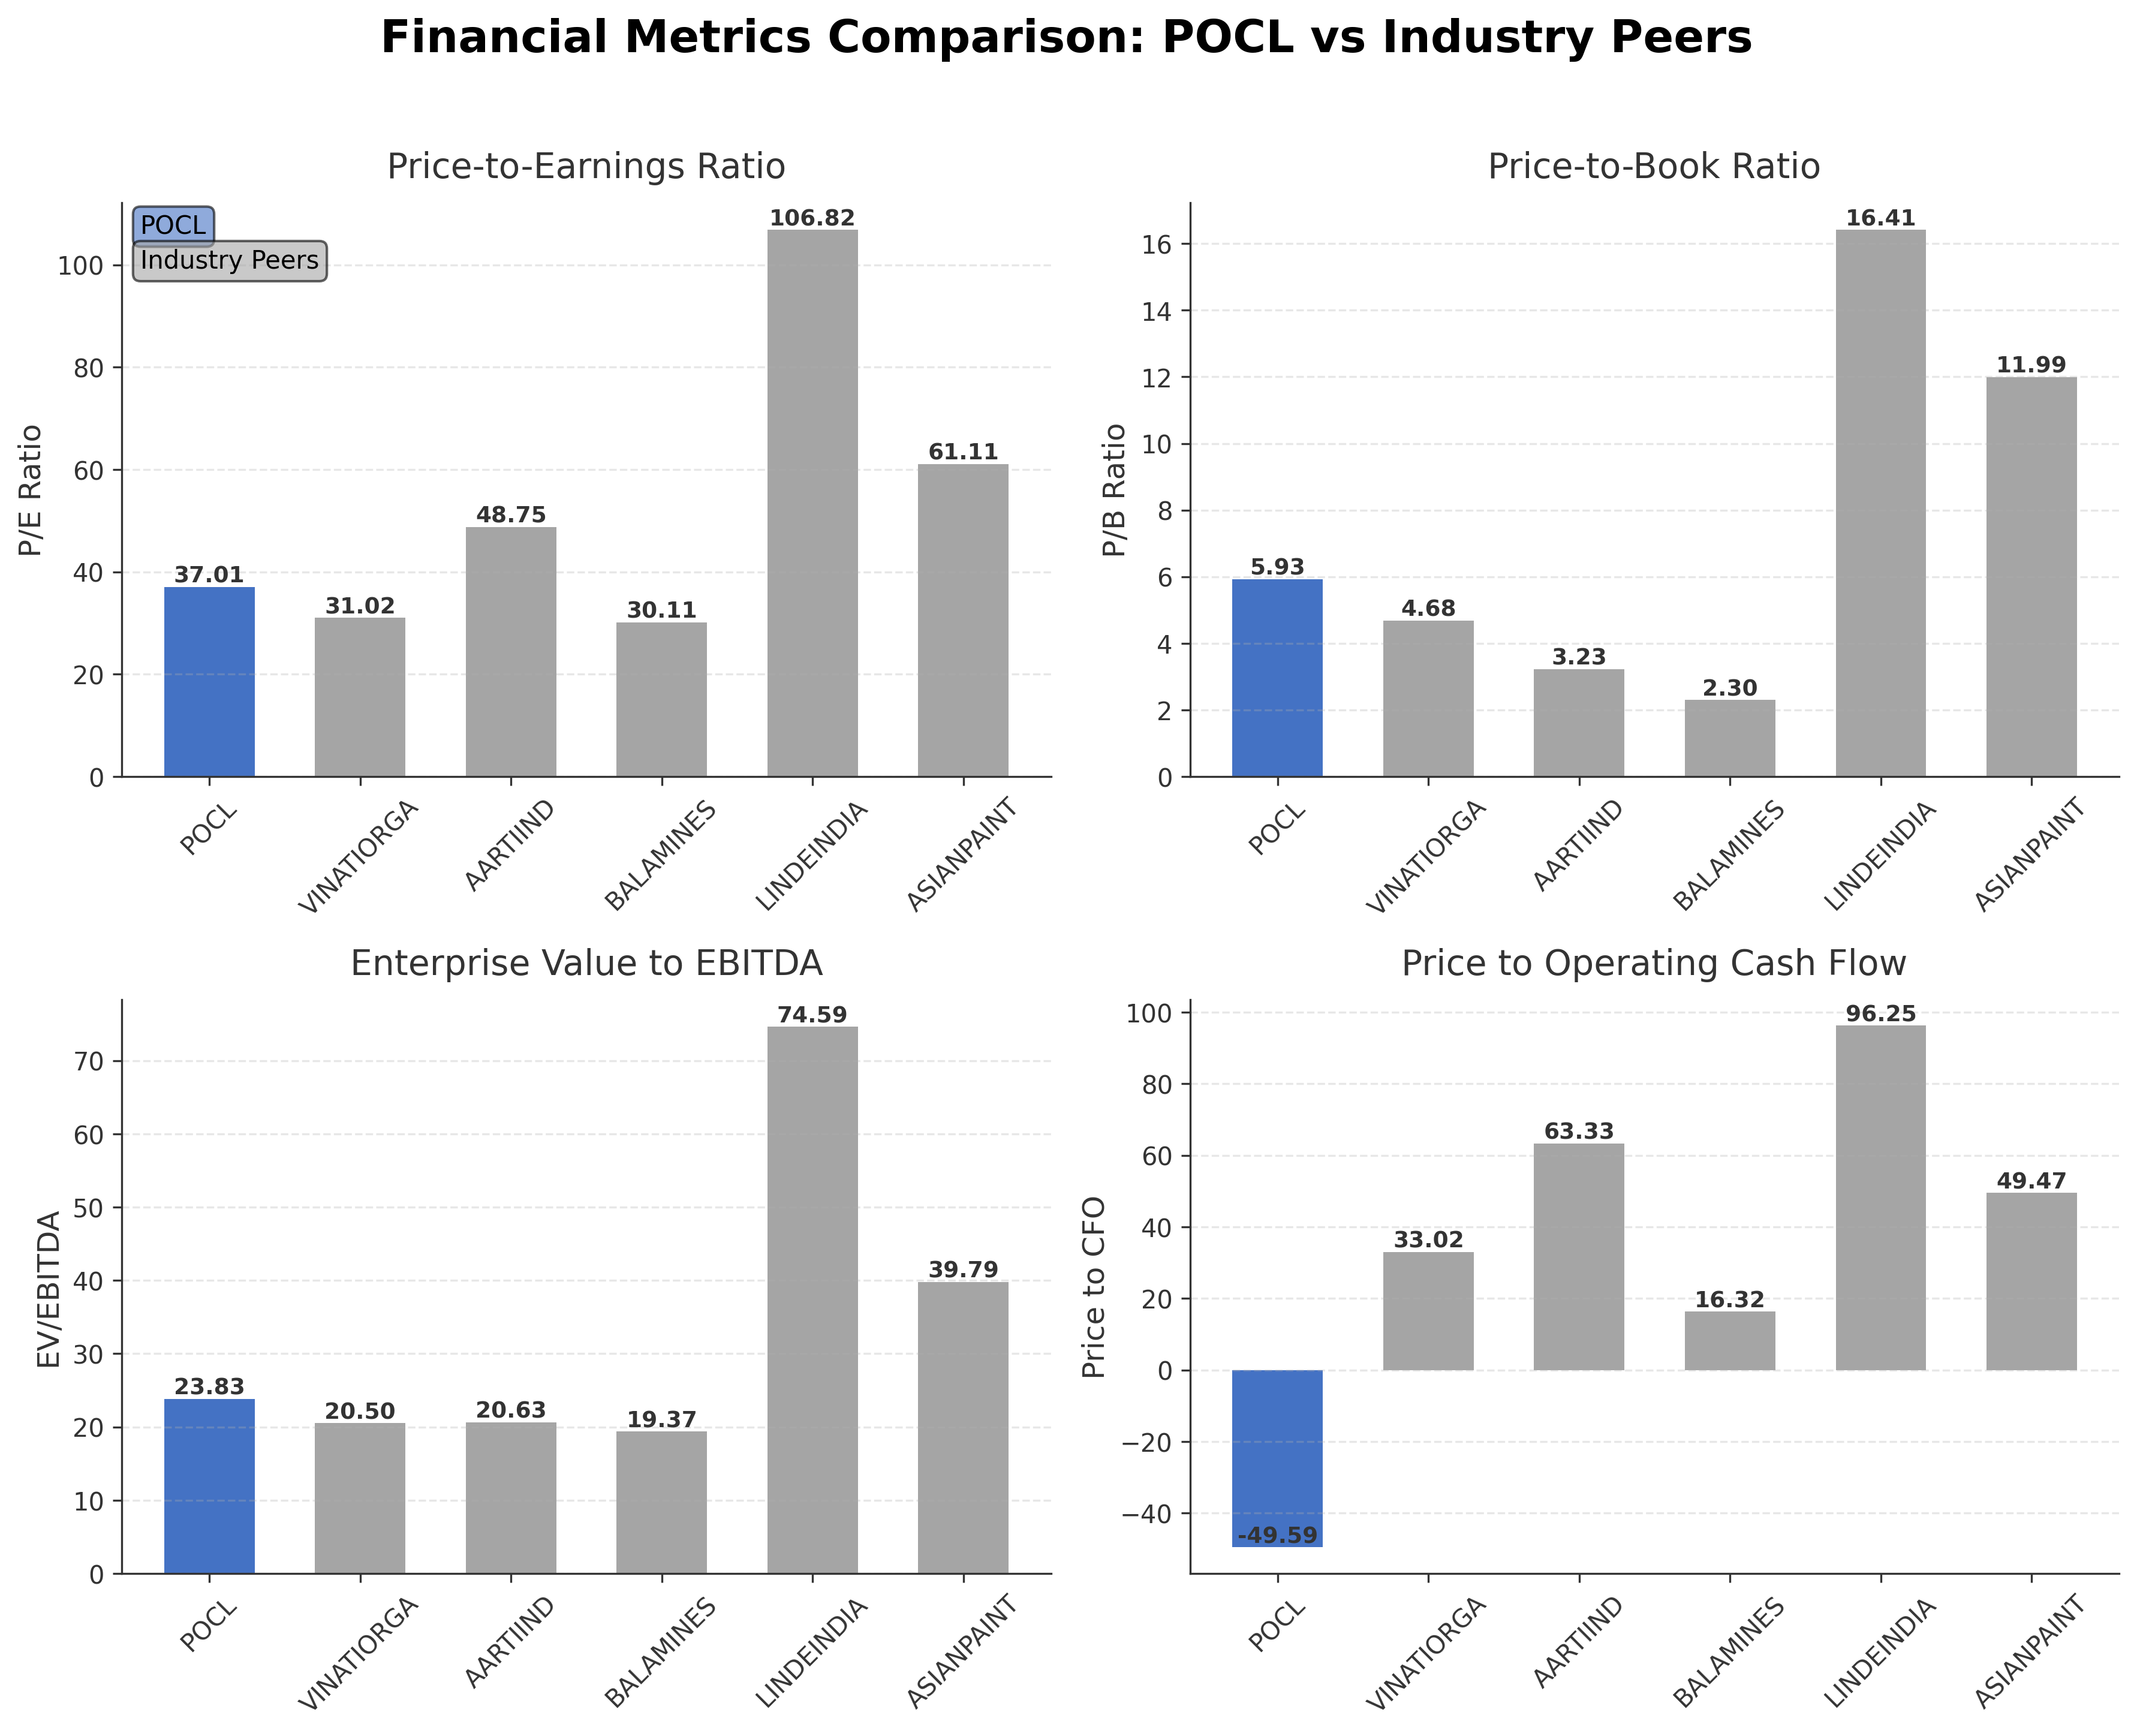
- Valuation multiples are relatively high, with a trailing P/E of 37.01 and P/B of 5.93, which may limit upside potential.
Disclosure: This information is for general awareness and does not constitute investment advice
Report Summary
Pondy Oxides & Chemicals Ltd. operates primarily in the specialty chemicals sector, focusing on the manufacturing and refining of lead and lead alloys. Listed on the NSE in India under the Basic Materials sector, the company is a key player in the secondary lead market, recycling used lead-acid batteries to produce high-grade lead metal. Its product portfolio extends to zinc and copper alloys, catering to industries such as automotive batteries and chemicals. The company’s operations emphasize environmental sustainability and resource recycling, with a notable presence both domestically and in export markets.
Financially, Pondy Oxides reported trailing twelve-month revenue of approximately INR 25.47 billion, with a gross margin of 11.74%, operating margin of 6.40%, and net profit margin of 4.36%. The return on equity (ROE) stands at 9.79%, and return on assets (ROA) at 7.87%, indicating moderate profitability and efficient asset utilization. The company’s operating cash flow was negative at INR -845 million, but it generated positive levered free cash flow of INR 580 million, reflecting some cash flow challenges alongside free cash generation capacity.
Valuation metrics show a trailing price-to-earnings (P/E) ratio of 37.01 and a forward P/E of 25.83, with a price-to-book (P/B) ratio near 5.93 and an enterprise value to EBITDA (EV/EBITDA) multiple of 23.83. The market capitalization is approximately INR 41.92 billion. The stock price currently trades at INR 1364.40, within a 52-week range of INR 685.75 to INR 1578, suggesting it is positioned closer to the upper end of its recent trading band.
The company’s strengths include a strong balance sheet with a current ratio of 3.39, low debt relative to equity (debt-to-equity ratio of 0.053), and a leading position in the recycled lead market. Key risks involve regulatory compliance in environmental and safety standards, competitive pressures from primary lead producers, and macroeconomic factors affecting commodity prices. Recent strategic developments include an increase in promoter Ashish Bansal’s stake to 22.11% and ongoing SEBI compliance certifications, underscoring governance and regulatory adherence.
Technically, the stock shows mixed signals with price action above the 50-day moving average but below the 200-day average, and momentum indicators reflecting moderate strength. Recent news highlights regulatory compliance and shareholding changes without major operational disruptions. Overall, the data suggests a cautious stance with attention to valuation and cash flow metrics, appropriate for monitoring evolving fundamentals and market conditions.
Company and Industry Overview
Company Basics
Price Performance
Company Size
Shareholding Pattern
Sector and Industry Analysis
The non-ferrous metals and recycling sector in India, encompassing lead, aluminum, and copper, has shown steady growth driven by demand in automotive, battery manufacturing, and industrial applications. The market size has expanded alongside increased adoption of lead-acid batteries and metal recycling initiatives, with secondary lead production playing a significant role. Key players include Pondy Oxides & Chemicals Ltd, which is India’s largest secondary lead manufacturer, alongside other regional recyclers and metal producers.
Industry trends highlight a growing emphasis on sustainable recycling processes and efficient scrap metal conversion to meet rising demand for lead alloys and zinc products. Competitive dynamics are shaped by technological capabilities in smelting and refining, with barriers to entry including capital intensity and environmental compliance. Companies like Pondy Oxides leverage their scale and expertise in secondary lead production to maintain market leadership amid moderate sales growth and improving operational margins.
The regulatory environment for the sector involves stringent environmental norms related to hazardous waste management and emissions from smelting operations, impacting operational practices and capital expenditures. Compliance with the Ministry of Environment, Forest and Climate Change (MoEFCC) guidelines and battery recycling mandates under the Extended Producer Responsibility (EPR) framework are critical. These regulations aim to enhance sustainability and reduce pollution, influencing industry outlook by encouraging cleaner production technologies and responsible recycling.
Note: Analysis synthesized from industry research, market reports, and regulatory filings. Information is subject to change based on market conditions.
Financial Ratios Dashboard
Illustrative Scenario Analysis
DCF Assumptions:
Method: Two-Stage EPS-Priority Model
Financials
Peer Analysis
| Company Name | Market Cap | P/E Ratio | P/B Ratio | EV/EBITDA | Price to CFO |
|---|---|---|---|---|---|
| Pondy Oxides & Chemicals Ltd. | ₹41.92B | 37.01 | 5.93 | 23.83 | -49.59 |
| Vinati Organics Ltd. | ₹137.18B | 31.02 | 4.68 | 20.50 | 33.02 |
| Aarti Industries Ltd. | ₹184.26B | 48.75 | 3.23 | 20.63 | 63.33 |
| Balaji Amines Ltd. | ₹43.21B | 30.11 | 2.30 | 19.37 | 16.32 |
| Linde India Ltd. | ₹624.28B | 106.82 | 16.41 | 74.59 | 96.25 |
| Asian Paints Ltd. | ₹2.34T | 61.11 | 11.99 | 39.79 | 49.47 |
Comparison Analysis: Pondy Oxides & Chemicals Ltd. trades at a higher P/E ratio of 37.01 compared to several peers such as Vinati Organics (31.02) and Balaji Amines (30.11), indicating a relatively premium valuation. Its P/B ratio of 5.93 is also elevated relative to most peers except Linde India and Asian Paints, reflecting market expectations of growth or asset quality. The EV/EBITDA multiple of 23.83 is above the peer group average, suggesting higher enterprise valuation relative to earnings. The company’s negative price to cash flow ratio contrasts with positive figures among peers, signaling potential cash flow challenges. Return on equity at 9.79% is moderate, below leaders like Asian Paints (18%) and Vinati Organics (15%), highlighting room for operational efficiency improvements. Overall, Pondy Oxides shows a mixed profile with premium valuation but some financial and cash flow metrics lagging behind stronger industry players.
Financial Metrics Comparison with Peers
Financial Statements
Comprehensive financial data including income, balance sheet, and cash flow metrics
Income Statement
| fiscal_date | 2025-03-31 | 2024-03-31 | 2023-03-31 | 2022-03-31 | 2021-03-31 |
|---|---|---|---|---|---|
| Sales | 20.41B | 15.40B | 14.75B | 14.54B | 10.04B |
| Cost Of Goods | 18.42B | 13.68B | 13.02B | 12.95B | 9.32B |
| Gross Profit | 2.00B | 1.72B | 1.73B | 1.58B | 719.31M |
| Operating Expense Selling General And Administrative | 185.78M | 139.21M | 163.21M | 168.39M | 108.32M |
| Operating Expense Other Operating Expenses | 560.10M | 557.51M | 511.31M | 408.04M | 182.51M |
| Operating Income | 899.63M | 578.87M | 678.10M | 716.68M | 174.79M |
| Non Operating Interest Income | 1.99M | 761.00K | 651.00K | 618.00K | 788.00K |
| Non Operating Interest Expense | 121.83M | 171.84M | 68.42M | 84.43M | 45.15M |
| Pretax Income | 782.85M | 440.13M | 918.75M | 643.57M | 137.75M |
| Income Tax | 202.30M | 121.41M | 168.25M | 161.09M | 29.97M |
| Net Income | 580.55M | 318.72M | 750.51M | 482.48M | 107.78M |
| Eps Basic | 22.03 | 13.61 | 32.28 | 20.75 | 4.63 |
| Eps Diluted | 21.08 | 13.56 | 32.28 | 20.75 | 4.63 |
| Basic Shares Outstanding | 26.35M | 23.43M | 23.25M | 23.25M | 23.25M |
| Diluted Shares Outstanding | 26.35M | 23.43M | 23.25M | 23.25M | 23.25M |
| Ebit | 904.68M | 611.97M | 987.18M | 728.00M | 182.90M |
| Ebitda | 1.08B | 743.02M | 812.47M | 826.25M | 246.41M |
| Net Income Continuous Operations | 782.85M | 440.13M | 918.75M | 643.57M | 137.75M |
| Preferred Stock Dividends | 0.00 | 0.00 | 0.00 | 0.00 | 0.00 |
Source: Financial statements and regulatory filings
Balance Sheet
| fiscal_date | 2025-03-31 | 2024-03-31 | 2023-03-31 | 2022-03-31 | 2021-03-31 |
|---|---|---|---|---|---|
| Cash And Cash Equivalents | 392.81M | 107.12M | 913.00K | 7.50M | 1.25M |
| Accounts Receivable | 1.29B | 1.04B | 1.02B | 873.47M | 1.09B |
| Total Assets | 7.37B | 4.82B | 4.72B | 3.30B | 3.19B |
| Total Liabilities | 1.45B | 1.24B | 2.08B | 1.22B | 1.58B |
| Long Term Debt | 30.00M | 36.67M | 136.29M | 87.74M | 196.64M |
| Shareholders Equity | 5.93B | 3.57B | 2.64B | 2.08B | 1.61B |
Source: Financial statements and regulatory filings
Cash Flow Statement
| fiscal_date | 2025-03-31 | 2024-03-31 | 2023-03-31 | 2022-03-31 | 2021-03-31 |
|---|---|---|---|---|---|
| Operating Activities Net Income | 782.85M | 440.13M | 918.75M | 643.57M | 137.75M |
| Operating Activities Other Non Cash Items | 100.93M | 171.08M | -110.71M | 83.81M | 44.36M |
| Operating Activities Accounts Receivable | -249.53M | -29.36M | -142.01M | 214.63M | -514.00M |
| Operating Activities Other Assets Liabilities | -1.48B | 404.16M | -293.04M | -254.42M | -608.02M |
| Operating Activities Operating Cash Flow | -845.32M | 986.00M | 372.99M | 687.59M | -939.91M |
| Investing Activities Capital Expenditures | -885.38M | -336.86M | -1.10B | -136.69M | -58.63M |
| Investing Activities Investing Cash Flow | -885.38M | -528.35M | -1.09B | -136.69M | -58.63M |
| Financing Activities Short Term Debt Issuance | 113.81M | -434.54M | 426.43M | -274.39M | 795.90M |
| Financing Activities Common Stock Issuance | 1.85B | 671.32M | 0.00 | N/A | 0.00 |
| Financing Activities Common Dividends | -65.13M | -58.12M | -29.06M | -14.53M | N/A |
| Financing Activities Financing Cash Flow | 1.89B | 178.65M | 397.37M | -288.92M | 795.90M |
| End Cash Position | 392.81M | 107.12M | 913.00K | 7.50M | 1.25M |
| Free Cash Flow | -1.70B | 284.84M | -326.96M | 492.77M | -965.02M |
| Investing Activities Purchase Of Investments | N/A | 0.00 | 0.00 | N/A | N/A |
| Investing Activities Other Investing Activity | N/A | -191.49M | 13.79M | N/A | N/A |
Source: Financial statements and regulatory filings
Technical Analysis
Key Insights
- Pondy Oxides & Chemicals exhibits a mixed trend with recent price action showing volatility and trading near the 50-day moving average of approximately ₹1130, but below the 200-day moving average near ₹1241, indicating intermediate consolidation.
- Key support levels are identified near ₹1100 and ₹1000, while resistance is observed around ₹1400 and the recent 52-week high near ₹1578.
- The stock currently trades above the 10-day moving average but remains below the 50-day and 200-day moving averages, suggesting short-term momentum is positive while longer-term trend remains neutral to bearish.
- Momentum indicators show RSI in the mid-50s range, MACD near the signal line with slight positive divergence, and stochastic oscillators indicating moderate upward momentum without overbought conditions.
- Analysis across daily, weekly, and monthly timeframes reveals short-term strength offset by longer-term consolidation, with no clear breakout or breakdown signals at present.
- Potential market scenarios include a continuation of range-bound trading between support and resistance levels, with a possible test of the upper resistance if momentum strengthens or a retest of support if selling pressure increases.
Trending News
1. Headline: S&P 500 INDEX TODAY | INX LIVE TICKER | S&P 500 QUOTE & CHART | Markets Insider
Summary: S&P 500 Today: Get all information on the S&P 500 Index including historical chart, news and constituents.
Sentiment: neutral
2. Headline: Stock Rally Falters as Oil Climbs on Hormuz Risks: Markets Wrap
Summary: A rally in oil drove stocks and bonds lower on concerns that a resumption of Iranian attacks could escalate Middle East tensions, keeping energy costs elevated while fueling inflation risks.
Sentiment: negative
3. Headline: Pondy Oxides - by Dhruv Meisheri - The Compounding Journal
Summary: Pondy Oxides is in the metallic and non-ferrous recycling business. It’s one of India’s largest secondary lead manufacturers. The word "secondary" is important here. Primary lead comes from mining. Secondary lead comes from recycling used material, mainly spent lead-acid batteries.
Sentiment: neutral
4. Headline: Stay Informed with MarketsMojo News: Stock Market Insights, Portfolio Tracking, Alerts, and Expert Analyses
Summary: Latest news on Stocks in Action, Trending Stocks, Stock Analysis, Result Analysis, Corporate News, Stock Market News, IPOs, Mutual Funds, Global Markets, and Investment Ideas at MarketsMojo. Enhance your financial decisions with insightful stock market analysis, seamless portfolio tracking, ...
Sentiment: neutral
5. Headline: PONDY OXIDES & CHEMICALS Stock/Share price , NSE/BSE Forecast News and Live Quotes | Equitymaster
Summary: Get the latest PONDY OXIDES & CHEMICALS stock price updates: PONDY OXIDES & CHEMICALS live share price, financial results, financial report & balance sheet, and price charts only at Equitymaster.com
Sentiment: neutral
Recent Updates
News Summary
As of April 6, 2026. Pondy Oxides & Chemicals Limited has recently submitted its quarterly SEBI compliance certificate for Q4FY26, confirming adherence to dematerialization regulations and timely processing of securities. Concurrently, the company announced a significant increase in promoter Ashish Bansal's stake from 15.20% to 22.11% following the transmission of shares from the late promoter Anil Kumar Bansal. Additionally, a special window for transfer and dematerialization of physical securities has been opened, effective from February 5, 2026, to February 4, 2027, in compliance with SEBI circulars. These developments underscore the company’s focus on regulatory compliance, governance transparency, and promoter consolidation, which may influence future strategic and capital market activities.
News Sentiment
The overall sentiment from recent updates is predominantly neutral to positive, driven by regulatory compliance achievements and promoter stake consolidation. The SEBI compliance certificate submission and the special dematerialization window reinforce governance standards, while the increased promoter shareholding suggests strengthened leadership control. However, the absence of major operational or financial announcements tempers the sentiment, maintaining a balanced outlook. The news reflects stability in corporate governance with potential implications for future strategic direction.
Source List
Analytical Overview
Analysis Summary
Pondy Oxides & Chemicals trades at a trailing P/E of 37.01 and a forward P/E of 25.83, which is higher than the industry average P/E of 37.01 but shows a reasonable forward valuation discount. The PEG ratio of 0.39 indicates potential undervaluation relative to growth expectations. Revenue growth is robust at 53.2% quarterly, but operating cash flow is negative, suggesting some cash flow management challenges despite positive free cash flow. The company maintains a strong current ratio of 3.39 and a low debt-to-equity ratio of 0.053, indicating solid financial health. Sector-specific challenges include regulatory compliance in environmental standards and competition from primary lead producers, while opportunities arise from increasing demand for recycled lead in automotive and chemical industries. India-specific factors such as evolving environmental regulations and growing industrial demand also influence the company’s market positioning.
Overall Business and Market Assessment
Supporting Factors: strong revenue growth of 53.2% quarterly and a conservative debt profile with a debt-to-equity ratio of 0.053
Risk Factors: negative operating cash flow and potential regulatory challenges in environmental compliance
SWOT Analysis
Strengths
- Pondy Oxides holds a leading position in the secondary lead recycling market.
- The company maintains a strong balance sheet with a high current ratio of 3.39 and low debt-to-equity ratio of 0.053.
- Promoter shareholding consolidation to 52.38% supports governance stability.
- Robust quarterly revenue growth of 53.2% demonstrates strong market demand.
Weaknesses
- Negative operating cash flow of INR -845 million indicates cash management challenges.
- Price to cash flow ratio is negative, contrasting with positive peers.
- Relatively high valuation multiples compared to some industry peers.
- Limited institutional investor presence at 2.62% may constrain external oversight.
Opportunities
- Growing demand for recycled lead in automotive battery and chemical sectors.
- Expansion potential through increased exports and product diversification.
- Regulatory emphasis on environmental sustainability may favor recycled lead producers.
- Potential for improved cash flow management and operational efficiencies.
Threats
- Stringent environmental and safety regulations could increase compliance costs.
- Competition from primary lead producers and alternative materials.
- Volatility in commodity prices impacting input costs and margins.
- Market liquidity constraints due to promoter concentration and limited institutional holdings.
Company Description
Pondy Oxides & Chemicals Ltd. is a significant player in the manufacturing and refining sector, primarily focused on producing lead and lead alloys. The company has carved out a niche by recycling lead to produce high-grade lead metal, serving as a critical link in the supply chain for industries reliant on this metal. Notably, the automotive battery industry and the chemical sector are key consumers of their products, both of which depend on high-quality refined lead to ensure product efficacy and safety. Additionally, the company's operations in producing zinc and copper alloys enhance its appeal, diversifying its portfolio and presence across multiple industries. Established in India, Pondy Oxides & Chemicals Ltd. not only contributes to resource recycling efforts but also supports environmental sustainability by reducing lead waste and promoting eco-friendly production practices. Their global reach is fortified by exports, making them an important player in the international market for recycled lead-based products.