


Plastiblends India Ltd (PLASTIBLEN)
Stock Analysis Report
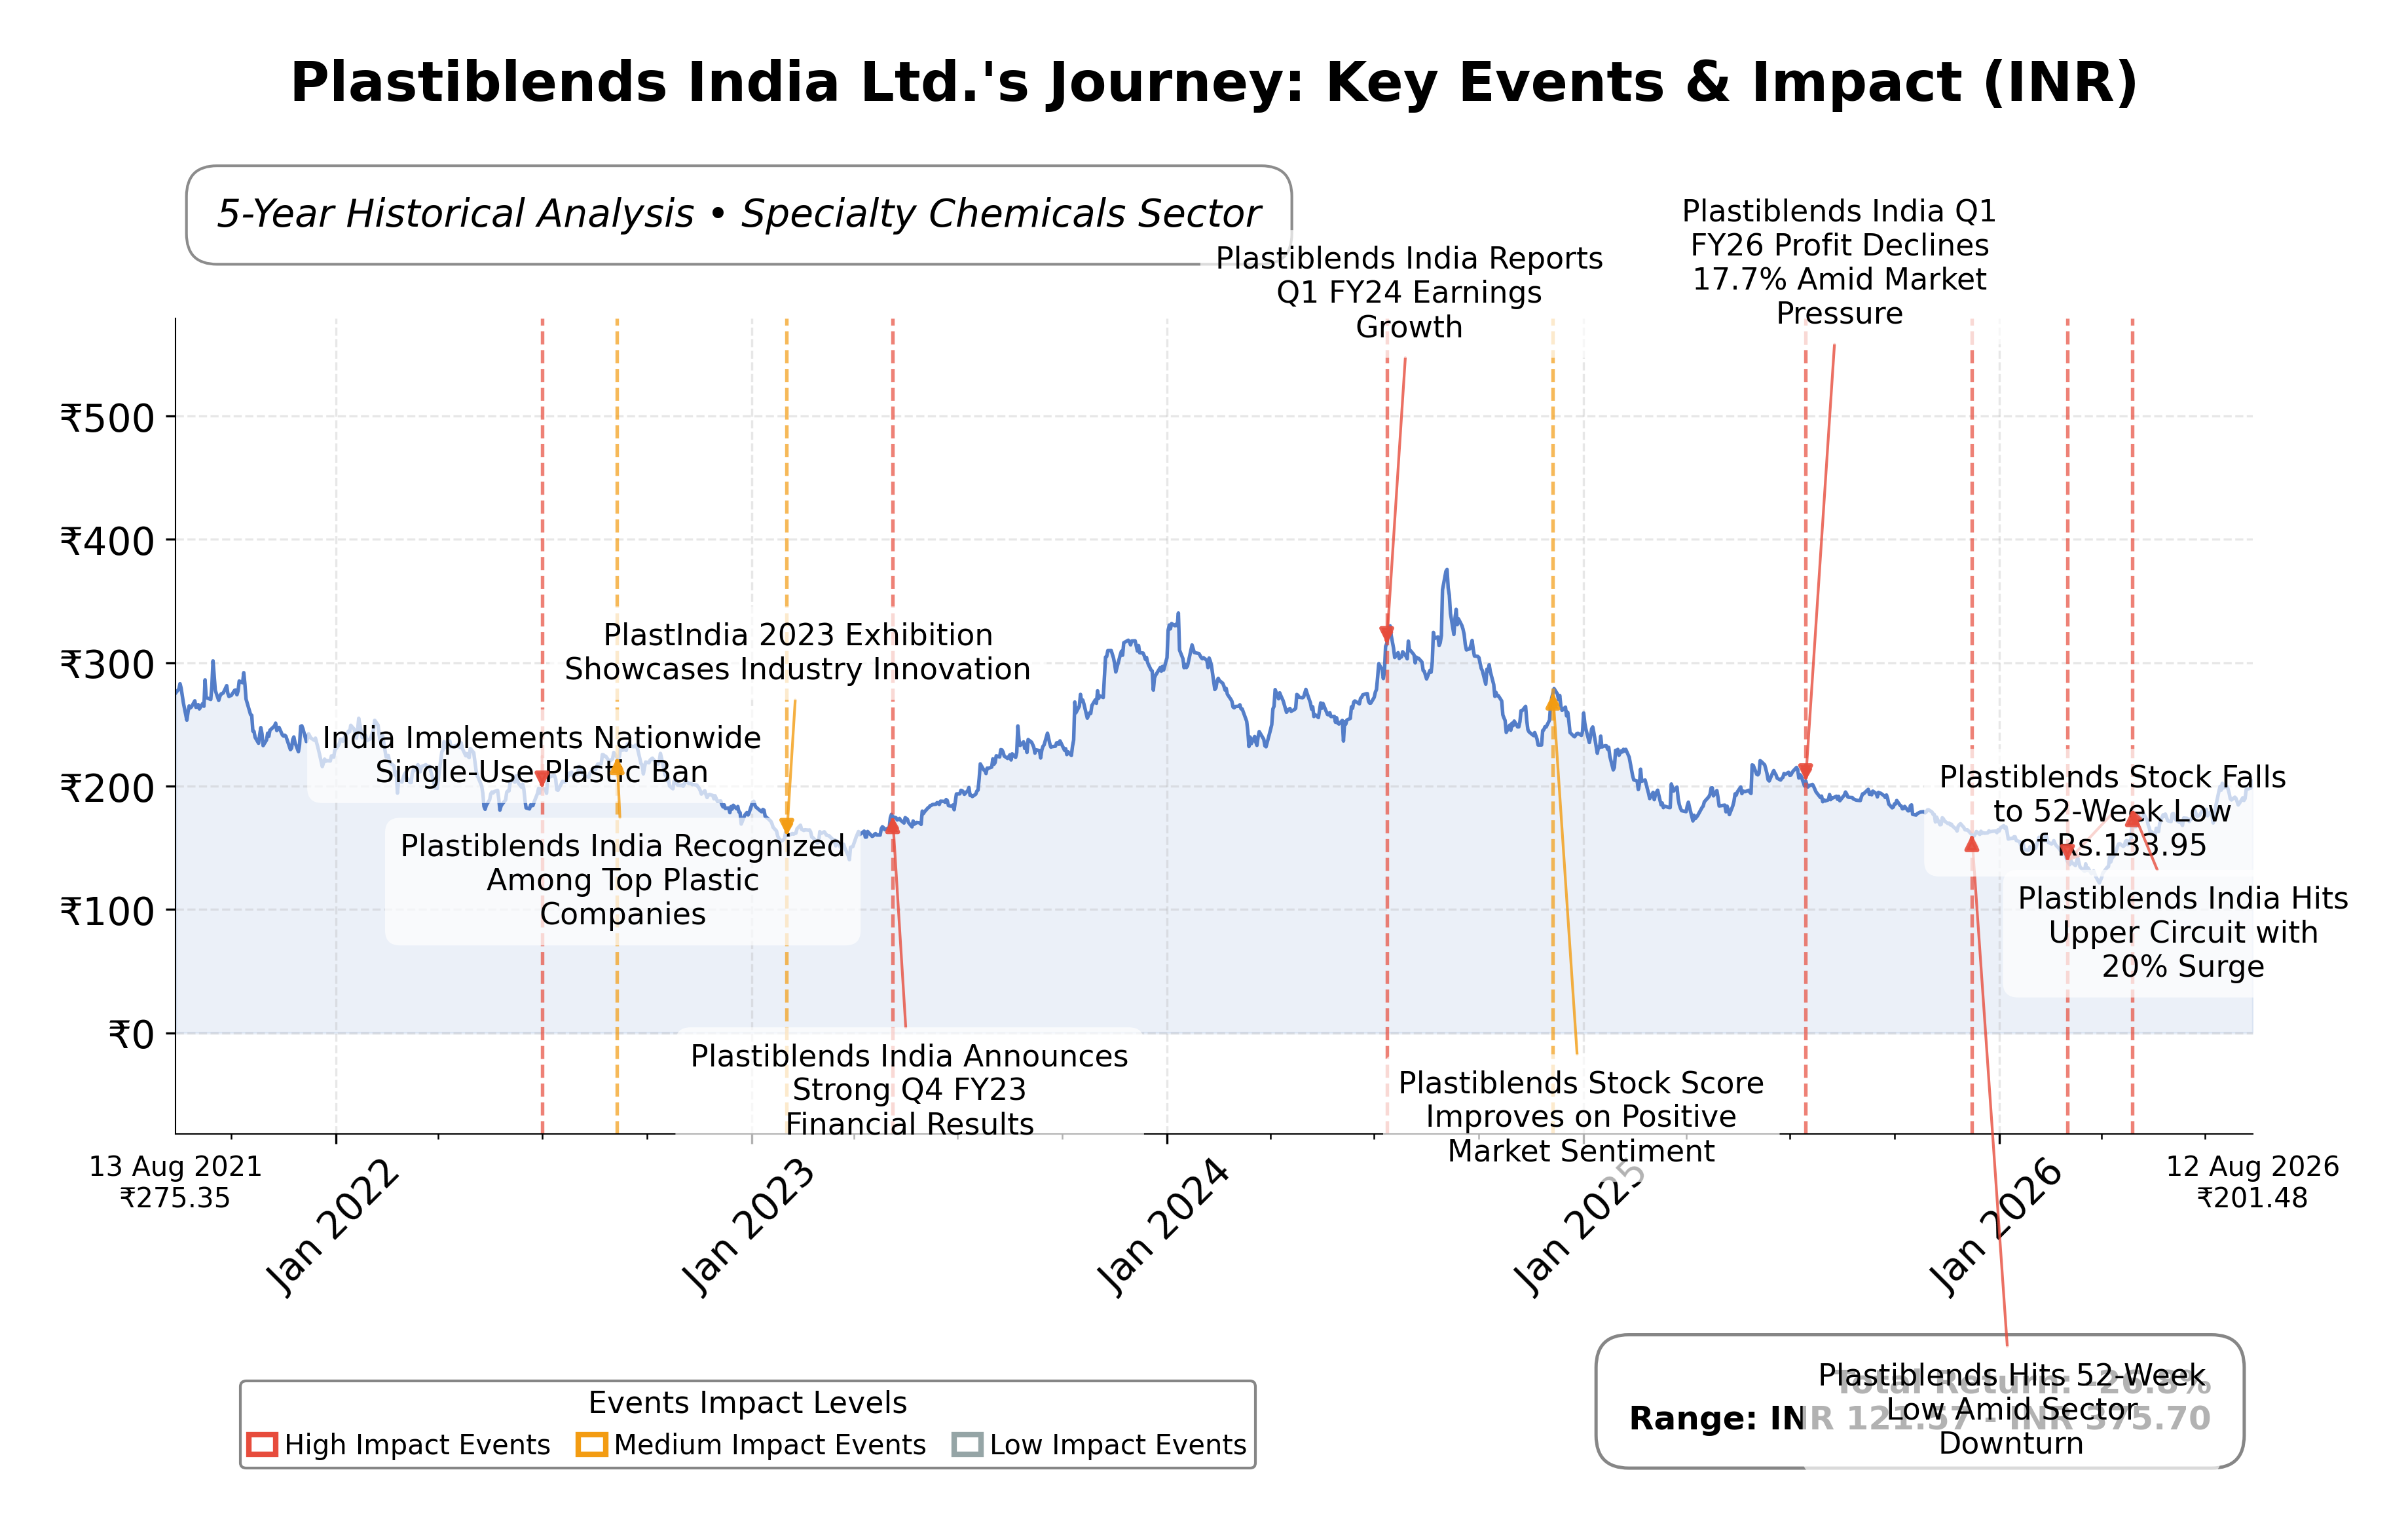
Stock Journey
Key Positives and Key Risks
Pros
- Trailing P/E ratio of 12.45 indicates relatively attractive valuation compared to industry peers with P/E ratios above 30.
- Strong liquidity with a current ratio of 4.23 and cash reserves of ₹46.7 crore against low debt of ₹22.3 crore supports financial stability.
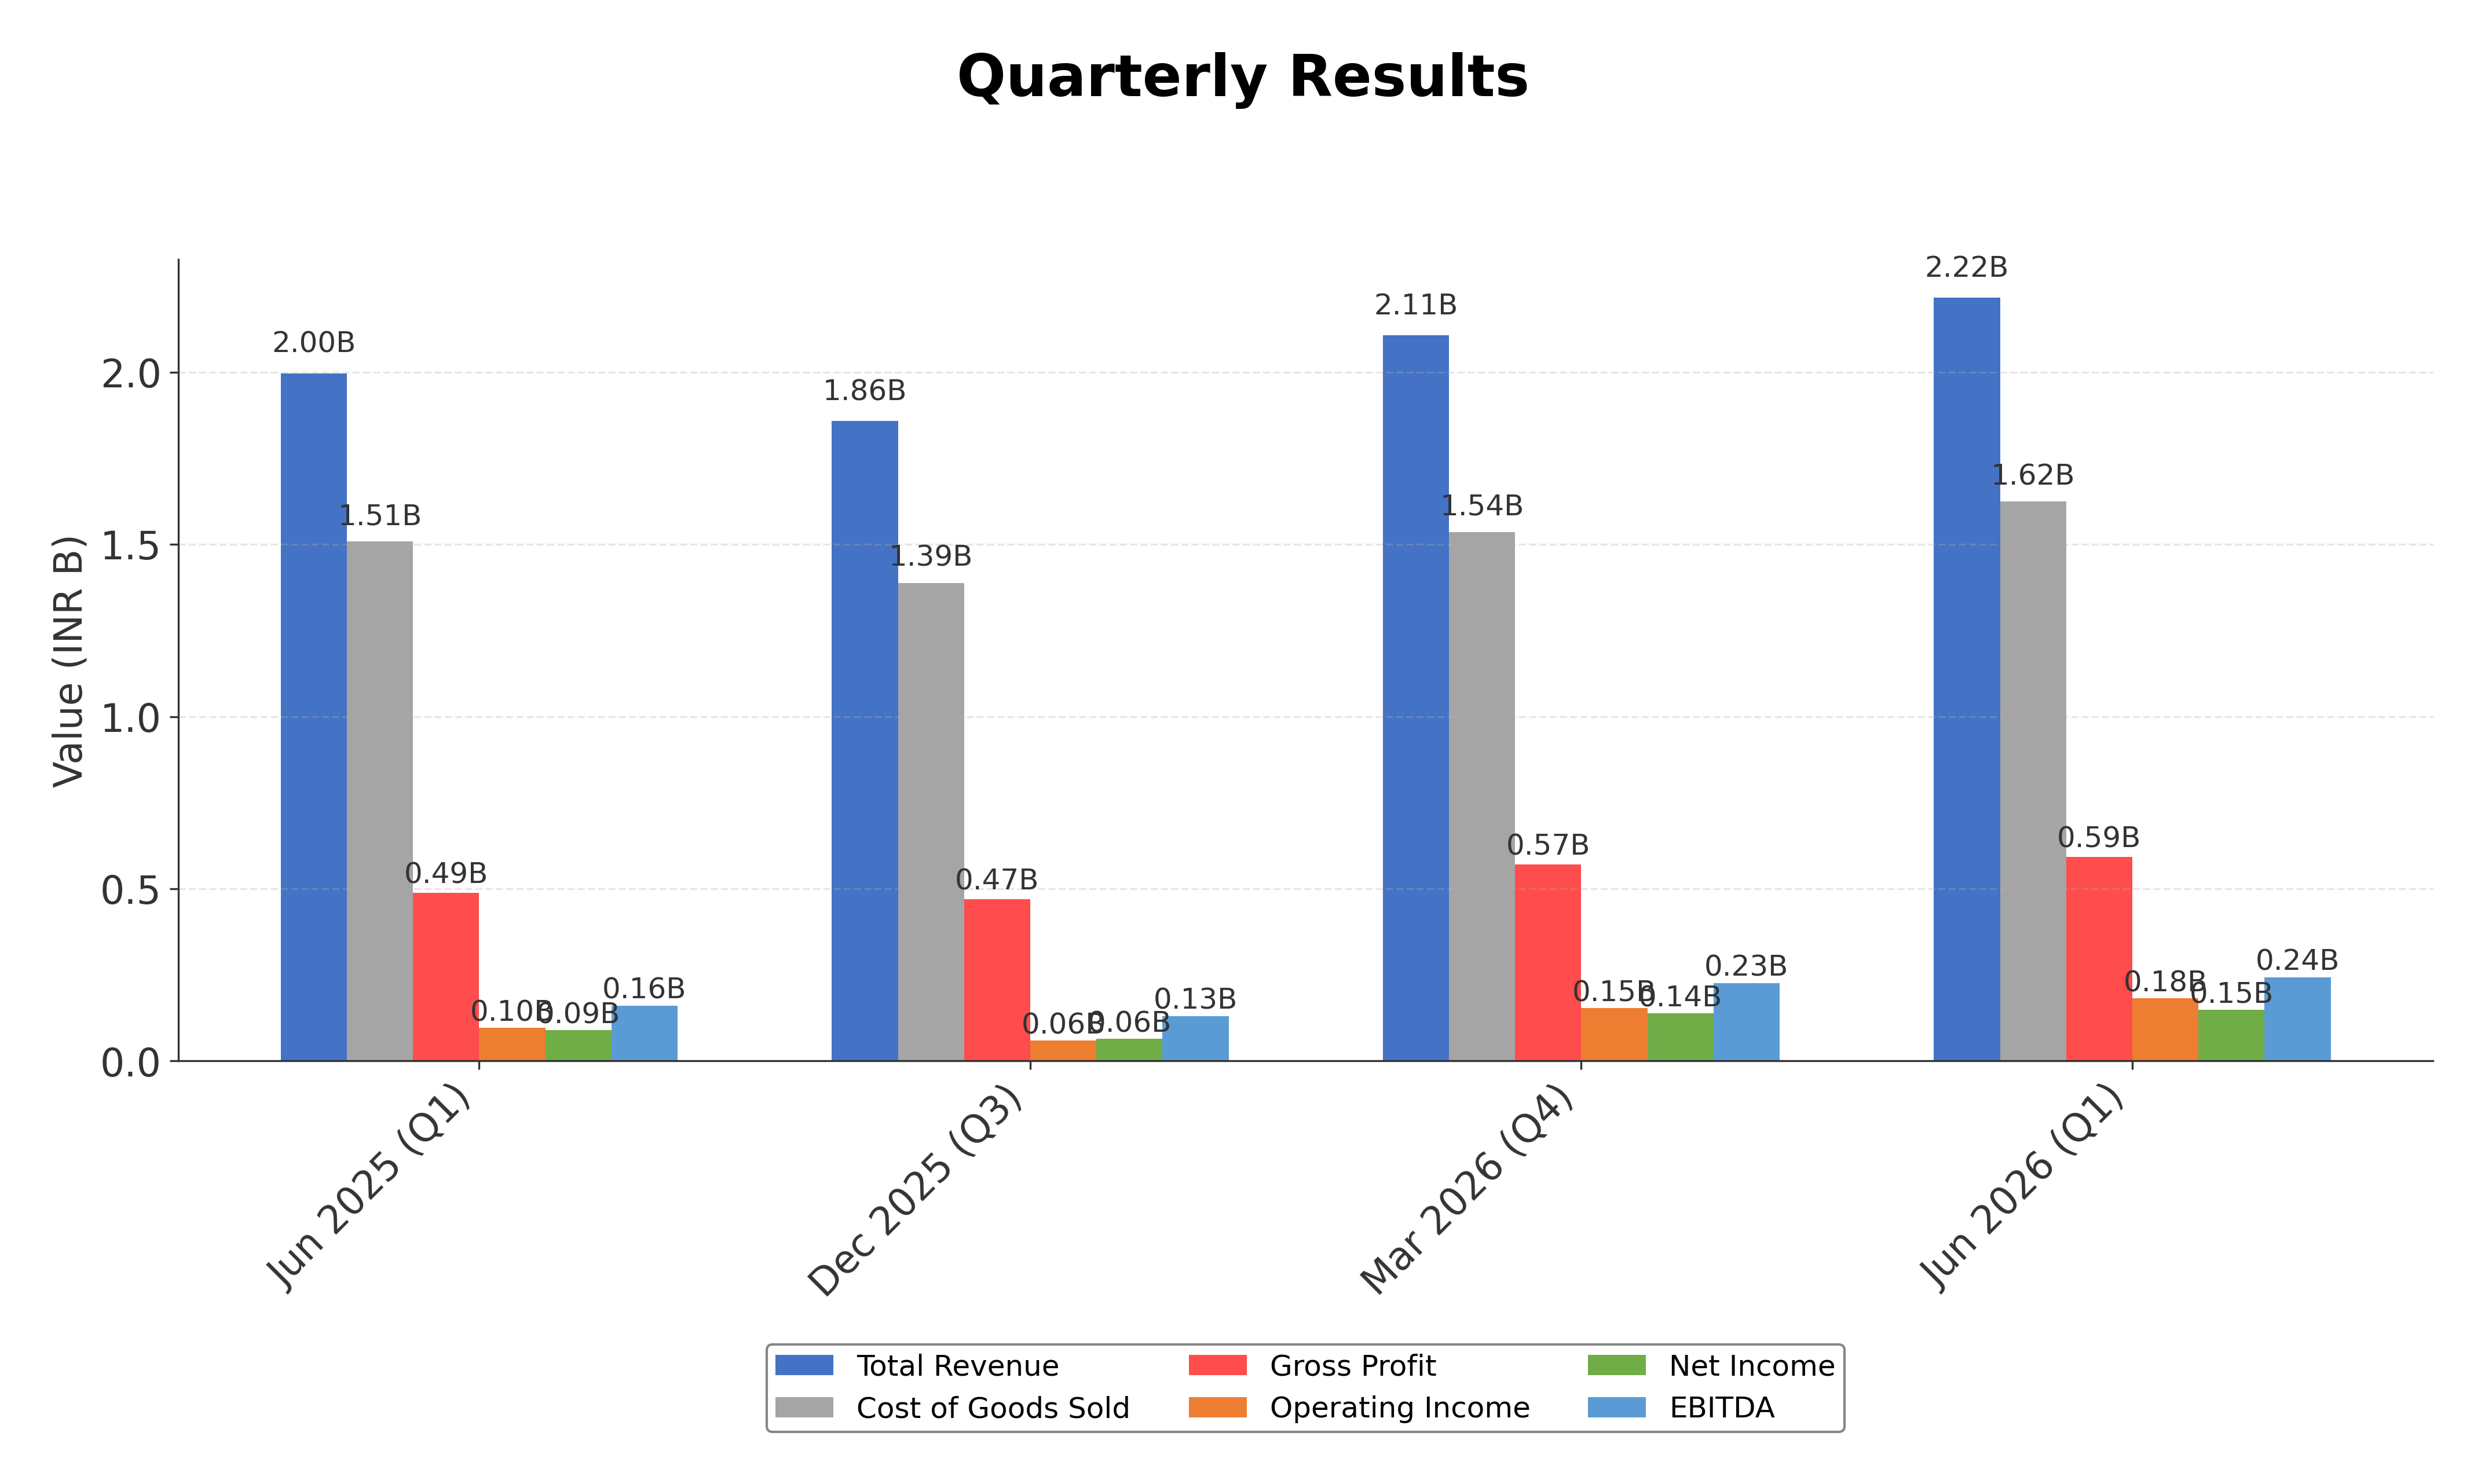
- Revenue growth of 11% quarterly and expanding profit margins demonstrate improving operational performance.
Cons
- Return on equity of 8.17% is modest and below several larger specialty chemical peers, indicating limited profitability.
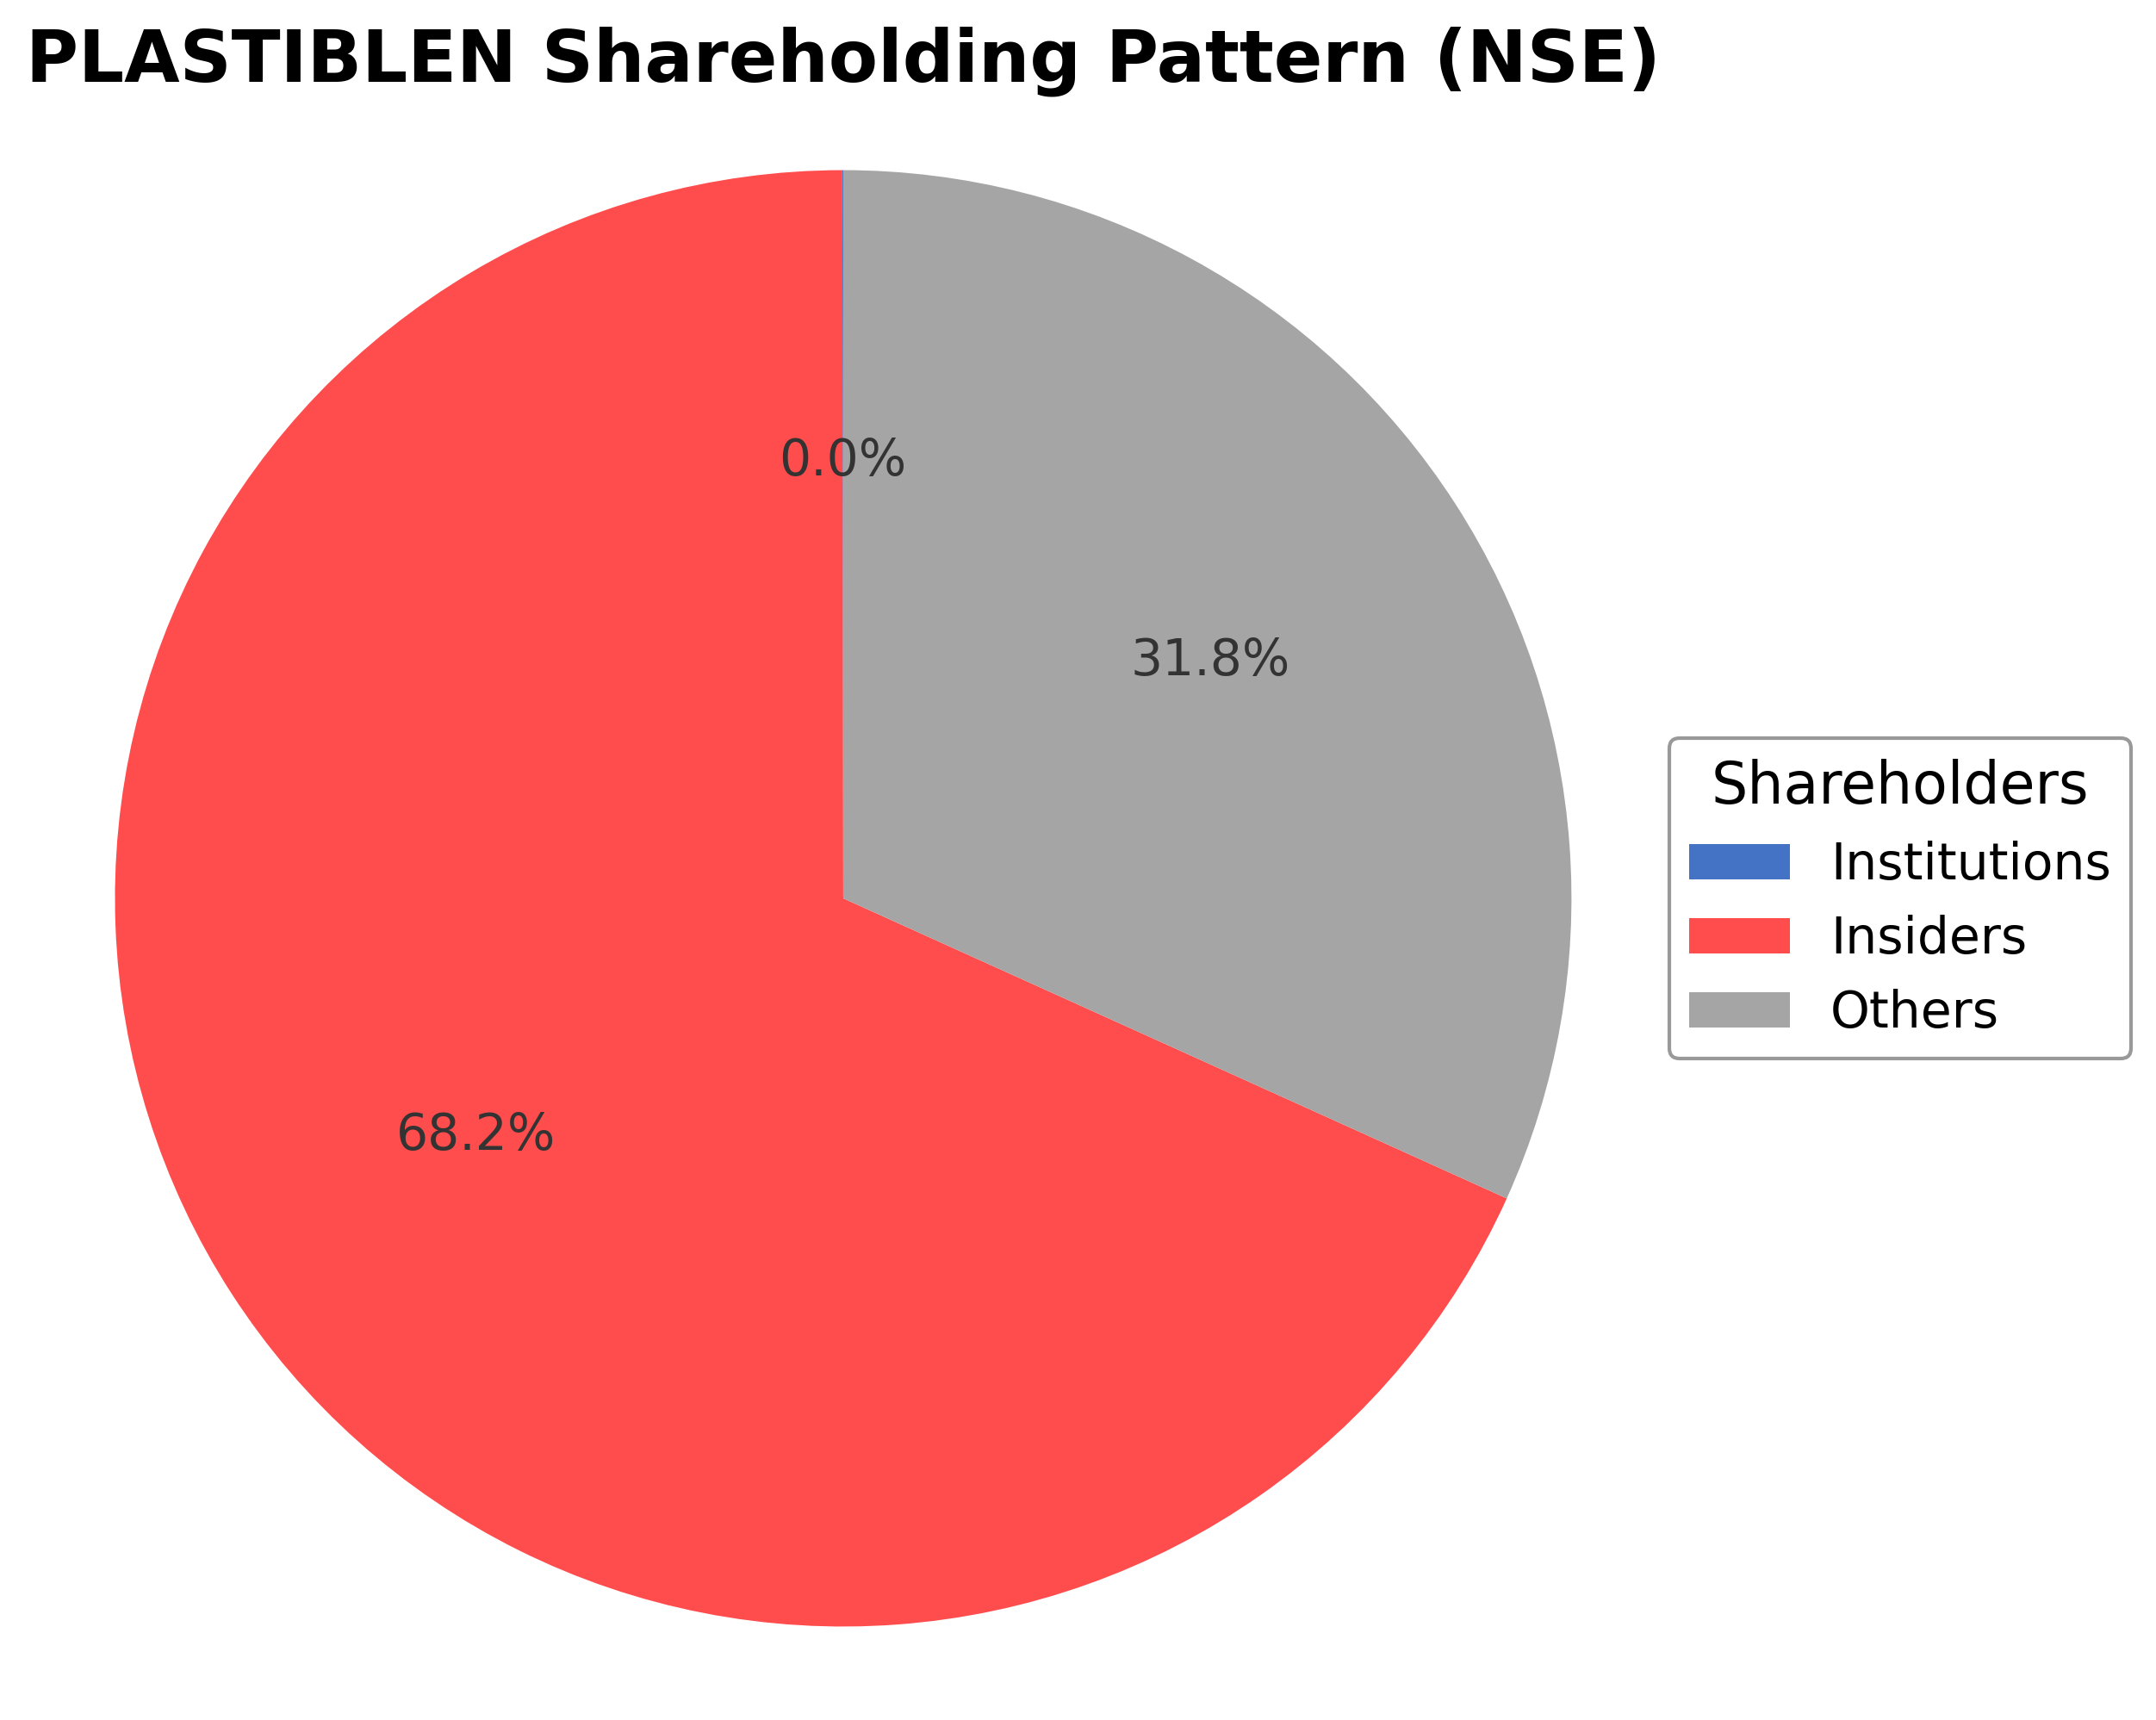
- Limited institutional investor holding at 0.02% may reduce external market support and liquidity.
- Forward P/E ratio is unavailable, restricting insight into future earnings expectations and valuation.
Disclosure: This information is for general awareness and does not constitute investment advice
Report Summary
Plastiblends India Ltd. operates as a prominent manufacturer and exporter specializing in color and additive masterbatches for the plastics industry. Listed on the NSE under the Basic Materials sector, the company serves diverse industries including packaging, agriculture, textiles, consumer products, and automotive. Its products enhance the aesthetic and functional properties of plastics, supporting innovation and sustainability. Headquartered in India, Plastiblends holds a significant domestic market share while maintaining a global footprint through exports.
Financially, Plastiblends reported trailing twelve months (TTM) revenue of approximately ₹810.6 crore with a gross margin of 26.7%, operating margin of 8.2%, and net profit margin of 5.3%. The company’s return on equity (ROE) stands at 8.17%, and return on assets (ROA) at 6.58%, indicating moderate profitability and efficient asset utilization. Operating cash flow for the TTM is ₹21.3 crore, with levered free cash flow at ₹36.7 crore, reflecting positive cash generation despite modest margins.
Valuation metrics show a trailing price-to-earnings (P/E) ratio of 12.45, price-to-book (P/B) ratio of 1.18, and an enterprise value to EBITDA (EV/EBITDA) multiple of 8.16. The market capitalization is approximately ₹523.6 crore. The stock trades at ₹201.48, near its 52-week high of ₹216.29 and well above the 52-week low of ₹121.01, suggesting a relatively strong price performance within the past year.
Key strengths include a strong current ratio of 4.23 indicating solid liquidity, low total debt of ₹22.3 crore relative to cash holdings of ₹46.7 crore, and a stable promoter holding of 62.22% with recent consolidation among key promoters. Risks encompass sector-specific challenges such as regulatory compliance in chemicals, competitive pressures, and macroeconomic factors affecting raw material costs. Recent strategic actions include an inter-se promoter share transfer enhancing individual promoter stakes without altering overall promoter control.
Technically, the stock is trading above its 50-day (₹183.16) and 200-day (₹163.61) moving averages, with a low beta of 0.35 indicating lower volatility relative to the market. Momentum indicators and multi-timeframe analysis suggest a stable upward trend, though volume averages indicate moderate liquidity. Overall, the data points to a market environment where cautious monitoring and selective accumulation may be appropriate given the company’s fundamentals and recent price action.
Company and Industry Overview
Company Basics
Price Performance
Company Size
Shareholding Pattern
Sector and Industry Analysis
The Indian plastics sector is valued at approximately USD 46.48 billion as of 2023 and is projected to grow at a CAGR exceeding 6.5% through 2034. The packaging segment dominates the market, driven by rising urbanization, disposable incomes, and the expansion of e-commerce, which demands durable and lightweight packaging solutions. Leading companies in the market include Wim Plast Ltd, Nilkamal Ltd, Mayur Uniquoters Ltd, VIP Industries Ltd, and Plastiblends India Ltd, with Plastiblends holding a market share near 7.7%.
Industry dynamics are shaped by technological advancements in plastic processing methods such as blow molding and extrusion, enabling innovation in packaging design and functionality. The competitive landscape is concentrated, with major players leveraging backward and forward integration to secure raw materials and expand into specialized packaging solutions. Barriers to entry include capital intensity, technology requirements, and compliance with evolving sustainability standards, which favor established firms with scale and innovation capabilities.
The regulatory environment is increasingly stringent due to environmental concerns over plastic waste, particularly single-use plastics. Policies such as bans on certain plastic items and Extended Producer Responsibility (EPR) frameworks impose compliance costs and necessitate shifts toward sustainable materials and recycling. These regulations are prompting industry participants to innovate in biodegradable plastics, recycled content, and eco-friendly packaging designs, influencing future market growth and operational strategies.
Note: Analysis synthesized from industry research, market reports, and regulatory filings. Information is subject to change based on market conditions.
Financial Ratios Dashboard
Illustrative Scenario Analysis
DCF Assumptions:
Method: Two-Stage EPS-Priority Model
Financials
Peer Analysis
| Company Name | Market Cap | P/E Ratio | P/B Ratio | EV/EBITDA | Price to CFO |
|---|---|---|---|---|---|
| Plastiblends India Ltd. | ₹5.24B | 12.45 | 1.18 | 8.16 | 24.55 |
| Aarti Industries Ltd. | ₹173.31B | 42.67 | 2.89 | 18.80 | 22.19 |
| Asian Paints Ltd. | ₹2.53T | 58.48 | 11.84 | 39.53 | 35.68 |
| Solar Industries India Ltd. | ₹1.67T | 99.32 | 26.66 | 64.53 | 269.54 |
| Fine Organic Industries Ltd. | ₹148.04B | 34.89 | 5.46 | 27.27 | 34.46 |
| Clean Science & Technology Ltd. | ₹76.63B | 34.12 | 4.89 | 20.78 | 27.91 |
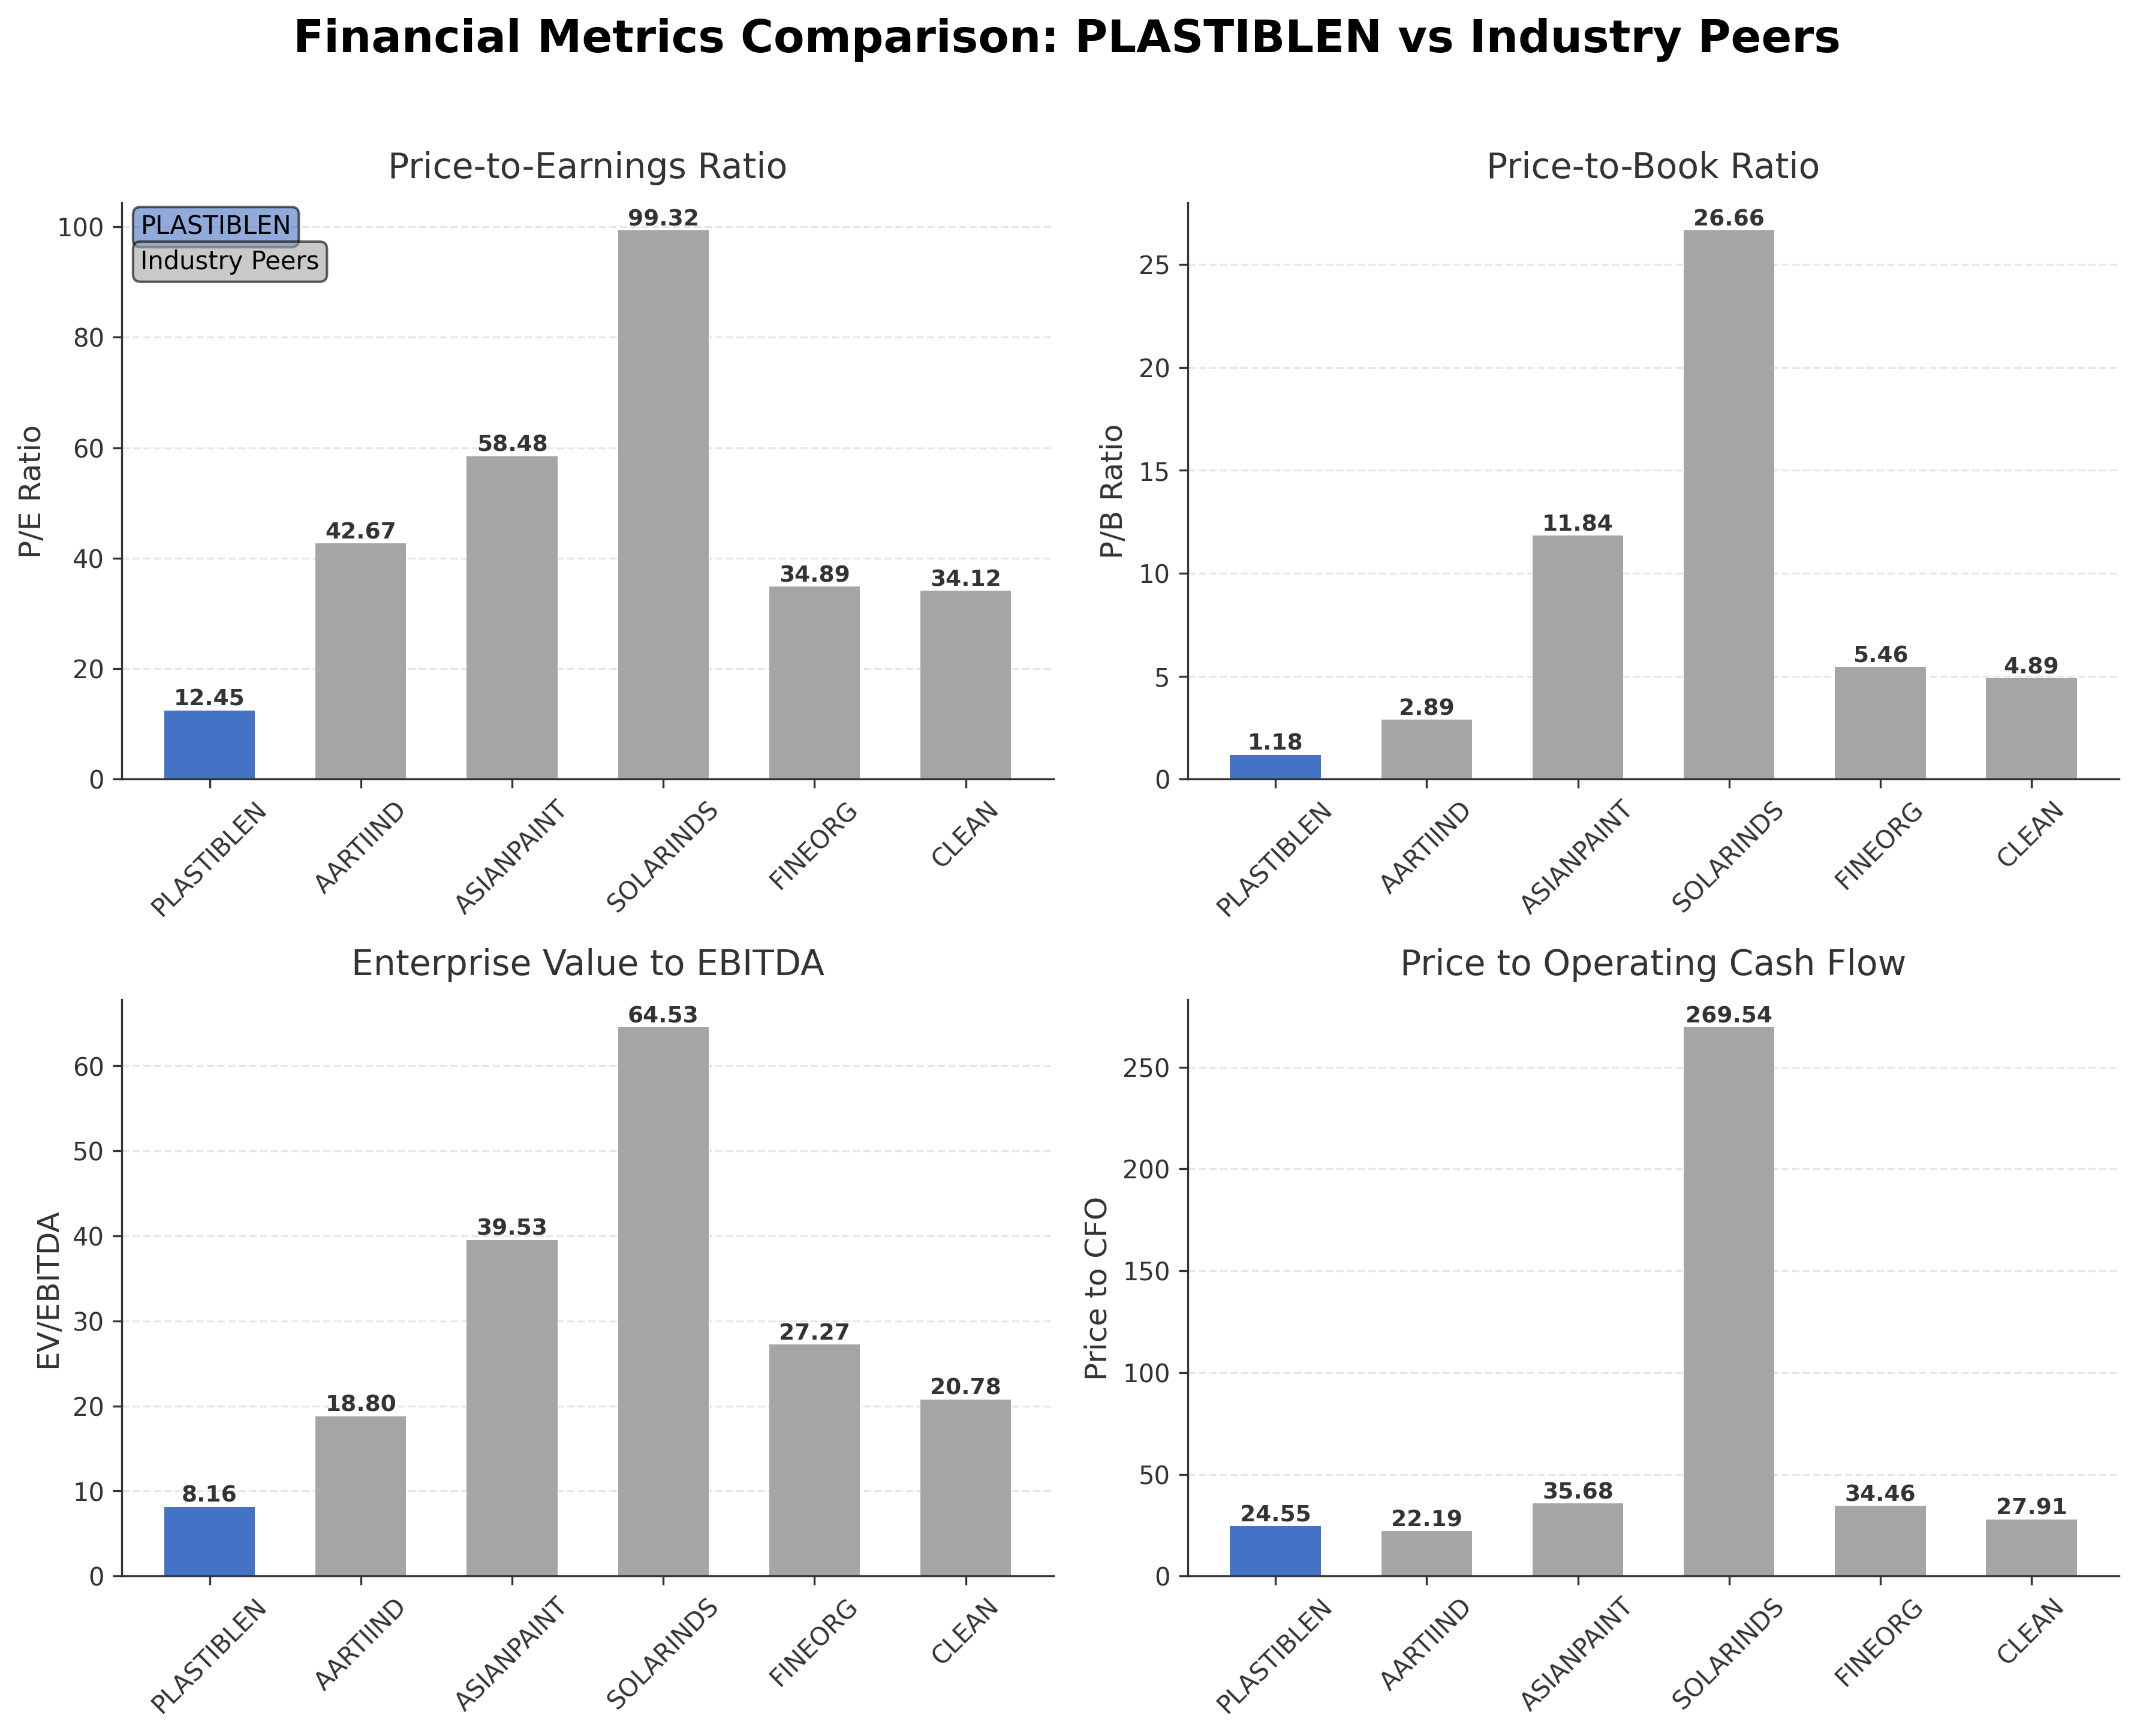
Comparison Analysis: Plastiblends India Ltd. trades at significantly lower valuation multiples compared to its larger specialty chemical peers, with a P/E of 12.45 versus peers ranging from 34.12 to 99.32 and a P/B of 1.18 well below the peer range of 2.89 to 26.66. Its EV/EBITDA multiple of 8.16 is also substantially lower than the peer group average, indicating a more conservative valuation. Return on equity at 8.17% is modest relative to peers like Solar Industries (31.23%) and Asian Paints (20.89%), reflecting a more moderate profitability profile. Price to CFO is higher than some peers, suggesting relatively higher price levels against cash flow. Overall, Plastiblends appears as a lower-valued, smaller-cap player with moderate returns compared to its industry counterparts.
Financial Metrics Comparison with Peers
Financial Statements
Comprehensive financial data including income, balance sheet, and cash flow metrics
Income Statement
| fiscal_date | 2026-03-31 | 2025-03-31 | 2024-03-31 | 2023-03-31 | 2022-03-31 |
|---|---|---|---|---|---|
| Sales | 7.88B | 7.80B | 8.01B | 7.67B | 7.14B |
| Cost Of Goods | 5.94B | 5.82B | 6.13B | 5.99B | 5.46B |
| Gross Profit | 1.94B | 1.99B | 1.88B | 1.69B | 1.69B |
| Operating Expense Selling General And Administrative | 473.05M | N/A | 477.50M | 411.14M | 385.27M |
| Operating Expense Other Operating Expenses | 363.58M | 1.04B | 361.84M | 326.84M | 282.10M |
| Operating Income | 379.21M | 367.52M | 393.84M | 334.65M | 462.81M |
| Non Operating Interest Income | 2.90M | N/A | 4.91M | 5.65M | 6.47M |
| Non Operating Interest Expense | 21.43M | 12.65M | 13.36M | 21.16M | 30.98M |
| Pretax Income | 488.16M | 449.20M | 461.60M | 364.87M | 489.78M |
| Income Tax | 121.28M | 114.78M | 116.35M | 96.36M | 122.79M |
| Net Income | 366.88M | 334.42M | 345.25M | 268.51M | 366.99M |
| Eps Basic | 14.12 | 12.87 | 13.28 | 10.33 | 14.12 |
| Eps Diluted | 14.12 | 12.87 | 13.28 | 10.33 | 14.12 |
| Basic Shares Outstanding | 25.99M | 25.98M | 25.99M | 25.99M | 25.99M |
| Diluted Shares Outstanding | 25.99M | 25.98M | 25.99M | 25.99M | 25.99M |
| Ebit | 509.59M | 461.85M | 474.96M | 386.03M | 520.76M |
| Ebitda | 630.96M | 614.09M | 599.08M | 541.30M | 681.91M |
| Net Income Continuous Operations | 488.16M | 449.20M | 461.60M | 364.87M | 489.78M |
| Preferred Stock Dividends | 0.00 | 0.00 | 0.00 | 0.00 | 0.00 |
Data provided by Twelve Data
Balance Sheet
| fiscal_date | 2026-03-31 | 2025-03-31 | 2024-03-31 | 2023-03-31 | 2022-03-31 |
|---|---|---|---|---|---|
| Cash And Cash Equivalents | 45.38M | 46.11M | 23.76M | 17.92M | 9.26M |
| Accounts Receivable | 1.30B | 1.11B | 879.87M | 911.20M | 1.19B |
| Total Assets | 5.58B | 5.07B | 4.82B | 4.84B | 5.18B |
| Total Liabilities | 1.09B | 793.32M | 770.79M | 894.48M | 1.36B |
| Long Term Debt | 0.00 | 23.14M | 47.88M | 68.33M | 112.30M |
| Shareholders Equity | 4.49B | 4.28B | 4.05B | 3.95B | 3.81B |
Data provided by Twelve Data
Cash Flow Statement
| fiscal_date | 2026-03-31 | 2025-03-31 | 2024-03-31 | 2023-03-31 | 2022-03-31 |
|---|---|---|---|---|---|
| Operating Activities Net Income | 488.16M | 449.20M | 461.60M | 364.87M | 489.78M |
| Operating Activities Other Non Cash Items | 13.17M | 4.61M | 3.28M | 10.49M | 22.97M |
| Operating Activities Accounts Receivable | -168.18M | -239.80M | 37.60M | 294.72M | -240.27M |
| Operating Activities Other Assets Liabilities | -138.29M | -164.22M | -43.99M | 3.99M | -115.23M |
| Operating Activities Operating Cash Flow | 213.32M | 49.79M | 458.49M | 674.07M | 157.25M |
| Investing Activities Capital Expenditures | -279.49M | 1.97M | 846.00K | 29.00K | N/A |
| Investing Activities Purchase Of Investments | -88.58M | N/A | -184.91M | -200.41M | 0.00 |
| Investing Activities Sale Of Investments | 23.93M | 164.15M | 21.87M | 7.23M | 2.00K |
| Investing Activities Other Investing Activity | 5.66M | 5.63M | 5.61M | 5.33M | 6.15M |
| Investing Activities Investing Cash Flow | -338.47M | 171.74M | -156.59M | -187.82M | 6.15M |
| Financing Activities Common Dividends | -64.97M | -110.45M | -103.96M | -104.35M | -105.96M |
| Financing Activities Financing Cash Flow | -64.97M | -110.45M | -103.96M | -775.56M | -89.42M |
| End Cash Position | -154.59M | 46.11M | 13.96M | 17.92M | 9.26M |
| Free Cash Flow | -66.17M | -25.36M | 257.65M | 641.83M | 97.57M |
| Financing Activities Short Term Debt Issuance | N/A | N/A | 0.00 | -335.61M | 16.53M |
| Financing Activities Long Term Debt Payments | N/A | N/A | N/A | -335.61M | 0.00 |
| Financing Activities Other Financing Charges | N/A | N/A | N/A | N/A | N/A |
Data provided by Twelve Data
Technical Analysis
Key Insights
- Current trend direction is upward with the stock price trading above both 50-day (₹183.16) and 200-day (₹163.61) moving averages, indicating bullish momentum.
- Key support levels are near ₹180 and ₹160, while resistance is observed close to the 52-week high of ₹216.29.
- The stock is positioned above the 10-day, 50-day, and 200-day moving averages, reflecting strength across short, medium, and long-term timeframes.
- Momentum indicators show RSI in a neutral to slightly bullish range, MACD trending positively, and stochastic oscillators indicating potential continuation of upward movement.
- Multi-timeframe analysis (daily, weekly, monthly) confirms consistent upward price action with no significant bearish divergences noted.
- Potential market scenarios include continuation of the current uptrend if support levels hold, with possible consolidation near resistance before further directional moves.
Trending News
Summary: Tenneco Clean Share Price: Find the latest news on Tenneco Clean Stock Price. Get all the information on Tenneco Clean with historic price charts for NSE / BSE. Experts & Broker view also get the Tenneco Clean Ltd. buy/sell tips detailed news, announcements, Forecasts, Analysts, Valuation, ...
Sentiment: neutral
Summary: Polycab Share Price: Find the latest news on Polycab Stock Price. Get all the information on Polycab with historic price charts for NSE / BSE. Experts & Broker view also get the Polycab Ltd. buy/sell tips detailed news, announcements, Forecasts, Analysts, Valuation, Earning forecasts, Estimates, ...
Sentiment: neutral
3. Headline: Tube Investments of India shares fall 2.15%- Moneycontrol.com
Summary: With the stock's last traded price at Rs 2,754.60, Tube Investments of India Ltd is currently trading lower amid a bearish sentiment as of Tuesday, August 11, 2026.
Sentiment: negative
Summary: Oil India Ltd shares extended their gains for the second straight session on Tuesday, August 11, rising more than 4 percent after the state-owned oil and gas producer reported its Q1 FY27 results on Friday evening. CLSA maintained a positive view on the stock, citing production growth and the ...
Sentiment: positive
Summary: Sales rise 28.63% to Rs 989.45 crore · Powered by Capital Market - Live News
Sentiment: positive
Powered by Brave
Recent Updates
News Summary
As of August 13, 2026. Plastiblends India Ltd. reported a 9.7% increase in net profit to ₹36.69 crore for fiscal year 2026, accompanied by a dividend declaration of ₹3.00 per share, signaling confidence in its financial stability. Despite modest revenue growth of 1.05%, the company expanded profit margins, reflecting improved operational efficiency. Additionally, promoters Varun S. Kabra and Jyoti V. Kabra consolidated their holdings through an inter-se transfer of 8.85% stake from Kolsite Corporation LLP, maintaining total promoter ownership at 62.22%. This transaction complied with SEBI regulations and did not trigger open offer obligations, indicating a strategic internal reshuffle. These developments highlight steady financial performance and focused promoter control without significant external institutional changes.
News Sentiment
The overall sentiment from recent updates is neutral to positive. Profit growth and dividend announcements contribute positively, demonstrating operational efficiency and shareholder returns. Promoter share consolidation is neutral, reflecting internal ownership adjustments without altering control dynamics. Absence of significant institutional activity or major strategic shifts tempers the outlook, maintaining a balanced tone. The combination of steady earnings growth and stable governance underpins a cautiously optimistic view of the company’s near-term prospects.
Source List
Analytical Overview
Analysis Summary
Plastiblends India Ltd. trades at a trailing P/E of 12.45, which is significantly lower than the specialty chemicals industry average, indicating a relatively attractive valuation. Forward P/E data is unavailable, limiting forward-looking valuation assessment. The company’s revenue growth of 11% quarterly and positive cash flow trends, including operating cash flow of ₹21.3 crore and free cash flow of ₹36.7 crore, suggest a stable growth trajectory with improving operational efficiency. Financial health appears solid with a low total debt of ₹22.3 crore against cash reserves of ₹46.7 crore and a strong current ratio of 4.23, indicating good liquidity and manageable leverage. Sector-specific challenges include regulatory compliance and raw material cost volatility, while opportunities arise from increasing demand for specialty plastics additives in diverse industries. Considering India-specific factors, the company benefits from a growing plastics sector and supportive economic outlook, though regulatory scrutiny remains a key consideration.
Overall Business and Market Assessment
Supporting Factors: a conservative valuation relative to peers, steady revenue growth, and strong liquidity with low debt
Risk Factors: sector regulatory challenges and competitive pressures impacting margins
SWOT Analysis
Strengths
- Strong liquidity position with a current ratio of 4.23.
- Low debt levels relative to cash reserves enhance financial stability.
- Dominant promoter ownership at 62.22% ensures focused governance.
- Consistent revenue growth and expanding profit margins indicate operational efficiency.
Weaknesses
- Modest return on equity at 8.17% compared to industry peers.
- Limited institutional investor presence reduces external market support.
- Relatively low dividend yield of 1.24% may limit income appeal.
- Forward P/E ratio data is unavailable, restricting forward valuation insight.
Opportunities
- Growing demand for specialty plastics additives across multiple sectors.
- Potential for margin expansion through operational improvements.
- Increasing exports can enhance global market presence.
- Favorable economic conditions in India support industry growth.
Threats
- Regulatory risks related to chemical manufacturing and environmental compliance.
- Volatility in raw material prices could pressure margins.
- Intense competition from larger specialty chemical companies.
- Macroeconomic uncertainties impacting industrial demand.
Company Description
Plastiblends India Ltd. is a leading manufacturer and exporter of color and additive masterbatches for the plastics industry. The company plays a crucial role in adding value to raw plastic materials by enhancing their aesthetic appeal and functional properties. With a diversified product portfolio, Plastiblends serves various sectors including packaging, agriculture, textiles, consumer products, and automotive industries. Its masterbatches are essential for coloring plastics and imparting specific properties such as UV resistance and flame retardancy. As an integral part of the supply chain, Plastiblends supports innovation and sustainability in the plastics industry. Headquartered in India, the company holds a significant position in the domestic market, while also exporting products to multiple countries, thus contributing to its global footprint. Its commitment to quality and customer-centric solutions makes it a vital player in advancing material functionalities and meeting market demands.