
Piramal Pharma Ltd (PPLPHARMA)
Stock Analysis Report
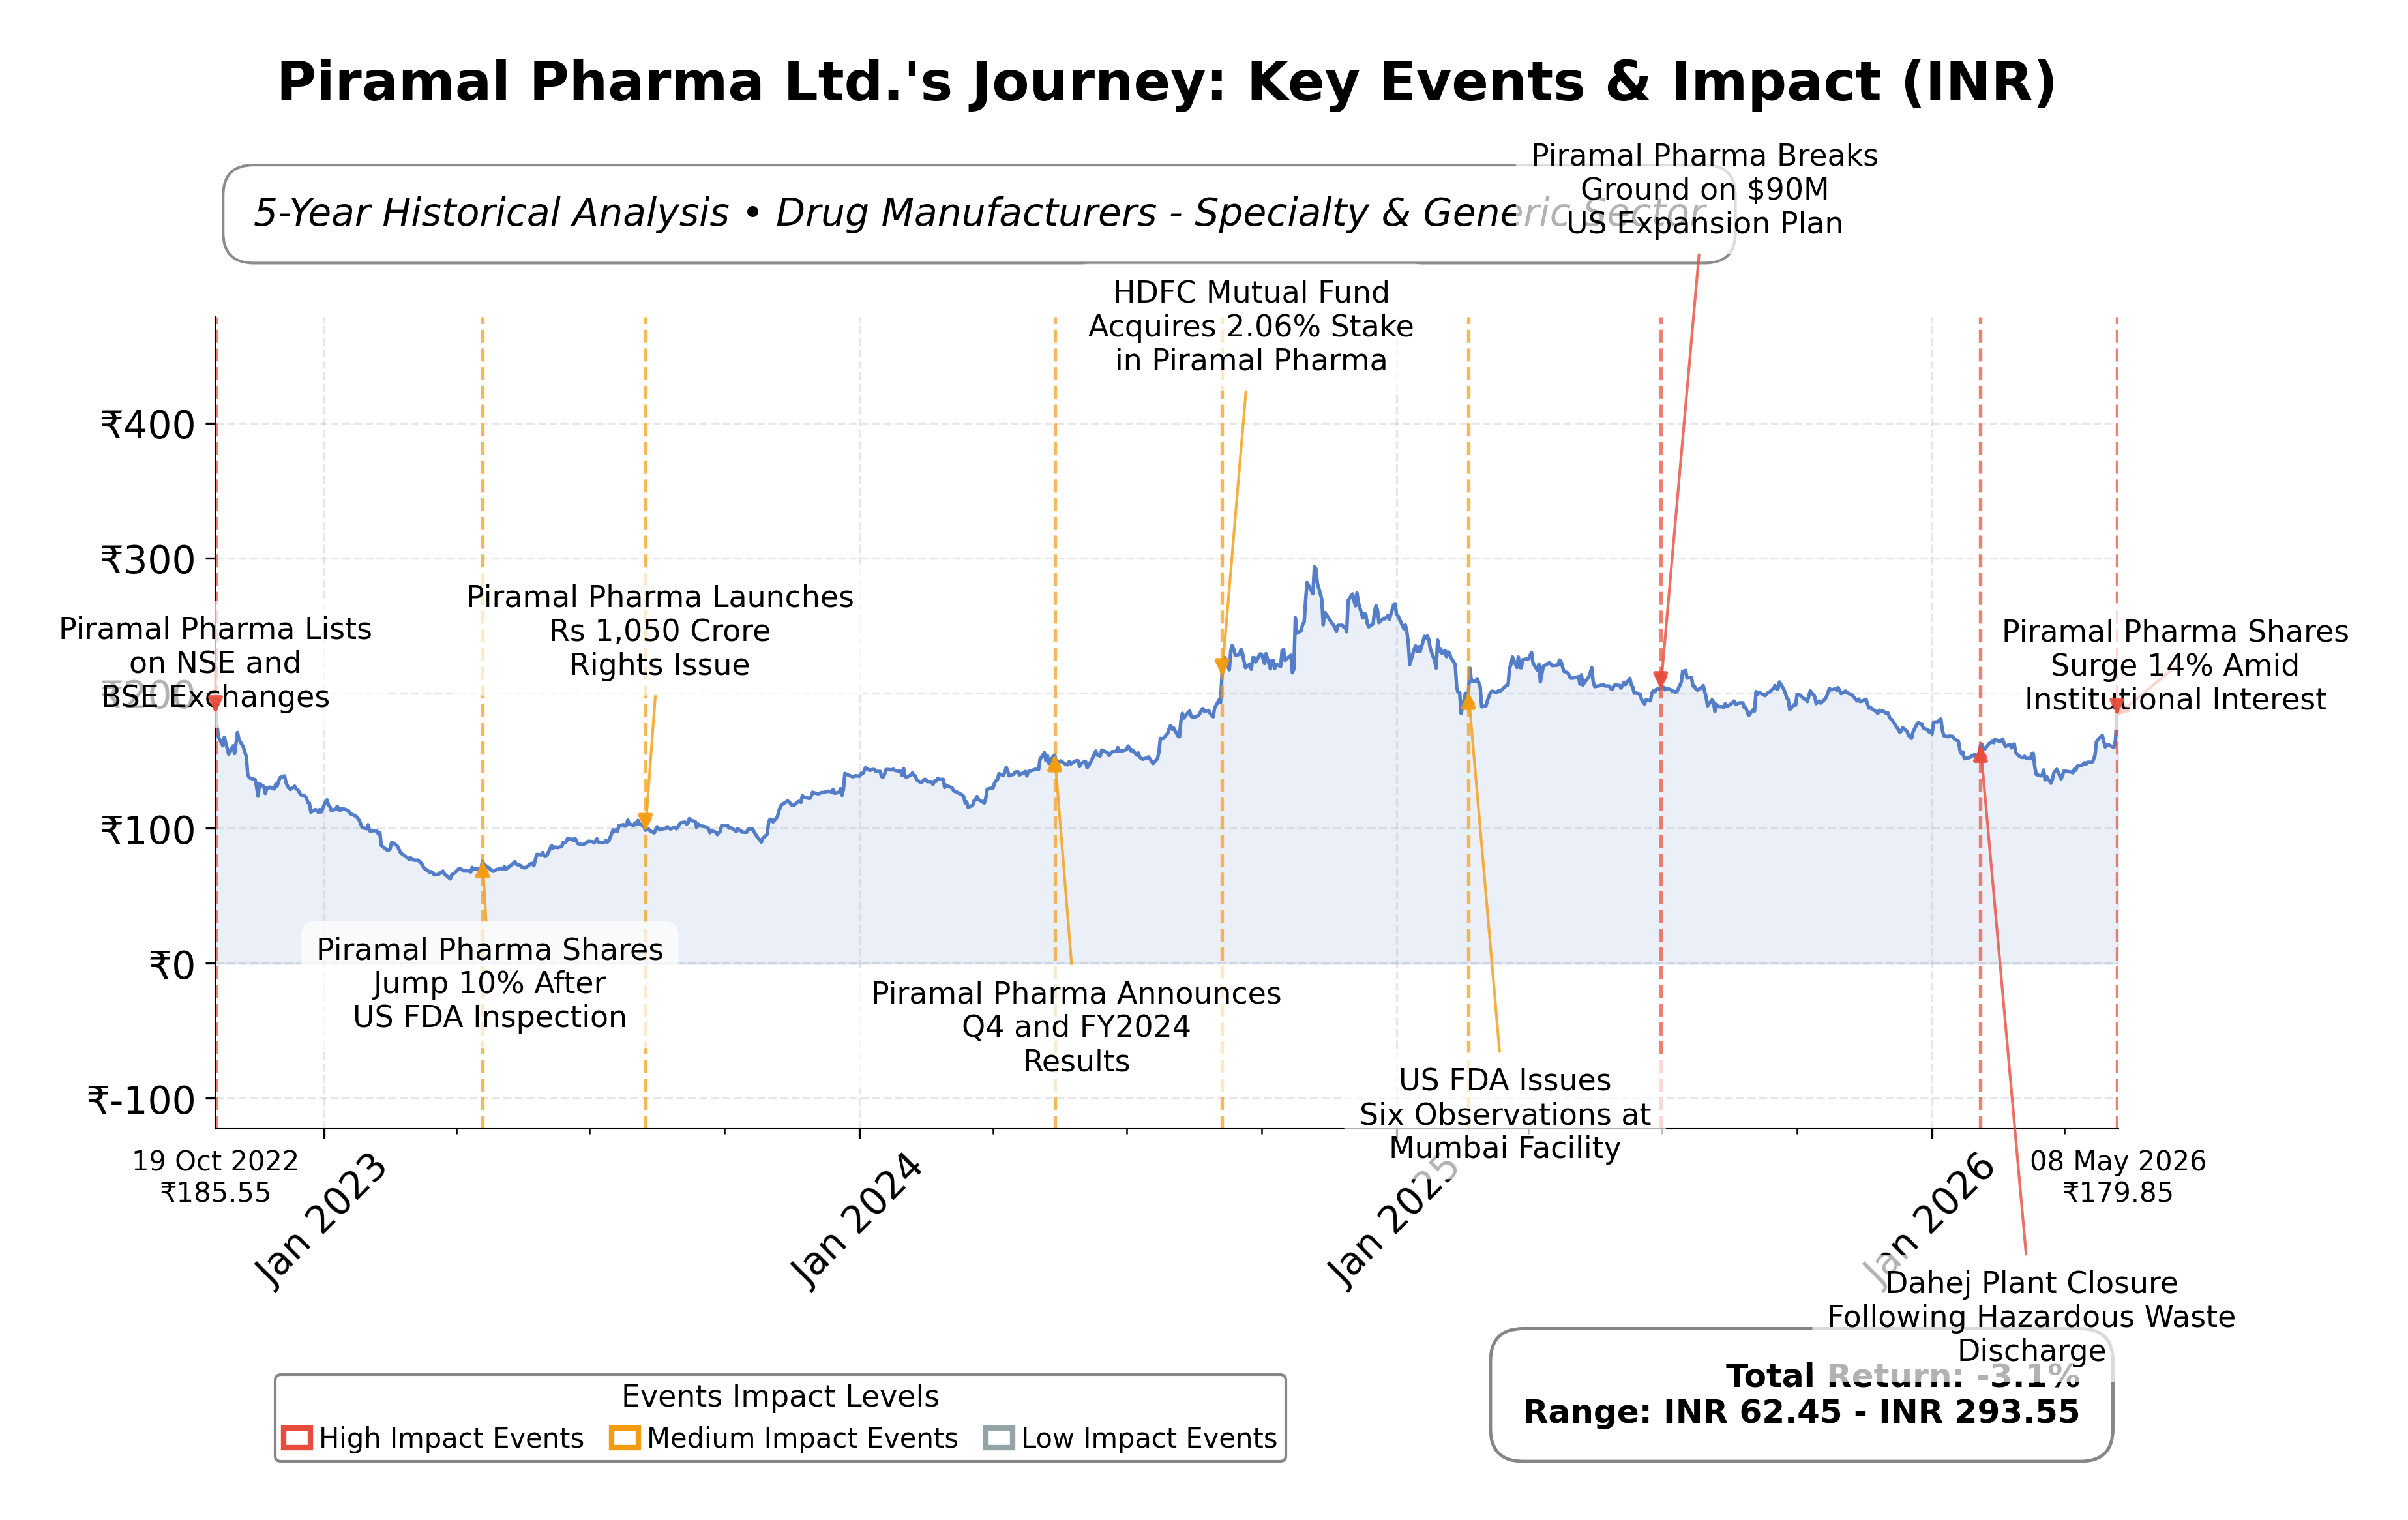
Stock Journey
Key Positives and Key Risks
Pros
- Piramal Pharma Ltd. generates strong operating cash flow of ₹16.53 billion, supporting operational stability.
- The company has a diversified portfolio with growth in CDMO and consumer healthcare segments, enhancing revenue streams.
- The stock trades at a price to CFO ratio of 14.42, indicating relatively attractive cash flow valuation compared to peers.
Cons
- The trailing P/E ratio of 269.79 is significantly higher than industry peers, reflecting elevated valuation risk.
- Negative net income margin of -3.68% and return on equity of -4.0% indicate current profitability challenges.
- High debt-to-equity ratio of 69.52% and impairment losses of ₹176 crore highlight financial and operational risks.
Disclosure: This information is for general awareness and does not constitute investment advice
Report Summary
Piramal Pharma Ltd. is a prominent pharmaceutical company headquartered in India, listed on the NSE under the symbol PPLPHARMA. Operating within the healthcare sector, it specializes in drug manufacturing with a focus on specialty and generic medicines. The company’s business segments include critical care, consumer care, and differentiated medicines, supported by a global presence and advanced manufacturing capabilities. It holds a significant position in the pharmaceutical industry, leveraging innovation and sustainability to meet healthcare demands worldwide.
Financially, Piramal Pharma reported trailing twelve months (TTM) revenue of approximately ₹88.69 billion with a gross margin of 61.64%. However, the company posted a net loss margin of -3.68% and an operating margin of 8.8%, reflecting challenges in profitability. Return on equity (ROE) stands at -4.0%, and return on assets (ROA) is 0.34%, indicating limited efficiency in asset and equity utilization. The company’s return on invested capital (ROIC) and cash flow metrics suggest moderate operational cash generation but highlight areas for improvement in net profitability.
Valuation metrics reveal a high trailing price-to-earnings (P/E) ratio of 269.79 and a forward P/E of 42.41, signaling elevated market expectations relative to current earnings. The price-to-book (P/B) ratio is 3.01, and the enterprise value to EBITDA (EV/EBITDA) stands at 31.40, both indicating premium valuation compared to industry peers. The stock trades at ₹179.44, within a 52-week range of ₹132.30 to ₹226.00, currently positioned below its midpoint, suggesting some downside from the recent high.
Key strengths include a robust cash position of ₹13.55 billion, strong operating cash flow of ₹16.53 billion, and a diversified portfolio with global reach. The company’s debt-to-equity ratio of 69.52% reflects moderate leverage. Risks involve geopolitical uncertainties impacting global operations, legacy asset impairments, and high borrowing costs. Recent strategic moves include acquisitions in consumer healthcare and expansion in contract development and manufacturing organization (CDMO) business, alongside leadership focus on margin improvement and operational efficiencies.
Technically, the stock has shown positive momentum with recent price rallies and volume surges, crossing above key moving averages such as the 200-day moving average. However, mixed momentum indicators and some volatility suggest cautious monitoring. Overall, the data portrays a company in transition with growth potential tempered by valuation premiums and operational challenges, warranting a balanced and watchful approach.
Company and Industry Overview
Company Basics
Price Performance
Company Size
Shareholding Pattern
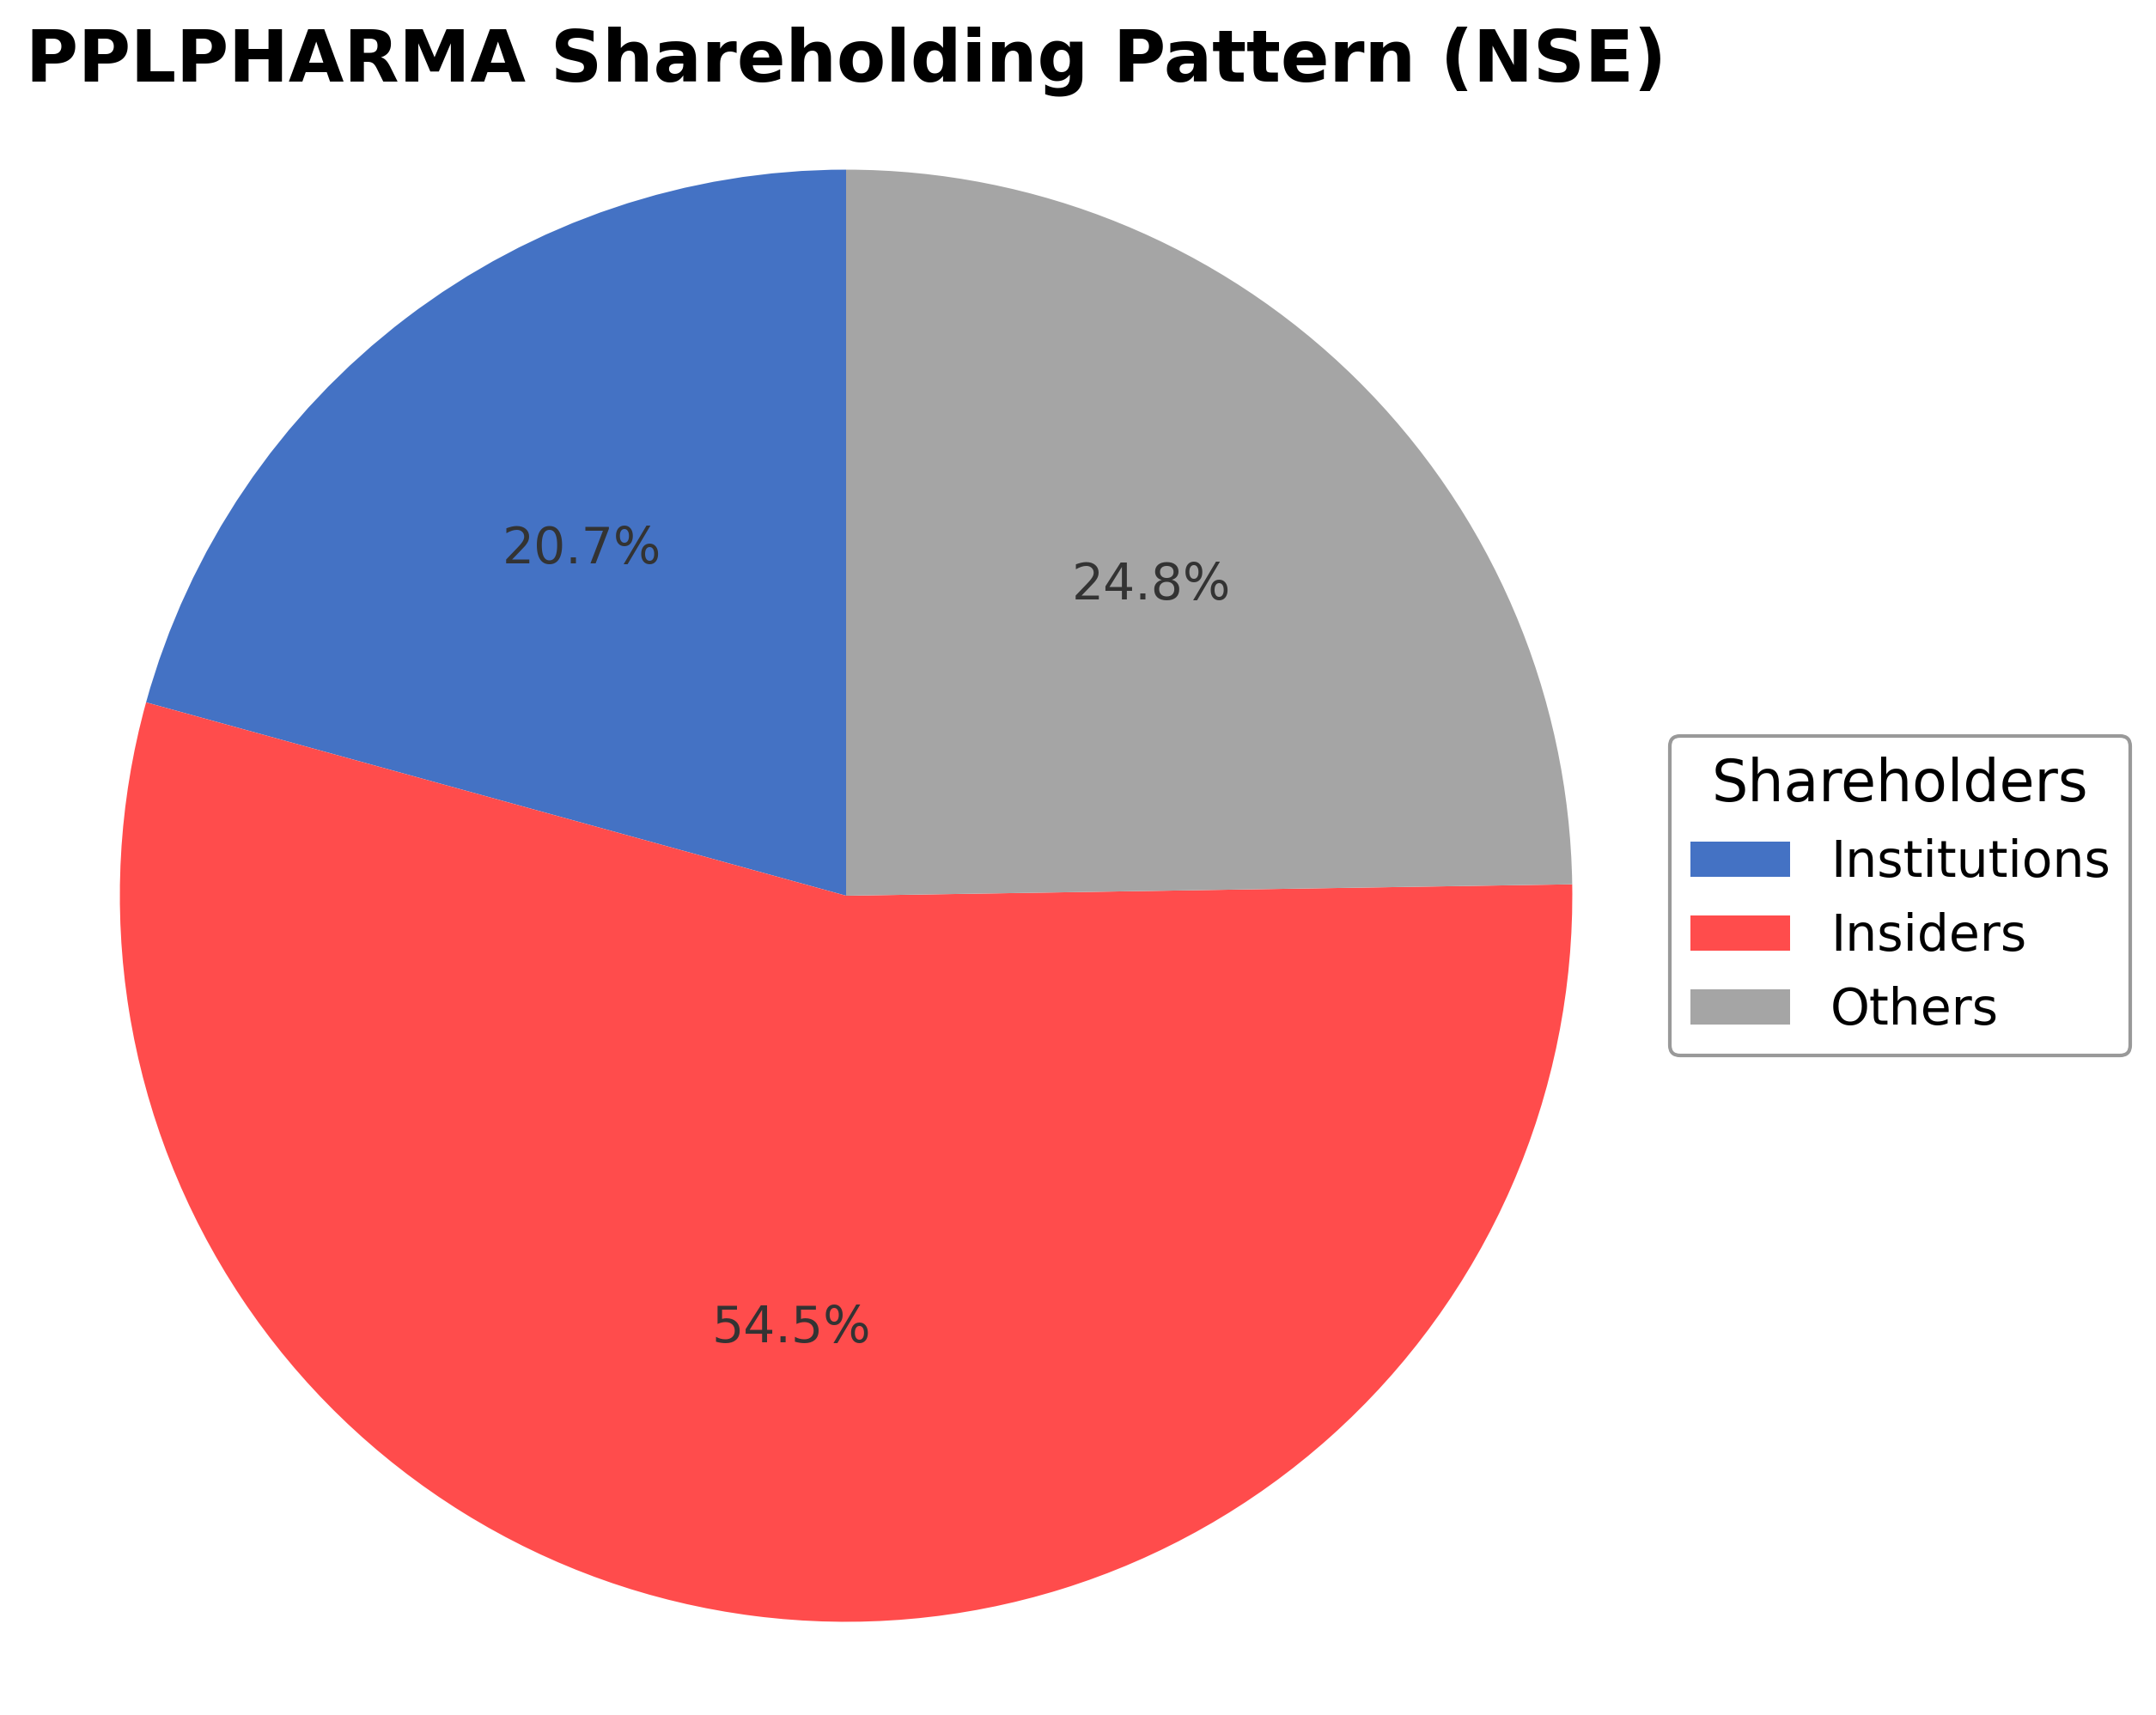
Piramal Pharma Ltd.'s ownership structure comprises approximately 54.54% held by insiders including executives and board members, 20.71% by institutional investors such as mutual funds and pension funds, and the remaining 24.75% by public and other shareholders. Over the past 12-24 months, institutional holdings have shown moderate accumulation, reflecting growing interest from major funds, while insider ownership remains stable. This distribution suggests a balanced governance framework with significant promoter control complemented by institutional oversight. The shareholding pattern indicates market confidence in the company's strategic direction, with institutional investors supporting growth initiatives and operational transitions within the pharmaceutical sector.
Sector and Industry Analysis
The pharmaceutical sector in India is a significant contributor to the global drug supply, with a market size exceeding $40 billion and projected to grow at a CAGR of around 10-12% over the next five years. It encompasses a broad range of activities including drug manufacturing, research and development, and contract manufacturing. Key players in this sector include multinational corporations as well as large domestic companies like Piramal Pharma, Sun Pharma, and Dr. Reddy’s Laboratories, which have established strong global footprints.
Industry trends indicate a growing emphasis on specialty pharmaceuticals, biosimilars, and complex generics, driven by increasing healthcare demands and patent expirations of branded drugs. Contract research and manufacturing services (CRAMS) have become a competitive battleground, with companies investing heavily in R&D and advanced manufacturing capabilities to differentiate themselves. Barriers to entry remain high due to the need for significant capital investment, regulatory compliance, and technical expertise, which favors well-established firms with integrated operations and global reach.
The regulatory environment in India’s pharmaceutical industry is characterized by stringent guidelines from bodies such as the Central Drugs Standard Control Organization (CDSCO) and adherence to international standards like the US FDA and EMA. Recent regulatory reforms aim to enhance drug quality, streamline approval processes, and encourage innovation while ensuring patient safety. Ongoing regulatory scrutiny and evolving compliance requirements continue to shape industry dynamics, influencing product pipelines, market access, and operational strategies.
Note: Analysis synthesized from industry research, market reports, and regulatory filings. Information is subject to change based on market conditions.
Financial Ratios Dashboard
Illustrative Scenario Analysis
DCF Assumptions:
Method: Two-Stage EPS-Priority Model
Financials
Peer Analysis
| Company Name | Market Cap | P/E Ratio | P/B Ratio | EV/EBITDA | Price to CFO |
|---|---|---|---|---|---|
| Piramal Pharma Ltd. | ₹238.26B | 269.79 | 3.01 | 31.40 | 14.42 |
| Emcure Pharmaceuticals Ltd. | ₹311.50B | 33.67 | 6.56 | 18.07 | 33.01 |
| Cipla Ltd. | ₹1.09T | 23.98 | 3.31 | 15.70 | 19.73 |
| Eris Lifesciences Ltd. | ₹192.03B | 43.97 | 6.11 | 17.77 | 25.36 |
| Abbott India Ltd. | ₹567.36B | 37.17 | 14.15 | 30.34 | 42.45 |
| Cohance Lifesciences Limited | ₹186.95B | 96.10 | 4.92 | 118.07 | 63.38 |
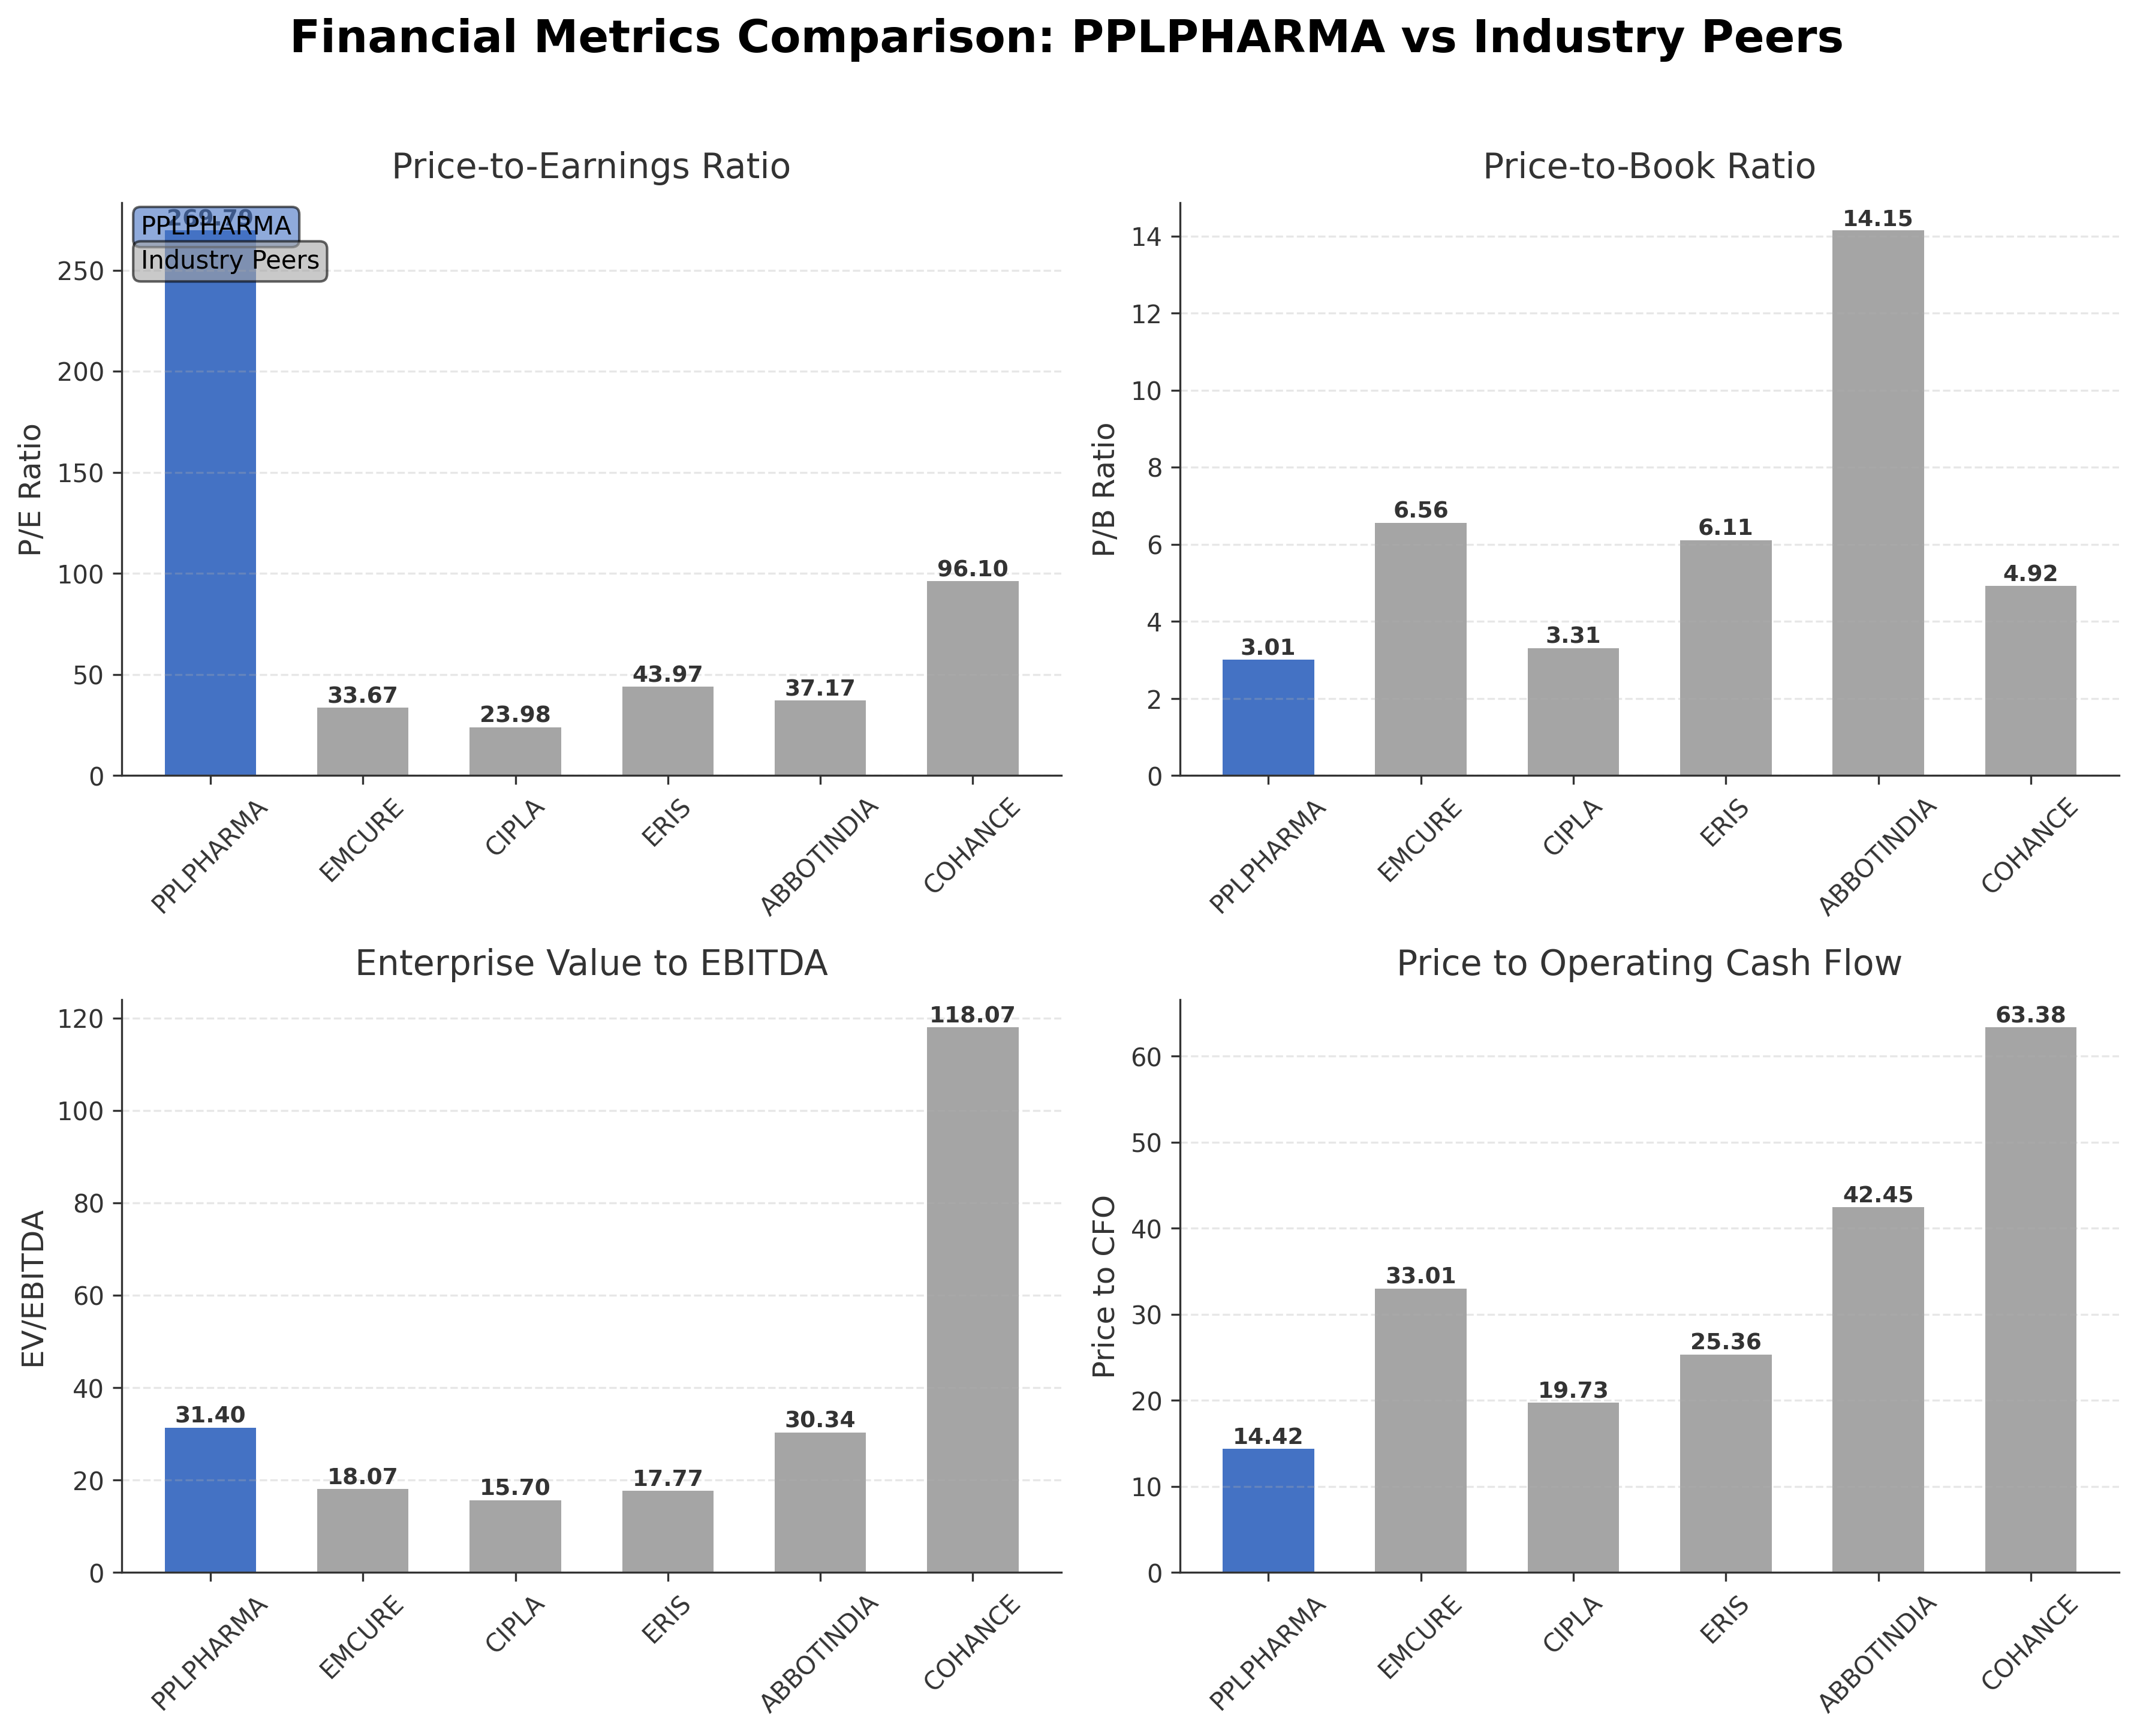
Comparison Analysis: Piramal Pharma Ltd. trades at a significantly higher trailing P/E ratio of 269.79 compared to its peers, whose P/E ratios range from 23.98 to 96.10, indicating a premium valuation relative to earnings. Its P/B ratio of 3.01 is moderate within the peer group, with Abbott India exhibiting the highest at 14.15. The EV/EBITDA multiple of 31.40 is elevated but comparable to Abbott India’s 30.34, while other peers show lower multiples between 15.70 and 118.07. Piramal’s price to CFO ratio of 14.42 is the lowest among peers, suggesting relatively better cash flow valuation. Return on equity is negative at -0.04%, contrasting with positive but modest ROE figures among peers. Overall, Piramal Pharma shows premium valuation metrics with weaker profitability compared to regional industry peers.
Financial Metrics Comparison with Peers
Financial Statements
Comprehensive financial data including income, balance sheet, and cash flow metrics
Income Statement
| fiscal_date | 2026-03-31 | 2025-03-31 | 2024-03-31 | 2023-03-31 | 2022-03-31 |
|---|---|---|---|---|---|
| Sales | 88.69B | 90.61B | 81.06B | 70.32B | 64.72B |
| Cost Of Goods | 32.39B | 35.72B | 32.59B | 30.00B | 26.80B |
| Gross Profit | 56.31B | 54.89B | 48.48B | 40.32B | 37.91B |
| Operating Expense Other Operating Expenses | 22.93B | 10.38B | 10.09B | 8.80B | 7.04B |
| Operating Income | 903.80M | 6.79B | 4.32B | -479.70M | 3.65B |
| Non Operating Interest Expense | 3.41B | 4.18B | 4.47B | 3.38B | 1.89B |
| Pretax Income | -1.76B | 4.15B | 1.79B | -1.20B | 4.85B |
| Income Tax | 1.50B | 3.24B | 1.61B | 663.10M | 1.09B |
| Net Income | -3.26B | 911.30M | 178.20M | -1.86B | 3.76B |
| Eps Basic | -2.46 | 0.69 | 0.14 | -1.54 | 3.09 |
| Eps Diluted | -2.46 | 0.68 | 0.14 | -1.54 | 3.09 |
| Basic Shares Outstanding | 1.32B | 1.32B | 1.28B | 1.21B | 1.22B |
| Diluted Shares Outstanding | 1.32B | 1.32B | 1.28B | 1.21B | 1.22B |
| Ebit | 1.65B | 8.33B | 6.26B | 2.18B | 6.74B |
| Ebitda | 11.92B | 16.89B | 14.01B | 8.99B | 12.54B |
| Net Income Continuous Operations | -2.33B | 3.42B | 1.20B | -1.61B | 4.41B |
| Minority Interests | 0.00 | 0.00 | N/A | N/A | N/A |
| Preferred Stock Dividends | 0.00 | 0.00 | 0.00 | 0.00 | 0.00 |
| Operating Expense Research And Development | N/A | 971.30M | 1.01B | 863.60M | 1.28B |
| Operating Expense Selling General And Administrative | N/A | 6.05B | 5.67B | 5.55B | 4.77B |
| Non Operating Interest Income | N/A | 105.80M | 119.20M | 16.40M | 6.80M |
Source: Financial statements and regulatory filings
Balance Sheet
| fiscal_date | 2026-03-31 | 2025-03-31 | 2024-03-31 | 2023-03-31 | 2022-03-31 |
|---|---|---|---|---|---|
| Cash And Cash Equivalents | 12.00B | 3.69B | 3.57B | 1.96B | 2.28B |
| Accounts Receivable | 21.58B | 23.50B | 21.34B | 17.99B | 17.85B |
| Total Assets | 179.65B | 156.78B | 153.12B | 145.23B | 127.97B |
| Total Liabilities | 98.02B | 75.52B | 74.00B | 77.49B | 61.00B |
| Long Term Debt | 44.35B | 33.13B | 26.02B | 34.85B | 27.08B |
| Shareholders Equity | 81.63B | 81.25B | 79.11B | 67.73B | 66.97B |
Source: Financial statements and regulatory filings
Cash Flow Statement
| fiscal_date | 2026-03-31 | 2025-03-31 | 2024-03-31 | 2023-03-31 | 2022-03-31 |
|---|---|---|---|---|---|
| Operating Activities Net Income | -2.33B | 3.42B | 1.20B | -1.61B | 4.41B |
| Operating Activities Stock Based Compensation | 417.20M | 480.00M | 274.70M | 0.00 | N/A |
| Operating Activities Other Non Cash Items | 5.06B | 3.68B | 4.36B | 3.03B | 1.58B |
| Operating Activities Accounts Receivable | 2.17B | -2.33B | -3.91B | 892.60M | -1.85B |
| Operating Activities Other Assets Liabilities | -5.01B | -2.80B | -2.58B | -1.23B | -1.93B |
| Operating Activities Operating Cash Flow | 305.10M | 2.44B | -660.50M | 1.10B | 2.21B |
| Investing Activities Capital Expenditures | -8.77B | -6.59B | -7.10B | -9.45B | -8.57B |
| Investing Activities Purchase Of Investments | -9.92B | -18.85B | -16.90B | -12.23B | -15.34B |
| Investing Activities Sale Of Investments | 9.97B | 20.04B | 19.49B | 8.48B | 14.03B |
| Investing Activities Investing Cash Flow | -8.72B | -5.24B | -4.56B | -14.14B | -18.94B |
| Financing Activities Long Term Debt Issuance | 9.03B | 2.55B | 2.40B | 25.63B | 9.04B |
| Financing Activities Long Term Debt Payments | -15.67B | -10.65B | -26.32B | -31.86B | -12.34B |
| Financing Activities Short Term Debt Issuance | 9.85B | 8.59B | -3.50B | 3.57B | 3.53B |
| Financing Activities Common Stock Issuance | 28.10M | 0.00 | 10.50B | 0.00 | -1.00M |
| Financing Activities Common Dividends | -185.50M | -144.70M | N/A | -670.00M | -500.00M |
| Financing Activities Financing Cash Flow | 3.05B | 342.50M | -16.92B | -3.33B | -274.40M |
| End Cash Position | 9.76B | 1.82B | 2.19B | 532.30M | 851.80M |
| Free Cash Flow | 7.63B | 2.28B | 2.92B | -4.81B | -1.23B |
| Investing Activities Other Investing Activity | N/A | 163.00M | -42.50M | -733.10M | -100.00K |
| Financing Activities Other Financing Charges | N/A | 100.00K | N/A | N/A | N/A |
| Investing Activities Net Acquisitions | N/A | N/A | 0.00 | -203.50M | -9.06B |
Source: Financial statements and regulatory filings
Technical Analysis
Key Insights
- Piramal Pharma Ltd. is currently exhibiting an upward trend with recent price rallies breaking above the 200-day moving average, indicating positive momentum in the medium term.
- Key support levels are identified near ₹150, aligning with the 50-day moving average, while resistance is observed around ₹226, the 52-week high.
- The stock price is trading above the 10-day and 50-day moving averages but remains below the 200-day moving average, suggesting mixed signals across short and long-term trends.
- Momentum indicators show RSI in a moderately overbought zone near 70, MACD is positive but converging, and Stochastic oscillators indicate potential short-term consolidation.
- Multi-timeframe analysis reveals bullish signals on the daily and weekly charts, while monthly charts suggest a sideways to mildly bullish trend.
- Current technical setup supports scenarios of continued upward momentum with possible short-term pullbacks near resistance levels, warranting close monitoring of volume and momentum shifts.
Trending News
1. Headline: Piramal Pharma - Positive Breakout: These 8 stocks cross above their 200 DMAs | The Economic Times
Summary: In the Nifty500 pack, 16 stocks closed above their 200-day moving average (DMA) on May 7, 2026, according to technical scan data from StockEdge. Among these, we have highlighted the top eight stocks that posted gains of more than 3%. The 200-day daily moving average (DMA) is used by traders ...
Sentiment: positive
2. Headline: Piramal Finance planning to raise $1 billion via foreign currency loans | Company News - Business Standard
Summary: Piramal Finance Ltd will mainly tap foreign banks and multilateral agencies for the loan, with tenors ranging from three to five years, Chief Executive Officer Jairam Sridharan said
Sentiment: neutral
3. Headline: Piramal Pharma Ltd Sees Exceptional Volume Surge Amid Strong Price Rally
Summary: Piramal Pharma Ltd (PPLPHARMA) has emerged as one of the most actively traded stocks on 7 May 2026, registering a remarkable surge in volume and price amidst heightened volatility. The pharmaceutical and biotechnology small-cap stock outperformed its sector and broader market indices, signalling ...
Sentiment: positive
4. Headline: Piramal Pharma Ltd Sees Surge in Value Trading Amid Volatility and Institutional Interest
Summary: Piramal Pharma Ltd (PPLPHARMA) emerged as one of the most actively traded stocks by value on 7 May 2026, registering a remarkable 12.39% intraday gain and outperforming its sector by over 14%. The pharmaceutical small-cap has attracted significant institutional interest, with trading volumes ...
Sentiment: positive
5. Headline: Piramal Pharma Ltd Surges 8.42% to Day's High of Rs 175.7 — Outperforms Sector by 6.05 Percentage Points
Summary: The Sensex declined 0.18% on 7 May 2026, while Piramal Pharma Ltd surged 8.42%, outperforming its Pharmaceuticals & Biotechnology sector by 6.05 percentage points. This sharp single-session gain stands out as a stock-specific event amid a broadly weak market backdrop.
Sentiment: positive
Recent Updates
News Summary
As of April 29, 2026. Piramal Pharma Ltd. reported its Q4 and full-year FY26 financial results, highlighting a transitional year marked by external disruptions and business-specific challenges. The company’s total Assets Under Management (AUM) grew by 25% year-on-year, surpassing ₹1 lakh crore, with retail AUM increasing by 33% and constituting 85% of total AUM. The wholesale 2.0 book showed zero Non-Performing Assets (NPAs), indicating improved asset quality. Despite these positives, the company recognized an impairment loss of ₹176 crore on intangible assets under development due to reassessed market conditions. Geopolitical risks in the Gulf region and a high cost of borrowing remain concerns, alongside operational expenses from branch network expansion. The company’s CDMO business is experiencing healthy traction, and consumer healthcare segments are positioned for growth, supported by recent acquisitions and product ramp-ups.
News Sentiment
The overall sentiment from recent updates is cautiously optimistic, reflecting strong growth in AUM and asset quality improvements balanced against impairment charges and geopolitical risks. Positive momentum in the CDMO and consumer healthcare businesses supports growth prospects, while high borrowing costs and operational expenses temper enthusiasm. Institutional interest and volume surges in the stock underscore market confidence, though valuation premiums and mixed quarterly financial trends suggest measured investor caution. The sentiment is nuanced, combining growth potential with operational and macroeconomic challenges.
Source List
- https://finance.yahoo.com/markets/stocks/articles/piramal-pharma-ltd-bom-543635-070113703.html
- https://www.finanzwire.com/press-release/piramal-pharma-limited-etr-piramal-pharma-limited-announces-results-for-q4-and-full-year-fy26-A8i7CY2q3Vw
- https://www.prnewswire.com/news-releases/piramal-pharma-limited-announces-results-for-q4-and-full-year-fy26-302756234.html
Analytical Overview
Analysis Summary
Piramal Pharma Ltd.’s valuation metrics, including a trailing P/E of 269.79 and forward P/E of 42.41, are significantly higher than the industry average, indicating market expectations for future earnings growth but also reflecting elevated risk. Revenue growth is flat with a slight decline of 0.1%, while operating cash flow remains robust at ₹16.53 billion, demonstrating solid cash generation despite net losses. The company’s financial health shows moderate leverage with a debt-to-equity ratio of 69.52% and a current ratio of 1.51, suggesting manageable liquidity but a need for cautious debt management. Sector challenges include geopolitical risks and high borrowing costs, while opportunities arise from expanding CDMO operations and consumer healthcare growth. India-specific factors such as regulatory environment and evolving healthcare demand influence the company’s strategic positioning and growth potential.
Overall Business and Market Assessment
Supporting Factors: strong cash flow generation, diversified business segments with growth in CDMO and consumer healthcare, and improving asset quality
Risk Factors: geopolitical disruptions, legacy asset impairments, and high cost of borrowing
SWOT Analysis
Strengths
- Piramal Pharma Ltd. has a diversified pharmaceutical portfolio including specialty and generic medicines.
- The company demonstrates strong operating cash flow generation of ₹16.53 billion.
- Robust asset quality with zero NPAs in the wholesale 2.0 book.
- Global presence supported by advanced manufacturing and R&D capabilities.
Weaknesses
- Negative net income margin of -3.68% and negative return on equity at -4.0%.
- High trailing P/E ratio of 269.79 indicating elevated valuation.
- Significant impairment loss of ₹176 crore on intangible assets.
- Moderate leverage with a debt-to-equity ratio of 69.52%.
Opportunities
- Growth potential in CDMO business with healthy order inflows.
- Expansion in consumer healthcare supported by recent acquisitions.
- Increasing retail AUM contributing 85% of total AUM.
- Potential to reduce high borrowing costs over the next three years.
Threats
- Geopolitical instability in the Gulf region affecting operations.
- Legacy asset challenges requiring complete phase-out.
- Rising operational expenses due to branch network expansion.
- Global macroeconomic volatility impacting pharmaceutical demand.
Company Description
Piramal Pharma Ltd. is a leading pharmaceutical company engaged in the development, manufacture, and distribution of a wide range of pharmaceutical products. The company plays a crucial role in the healthcare sector, focusing on key areas such as critical care, consumer care, and differentiated medicines. With a robust portfolio that includes generic formulations, complex hospital generics, and more, Piramal Pharma meets healthcare needs across several regions. Headquartered in India, the company operates on a global scale, leveraging advanced research capabilities and cutting-edge manufacturing processes. Piramal Pharma Ltd. also places significant emphasis on sustainability and innovation, ensuring that its products meet high standards of safety and efficacy. As a major player in the pharmaceutical industry, the company contributes to the global availability of essential medicines, supporting health systems and patients alike.