

Pidilite Industries Limited (PIDILITIND)
Stock Analysis Report
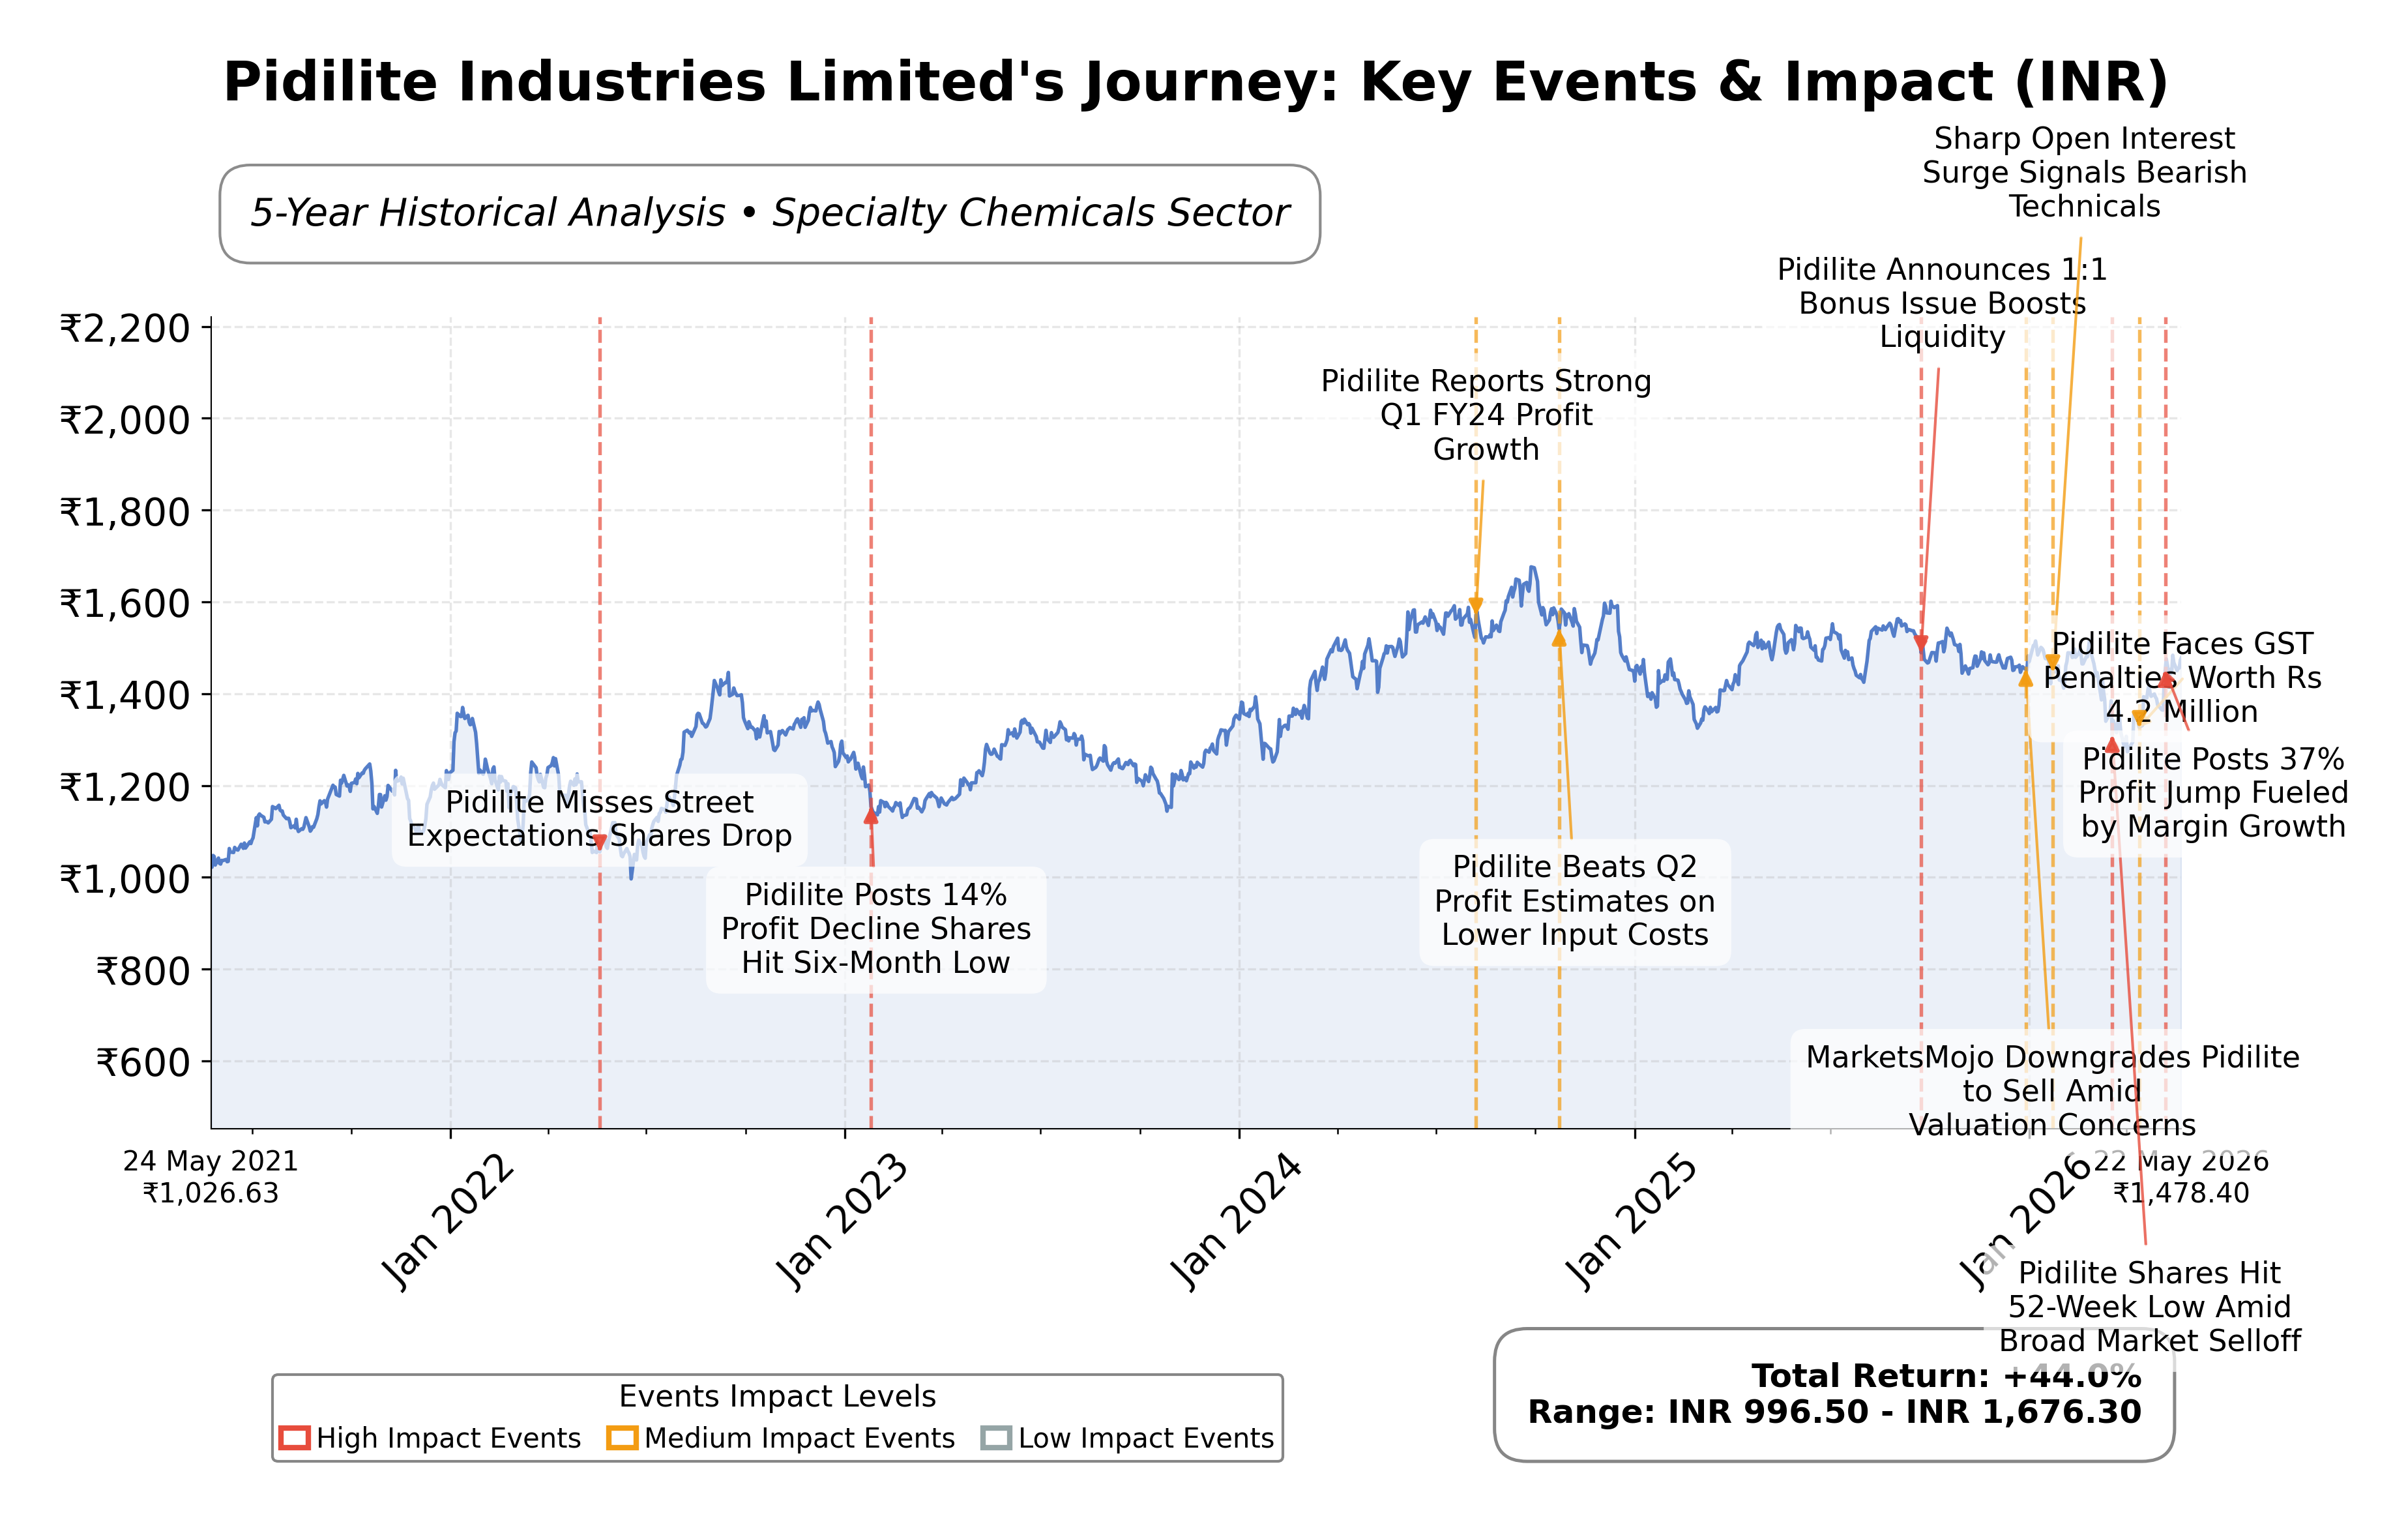
Stock Journey
Key Positives and Key Risks
Pros
- Strong profitability with a net profit margin of 16.8% and operating margin of 20.5%, indicating efficient operations.
- Robust return on equity at 23.5%, reflecting effective capital utilization and shareholder value creation.
- Healthy cash flow generation with operating cash flow of INR 28.3 billion and free cash flow of INR 18.4 billion, supporting financial stability.
Cons
- High valuation multiples with a trailing P/E of 61.46 and price-to-book ratio of 15.74, suggesting premium pricing.
- Limited geographic diversification with heavy reliance on the Indian market, exposing the company to regional risks.
- PEG ratio of 12.83 indicates market expectations of very high growth, which may be challenging to sustain.
Disclosure: This information is for general awareness and does not constitute investment advice
Report Summary
Pidilite Industries Limited is a leading specialty chemicals manufacturer based in Mumbai, India, primarily listed on the NSE exchange under the symbol PIDILITIND. The company operates in the Basic Materials sector, focusing on specialty chemicals with a strong market presence in adhesives, sealants, construction chemicals, and industrial resins. Its flagship consumer brands such as Fevicol, M-Seal, and Dr. Fixit are widely recognized across India, serving both consumer and industrial segments. Pidilite’s business model is diversified across consumer-oriented “bazaar” products and business-to-business industrial solutions, positioning it as a market leader in the Indian specialty chemicals industry.
Financially, Pidilite reported trailing twelve months (TTM) revenue of approximately INR 146 billion with a gross margin of 56.6%, operating margin of 20.5%, and net profit margin of 16.8%, indicating strong profitability and operational efficiency. The company’s return on equity (ROE) stands at 23.5%, and return on assets (ROA) at 13.3%, reflecting effective capital utilization and robust earnings generation. Operating cash flow for the TTM period was INR 28.3 billion, supporting healthy free cash flow of INR 18.4 billion, which underscores the company’s strong cash generation capabilities and financial stability.
From a valuation perspective, Pidilite trades at a trailing P/E ratio of 61.46 and a forward P/E of 48.74, with a price-to-book ratio of 15.74 and an enterprise value to EBITDA multiple of 41.91. The market capitalization is approximately INR 1.5 trillion. The stock’s 52-week range is INR 1,259 to INR 1,575, with the current price near INR 1,475, positioning it closer to its recent highs. These valuation multiples suggest the stock is priced at a premium relative to earnings and book value, consistent with its market leadership and growth profile.
Key strengths include Pidilite’s dominant market position in adhesives, strong brand equity, extensive distribution network across urban and rural India, and robust cash flow generation with low debt levels (debt-to-equity ratio of 0.038). Risks include regulatory challenges in specialty chemicals, competitive pressures from domestic and international players, and macroeconomic factors impacting construction and industrial demand. Recent strategic actions include a focus on transitioning from manufacturing scale to supply chain orchestration and value-added services, enhancing its competitive positioning amid industry transformation.
Technically, the stock shows a steady uptrend with price action above the 50-day moving average but slightly below the 200-day moving average, indicating some consolidation. Momentum indicators such as RSI and MACD reflect moderate strength without extreme overbought conditions. Recent news highlights consistent revenue growth and margin improvement, supporting a stable outlook. Overall, the data suggests a balanced environment where accumulation or maintaining exposure with careful monitoring may be appropriate given the premium valuation and steady fundamentals.
Company and Industry Overview
Company Basics
Price Performance
Company Size
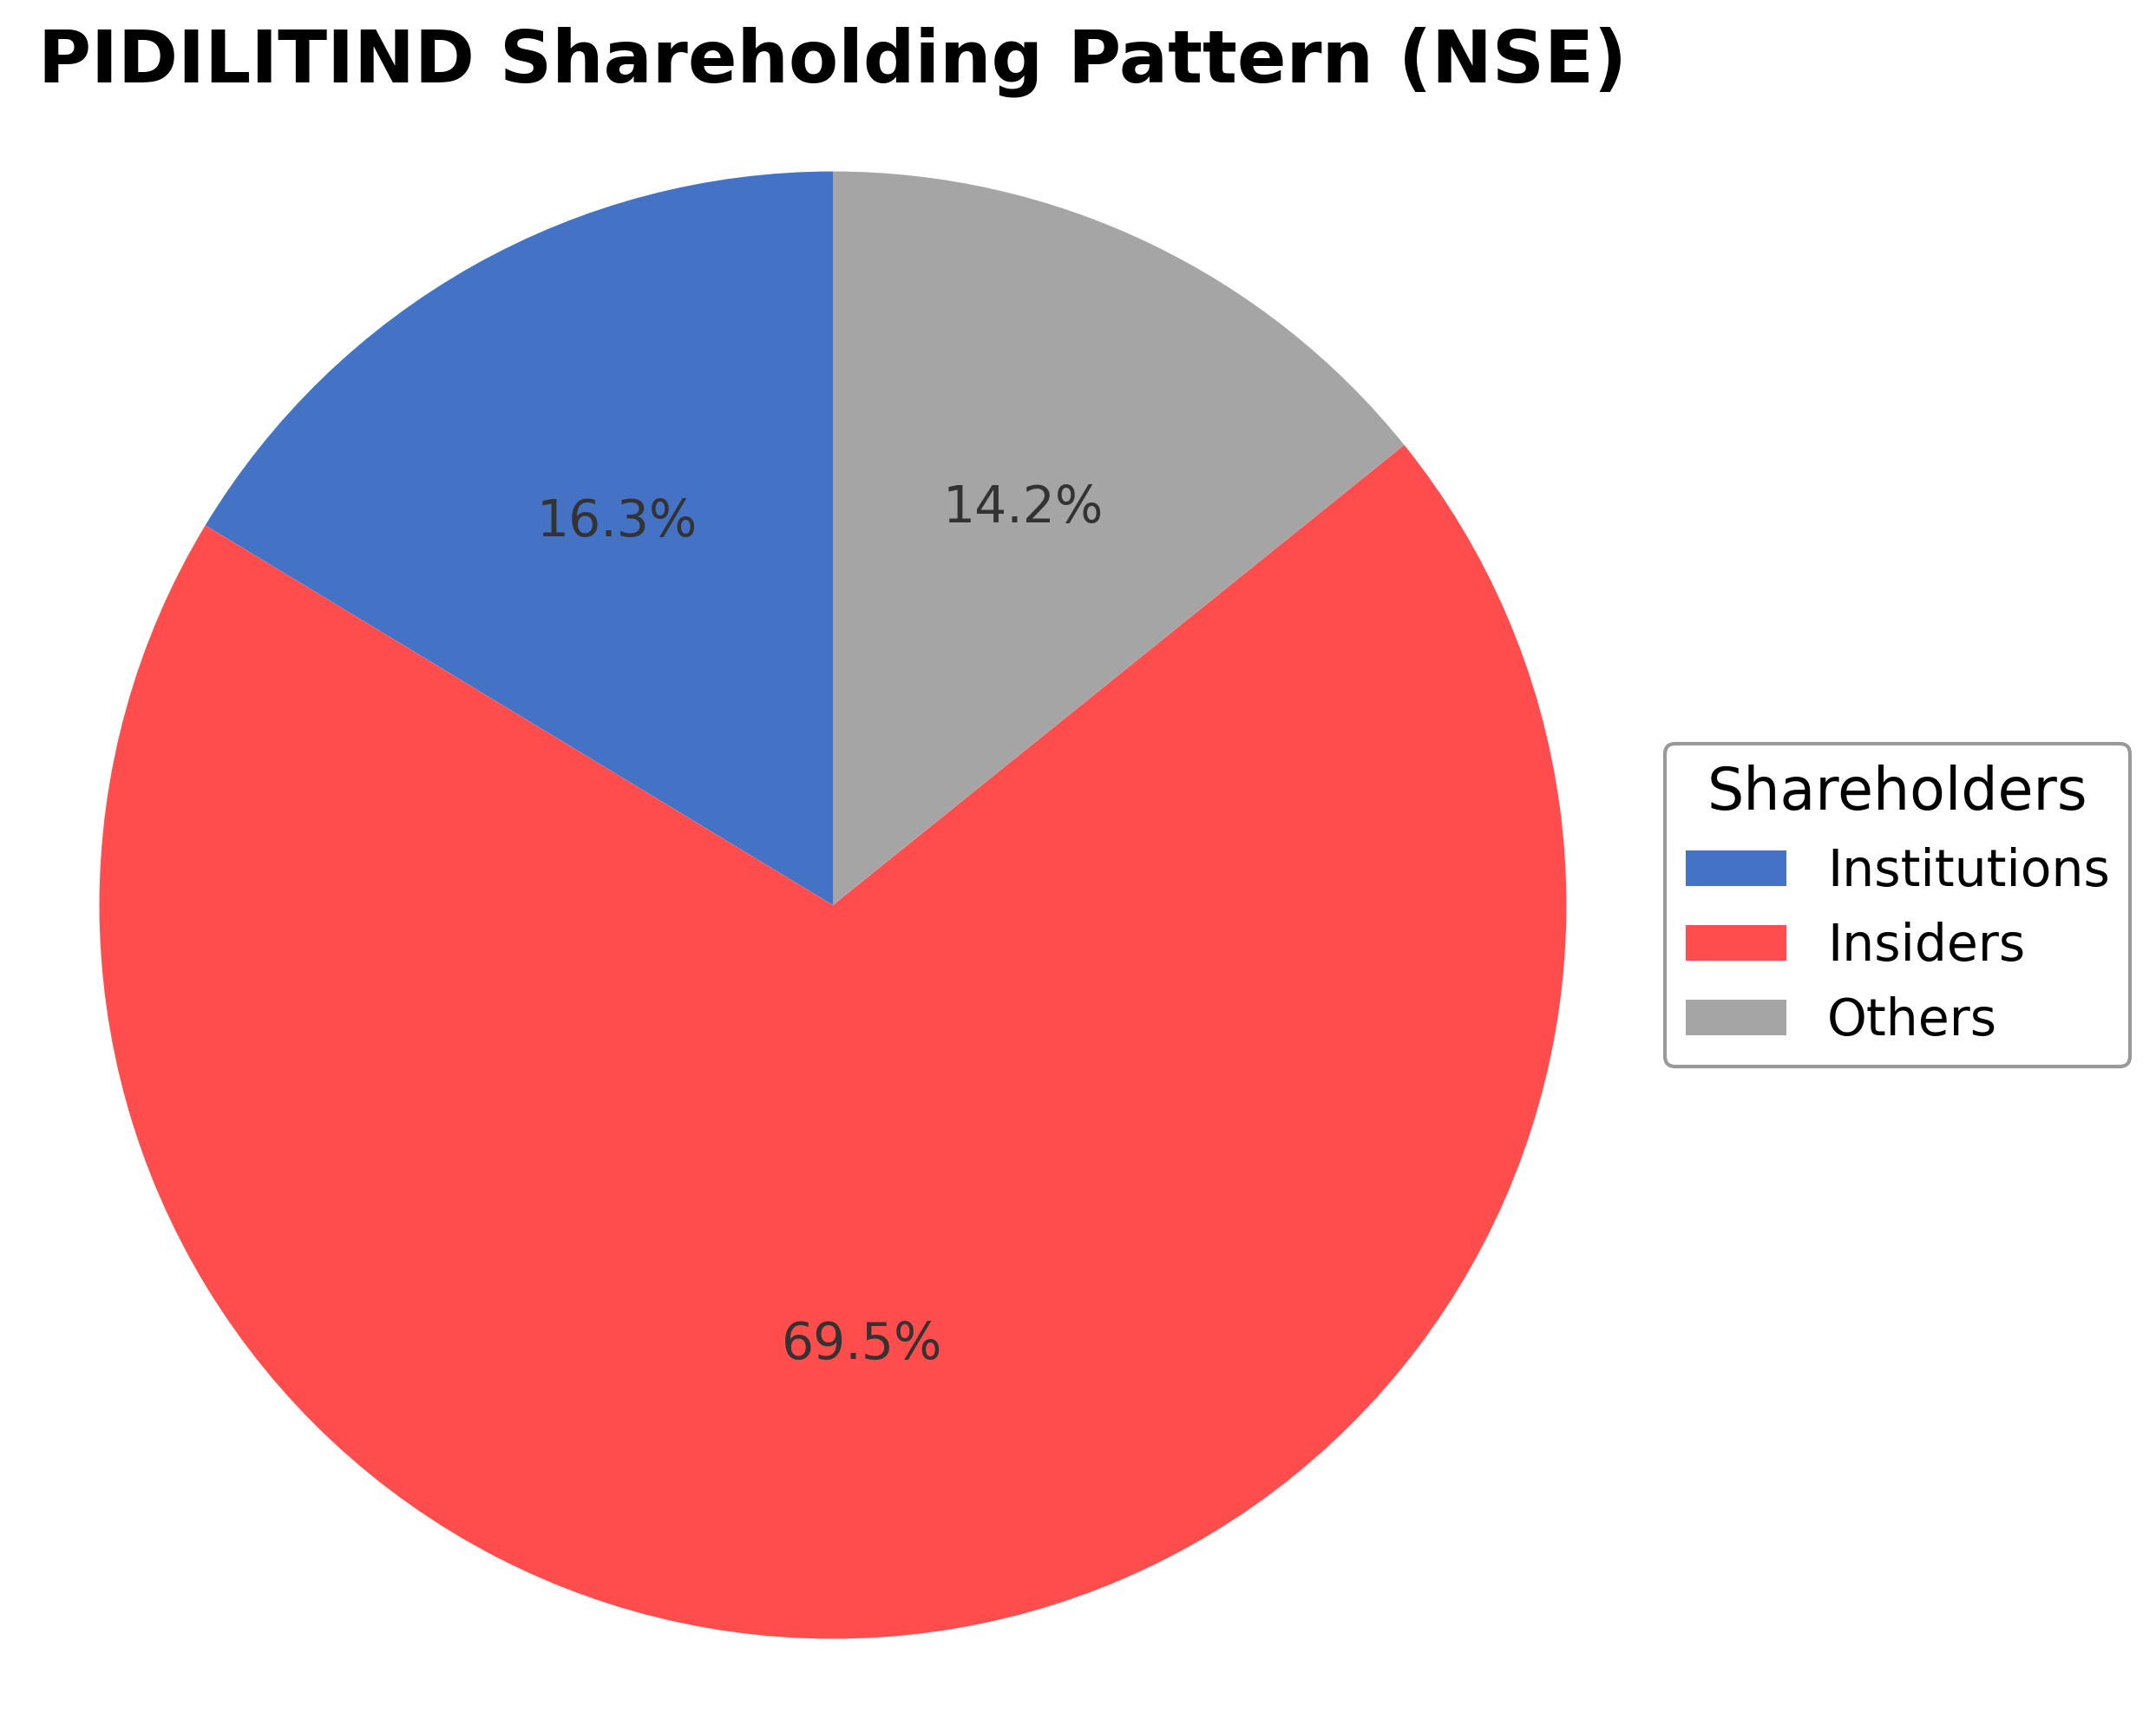
Shareholding Pattern
Sector and Industry Analysis
The Indian adhesives and construction chemicals sector, where Pidilite Industries operates, is a sizable and growing market driven by expanding construction, real estate, and industrial activities. The sector has witnessed robust revenue growth, with Pidilite reporting consolidated revenues exceeding ₹10,000 crore, reflecting strong domestic demand. Key players include Pidilite, which dominates with iconic brands, alongside other specialized firms in adhesives, pigments, and waterproofing solutions.
Industry trends highlight innovation in bonding technologies, digital integration, and sustainability initiatives shaping competitive dynamics through 2026. Pidilite’s acquisition of Huntsman Advanced Materials Solutions has strengthened its position in the epoxy adhesive segment, enhancing its product portfolio. Barriers to entry remain moderate due to the need for technological expertise, brand recognition, and distribution networks, with Pidilite leveraging a rock-solid balance sheet and strong brand equity to maintain leadership.
The regulatory environment poses risks related to macroeconomic slowdowns, input cost volatility, and evolving environmental standards impacting raw material sourcing and manufacturing processes. Indian market dynamics, including policy changes in construction and real estate sectors, significantly influence industry performance. Going forward, compliance with sustainability regulations and managing input cost pressures will be critical factors shaping sector outlook and operational strategies.
Note: Analysis synthesized from industry research, market reports, and regulatory filings. Information is subject to change based on market conditions.
Financial Ratios Dashboard
Illustrative Scenario Analysis
DCF Assumptions:
Method: Two-Stage EPS-Priority Model
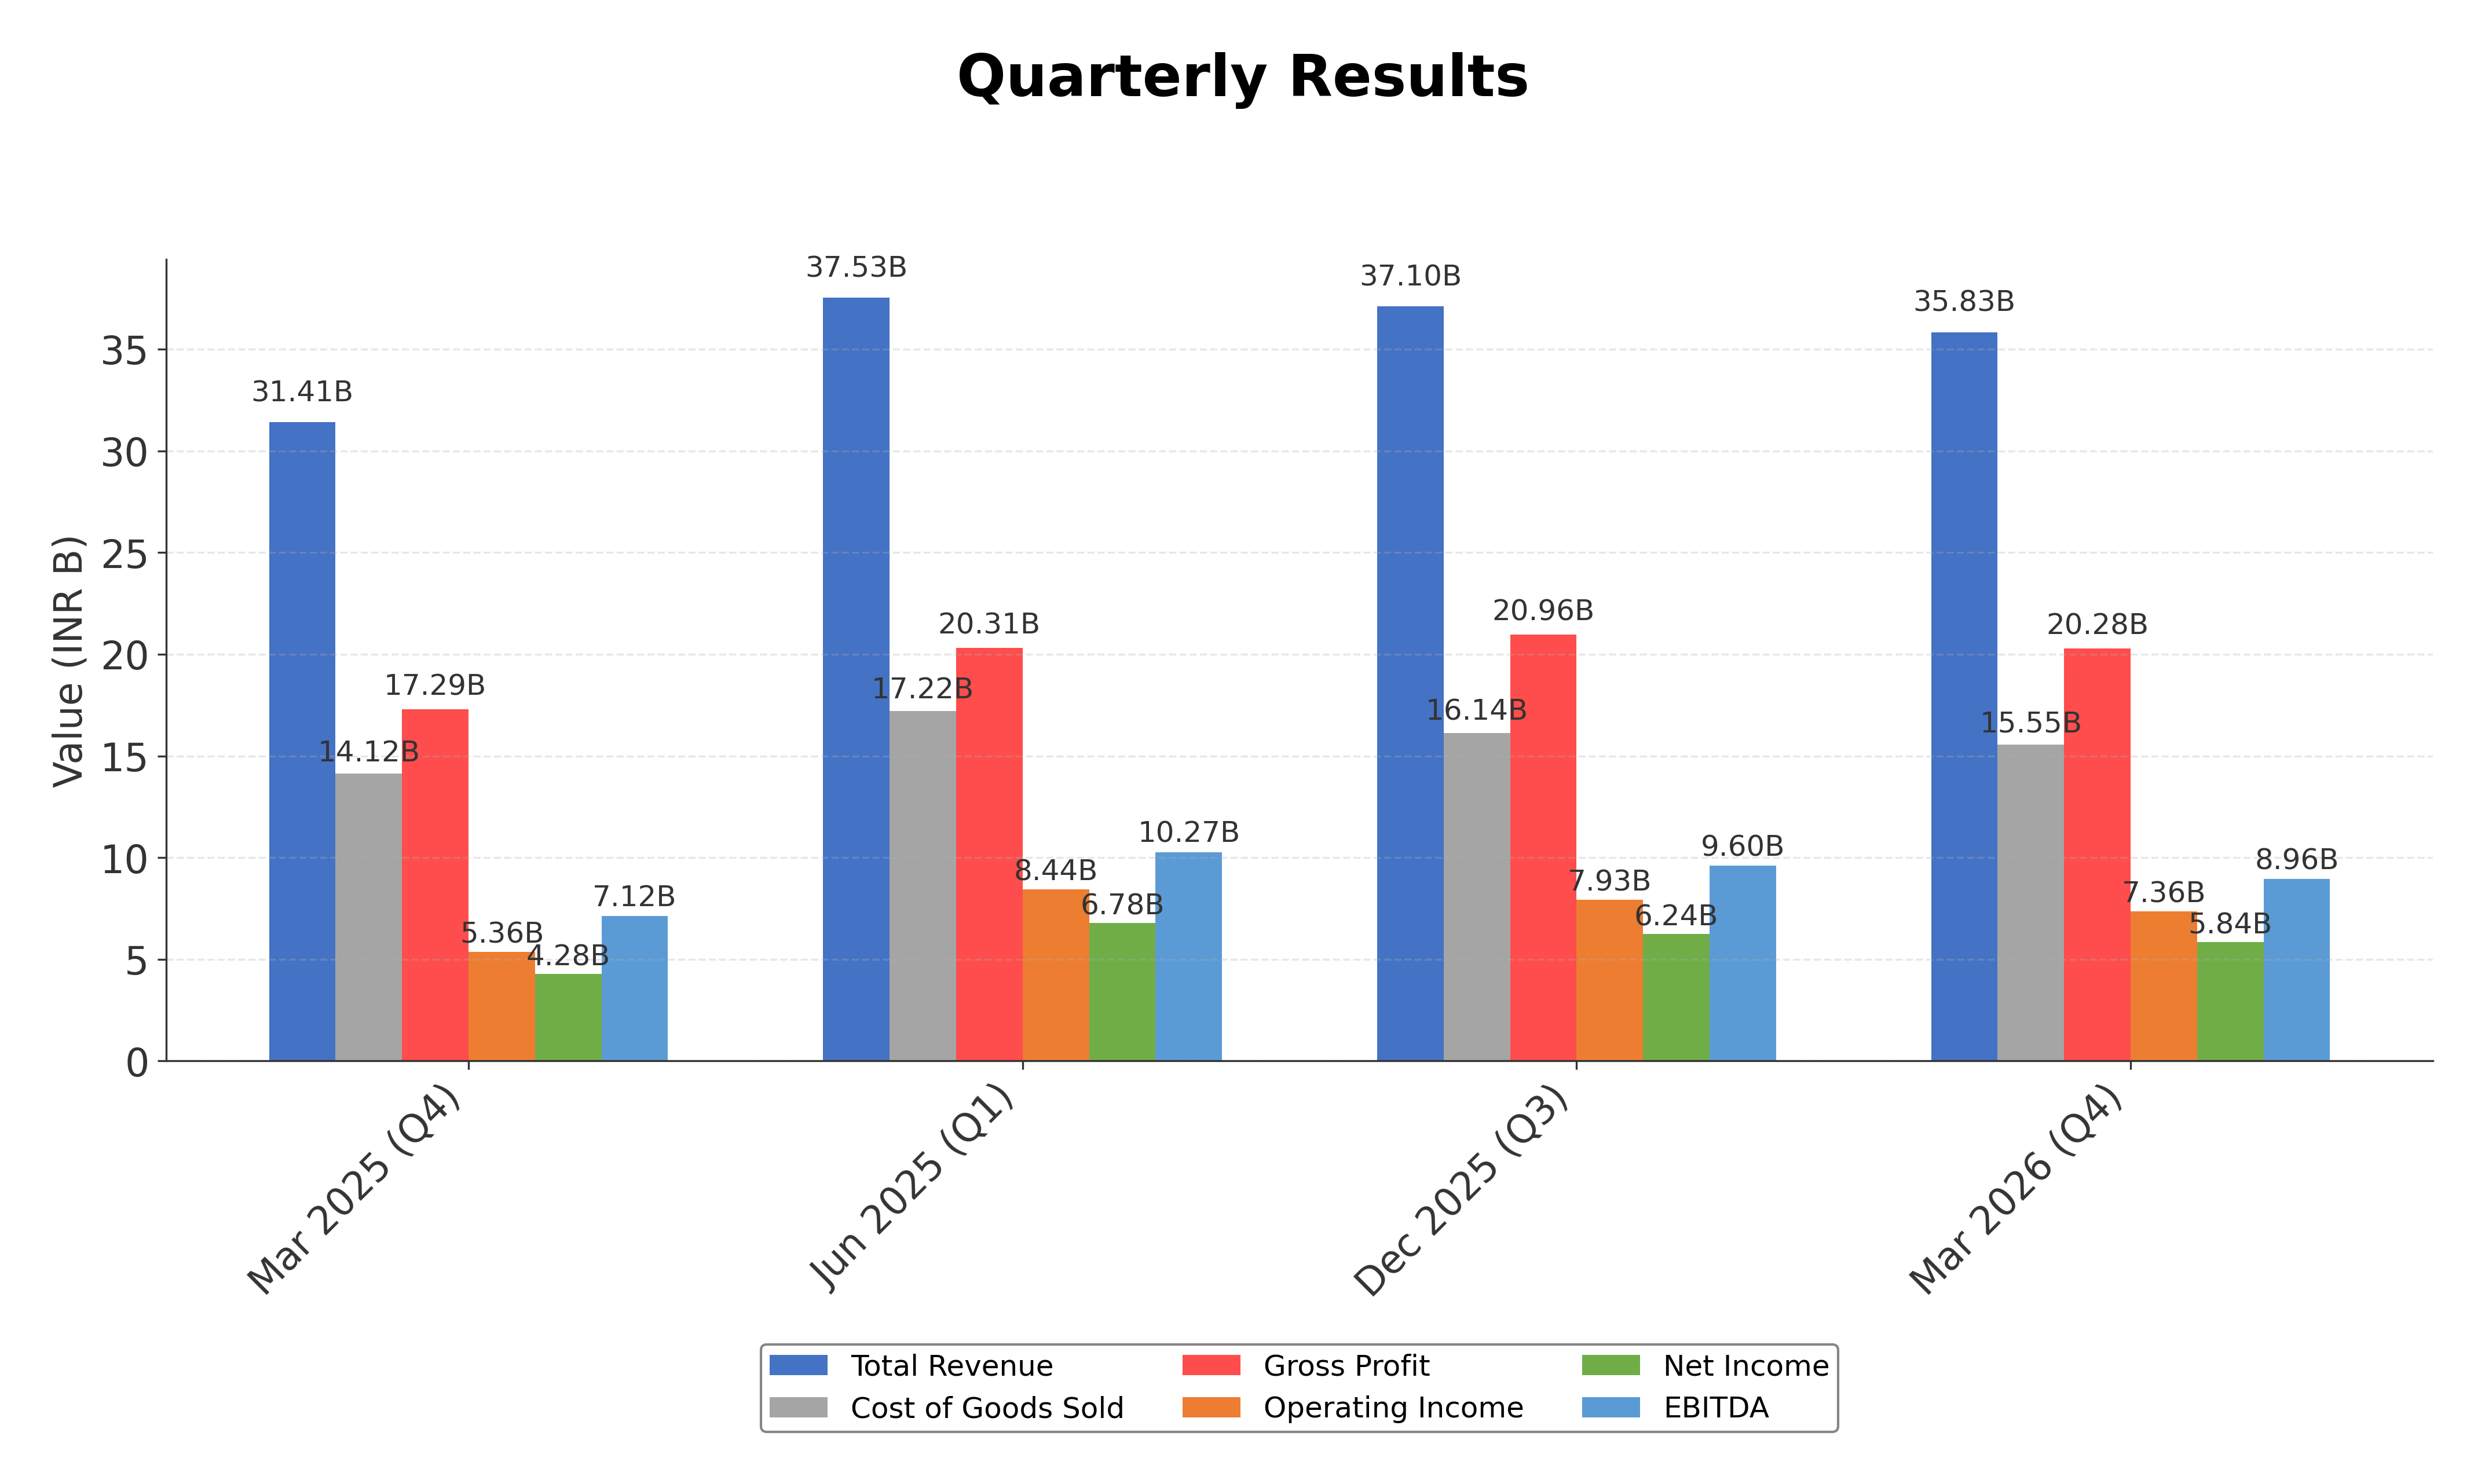
Financials
Peer Analysis
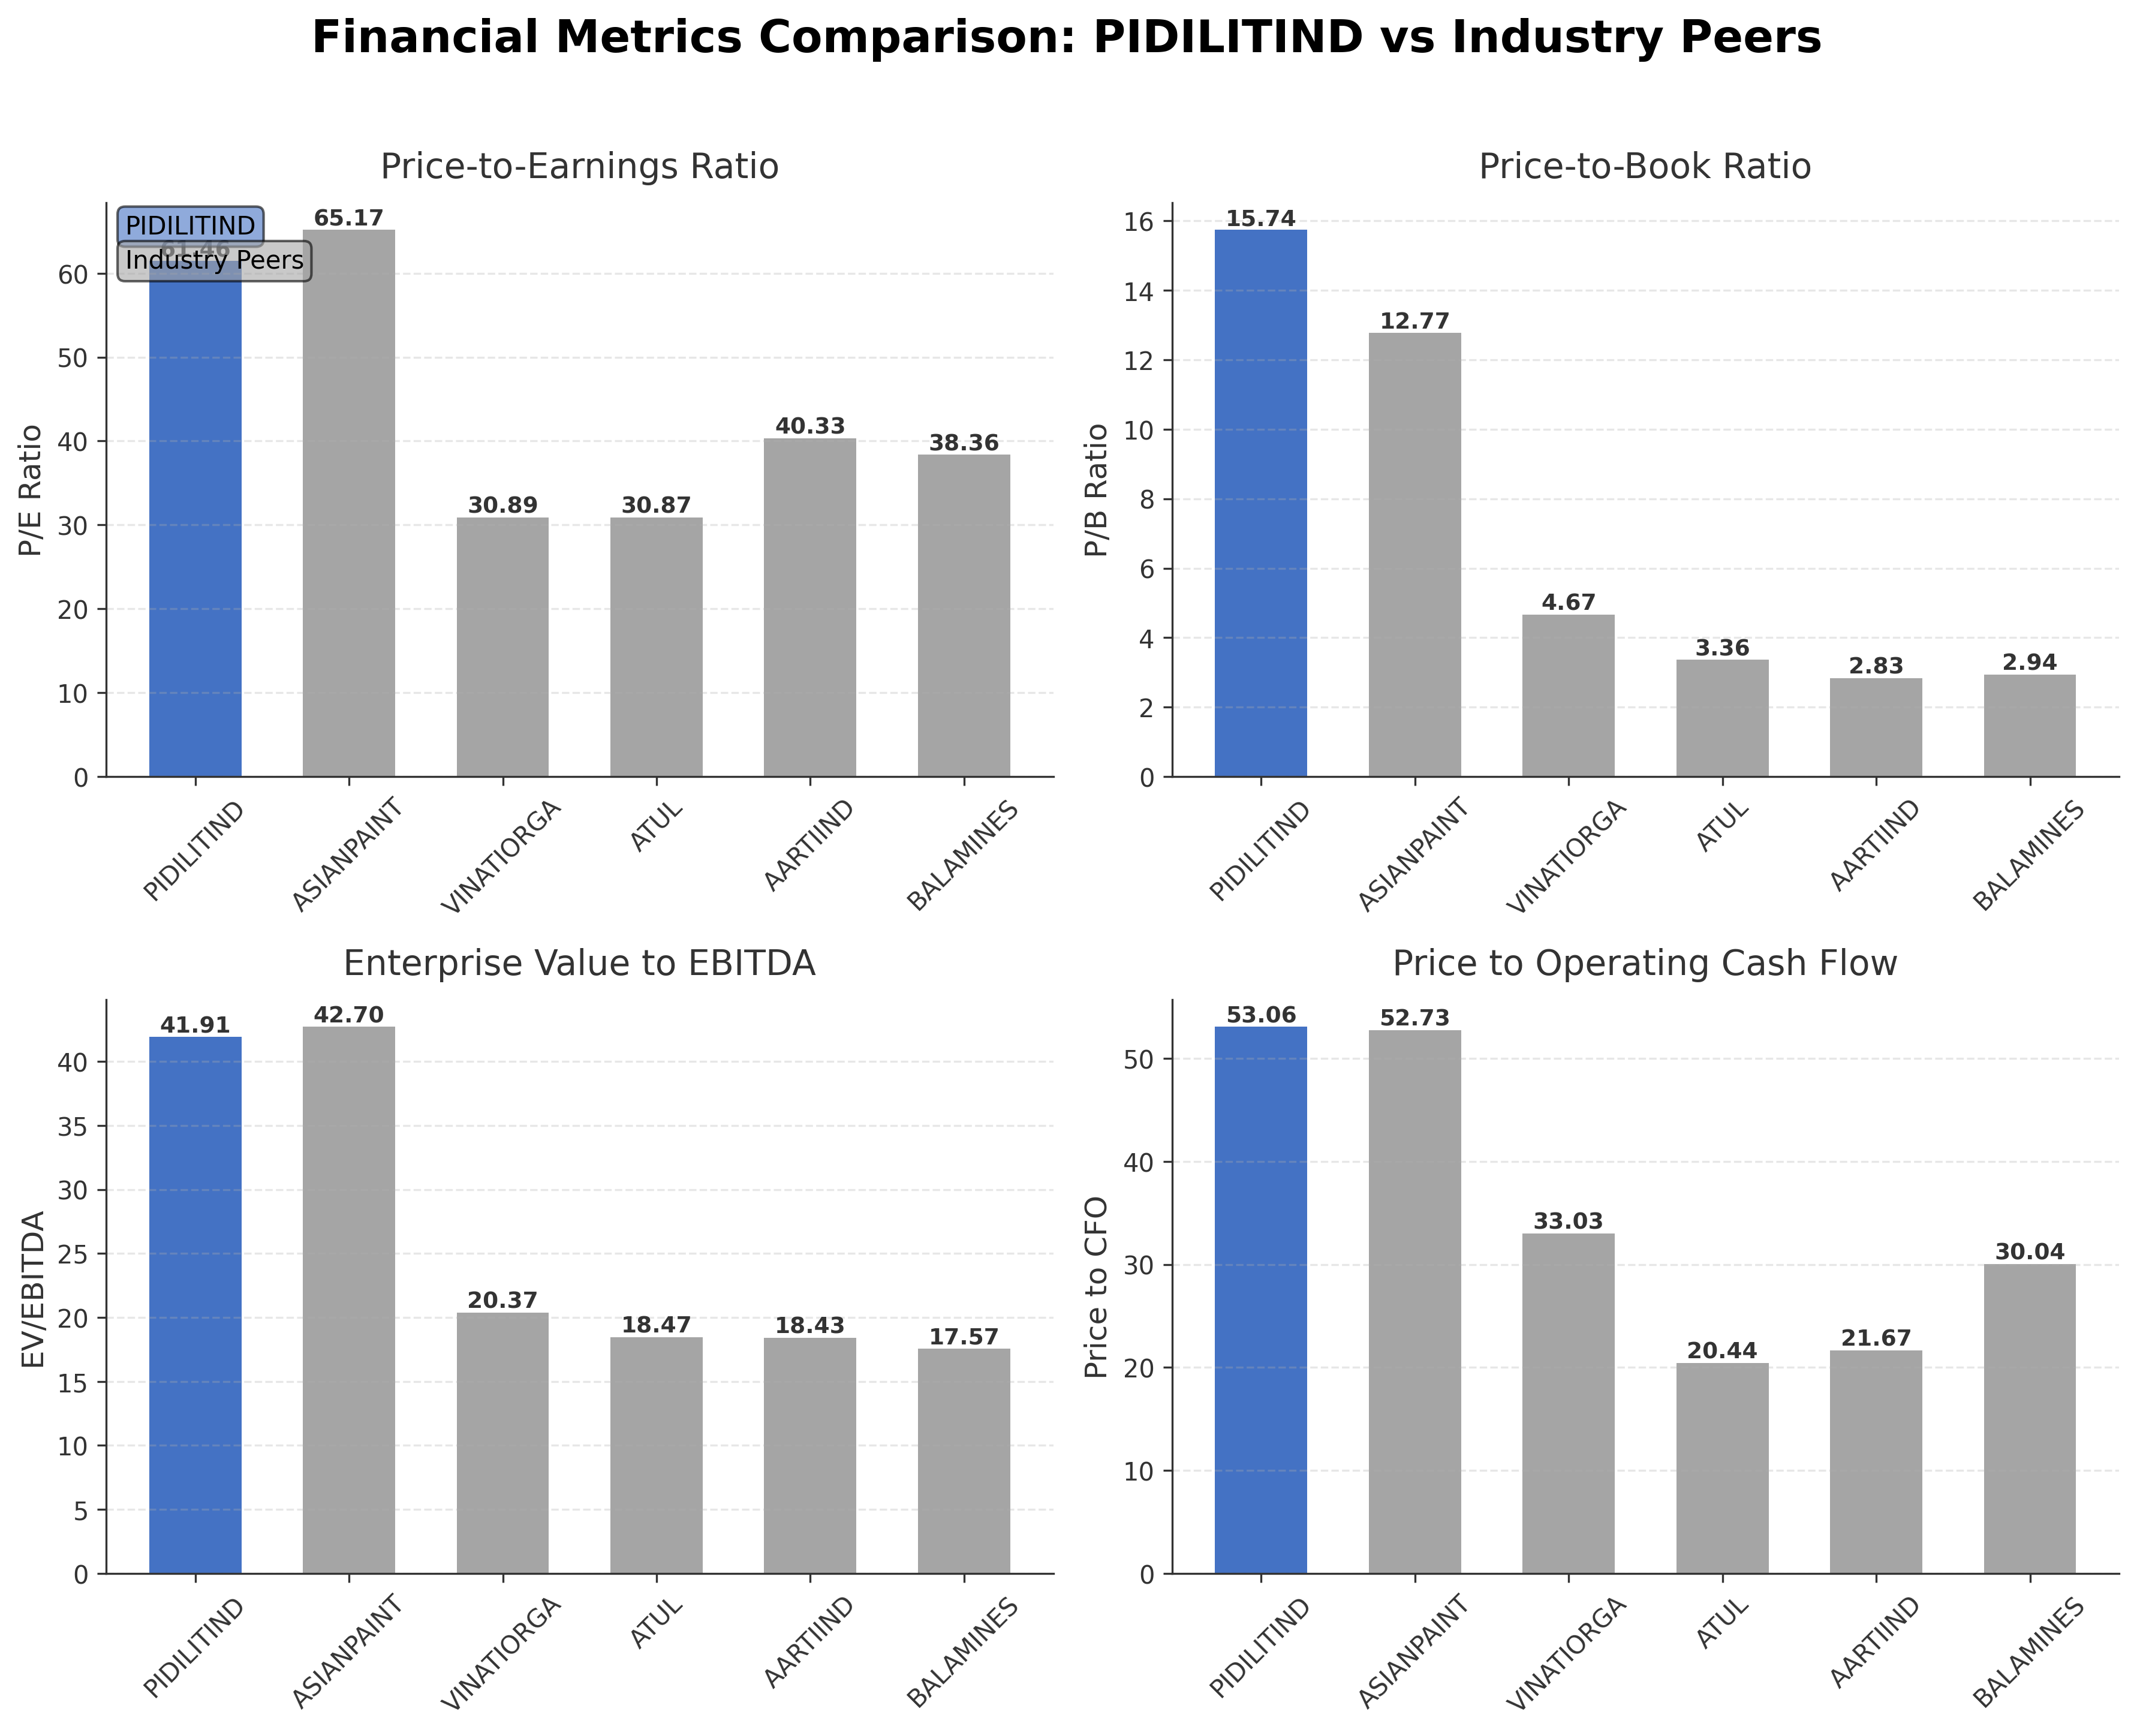
| Company Name | Market Cap | P/E Ratio | P/B Ratio | EV/EBITDA | Price to CFO |
|---|---|---|---|---|---|
| Pidilite Industries Limited | ₹1.50T | 61.46 | 15.74 | 41.91 | 53.06 |
| Asian Paints Ltd. | ₹2.50T | 65.17 | 12.77 | 42.70 | 52.73 |
| Vinati Organics Ltd. | ₹137.23B | 30.89 | 4.67 | 20.37 | 33.03 |
| Atul Ltd. | ₹209.04B | 30.87 | 3.36 | 18.47 | 20.44 |
| Aarti Industries Ltd. | ₹169.28B | 40.33 | 2.83 | 18.43 | 21.67 |
| Balaji Amines Ltd. | ₹55.28B | 38.36 | 2.94 | 17.57 | 30.04 |
Comparison Analysis: Pidilite Industries trades at a significantly higher valuation compared to its Indian specialty chemicals peers, with a P/E ratio of 61.46 versus peer averages ranging from approximately 30.87 to 65.17. Its price-to-book ratio of 15.74 is also substantially above the peer group, reflecting premium pricing likely due to strong brand equity and market leadership. The enterprise value to EBITDA multiple at 41.91 is elevated relative to peers, indicating expectations of sustained profitability. Pidilite’s return on equity of 24% is the highest among the group, demonstrating superior capital efficiency. While its price to cash flow ratio is also higher, this aligns with its robust cash generation and growth profile. Overall, Pidilite stands out as a market leader with premium valuation metrics supported by strong profitability and operational performance.
Financial Metrics Comparison with Peers
Financial Statements
Comprehensive financial data including income, balance sheet, and cash flow metrics
Income Statement
| fiscal_date | 2026-03-31 | 2025-03-31 | 2024-03-31 | 2023-03-31 | 2022-03-31 |
|---|---|---|---|---|---|
| Sales | 146.01B | 131.40B | 123.37B | 117.52B | 98.80B |
| Cost Of Goods | 64.89B | 59.96B | 60.58B | 68.16B | 54.93B |
| Gross Profit | 81.12B | 71.44B | 62.80B | 49.35B | 43.87B |
| Operating Expense Other Operating Expenses | 26.52B | 23.90B | 12.68B | 11.15B | 9.62B |
| Operating Income | 31.24B | 26.54B | 24.03B | 17.52B | 16.45B |
| Non Operating Interest Expense | 542.20M | 503.50M | 511.90M | 476.40M | 420.80M |
| Pretax Income | 33.20B | 28.23B | 23.79B | 17.23B | 16.14B |
| Income Tax | 8.49B | 7.27B | 6.32B | 4.34B | 4.07B |
| Net Income | 24.71B | 20.96B | 17.47B | 12.89B | 12.07B |
| Eps Basic | 24.07 | 20.41 | 34.01 | 25.05 | 23.76 |
| Eps Diluted | 24.01 | 20.36 | 33.98 | 25.03 | 23.75 |
| Basic Shares Outstanding | 1.02B | 1.02B | 508.49M | 508.30M | 508.16M |
| Diluted Shares Outstanding | 1.02B | 1.02B | 508.49M | 508.30M | 508.16M |
| Ebit | 33.74B | 28.73B | 24.31B | 17.71B | 16.56B |
| Ebitda | 37.83B | 32.56B | 27.54B | 20.21B | 18.96B |
| Net Income Continuous Operations | 33.20B | 28.23B | 23.79B | 17.23B | 16.14B |
| Minority Interests | -218.00M | -199.30M | -180.40M | -156.20M | 8.00M |
| Preferred Stock Dividends | 0.00 | 0.00 | 0.00 | 0.00 | 0.00 |
| Operating Expense Selling General And Administrative | N/A | 6.42B | 6.25B | 4.04B | 2.98B |
| Non Operating Interest Income | N/A | 154.50M | 121.00M | 76.30M | 45.80M |
Source: Financial statements and regulatory filings
Balance Sheet
| fiscal_date | 2026-03-31 | 2025-03-31 | 2024-03-31 | 2023-03-31 | 2022-03-31 |
|---|---|---|---|---|---|
| Cash And Cash Equivalents | 2.32B | 3.24B | 5.15B | 3.10B | 3.52B |
| Accounts Receivable | 21.81B | 18.35B | 16.87B | 15.51B | 14.45B |
| Total Assets | 154.33B | 140.11B | 121.04B | 105.25B | 95.16B |
| Total Liabilities | 43.84B | 40.54B | 34.87B | 30.79B | 29.13B |
| Long Term Debt | 2.19B | 2.20B | 1.94B | 1.76B | 977.60M |
| Shareholders Equity | 110.49B | 99.58B | 86.17B | 74.46B | 66.03B |
Source: Financial statements and regulatory filings
Cash Flow Statement
| fiscal_date | 2026-03-31 | 2025-03-31 | 2024-03-31 | 2023-03-31 | 2022-03-31 |
|---|---|---|---|---|---|
| Operating Activities Net Income | 33.20B | 28.23B | 23.79B | 17.23B | 16.14B |
| Operating Activities Stock Based Compensation | 1.31B | 889.10M | 90.70M | 141.30M | 280.90M |
| Operating Activities Other Non Cash Items | 309.90M | 349.00M | 1.11B | 400.10M | 375.00M |
| Operating Activities Accounts Receivable | -3.68B | -1.65B | -1.53B | -950.00M | -1.23B |
| Operating Activities Other Assets Liabilities | 1.86B | -2.74B | 6.25B | -151.20M | -4.63B |
| Operating Activities Operating Cash Flow | 33.00B | 25.07B | 29.70B | 16.67B | 10.93B |
| Investing Activities Capital Expenditures | -5.89B | -4.48B | -5.53B | -4.98B | -3.74B |
| Investing Activities Net Acquisitions | -451.90M | -130.00M | 670.80M | 0.00 | -2.62B |
| Investing Activities Purchase Of Investments | -64.40B | -45.10B | -27.10B | -18.55B | -1.01B |
| Investing Activities Sale Of Investments | 58.32B | 34.22B | 14.21B | 14.48B | 1.73B |
| Investing Activities Investing Cash Flow | -12.42B | -15.51B | -17.74B | -9.05B | -5.64B |
| Financing Activities Short Term Debt Issuance | -182.40M | 349.60M | -129.50M | -775.60M | 1.03B |
| Financing Activities Common Stock Issuance | 7.10M | 15.90M | 300.00K | 0.00 | 100.00K |
| Financing Activities Common Dividends | -15.26B | -8.13B | -5.60B | -5.08B | -4.32B |
| Financing Activities Other Financing Charges | -92.00M | -270.40M | -509.10M | 161.40M | -388.60M |
| Financing Activities Financing Cash Flow | -15.53B | -8.04B | -6.24B | -5.73B | -3.86B |
| End Cash Position | 2.18B | 2.87B | 4.59B | 2.59B | 2.56B |
| Free Cash Flow | 22.36B | 18.34B | 21.65B | 10.52B | 5.81B |
| Investing Activities Other Investing Activity | N/A | -13.90M | 3.60M | 500.00K | -1.20M |
| Financing Activities Long Term Debt Payments | N/A | N/A | 0.00 | -29.70M | -181.30M |
Source: Financial statements and regulatory filings
Technical Analysis
Key Insights
- The current trend shows a steady upward price movement with consolidation near the INR 1,475 level, indicating moderate bullish momentum.
- Key support levels are identified near INR 1,368 (50-day moving average) and INR 1,260 (52-week low), while resistance is observed around INR 1,575 (52-week high).
- The stock price is trading above the 50-day moving average but slightly below the 200-day moving average at INR 1,460, suggesting a potential transitional phase in trend direction.
- Momentum indicators such as RSI are in a neutral to moderately strong range, MACD shows positive crossover signals, and Stochastic oscillators indicate no extreme overbought or oversold conditions.
- Multi-timeframe analysis reveals consistent strength on daily and weekly charts, with monthly charts showing gradual upward momentum supporting medium-term stability.
- Potential market scenarios include continuation of the current uptrend if the price sustains above the 50-day moving average or a pullback towards support levels if broader market pressures emerge.
Trending News
Summary: Thomson Reuters proprietary rating of stock on scale of 1 to 10 · Industry ranking and detailed sector analysis of recent happening in sector · Analyst rating like Buy/Sell/Hold with Earnings estimates with 1 year price target ... No Data For Bulk Deals. *A bulk deal is a trade where total quantity of shares bought or sold is more than 0.5% of the equity shares of a company listed on the exchange. ... Pidilite Industries Limited has informed the Exchange about Copy of Newspaper ...
Sentiment: neutral
2. Headline: Pidilite files presentation; market cap hits ₹1,48,000 crore
Summary: Pidilite Industries Records Rs. 76.58 Crore Block Trade on NSE Apr 16, 2026 ... Gaudium IVF and Women Health Limited Schedules Board Meeting for Q3FY26 Results on March 18, 2026 Mar 12, 2026 ... Power & Instrumentation Completes Major Warrant Conversion with 5.44 Lakh Share Allotment Mar 18, 2026 ... We’re building Scanx - to help you express your trading & investing idea, to help you analyse the markets better. Stock ...
Sentiment: neutral
3. Headline: Pidilite Industries Strategic Roadmap for Consistent Profitable Growth | InvestyWise
Summary: Pidilite Industries has unveiled a strategic roadmap focusing on consistent profitable growth through its portfolio approach. By leveraging…
Sentiment: positive
Summary: As you might know, PI Industries Limited ( NSE:PIIND ) last week released its latest yearly, and things did not turn...
Sentiment: negative
5. Headline: Pidilite's Boom Isn't Fully Sticking Yet | MarketScreener
Summary: India's building boom makes the growth story look simple on the surface. Roads are being built, homes are selling again, and construction activity is picking up. For Indian adhesives manufacturing...
Sentiment: positive
Recent Updates
News Summary
As of 2026-05-16. Pidilite Industries Ltd reported strong Q4 FY26 results with consolidated net sales increasing 14.08% year-over-year to Rs 3,583.38 crore and annual revenue rising 11.1% to Rs 14,600.83 crore. The company proposed a dividend of Rs 11.50 per share, reflecting robust cash flow and profitability. The business continues to benefit from strong demand in adhesives, construction chemicals, and specialty products, supported by India's infrastructure growth. Pidilite is also adapting to industry shifts by transitioning from manufacturing scale to supply chain orchestration and value-added services, enhancing its competitive positioning. These developments underscore steady revenue growth, margin improvement, and strategic focus on sustainable profitable expansion.
News Sentiment
The overall sentiment from recent updates is predominantly positive, driven by strong quarterly revenue growth, margin resilience, and strategic initiatives to pivot the business model toward higher value-added services. Dividend announcements and steady cash flow generation contribute to a favorable financial outlook. Neutral tones appear in earnings release reports, reflecting stable performance without unexpected surprises. The positive sentiment is tempered slightly by the need to monitor competitive pressures and evolving industry dynamics, but the company’s leadership position and innovation efforts support a constructive medium-term outlook.
Source List
Analytical Overview
Analysis Summary
Pidilite Industries’ valuation metrics, including a trailing P/E of 61.46 and forward P/E of 48.74, are significantly higher than the industry average P/E of approximately 61.46, reflecting premium pricing consistent with its market leadership and growth prospects. The company’s revenue growth rate of 14.1% quarterly and 11.1% annually, coupled with strong operating cash flow trends, indicates a solid growth trajectory supported by expanding demand in adhesives and construction chemicals. Financial health is robust, with a low debt-to-equity ratio of 0.038 and strong free cash flow generation of INR 18.4 billion, underscoring prudent capital management and liquidity. Sector-specific opportunities include India’s infrastructure development and urbanization trends, which drive demand for specialty chemicals, while challenges include regulatory compliance and competitive pressures. Given the Indian market context, Pidilite benefits from favorable consumer trends, government initiatives like Make in India, and a growing middle class, which support sustained demand for its products.
Overall Business and Market Assessment
Supporting Factors: Pidilite’s dominant market position in adhesives, consistent revenue and margin growth, and strong cash flow generation with low leverage
Risk Factors: regulatory changes impacting specialty chemicals, competitive dynamics from both domestic and international players, and potential macroeconomic headwinds affecting construction activity
SWOT Analysis
Strengths
- Market leader in adhesives with strong brand recognition across India.
- Robust profitability with gross margin above 56% and operating margin over 20%.
- Strong cash flow generation and low debt-to-equity ratio of 0.038.
- Extensive distribution network covering urban and rural markets.
Weaknesses
- High valuation multiples with P/E above 60 and price-to-book over 15.
- Heavy reliance on the Indian market with limited geographic diversification.
- Relatively low dividend payout ratio of 41.65%, limiting income for investors.
- PEG ratio of 12.83 indicates high growth expectations priced in.
Opportunities
- Growing demand from India’s infrastructure and construction sectors.
- Expansion into value-added specialty chemicals and supply chain orchestration.
- Increasing urbanization and rising middle-class consumption in India.
- Potential for innovation-driven product launches leveraging strong R&D.
Threats
- Regulatory risks related to chemical manufacturing and environmental compliance.
- Intense competition from domestic and global specialty chemical companies.
- Macroeconomic volatility impacting construction and industrial demand.
- Raw material price fluctuations affecting input costs and margins.
Company Description
Pidilite Industries Limited is a leading specialty chemicals manufacturer based in Mumbai, renowned for its adhesive and sealant products. Its primary purpose is to develop and supply innovative solutions for both consumer and industrial applications, with flagship brands like Fevicol, M-Seal, Fevikwik, and Dr. Fixit widely recognized across India and abroad. The company operates across key segments including adhesives and sealants, construction chemicals, art and craft materials, industrial resins, and pigment preparations, serving diverse sectors such as construction, retail, automotive, leather, textiles, and education. Pidilite’s business model is split between consumer-oriented “bazaar” products, which account for the majority of revenues, and business-to-business products for industrial clients. The company is noted for its robust in-house research and development, enabling it to launch specialized products like heat-reducing coatings and maintain high brand trust. As India’s market leader in adhesives, Pidilite plays a pivotal role in driving innovation and best practices in the specialty chemicals sector, supporting infrastructure development, DIY culture, and industrial manufacturing throughout the region.