


Petronet LNG Ltd (PETRONET)
Stock Analysis Report
Stock Journey
Key Positives and Key Risks
Pros
- Return on equity of 18.56% demonstrates strong profitability and efficient capital use.
- Current ratio of 5.67 and cash reserves of ₹101 billion indicate robust liquidity and financial stability.
- Valuation metrics including a trailing P/E of 10.70 and EV/EBITDA of 6.38 suggest reasonable pricing relative to earnings and enterprise value.
Cons
- Quarterly revenue declined by 23.3%, signaling potential short-term operational headwinds.
- Supply disruptions due to geopolitical tensions have impacted LNG imports, creating uncertainty in earnings.
- Price-to-book ratio of 1.88 is higher than some peers, which may imply a premium valuation.
Disclosure: This information is for general awareness and does not constitute investment advice
Report Summary
Petronet LNG Ltd. is a prominent player in India's energy sector, specializing in the import and regasification of liquefied natural gas (LNG). Listed on the NSE under the energy sector, the company operates key LNG terminals in Dahej and Kochi, serving as a critical link in India's energy supply chain. Petronet LNG is strategically positioned within the Oil & Gas Refining & Marketing industry, collaborating with global energy firms to secure LNG supplies that support industrial and residential demand across India.
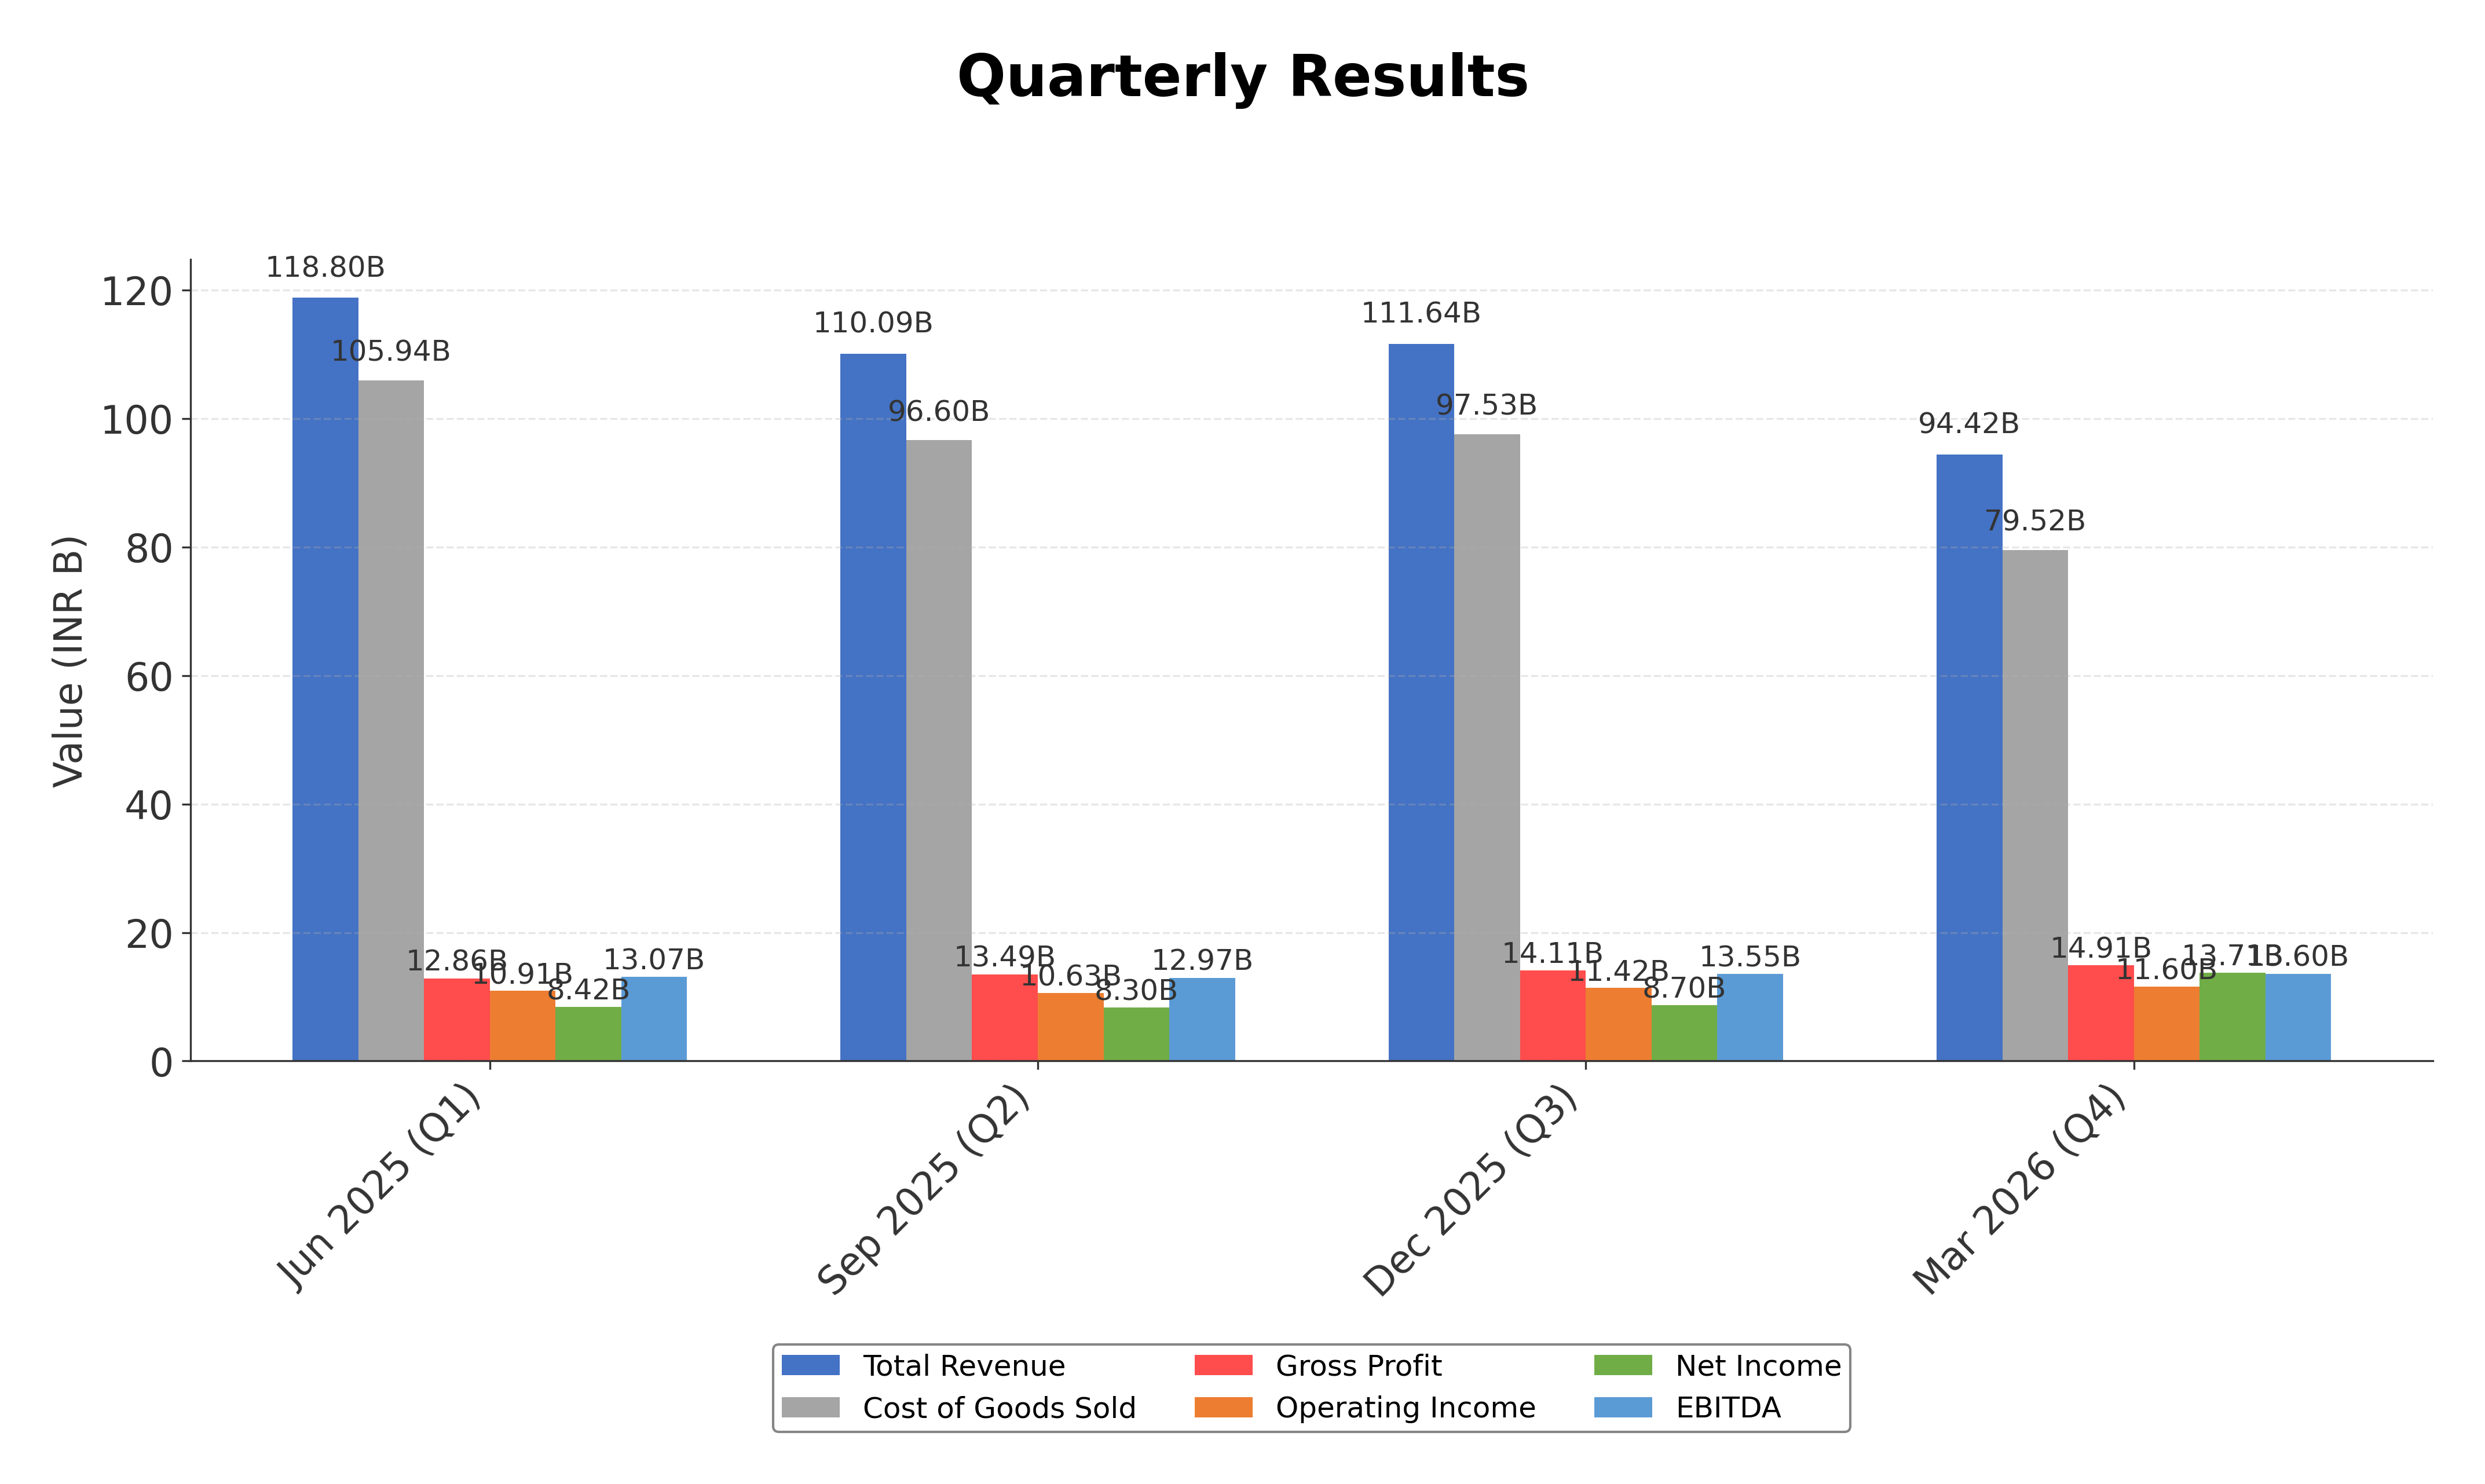
Financially, Petronet LNG reported trailing twelve-month revenue of approximately ₹435 billion with a gross margin of 15.79%, operating margin of 17.54%, and net profit margin near 9%. The company’s return on equity (ROE) stands at 18.56%, return on assets (ROA) at 10.27%, and return on invested capital (ROIC) reflects efficient capital deployment. These metrics indicate solid profitability and operational efficiency despite a recent quarterly revenue decline of 23.3%.
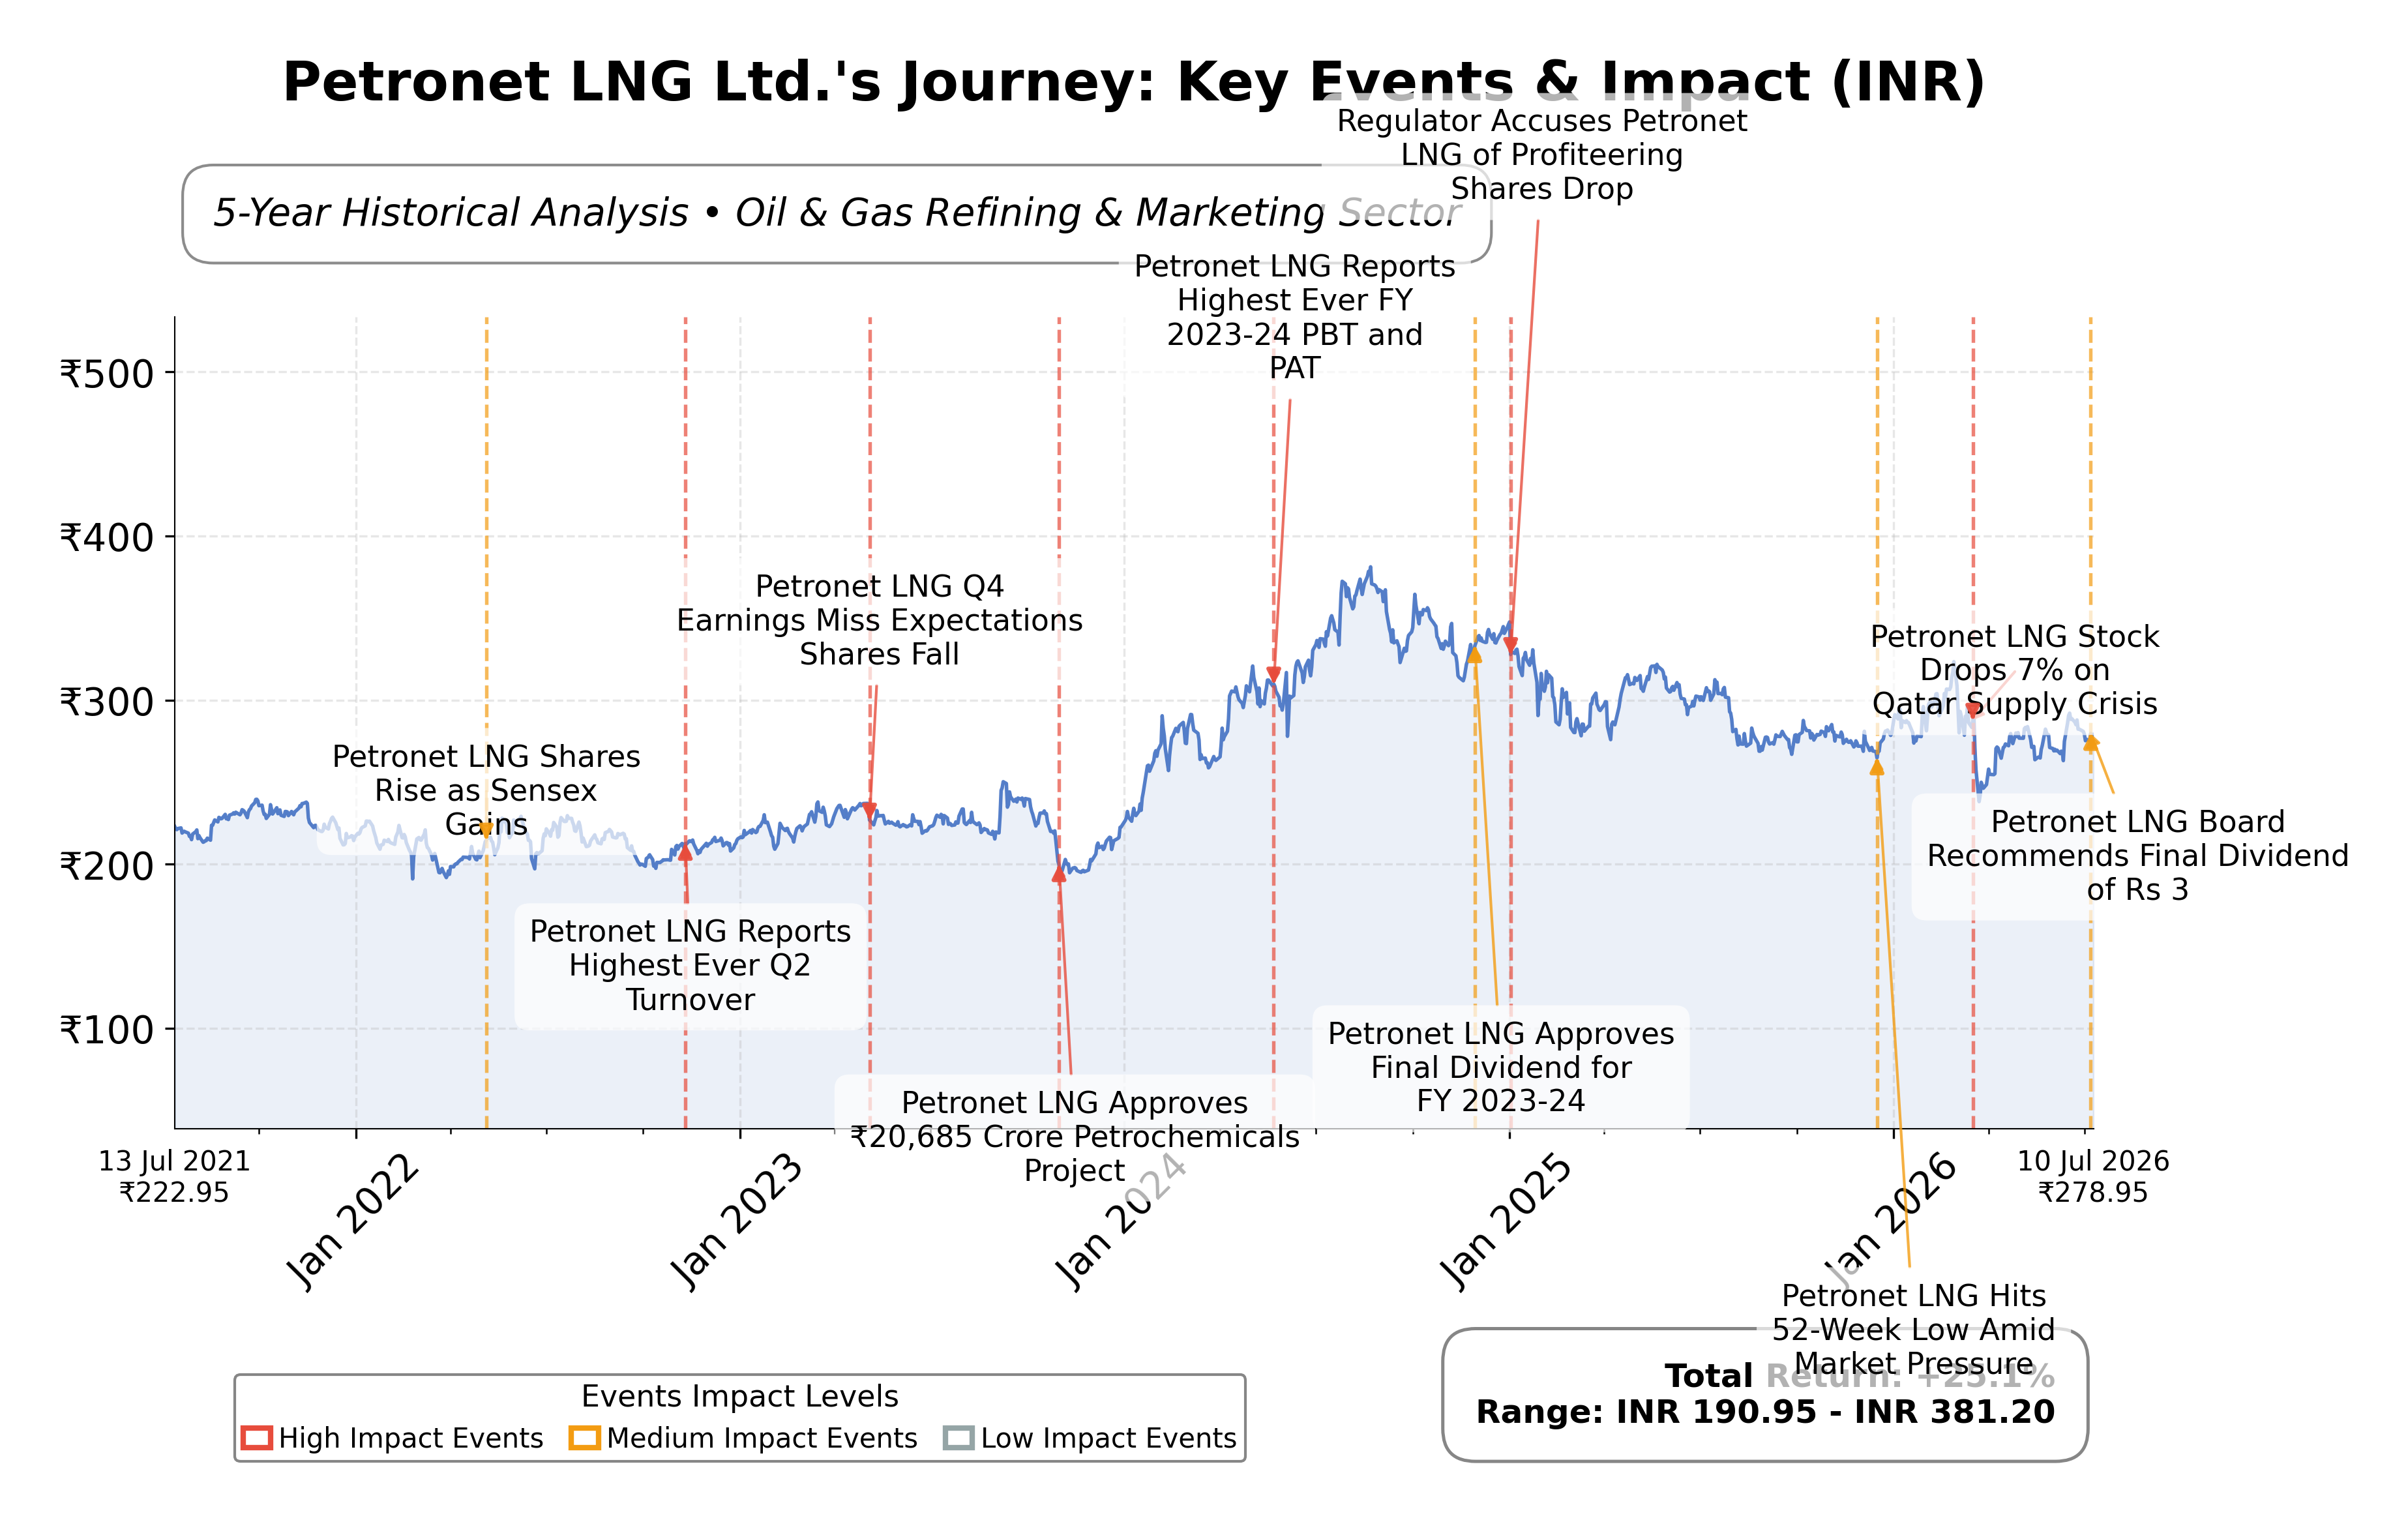
Valuation metrics show a trailing price-to-earnings (P/E) ratio of 10.70 and a forward P/E of 9.89, with a price-to-book (P/B) ratio of 1.88 and an enterprise value to EBITDA (EV/EBITDA) of 6.38. The market capitalization is approximately ₹418 billion. The stock price currently trades at ₹278.95, within a 52-week range of ₹326.40 (high) to ₹235.35 (low), reflecting an 8.9% decline over the past year. These ratios suggest the stock is reasonably valued relative to its fundamentals and industry peers.
Petronet LNG’s strengths include strong cash reserves exceeding ₹101 billion, a low debt-to-equity ratio of 0.11, and a high current ratio of 5.67, indicating robust liquidity. The company benefits from market leadership in LNG regasification and strategic long-term supply agreements, notably with QatarEnergy. Risks include supply disruptions from geopolitical tensions affecting LNG imports, regulatory challenges, and competitive pressures in the energy sector. Recent strategic actions include diversification of LNG sourcing and confirmation of no encumbrances on Indian Oil’s stake, supporting ownership stability.
Technically, the stock is trading near its 50-day and 200-day moving averages, with momentum indicators reflecting mixed signals across daily and weekly timeframes. Recent news highlights supply disruptions impacting earnings but also positive developments such as Qatar’s plan to restore LNG production. Overall, market conditions suggest a balanced outlook, warranting a watchful stance as the company navigates supply uncertainties and evolving energy market dynamics.
Company and Industry Overview
Company Basics
Price Performance
Company Size
Shareholding Pattern
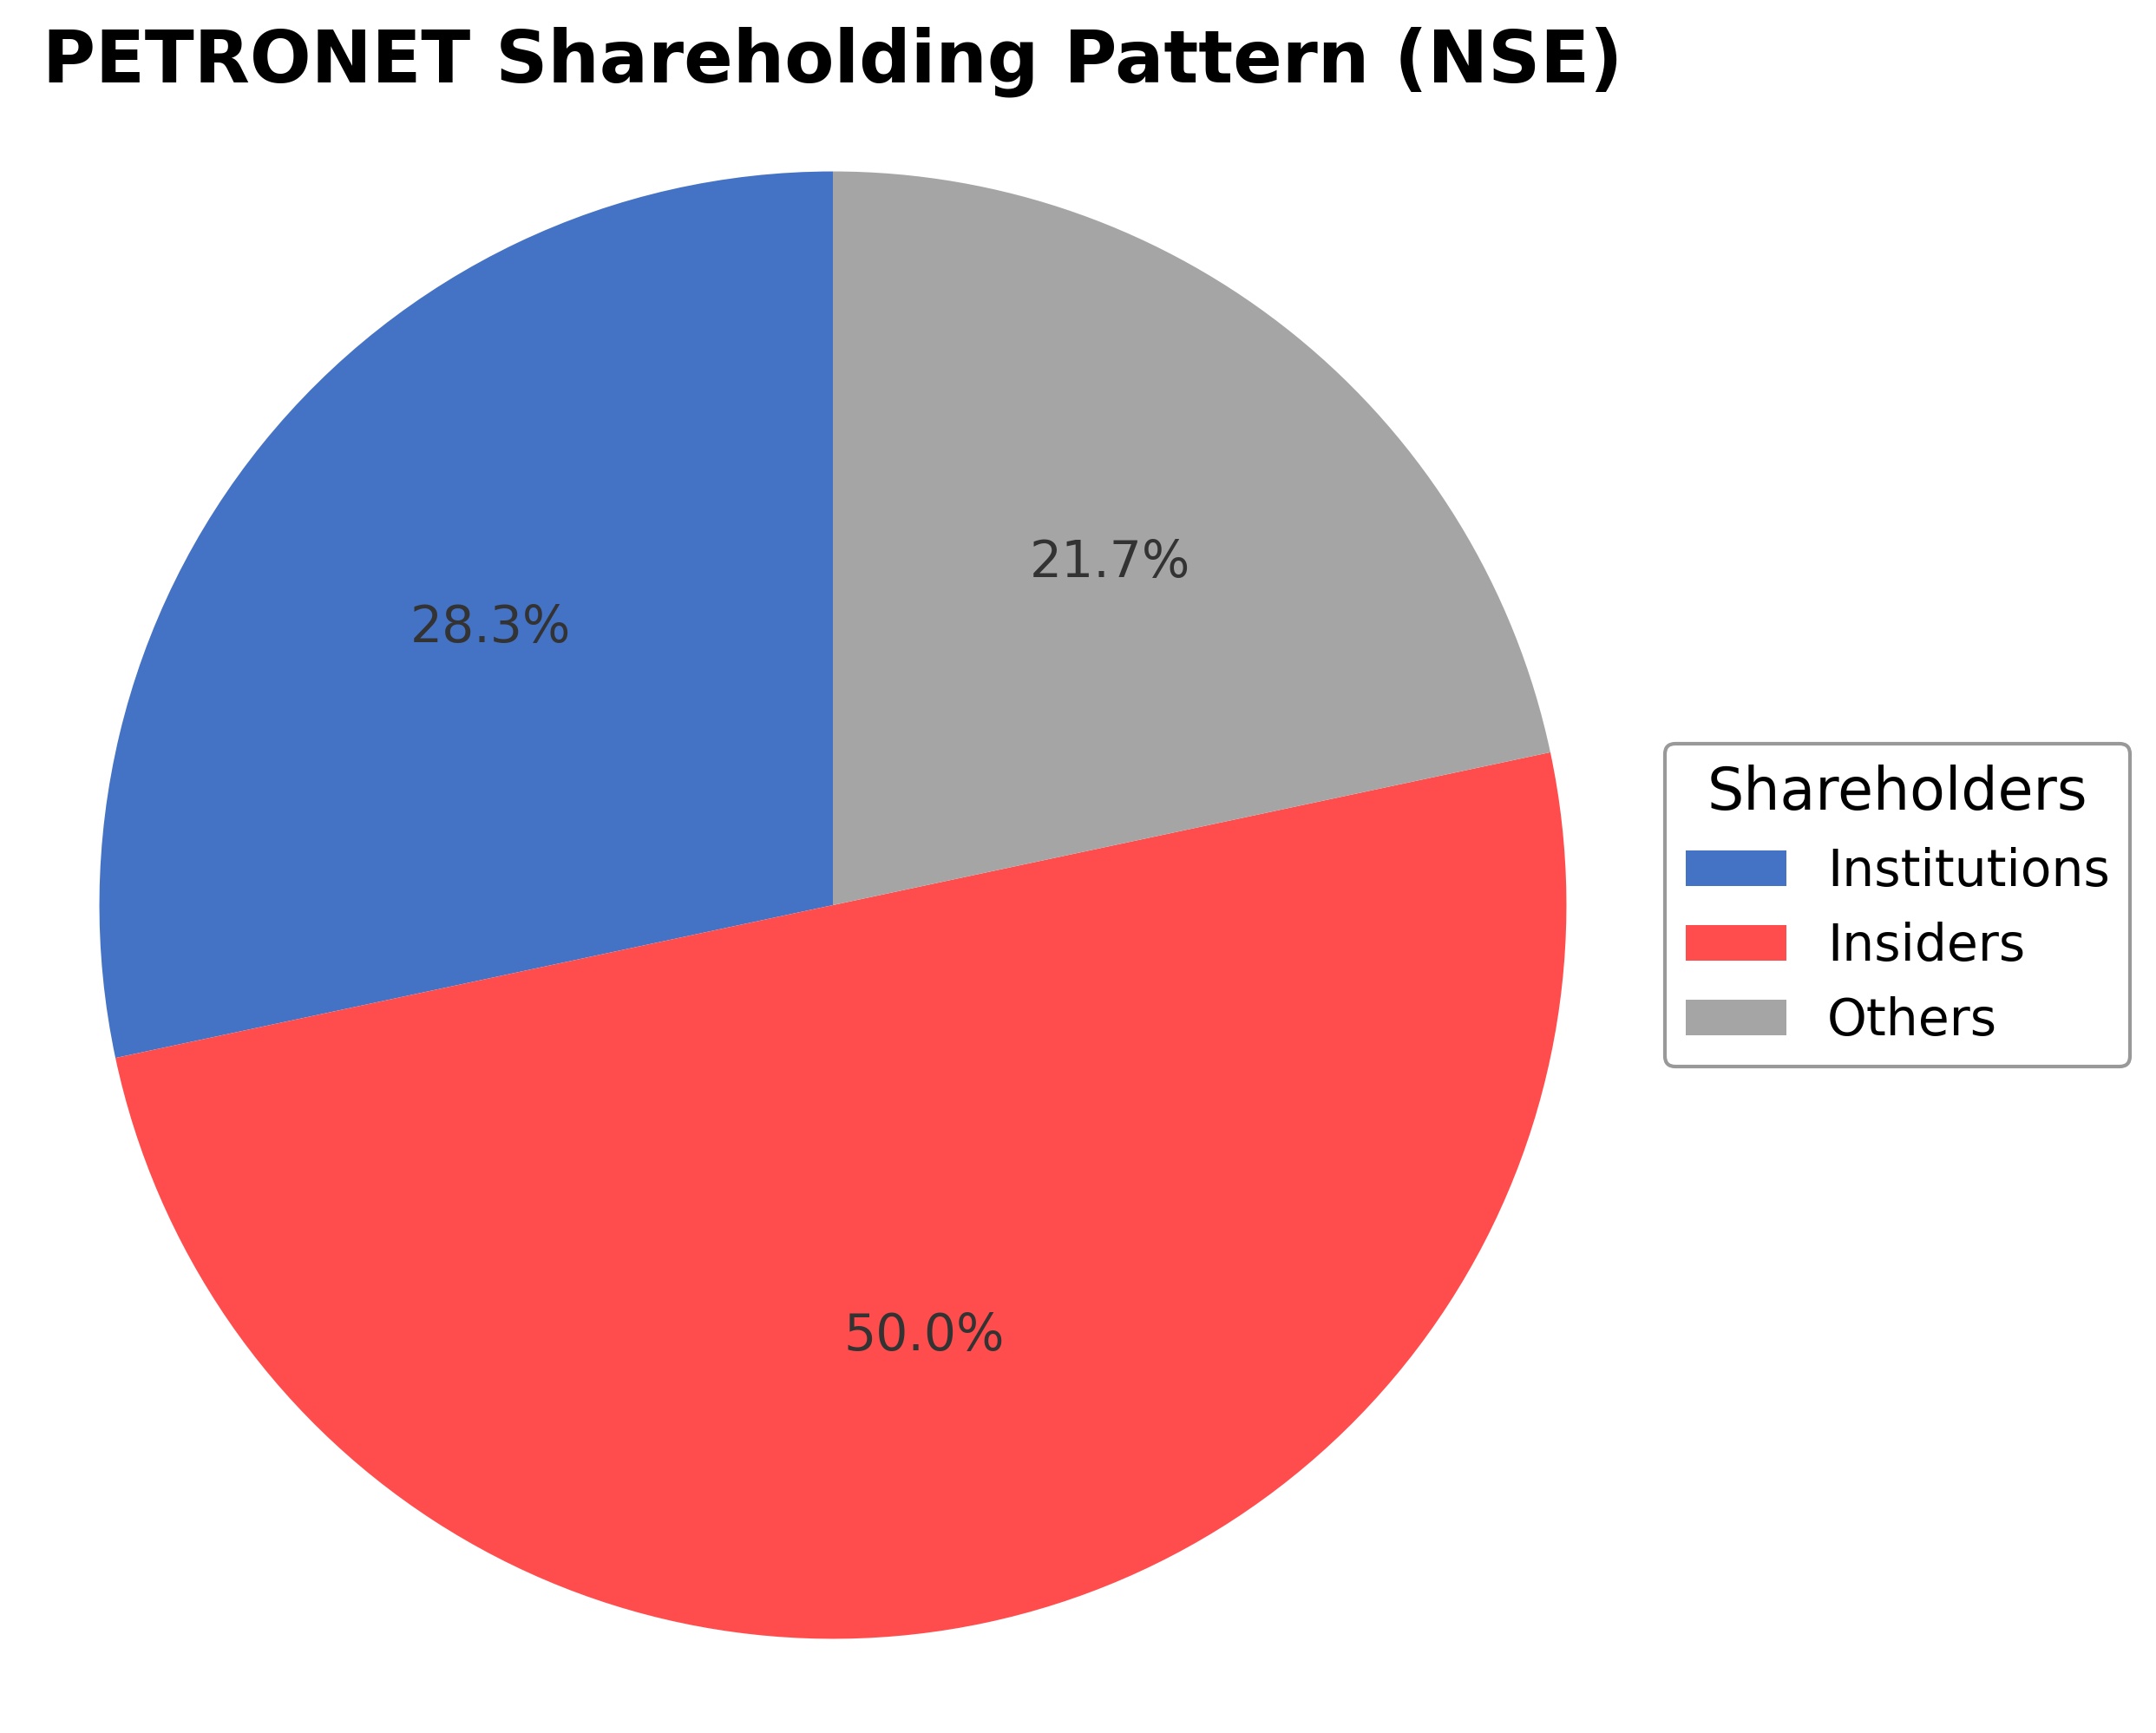
Petronet LNG Ltd.'s ownership structure comprises insiders including executives and board members holding about 0.5%, institutional investors such as mutual funds and asset managers holding 28.34%, and the remaining shares distributed among public shareholders and others. Promoters maintain a controlling stake near 50%, reflecting stable governance. Over the past 12-24 months, institutional holdings have shown moderate accumulation, indicating sustained interest from major funds. This shareholding pattern suggests confidence in the company’s strategic direction and governance, supporting its role as a key LNG infrastructure provider in India’s energy sector.
Sector and Industry Analysis
The global liquefied natural gas (LNG) sector has experienced significant growth driven by rising energy demand and a shift towards cleaner fuel alternatives. Market size has expanded as LNG becomes a critical component in the global energy mix, with major players including Qatar Petroleum, Shell, ExxonMobil, and Petronet LNG Ltd. The sector is characterized by substantial capital investment in liquefaction, transportation, and regasification infrastructure to support increasing trade volumes.
Industry trends highlight a growing emphasis on LNG import capacity expansion, technological advancements in liquefaction processes, and diversification of supply sources to enhance energy security. Competitive dynamics are shaped by high entry barriers due to capital intensity, long project lead times, and complex supply chain logistics. Established companies leverage strategic partnerships and long-term contracts to secure market share, with Petronet LNG positioned as a key importer and regasifier in India’s expanding LNG market.
Regulatory frameworks governing the LNG sector focus on safety standards, environmental compliance, and trade policies that influence project approvals and operational practices. Governments are increasingly promoting LNG to meet climate goals, which supports infrastructure development but also imposes stringent emissions and safety regulations. In India, regulatory policies encourage LNG adoption to reduce dependence on coal and oil, positively impacting companies like Petronet LNG through supportive tariff structures and import licensing regimes.
Note: Analysis synthesized from industry research, market reports, and regulatory filings. Information is subject to change based on market conditions.
Financial Ratios Dashboard
Illustrative Scenario Analysis
DCF Assumptions:
Method: Two-Stage EPS-Priority Model
Financials
Peer Analysis
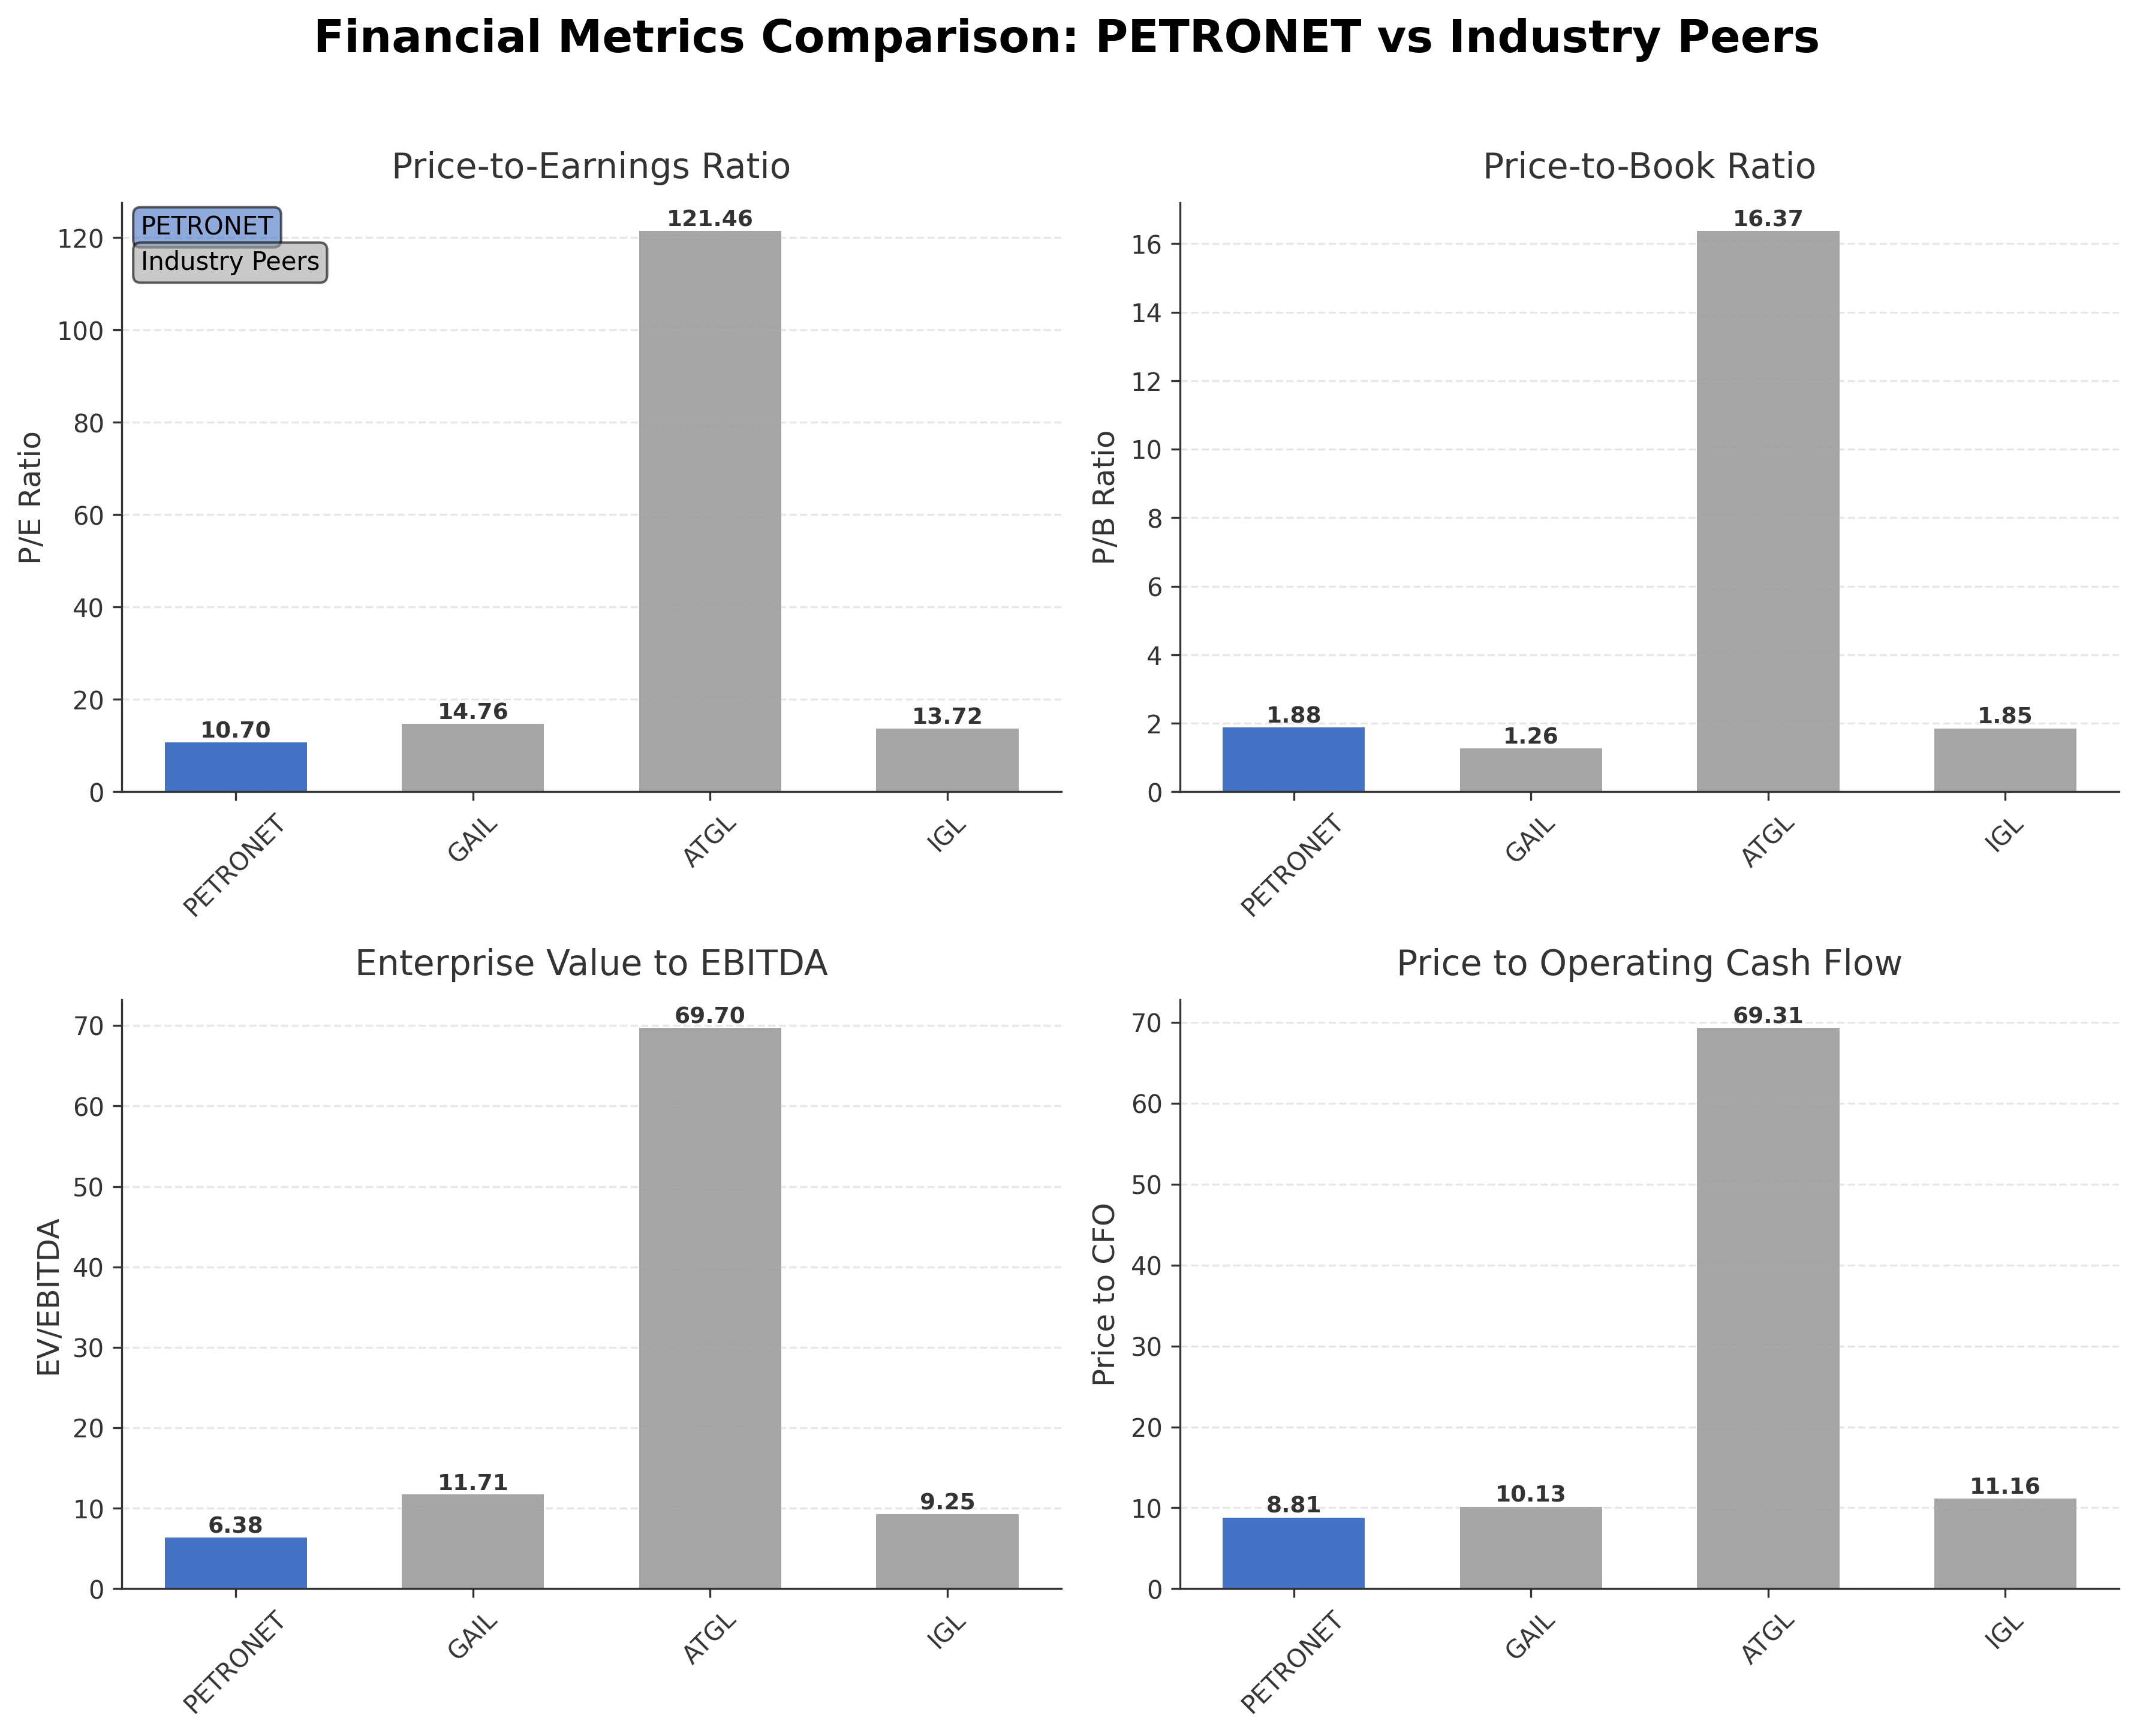
| Company Name | Market Cap | P/E Ratio | P/B Ratio | EV/EBITDA | Price to CFO |
|---|---|---|---|---|---|
| Petronet LNG Ltd. | ₹418.43B | 10.70 | 1.88 | 6.38 | 8.81 |
| GAIL (India) Limited | ₹1.14T | 14.76 | 1.26 | 11.71 | 10.13 |
| Adani Total Gas Limited | ₹796.15B | 121.46 | 16.37 | 69.70 | 69.31 |
| Indraprastha Gas Ltd. | ₹216.02B | 13.72 | 1.85 | 9.25 | 11.16 |
Comparison Analysis: Petronet LNG Ltd. demonstrates a lower P/E ratio of 10.70 compared to peers such as GAIL (14.76) and Indraprastha Gas (13.72), indicating relatively more attractive valuation. Its EV/EBITDA of 6.38 is also lower than GAIL’s 11.71 and IGL’s 9.25, suggesting efficient earnings relative to enterprise value. The company’s return on equity at 18.56% surpasses peers, reflecting stronger profitability. However, Adani Total Gas shows significantly higher valuation multiples, reflecting growth expectations. Overall, Petronet LNG offers a balanced profile with solid profitability and reasonable valuation within the Indian energy sector.
Financial Metrics Comparison with Peers
Financial Statements
Comprehensive financial data including income, balance sheet, and cash flow metrics
Income Statement
| fiscal_date | 2026-03-31 | 2025-03-31 | 2024-03-31 | 2023-03-31 | 2022-03-31 |
|---|---|---|---|---|---|
| Sales | 434.95B | 506.80B | 519.28B | 589.27B | 431.69B |
| Cost Of Goods | 379.58B | 451.31B | 474.95B | 549.43B | 378.46B |
| Gross Profit | 55.37B | 55.50B | 44.33B | 39.85B | 53.23B |
| Operating Expense Other Operating Expenses | 8.06B | 6.28B | 5.00B | 4.01B | 6.64B |
| Operating Income | 44.56B | 49.61B | 45.00B | 43.45B | 44.80B |
| Non Operating Interest Expense | 2.37B | 2.49B | 2.80B | 3.23B | 3.17B |
| Pretax Income | 51.24B | 52.33B | 47.48B | 42.82B | 45.59B |
| Income Tax | 13.14B | 13.49B | 12.21B | 10.94B | 11.21B |
| Net Income | 39.13B | 39.73B | 36.52B | 33.26B | 34.38B |
| Eps Basic | 26.08 | 26.48 | 24.35 | 22.17 | 22.92 |
| Eps Diluted | 26.08 | 26.48 | 24.35 | 22.17 | 22.92 |
| Basic Shares Outstanding | 1.50B | 1.50B | 1.50B | 1.50B | 1.50B |
| Diluted Shares Outstanding | 1.50B | 1.50B | 1.50B | 1.50B | 1.50B |
| Ebit | 53.61B | 54.81B | 50.27B | 46.05B | 48.77B |
| Ebitda | 61.58B | 64.32B | 57.81B | 52.91B | 56.45B |
| Net Income Continuous Operations | 51.24B | 52.33B | 47.48B | 42.82B | 45.59B |
| Preferred Stock Dividends | 0.00 | 0.00 | 0.00 | 0.00 | 0.00 |
| Operating Expense Selling General And Administrative | N/A | 320.40M | 340.20M | 348.10M | 435.20M |
| Non Operating Interest Income | N/A | 7.02B | 5.23B | 3.37B | 2.17B |
Data provided by Twelve Data
Balance Sheet
| fiscal_date | 2026-03-31 | 2025-03-31 | 2024-03-31 | 2023-03-31 | 2022-03-31 |
|---|---|---|---|---|---|
| Cash And Cash Equivalents | 18.59B | 7.81B | 17.23B | 626.60M | 10.54B |
| Accounts Receivable | 10.39B | 32.67B | 36.26B | 38.44B | 26.84B |
| Total Assets | 274.40B | 272.97B | 255.23B | 227.98B | 213.62B |
| Total Liabilities | 51.55B | 74.19B | 81.13B | 75.34B | 76.94B |
| Long Term Debt | 18.63B | 21.76B | 25.96B | 30.70B | 31.33B |
| Shareholders Equity | 222.85B | 198.78B | 174.10B | 152.65B | 136.68B |
Data provided by Twelve Data
Cash Flow Statement
| fiscal_date | 2026-03-31 | 2025-03-31 | 2024-03-31 | 2023-03-31 | 2022-03-31 |
|---|---|---|---|---|---|
| Operating Activities Net Income | 51.24B | 52.33B | 47.48B | 42.82B | 45.59B |
| Operating Activities Other Non Cash Items | -5.34B | -4.44B | -2.33B | -52.90M | 1.01B |
| Operating Activities Accounts Receivable | 22.68B | 641.20M | -209.50M | -12.48B | -8.40B |
| Operating Activities Other Assets Liabilities | -477.70M | 566.00M | -6.03B | -5.28B | -3.35B |
| Operating Activities Operating Cash Flow | 68.10B | 49.09B | 38.90B | 25.00B | 34.85B |
| Investing Activities Capital Expenditures | -25.12B | -14.52B | -8.41B | -10.55B | -722.50M |
| Investing Activities Net Intangibles | -72.60M | -51.10M | -1.30M | -28.50M | -700.00K |
| Investing Activities Investing Cash Flow | -25.12B | -14.52B | -8.41B | -10.55B | -722.50M |
| Financing Activities Common Dividends | -15.00B | -15.00B | -15.00B | -17.25B | -15.75B |
| Financing Activities Financing Cash Flow | -15.00B | -15.00B | -15.00B | -17.25B | -15.75B |
| End Cash Position | 18.59B | 7.81B | 17.23B | 626.60M | 10.54B |
| Free Cash Flow | 22.31B | 29.41B | 40.30B | 14.60B | 34.06B |
| Financing Activities Other Financing Charges | N/A | N/A | N/A | -3.20M | N/A |
| Investing Activities Net Acquisitions | N/A | N/A | N/A | N/A | N/A |
Data provided by Twelve Data
Technical Analysis
Key Insights
- The current trend shows sideways to slightly bearish price action, with the stock trading near its 50-day (₹276.45) and 200-day (₹279.15) moving averages, indicating consolidation.
- Key support levels are identified near ₹235.35 (52-week low) and ₹270, while resistance is observed around ₹290 and the recent high of ₹326.40.
- The stock is hovering close to major moving averages, with the 10-day moving average slightly below the 50-day and 200-day averages, suggesting limited short-term momentum.
- Momentum indicators such as RSI are near neutral levels, MACD shows a weak bullish crossover, and stochastic oscillators indicate potential short-term oversold conditions.
- Multi-timeframe analysis reveals daily charts showing consolidation, weekly charts indicating a mild downtrend, and monthly charts reflecting overall stability in price.
- Potential market scenarios include a breakout above resistance levels if supply concerns ease or a retest of support if geopolitical risks persist, leading to increased volatility.
Trending News
1. Headline: Jio Financial, Hikal, Petronet LNG Among Analyst Picks for Q1 FY27 | Whalesbook
Summary: Analysts highlight Jio Financial, Hikal, and others for Q1 FY27. Learn what investors should track regarding earnings, margins, and sector trends.
Sentiment: neutral
2. Headline: LNG Energy Group H1 2026 output 5,449 Mcf/d gas, $9/Mcf | LNGNF Stock News
Summary: H1 output dropped with well issues as LNG Energy pursues Colombia reorganization, a Venezuela JV and financing aimed at lifting an OSC cease trade order.
Sentiment: negative
3. Headline: Natural gas companies are set to lose steam in Q1 | Stock Market News
Summary: Imports were hit by the shutdown of Qatar's LNG plant, although some supplies were sourced from the spot market at higher prices. Before the disruption, India imported about 40 mmscmd from the Qatar facility. Also Read | OIL, ONGC stocks get double bonanza: royalty boost, after higher realizations · The disruption is expected to weigh on the Q1FY27 earnings of GAIL (India) Ltd, Petronet ...
Sentiment: negative
4. Headline: Petronet LNG Ltd drops for fifth straight session | Capital Market News - Business Standard
Summary: The benchmark July futures contract ... the day. Petronet LNG Ltd tumbled 8.03% in last one year as compared to a 4.93% slide in NIFTY and a 9.07% spurt in the Nifty Energy index. The PE of the stock is 10.89 based on TTM earnings ending March 26. ... Don't miss the most important news and views ...
Sentiment: negative
5. Headline: Volumes soar at Petronet LNG Ltd counter | Capital Market News - Business Standard
Summary: Petronet LNG Ltd clocked volume of 16.62 lakh shares by 10:46 IST on BSE, a 23.28 times surge over two-week average daily volume of 71389 shares · Polycab India Ltd, Sonata Software Ltd, Zensar Technologies Ltd, CRISIL Ltd are among the other stocks to see a surge in volumes on BSE today, ...
Sentiment: positive
Powered by Brave
Recent Updates
News Summary
As of June 16, 2026. Petronet LNG shares surged following Qatar's announcement to restore approximately 50% of its LNG production within a month after the reopening of the Strait of Hormuz, with expectations to reach nearly 80% of normal output within two months. This development addresses prior supply disruptions caused by regional conflicts that had led to force majeure declarations affecting three LNG vessels under Petronet's long-term contracts. The company has diversified its LNG sourcing strategy, increasing imports from the US and other countries to mitigate tight market conditions and elevated spot prices. Additionally, Indian Oil Corporation confirmed no encumbrances on its stakes in Petronet LNG during fiscal year 2025-26, reinforcing ownership stability and investor confidence.
News Sentiment
The overall sentiment from recent updates is cautiously positive, driven primarily by Qatar's planned LNG production restoration which is expected to alleviate supply constraints impacting Petronet LNG. The diversification of LNG sourcing and stable ownership structure further support this positive outlook. However, prior supply disruptions and elevated LNG prices continue to pose challenges, tempering enthusiasm. The balance of these factors suggests a measured optimism regarding the company’s near-term operational environment.
Source List
- https://www.cnbctv18.com/market/petronet-lng-share-price-surges-after-this-important-update-from-qatar-ws-el-19926408.htm
- https://www.tipranks.com/news/company-announcements/indian-oil-declares-no-encumbrance-on-stakes-in-chennai-petroleum-and-petronet-lng
Analytical Overview
Analysis Summary
Petronet LNG’s valuation metrics, including a trailing P/E of 10.70 and forward P/E of 9.89, are below the industry average P/E of approximately 14, indicating a relatively attractive valuation compared to peers. The company’s revenue growth has recently declined by 23.3% quarter-over-quarter, but quarterly earnings have grown by 25.2% year-over-year, reflecting operational resilience. Strong cash flow generation is evident with operating cash flow of ₹47.5 billion and levered free cash flow of ₹18.1 billion, supported by a low debt-to-equity ratio of 0.11, highlighting solid financial health.
Sector-specific challenges include geopolitical risks affecting LNG supply chains and elevated spot LNG prices, which impact margins. Opportunities arise from India’s increasing energy demand and efforts to diversify LNG sourcing. Considering the Indian regulatory environment, the company benefits from government support for energy security and infrastructure development, although it must navigate fluctuating global energy prices and supply uncertainties.
Overall Business and Market Assessment
Supporting Factors: Petronet LNG’s strong profitability with an 18.56% ROE, robust liquidity with a current ratio of 5.67, and reasonable valuation metrics relative to peers
Risk Factors: ongoing supply disruptions from geopolitical tensions and the impact of volatile LNG prices on margins
SWOT Analysis
Strengths
- Strong market position as a leading LNG regasification company in India.
- Robust profitability with an 18.56% return on equity.
- Healthy liquidity indicated by a current ratio of 5.67 and substantial cash reserves.
- Stable ownership structure with significant promoter and institutional holdings.
Weaknesses
- Recent quarterly revenue decline of 23.3% indicating short-term operational challenges.
- Dependence on geopolitical-sensitive LNG supply chains.
- Moderate gross margin of approximately 15.79%, limiting pricing power.
- Relatively high price-to-book ratio of 1.88 compared to some peers.
Opportunities
- Increasing domestic energy demand supporting LNG infrastructure growth.
- Diversification of LNG sourcing reducing supply risk.
- Government initiatives promoting energy security and cleaner fuel adoption.
- Potential to expand regasification capacity and enter new markets.
Threats
- Geopolitical tensions impacting LNG supply and pricing.
- Volatility in global LNG spot prices affecting profitability.
- Regulatory changes in the energy sector introducing compliance costs.
- Competition from alternative energy sources and other gas suppliers.
Company Description
Petronet LNG Ltd. is a significant player in India's energy sector, specializing in the import and processing of liquefied natural gas (LNG). It primarily functions as an LNG regasification company, providing a vital link in India's energy supply chain by converting imported LNG into gaseous form for distribution. Petronet LNG operates key terminals in Dahej, Gujarat, and Kochi, Kerala, which are pivotal for meeting the growing energy demands of India's burgeoning economy. The company plays a crucial role in diversifying India's energy sources away from traditional fossil fuels, thereby contributing to energy security and sustainability efforts. As one of the largest players in the country's LNG sector, Petronet LNG collaborates with global energy corporations to secure LNG supplies, supporting both industrial growth and residential energy needs across various regions. The strategic importance of Petronet LNG is underscored by its ability to adapt to fluctuating energy markets and its commitment to enhancing India's energy infrastructure.