
Pasupati Acrylon Ltd (PASUPTAC)
Stock Analysis Report
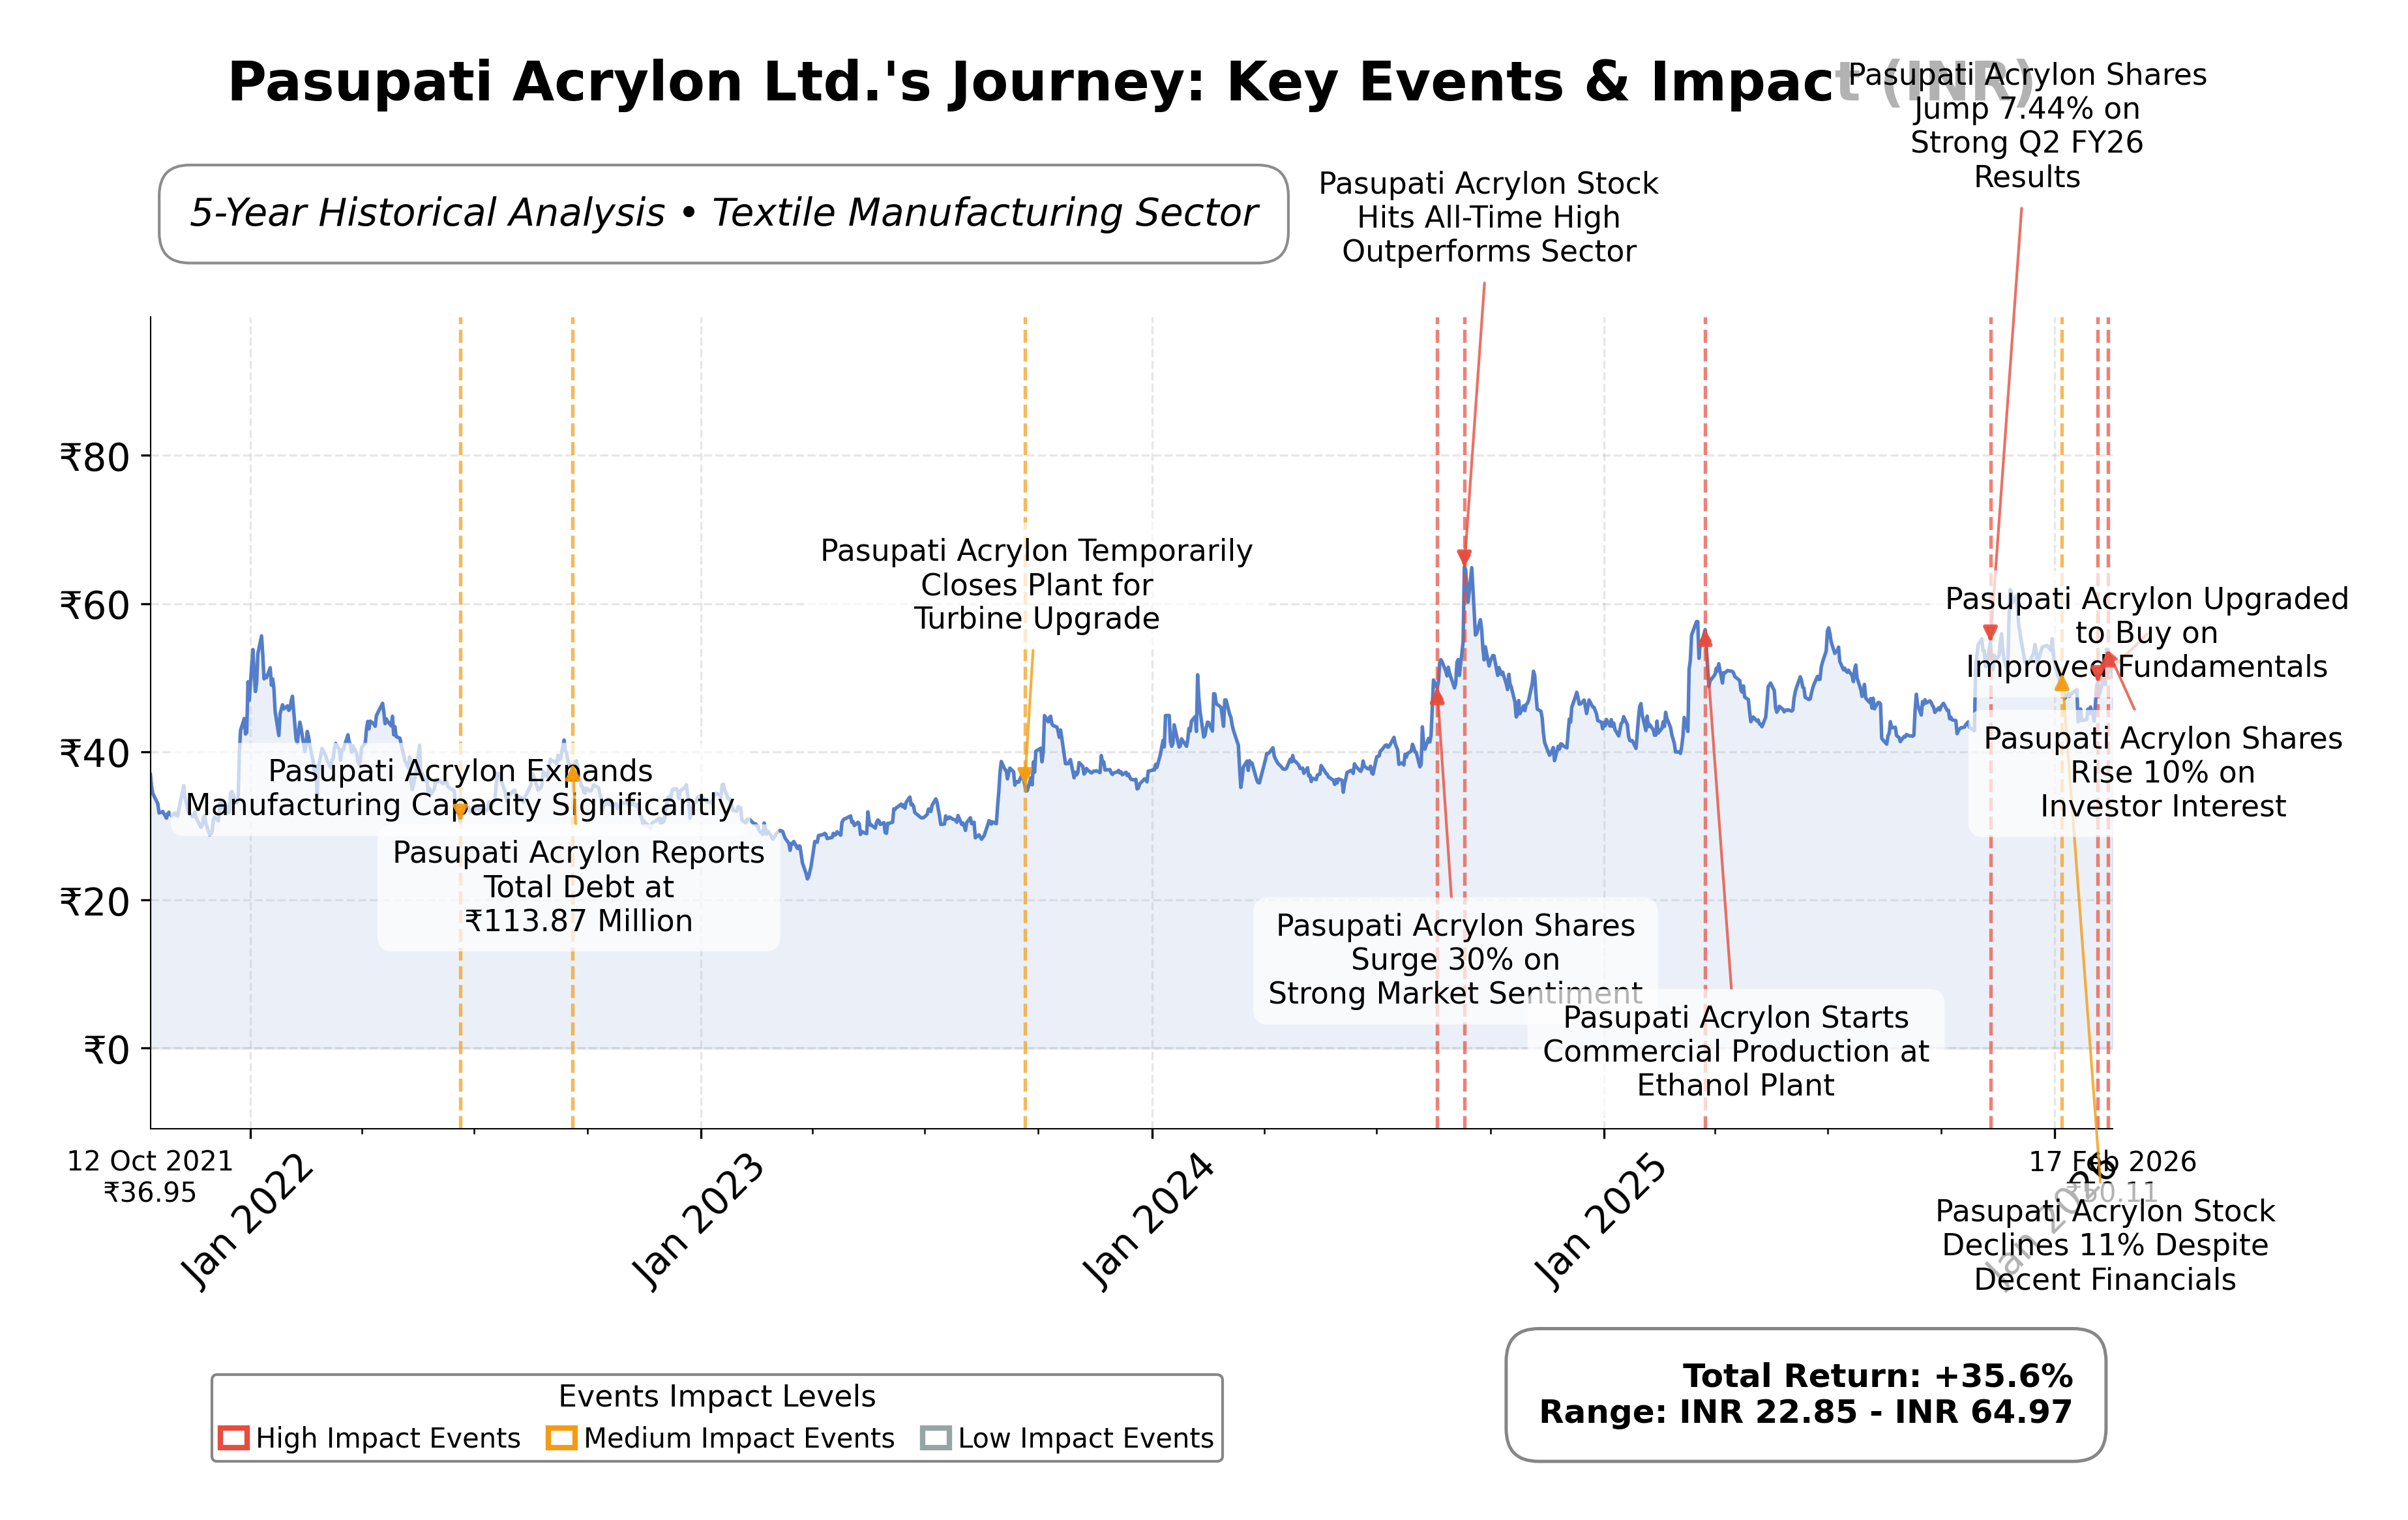
Stock Journey
Key Positives and Key Risks
Pros
- Revenue growth of 54.8% in the most recent quarter indicates strong top-line expansion.
- Trailing P/E ratio of 11.36 aligns with industry average, suggesting fair valuation.
- Current ratio of 2.74 reflects strong liquidity and financial stability.
Cons
- Limited institutional ownership at 0% may impact liquidity and governance influence.
- Market capitalization of ₹4.80B is significantly smaller than major peers, indicating scale limitations.
- No dividend payouts reduce appeal for income-focused stakeholders.
Disclosure: This information is for general awareness and does not constitute investment advice
Report Summary
Pasupati Acrylon Ltd. operates primarily in the textile manufacturing industry, specializing in the production of acrylic fibers used across various sectors such as textiles, garments, upholstery, and home furnishings. Positioned as a key player in the Indian acrylic fiber market, the company emphasizes quality and sustainability in its manufacturing processes, catering to both consumer and industrial product markets.
Financially, Pasupati Acrylon reported a market capitalization of approximately â¹4.80 billion with a trailing P/E ratio of 11.36, aligning closely with the industry average. The company demonstrated strong revenue growth of 54.8% year-over-year in the most recent quarter, with a profit margin of 5.88% and operating margin of 13.37%. Return on equity stands near 9.7%, supported by a solid current ratio of 2.74 and manageable debt levels, reflecting a stable financial position.
From a strategic and technical perspective, the company has experienced notable quarterly earnings growth and positive market sentiment, as evidenced by recent stock price appreciation and upgrades in market ratings. Key strengths include robust revenue growth and operational efficiency, while risks involve sector cyclicality and competitive pressures. No recent leadership changes were reported, and the company maintains a strong focus on sustainable manufacturing practices.
In comparison to its Indian textile manufacturing peers such as Trident Ltd., KPR Mill Ltd., and Vardhman Textiles Ltd., Pasupati Acrylon exhibits a lower market capitalization but trades at more attractive valuation multiples including P/E and EV/EBITDA ratios. Its return on equity is competitive within the peer group, though some larger peers demonstrate higher profitability metrics. The companyâs valuation metrics suggest relative undervaluation compared to industry leaders, while its growth trajectory remains promising.
Pasupati Acrylon navigates a dynamic industry landscape marked by evolving consumer demand and raw material cost fluctuations. Recent achievements include significant quarterly revenue and profit growth, while ongoing challenges relate to maintaining margin expansion amid competitive pressures. The company stands at a pivotal moment where strategic execution and market conditions will influence its capacity to capitalize on growth opportunities or face downside risks. Given the current data, a balanced approach reflecting cautious observation of performance trends and market developments may be appropriate for those assessing the stock.
Company and Industry Overview
Company Basics
Price Performance
Company Size
Shareholding Pattern
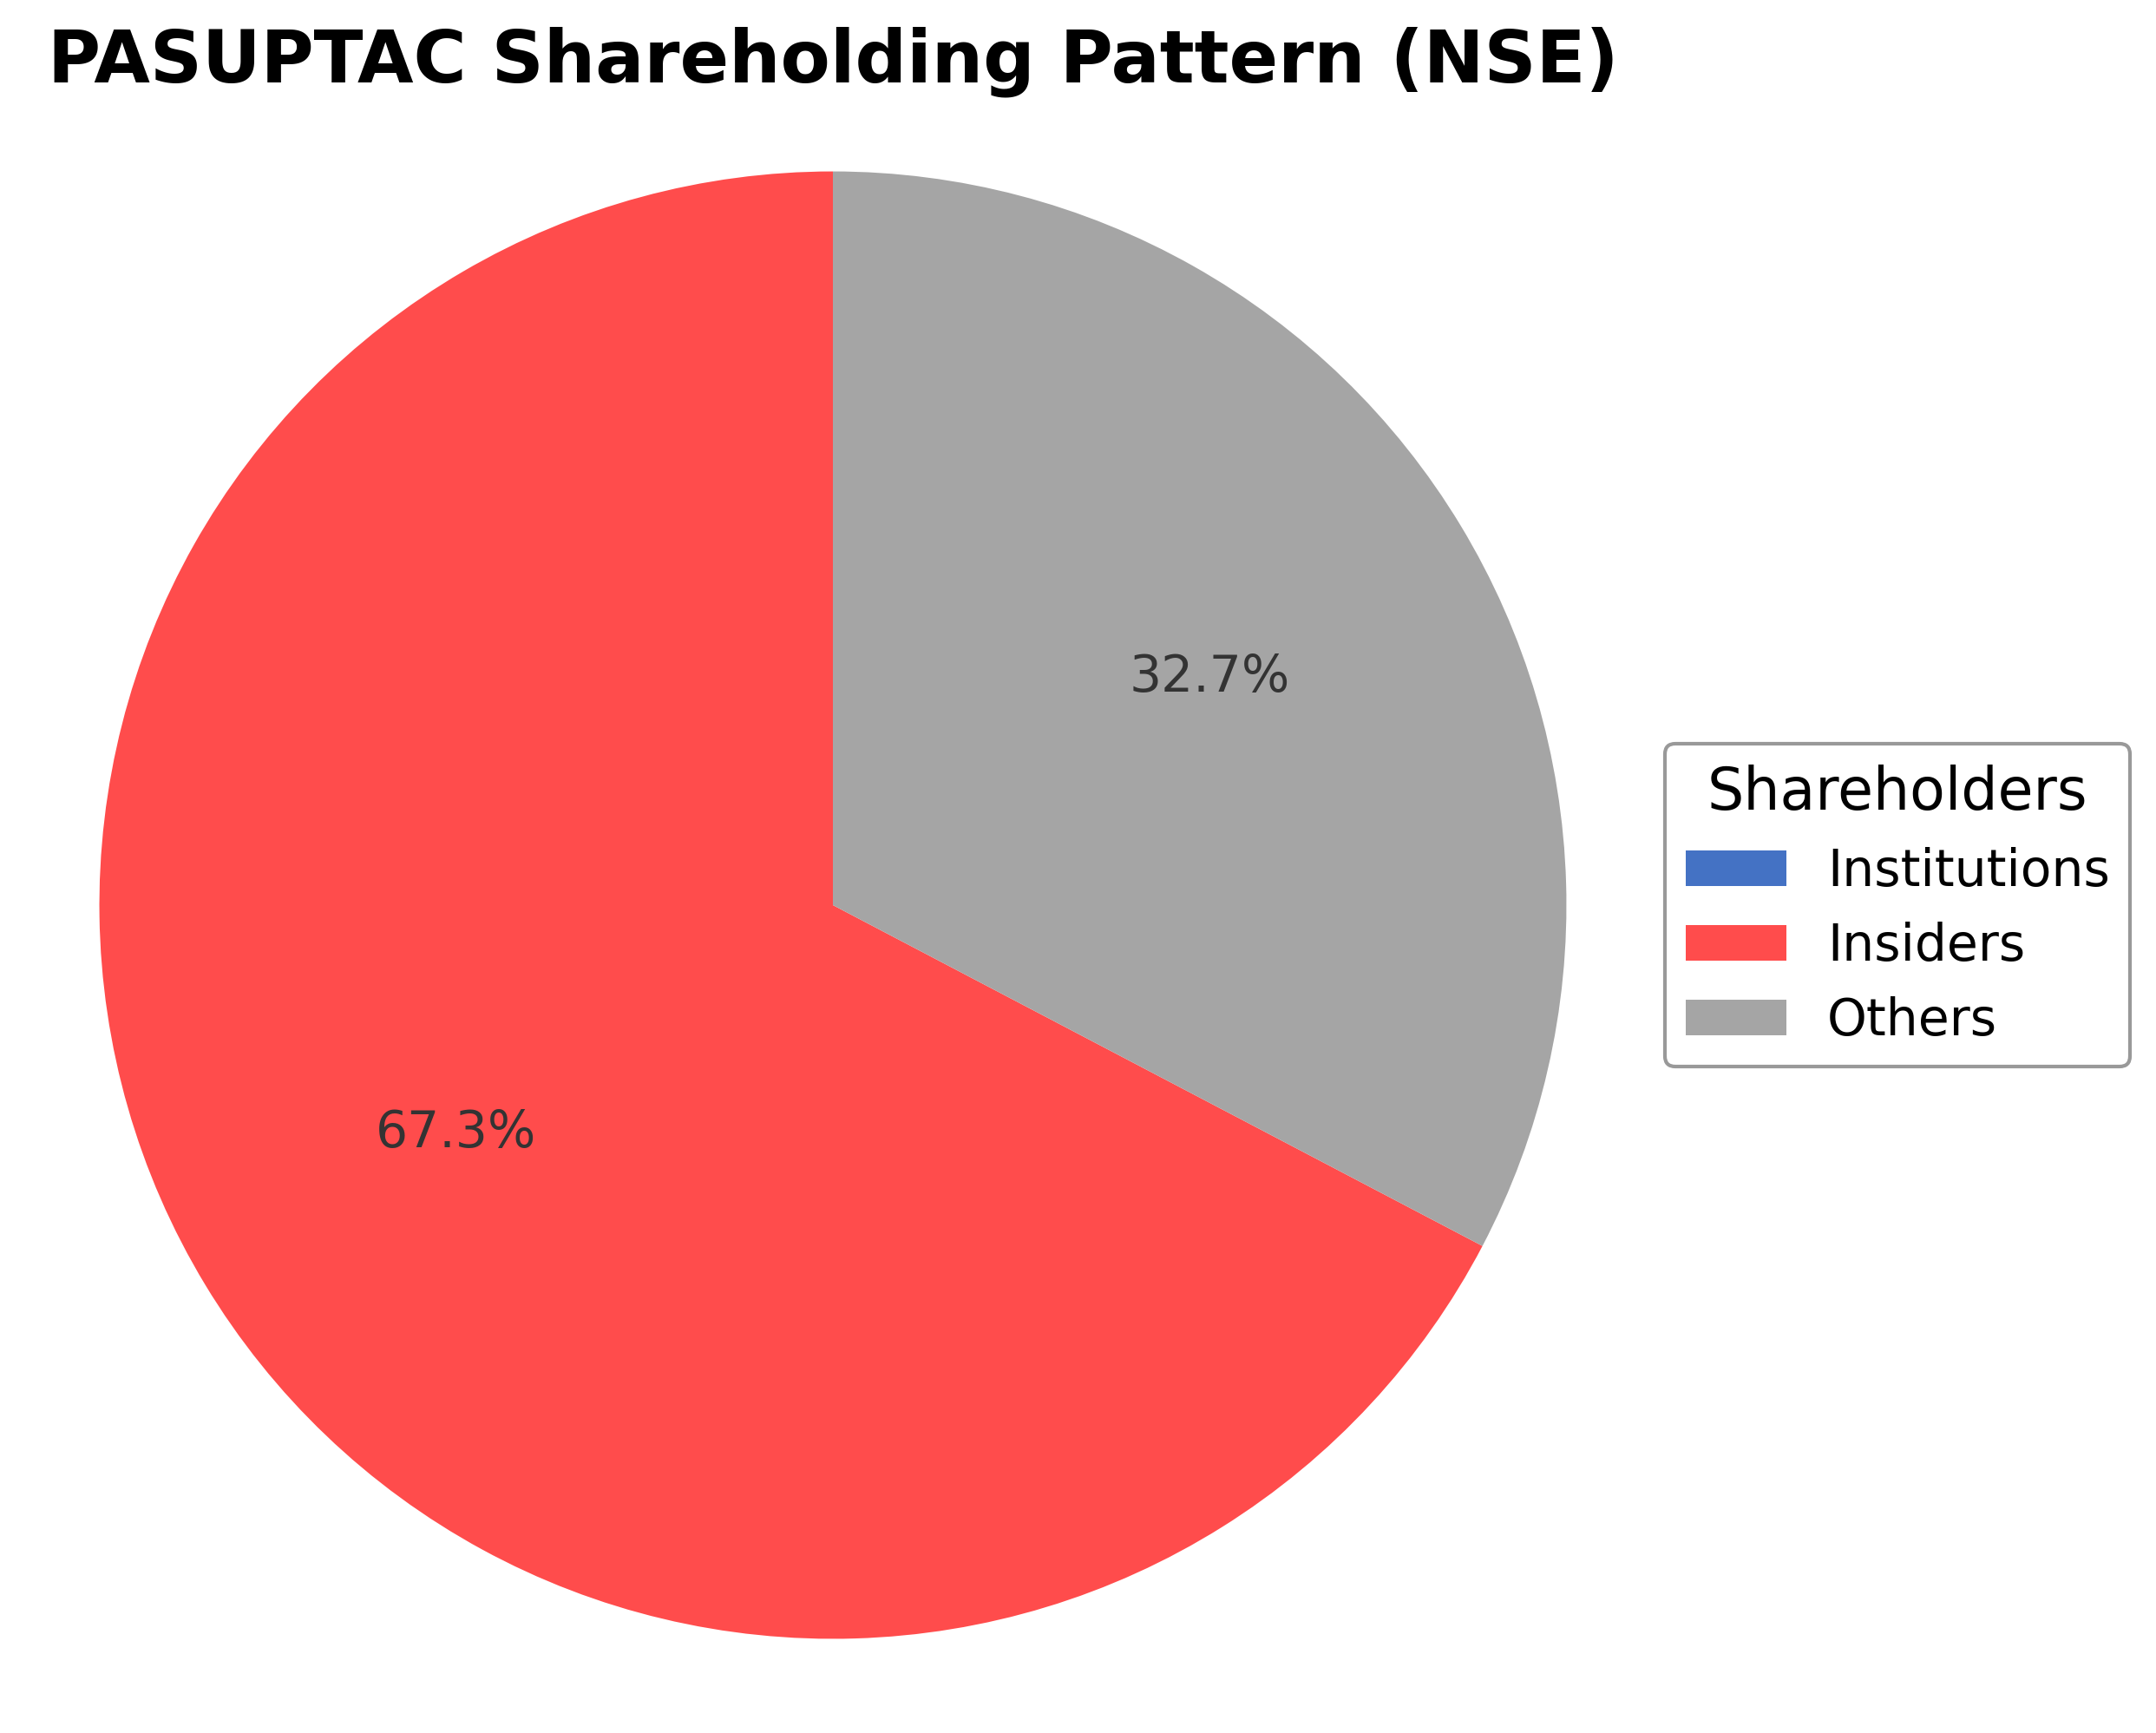
Pasupati Acrylon Ltd.'s ownership structure is predominantly held by public shareholders, accounting for approximately 99.33% of shares, with insiders such as executives and board members holding about 0.67%. Institutional investors currently hold no reported stake in the company. Over the past 12-24 months, there have been no significant changes in institutional ownership, indicating limited institutional accumulation or distribution activity. This shareholding pattern suggests a dispersed ownership base with limited insider concentration, which may influence governance dynamics and strategic decision-making. Market sentiment appears neutral to positive, with public shareholders maintaining the majority stake, reflecting broad market participation without concentrated institutional influence.
Sector and Industry Analysis
Pasupati Acrylon Ltd. (PASUPTAC) operates within the specialty chemicals sector, specifically focusing on the manufacture of acrylonitrile and related chemical intermediates. The specialty chemicals sector is a significant subset of the broader chemical industry, characterized by its production of high-value, performance-driven chemical products used as inputs in diverse end markets such as textiles, plastics, automotive, and electronics. Globally, the specialty chemicals market has demonstrated steady growth, driven by increasing demand for advanced materials and sustainable chemical solutions. Key players in this sector include multinational corporations such as BASF, Dow Chemical, and SABIC, alongside regional specialists like Pasupati Acrylon that cater to niche markets with tailored product offerings. The sector’s growth trajectory is underpinned by expanding industrialization in emerging economies, rising consumer demand for innovative materials, and ongoing investments in research and development.
Industry trends in the acrylonitrile and specialty chemicals space are shaped by technological advancements and evolving end-user requirements. There is a pronounced shift towards green chemistry and sustainable manufacturing processes, driven by both regulatory pressures and consumer preferences for environmentally responsible products. Innovations in catalyst technology, process optimization, and waste minimization are increasingly critical for competitive differentiation. Additionally, the growing use of acrylonitrile in producing carbon fiber composites and synthetic rubbers opens emerging opportunities, particularly in automotive lightweighting and electronics sectors. Digitalization and Industry 4.0 adoption are also influencing operational efficiencies and supply chain integration, enabling companies to respond more agilely to market demands.
The regulatory landscape for specialty chemicals, including acrylonitrile production, is complex and stringent due to the hazardous nature of raw materials and environmental impact concerns. Compliance with international standards such as REACH (Registration, Evaluation, Authorization, and Restriction of Chemicals) in Europe, TSCA (Toxic Substances Control Act) in the U.S., and equivalent regulations in India and other jurisdictions is mandatory. These regulations govern chemical safety, emissions, waste disposal, and worker health and safety. Additionally, environmental policies targeting carbon emissions and water usage impose operational constraints and necessitate capital investments in cleaner technologies. Regulatory compliance not only affects production costs but also influences market access and reputation, making it a critical strategic consideration.
Competitive dynamics in the specialty chemicals industry are characterized by moderate concentration with a mix of global giants and specialized regional players. Barriers to entry are relatively high due to significant capital expenditure requirements, technical expertise, and regulatory approvals needed to establish manufacturing facilities. Economies of scale, proprietary technology, and established distribution networks provide incumbents with competitive advantages. Pasupati Acrylon’s positioning as a focused acrylonitrile producer allows it to leverage specialized knowledge and regional market insights, although it faces competition from integrated chemical producers and imports. Strategic partnerships, continuous innovation, and operational efficiency are key to maintaining and enhancing competitive positioning in this dynamic market environment.
Note: Analysis synthesized from industry research, market reports, and regulatory filings. Information is subject to change based on market conditions.
Illustrative Scenario Analysis
DCF Assumptions:
Method: Two-Stage EPS-Priority Model
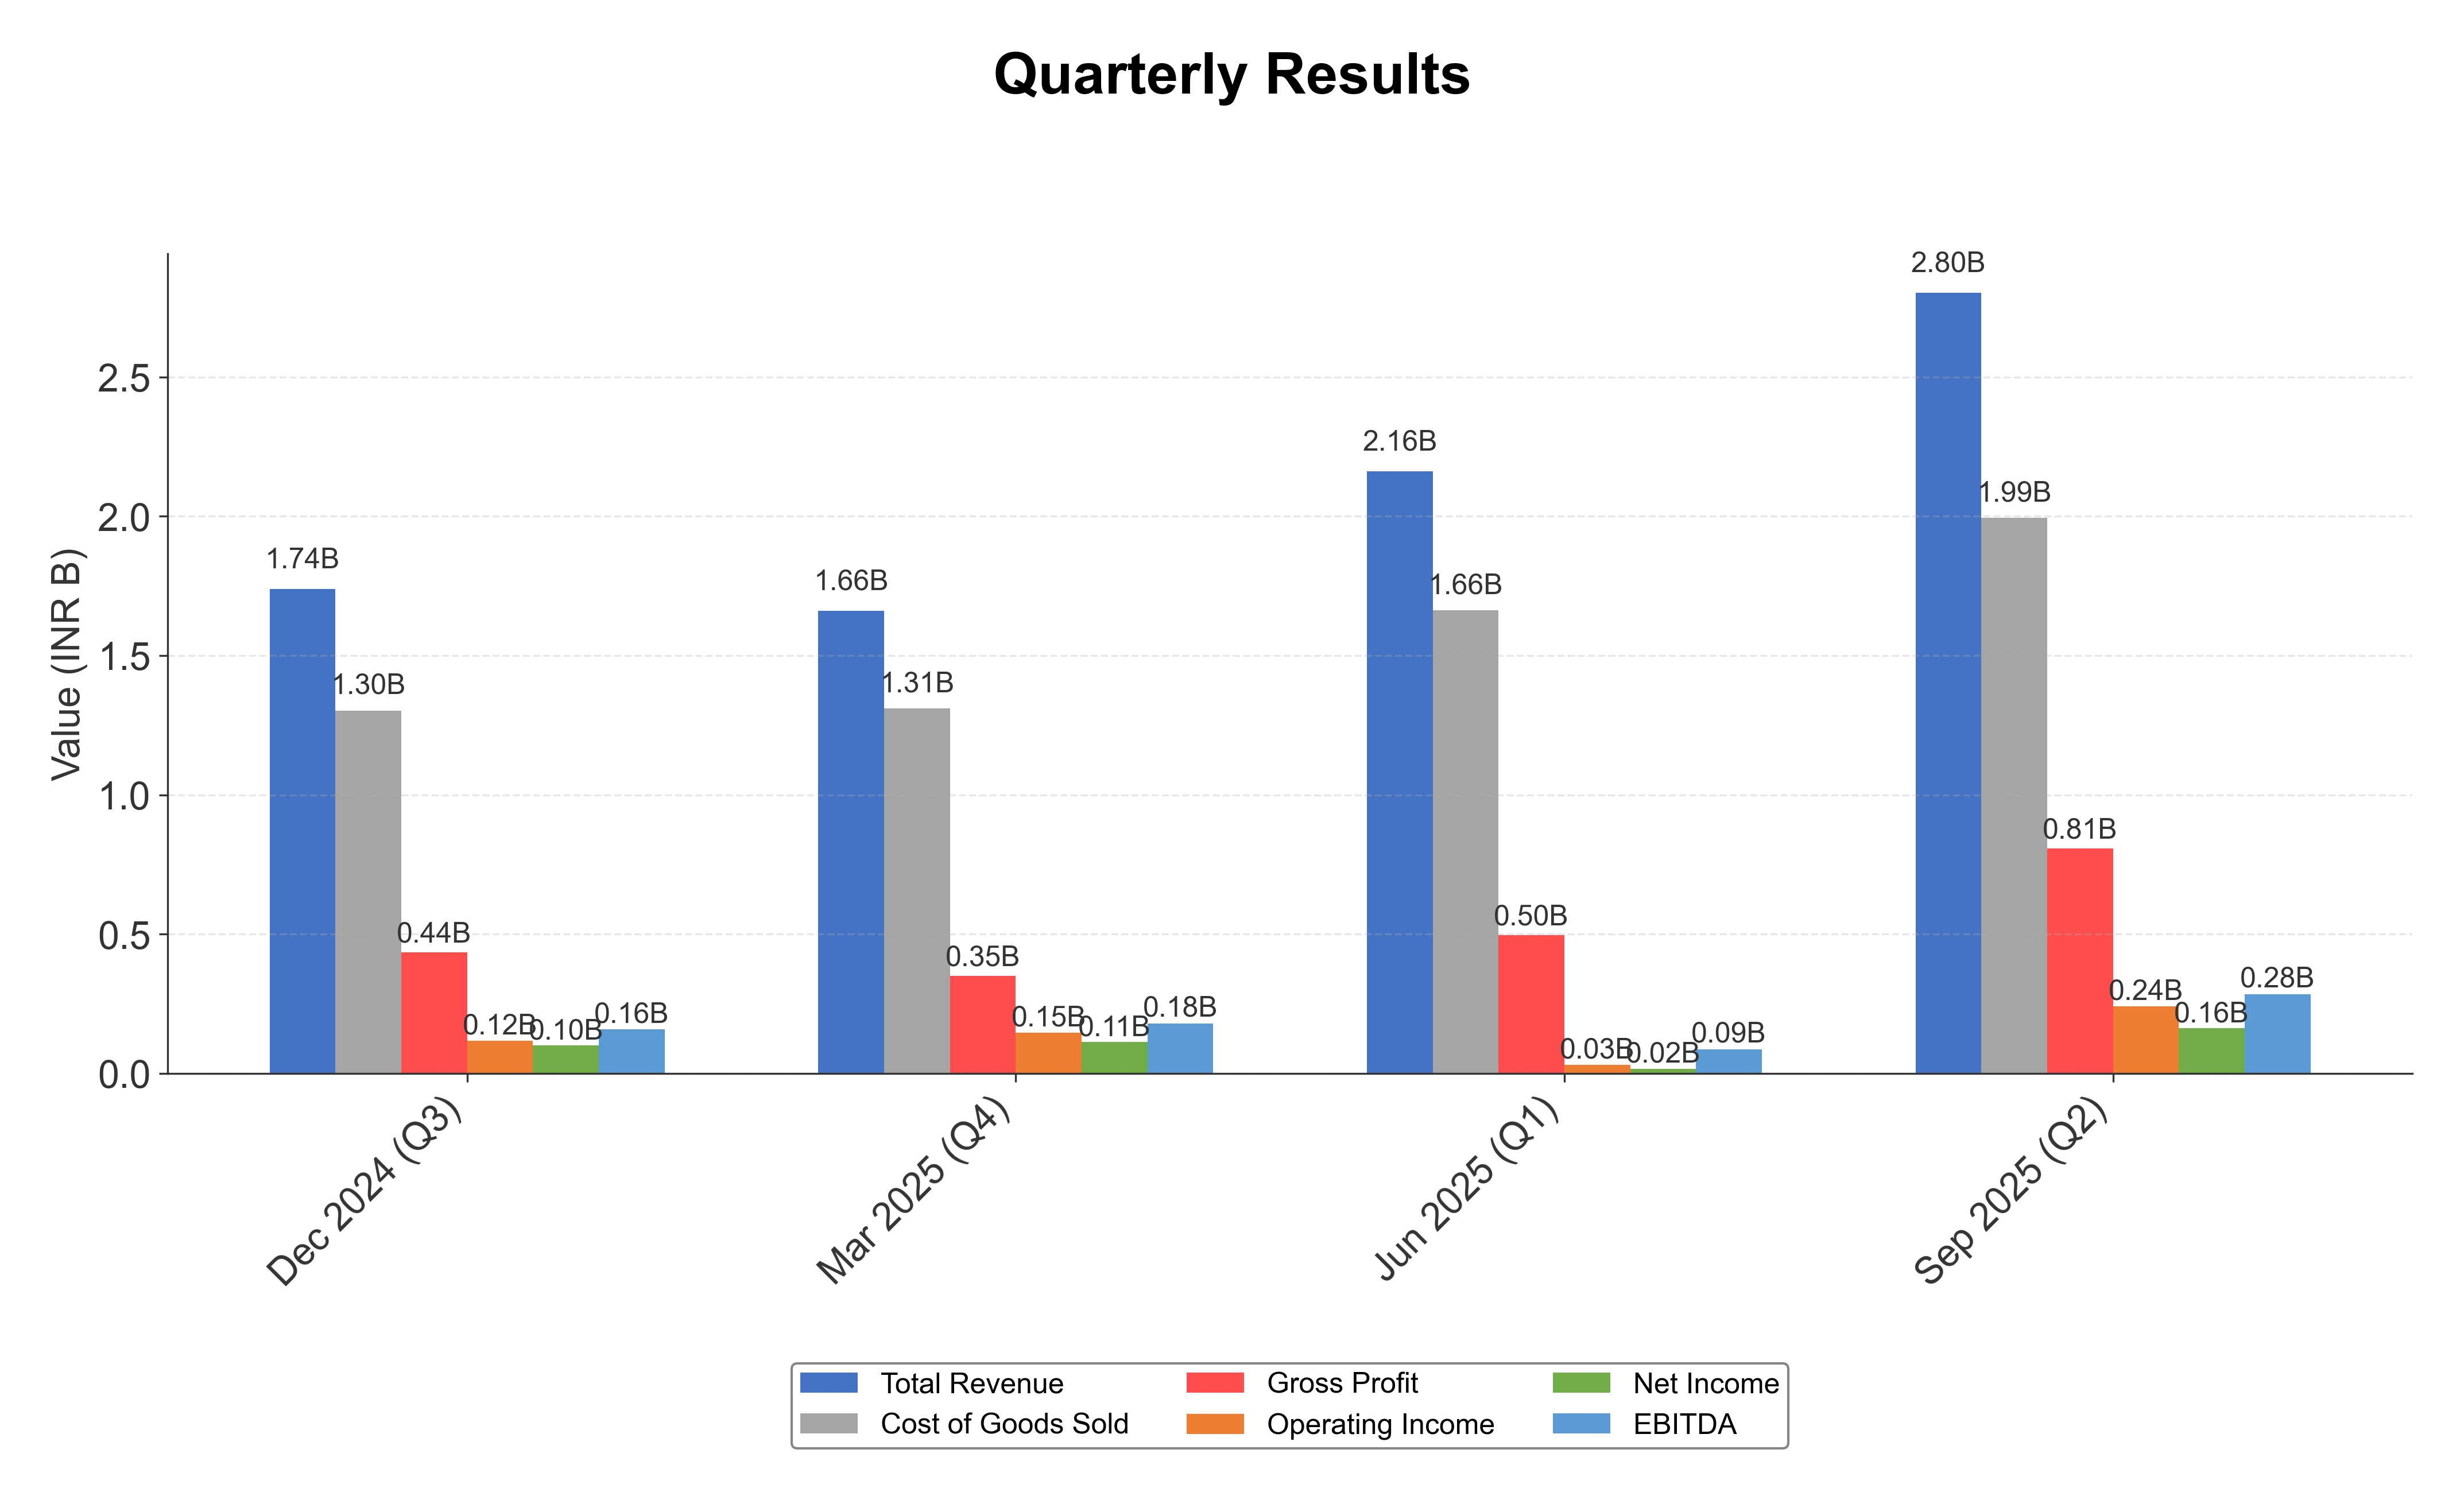
Financials
Peer Analysis
| Company Name | Market Cap | P/E Ratio | P/B Ratio | EV/EBITDA | Price to CFO |
|---|---|---|---|---|---|
| Pasupati Acrylon Ltd. | ₹4.80B | 11.36 | 1.17 | 5.43 | 23.59 |
| Trident Ltd. | ₹134.06B | 32.98 | 2.89 | 15.15 | 15.93 |
| KPR Mill Ltd. | ₹310.39B | 36.98 | 5.84 | 23.36 | 28.06 |
| Welspun Living Ltd. | ₹132.45B | 56.24 | 2.86 | 19.01 | 51.25 |
| Vardhman Textiles Ltd. | ₹147.41B | 18.16 | 1.43 | 11.96 | 9.46 |
| Alok Industries Ltd. | ₹74.43B | -9.13 | -0.36 | 3391.56 | -33.12 |
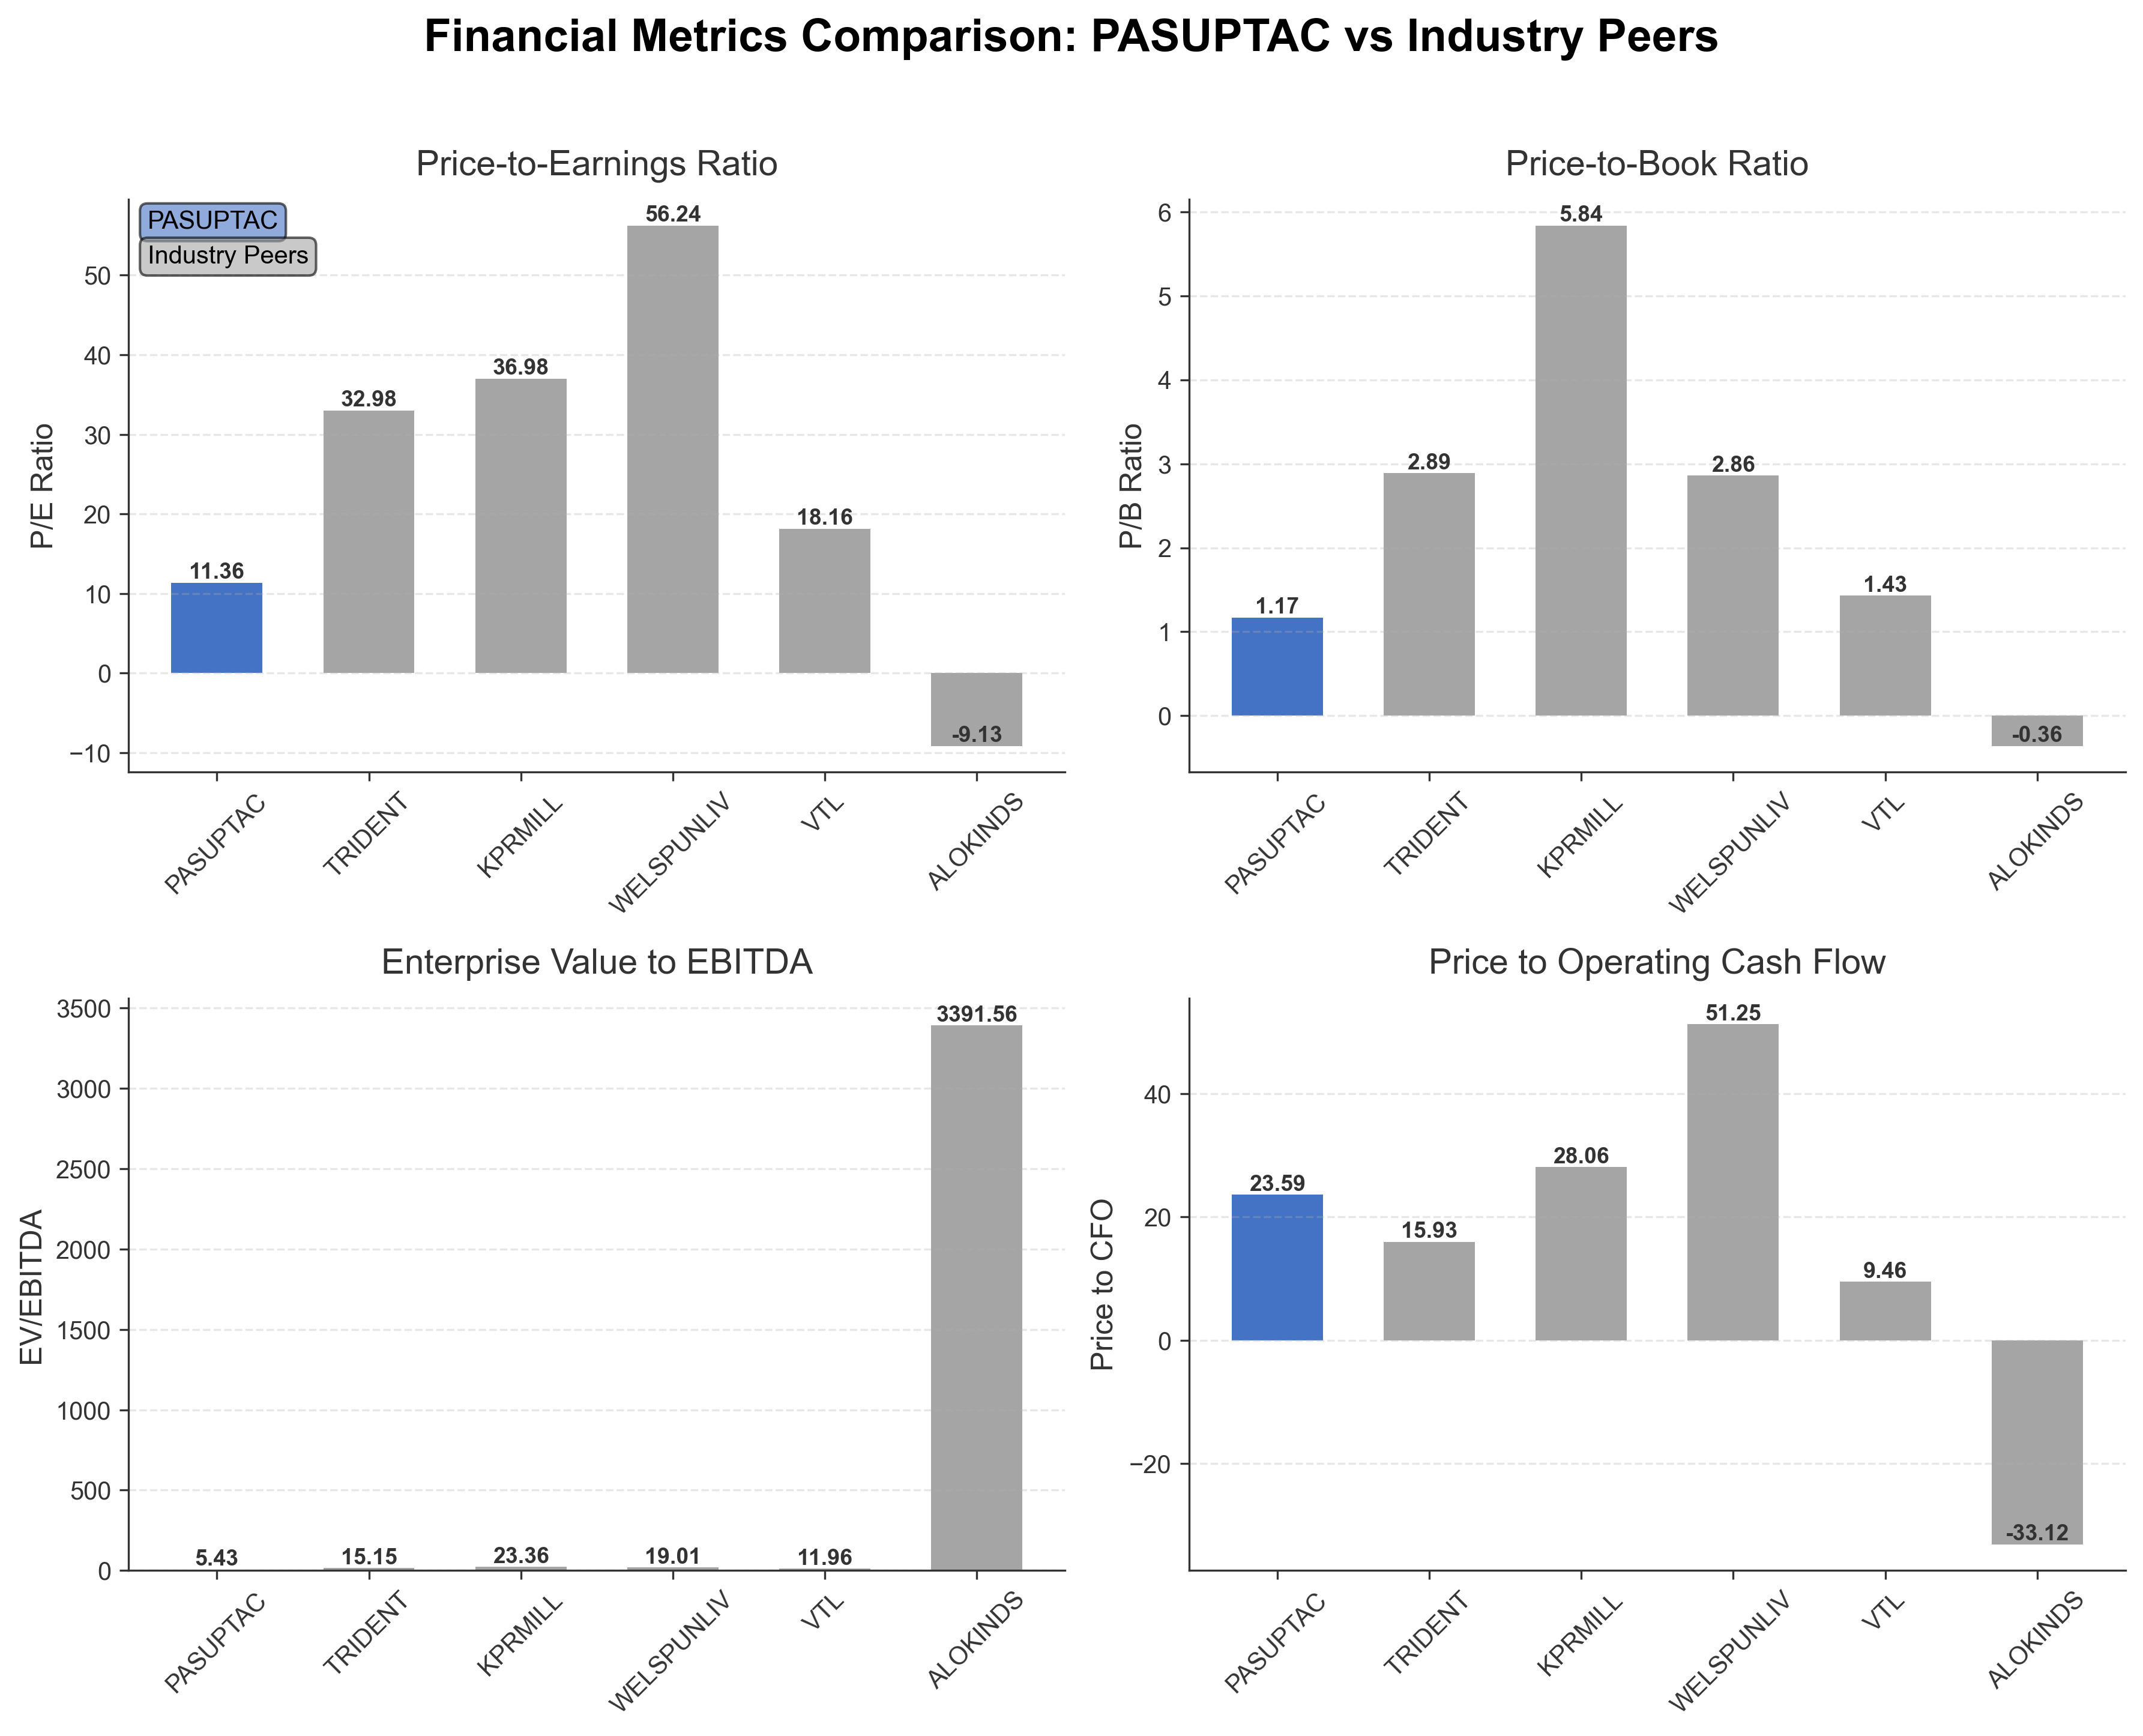
Comparison Analysis: Pasupati Acrylon Ltd. trades at significantly lower valuation multiples compared to its larger Indian textile manufacturing peers, with a P/E ratio of 11.36 versus peers ranging from 18.16 to 56.24. Its EV/EBITDA ratio of 5.43 is also notably lower, suggesting a more attractive valuation relative to earnings. The company’s return on equity of approximately 10% is competitive within the peer group, though some peers exhibit higher profitability. Price to CFO is higher than most peers, indicating relatively elevated cash flow valuation. Overall, Pasupati Acrylon appears undervalued against its regional competitors, with solid profitability metrics but smaller scale.
Financial Metrics Comparison with Peers
Financial Statements
Comprehensive financial data including income, balance sheet, and cash flow metrics
Income Statement
| fiscal_date | 2025-03-31 | 2024-03-31 | 2023-03-31 | 2022-03-31 | 2021-03-31 |
|---|---|---|---|---|---|
| Sales | 6.19B | 5.73B | 8.26B | 7.75B | 5.04B |
| Cost Of Goods | 4.68B | 4.56B | 6.32B | 6.10B | 3.62B |
| Gross Profit | 1.52B | 1.17B | 1.93B | 1.64B | 1.42B |
| Operating Expense Selling General And Administrative | 113.03M | 108.65M | 115.69M | 108.29M | 79.31M |
| Operating Expense Other Operating Expenses | 649.77M | 649.05M | 1.03B | 653.71M | 504.63M |
| Operating Income | 411.64M | 106.68M | 471.84M | 565.92M | 536.86M |
| Non Operating Interest Income | 29.88M | 15.36M | 27.05M | 20.09M | 21.11M |
| Non Operating Interest Expense | 5.25M | 5.38M | 7.99M | 4.90M | 12.65M |
| Pretax Income | 477.19M | 184.02M | 484.46M | 618.35M | 585.32M |
| Income Tax | 123.38M | 52.12M | 125.36M | 159.38M | 154.83M |
| Net Income | 353.81M | 131.90M | 359.11M | 458.97M | 430.49M |
| Eps Basic | 3.97 | 1.48 | 4.03 | 5.15 | 4.83 |
| Eps Diluted | 3.97 | 1.48 | 4.03 | 5.15 | 4.83 |
| Basic Shares Outstanding | 89.13M | 89.13M | 89.13M | 89.13M | 89.13M |
| Diluted Shares Outstanding | 89.13M | 89.13M | 89.13M | 89.13M | 89.13M |
| Ebit | 482.43M | 189.40M | 492.45M | 623.25M | 597.97M |
| Ebitda | 565.47M | 252.66M | 555.37M | 688.49M | 662.10M |
| Net Income Continuous Operations | 477.19M | 184.02M | 484.46M | 618.35M | 585.32M |
| Preferred Stock Dividends | 0.00 | 0.00 | 0.00 | 0.00 | 0.00 |
Source: Financial statements and regulatory filings
Balance Sheet
| fiscal_date | 2025-03-31 | 2024-03-31 | 2023-03-31 | 2022-03-31 | 2021-03-31 |
|---|---|---|---|---|---|
| Cash And Cash Equivalents | 216.58M | 345.86M | 205.22M | 122.90M | 433.22M |
| Accounts Receivable | 497.84M | 559.28M | 508.87M | 778.24M | 549.88M |
| Total Assets | 5.95B | 4.99B | 4.58B | 4.25B | 3.71B |
| Total Liabilities | 2.31B | 1.70B | 1.43B | 1.46B | 1.37B |
| Long Term Debt | 1.01B | 435.56M | 0.00 | 0.00 | 112.00K |
| Shareholders Equity | 3.64B | 3.29B | 3.16B | 2.80B | 2.33B |
Source: Financial statements and regulatory filings
Cash Flow Statement
| fiscal_date | 2025-03-31 | 2024-03-31 | 2023-03-31 | 2022-03-31 | 2021-03-31 |
|---|---|---|---|---|---|
| Operating Activities Net Income | 477.19M | 184.02M | 484.46M | 618.35M | 585.32M |
| Operating Activities Other Non Cash Items | 15.27M | -14.33M | 18.97M | 13.73M | 22.91M |
| Operating Activities Accounts Receivable | 38.29M | -50.40M | 269.37M | -228.37M | -200.67M |
| Operating Activities Other Assets Liabilities | -327.46M | 800.71M | -487.34M | -446.18M | -91.33M |
| Operating Activities Operating Cash Flow | 203.29M | 920.00M | 285.46M | -42.47M | 316.23M |
| Financing Activities Short Term Debt Issuance | 32.23M | 5.45M | 709.00K | -8.19M | 3.42M |
| Financing Activities Financing Cash Flow | 32.23M | 5.45M | 709.00K | -16.49M | 2.78M |
| End Cash Position | 216.58M | 348.65M | 217.40M | 726.96M | 647.57M |
| Free Cash Flow | -825.36M | -217.89M | 232.38M | -155.26M | 30.57M |
| Investing Activities Other Investing Activity | N/A | 17.00K | 3.00K | 100.00K | 9.00K |
| Investing Activities Investing Cash Flow | N/A | 17.00K | 6.00K | 200.00K | 24.26M |
| Investing Activities Capital Expenditures | N/A | N/A | 3.00K | 100.00K | 24.25M |
| Financing Activities Long Term Debt Payments | N/A | N/A | 0.00 | -8.30M | -642.00K |
| Financing Activities Other Financing Charges | N/A | N/A | N/A | N/A | N/A |
Source: Financial statements and regulatory filings
Technical Analysis
Key Insights
- The current trend shows a positive price momentum with recent price action above the 50-day and 200-day moving averages, indicating an upward trend.
- Key support levels are identified near ₹48.80 and ₹49.65, corresponding to the 200-day and 50-day moving averages respectively, while resistance is near the 52-week high of ₹63.50.
- The stock price is currently trading above the 10-day, 50-day, and 200-day moving averages, suggesting short- to long-term bullish momentum.
- Momentum indicators show RSI in a moderate range, MACD indicating bullish crossover, and stochastic oscillators reflecting upward momentum but nearing overbought conditions.
- Multi-timeframe analysis reveals consistent bullish trends on daily and weekly charts, with monthly charts indicating steady upward movement over longer periods.
- Potential market scenarios include continuation of the upward trend if support levels hold, while failure to maintain support near moving averages could lead to consolidation or pullback.
Trending News
1. Headline: Pasupati Acrylon Gains 13.48%: Quarterly Strength Drives Outperformance
Summary: Pasupati Acrylon Ltd delivered a robust performance this week, with its stock surging 13.48% from Rs.47.42 to Rs.53.81, significantly outperforming the Sensex, which declined 0.54% over the same period. The week was marked by a stellar quarterly earnings report and a subsequent upgrade in the company’s market rating, reflecting strong financial health and investor confidence.
Sentiment: Positive
2. Headline: Why is Pasupati Acrylon Ltd falling/rising?
Summary: On 12-Feb, Pasupati Acrylon Ltd witnessed a significant price rise of 10.0%, closing at ₹54.00, reflecting robust investor interest and notable outperformance relative to market indices. This price movement aligns with the company’s recent positive earnings and operational performance.
Sentiment: Positive
3. Headline: Pasupati Acrylon Ltd Reports Outstanding Quarterly Performance Amid Strong Financial Trend Upgrade
Summary: Pasupati Acrylon Ltd, a key player in the petrochemicals sector, has delivered an outstanding quarterly performance for December 2025, prompting an upgrade in its Mojo Grade from Buy to Strong Buy. The company’s robust revenue growth, margin expansion and improved profitability metrics underscore its operational strength and market positioning.
Sentiment: Positive
4. Headline: Pasupati Acrylon Ltd Upgraded to Buy on Improved Fundamentals and Technicals
Summary: Pasupati Acrylon Ltd, a key player in the petrochemicals sector, has seen its investment rating upgraded from Hold to Buy, reflecting significant improvements across technical indicators, valuation metrics, and financial performance. The upgrade, effective from 4 February 2026, is underpinned by strong quarterly results and positive market sentiment.
Sentiment: Positive
Summary: Sales rose 54.85% to Rs 269.23 crore. Net profit of Pasupati Acrylon rose 153.60% to Rs 25.69 crore in the quarter ended December 2025 as against Rs 10.13 crore during the previous quarter ended December 2024. The strong financial results highlight the company’s improving profitability and operational efficiency.
Sentiment: Positive
Recent Updates
News Summary
No valid recent news updates are available for Pasupati Acrylon Ltd. due to data retrieval errors. Consequently, no new information on earnings, regulatory changes, leadership, or strategic developments can be synthesized at this time.
News Sentiment
Neutral sentiment prevails given the absence of recent verifiable news data, limiting the ability to assess current market or operational impacts.
Analytical Overview
Analysis Summary
Pasupati Acrylon Ltd.'s valuation metrics such as the trailing P/E ratio of 11.36 are aligned with the industry average of 11.36, indicating fair valuation relative to peers. The absence of forward P/E data limits forward-looking valuation assessment.
The company’s revenue growth of 54.8% and positive quarterly earnings growth of 153.6% demonstrate a strong growth trajectory supported by improving profitability and operational cash flow.
Financial health appears stable with a current ratio of 2.74 and manageable debt-to-equity ratio of 0.29, supported by positive operating and free cash flow metrics.
The textile manufacturing sector faces cyclical demand and raw material price volatility, which could impact margins; however, Pasupati Acrylon’s sustainable practices and product quality may provide competitive advantages.
Considering the Indian market context, regulatory frameworks supporting sustainable manufacturing and growing domestic textile demand present opportunities, though macroeconomic factors such as inflation and currency fluctuations remain relevant.
Investment Conclusion
Supporting Factors: Primary supporting factors include robust revenue and profit growth, stable financial health, and valuation metrics in line with industry averages.
Risk Factors: Main risk factors to monitor involve sector cyclicality, raw material price fluctuations, and limited institutional ownership which may affect liquidity and governance.
SWOT Analysis
Strengths
- Strong revenue growth with a 54.8% increase in the most recent quarter.
- Healthy operating margin of 13.37% indicating operational efficiency.
- Robust current ratio of 2.74 reflecting solid liquidity position.
- Commitment to sustainable manufacturing practices enhancing brand reputation.
Weaknesses
- Limited institutional investor presence with 0% reported holdings.
- Relatively small market capitalization compared to industry peers.
- No dividend payouts, which may limit appeal to income-focused stakeholders.
- Negative beta indicating potential non-correlation with broader market trends.
Opportunities
- Growing domestic demand for acrylic fibers in textiles and home furnishings.
- Potential to expand market share through sustainable and quality-focused production.
- Favorable regulatory environment in India supporting sustainable manufacturing.
- Room for valuation re-rating given lower multiples relative to peers.
Threats
- Volatility in raw material prices impacting cost structures and margins.
- Cyclical nature of the textile manufacturing industry affecting demand.
- Competitive pressures from larger, more diversified textile companies.
- Economic uncertainties in India that could affect consumer spending patterns.
Company Description
Pasupati Acrylon Ltd. is an Indian company specializing in the production of acrylic fibers and related products. The primary function of the company is to manufacture and supply high-quality acrylic fibers that are used in various sectors, including textiles, garments, upholstery, and home furnishings. Pasupati Acrylon's products are known for their versatility and superior properties, such as durability, colorfastness, and adaptability to diverse environmental conditions. The company plays a significant role in the textile industry by providing raw materials essential for creating a wide array of consumer and industrial products. Additionally, Pasupati Acrylon Ltd. is committed to sustainable practices and operates with a focus on responsible manufacturing processes. This commitment not only ensures the quality of the products but also aligns with global sustainability trends. Pasupati Acrylon's participation in the financial market stems from its status as one of the prominent players in the acrylic fiber manufacturing sector, influencing market dynamics related to both the textile and raw material supplier industries.