
Paras Defence and Space Technologies Limited (PARAS)
Stock Analysis Report
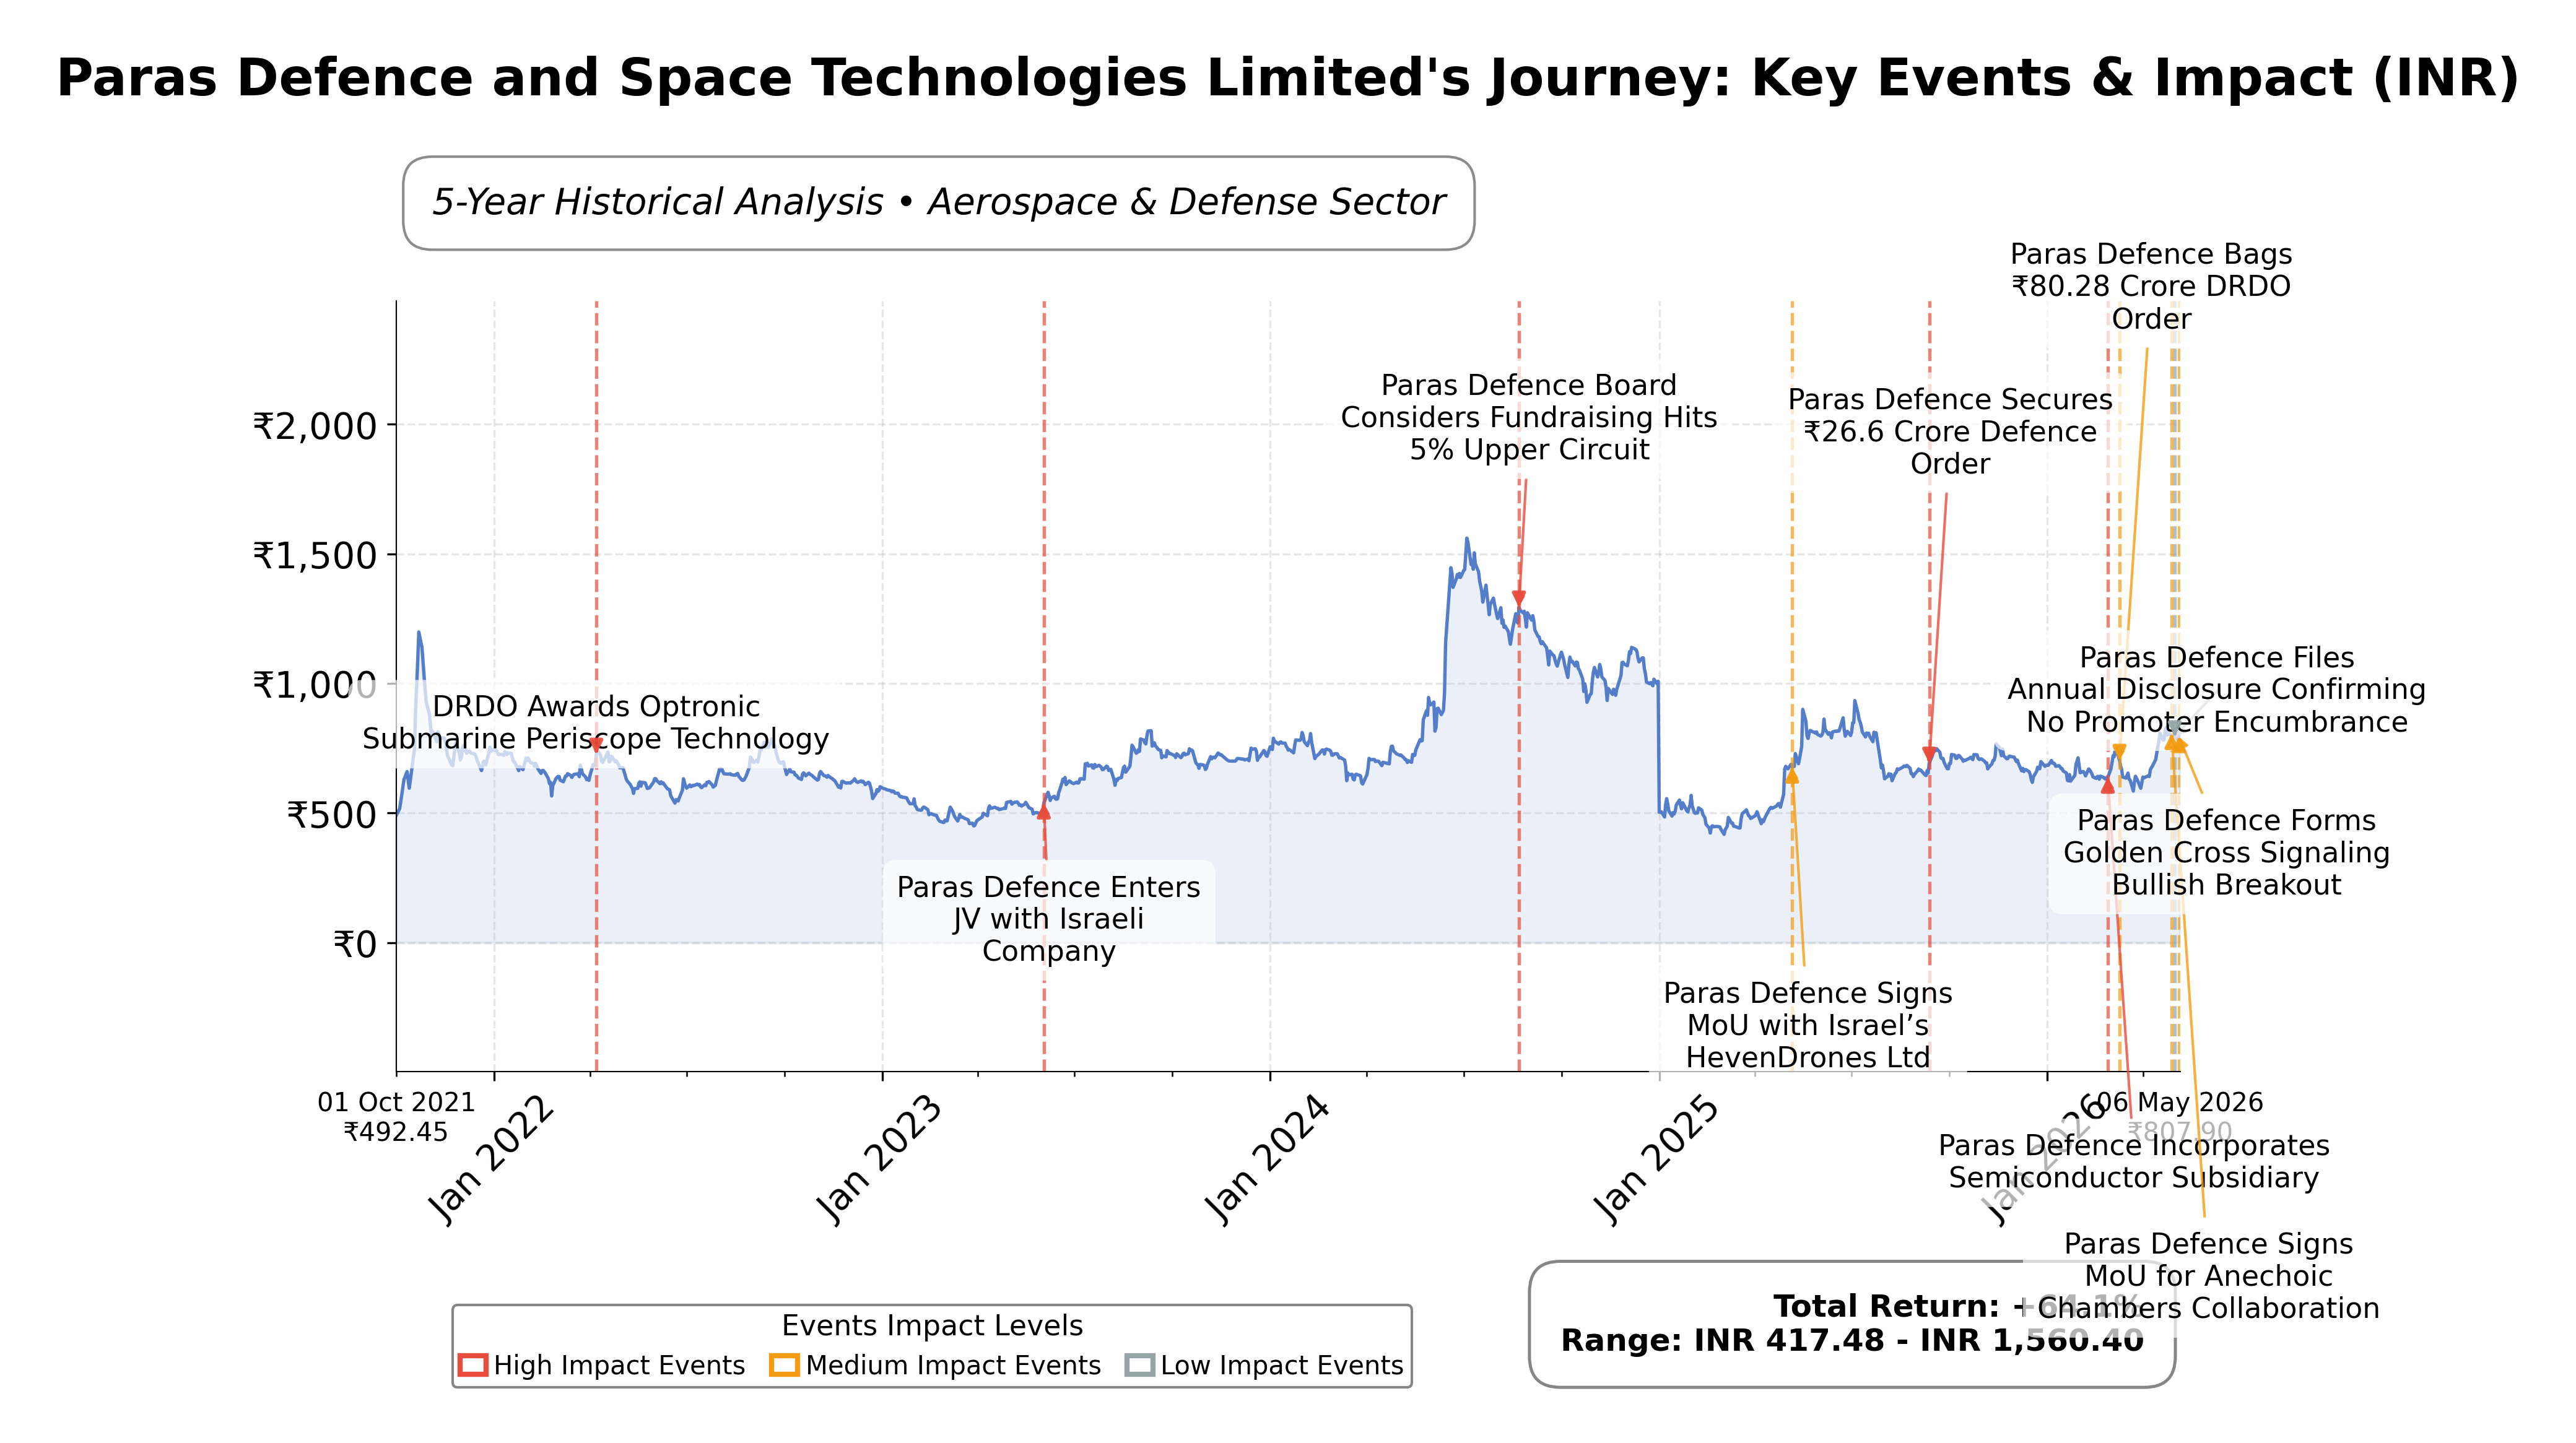
Stock Journey
Key Positives and Key Risks
Pros
- Revenue growth of 24% year-over-year demonstrates strong top-line expansion.
- Low debt-to-equity ratio of 0.084 reflects conservative financial leverage and stability.
- Strategic long-term partnership with Northstar enhances capabilities in aerial refuelling.
Cons
- High trailing P/E ratio of 77.5 and forward P/E of 55.5 indicate premium valuation.
- Negative operating cash flow of INR -104 million raises concerns about operational liquidity.
- Return on equity at 9.97% is modest compared to industry peers, suggesting room for profitability improvement.
Disclosure: This information is for general awareness and does not constitute investment advice
Report Summary
Paras Defence and Space Technologies Limited is an Indian company operating in the Aerospace & Defense sector, listed on the NSE. The company specializes in the design, development, manufacturing, and testing of defense and space engineering products, including defense electronics, electromagnetic pulse protection solutions, and space optics. It holds a significant position in the Indian defense ecosystem, serving government agencies and contributing to national security and space exploration efforts. Paras Defence's market presence is supported by its focus on advanced technology solutions for military avionics, naval systems, and space applications.
Financially, Paras Defence reported trailing twelve months (TTM) revenue of approximately INR 4.14 billion with a gross margin of 45.35%, indicating strong production efficiency. Its operating margin stands at 20.53%, and net profit margin is 17.75%, reflecting healthy profitability. Return on equity (ROE) is about 9.97%, and return on assets (ROA) is 7.45%, suggesting moderate effectiveness in utilizing shareholder equity and assets. The company’s return on invested capital (ROIC) is not explicitly stated but can be inferred as positive given its profit metrics.
Valuation metrics show a trailing price-to-earnings (P/E) ratio of 77.5 and a forward P/E of 55.5, both above the industry average of 77.5, indicating a premium valuation relative to earnings. The price-to-book (P/B) ratio is 9.06, and enterprise value to EBITDA (EV/EBITDA) is 57.18, suggesting the stock is priced at a high multiple compared to earnings and book value. The market capitalization is approximately INR 65.21 billion. The stock trades near INR 864.55, within a 52-week range of INR 972.50 (high) to INR 508.28 (low), currently closer to the upper end of this range.
Paras Defence’s strengths include a strong cash position of INR 894 million, low debt relative to equity (debt-to-equity ratio of 0.084), and leadership in niche defense technology segments. Key risks involve high valuation multiples, competitive pressures, and dependency on government contracts. Recent strategic actions include a long-term partnership with Northstar for aerial refueling capabilities and a memorandum of understanding (MoU) to build defense testing infrastructure, enhancing its technological capabilities and market positioning.
Technically, the stock has shown a golden cross with the 50-day moving average crossing above the 200-day moving average, signaling potential upward momentum. However, mixed momentum indicators suggest a nuanced outlook. Recent news reflects positive technical upgrades and strategic partnerships, indicating a complex but cautiously optimistic trajectory. The data suggests conditions warrant close observation for potential accumulation or realization of gains depending on evolving fundamentals and market sentiment.
Company and Industry Overview
Company Basics
Price Performance
Company Size
Shareholding Pattern
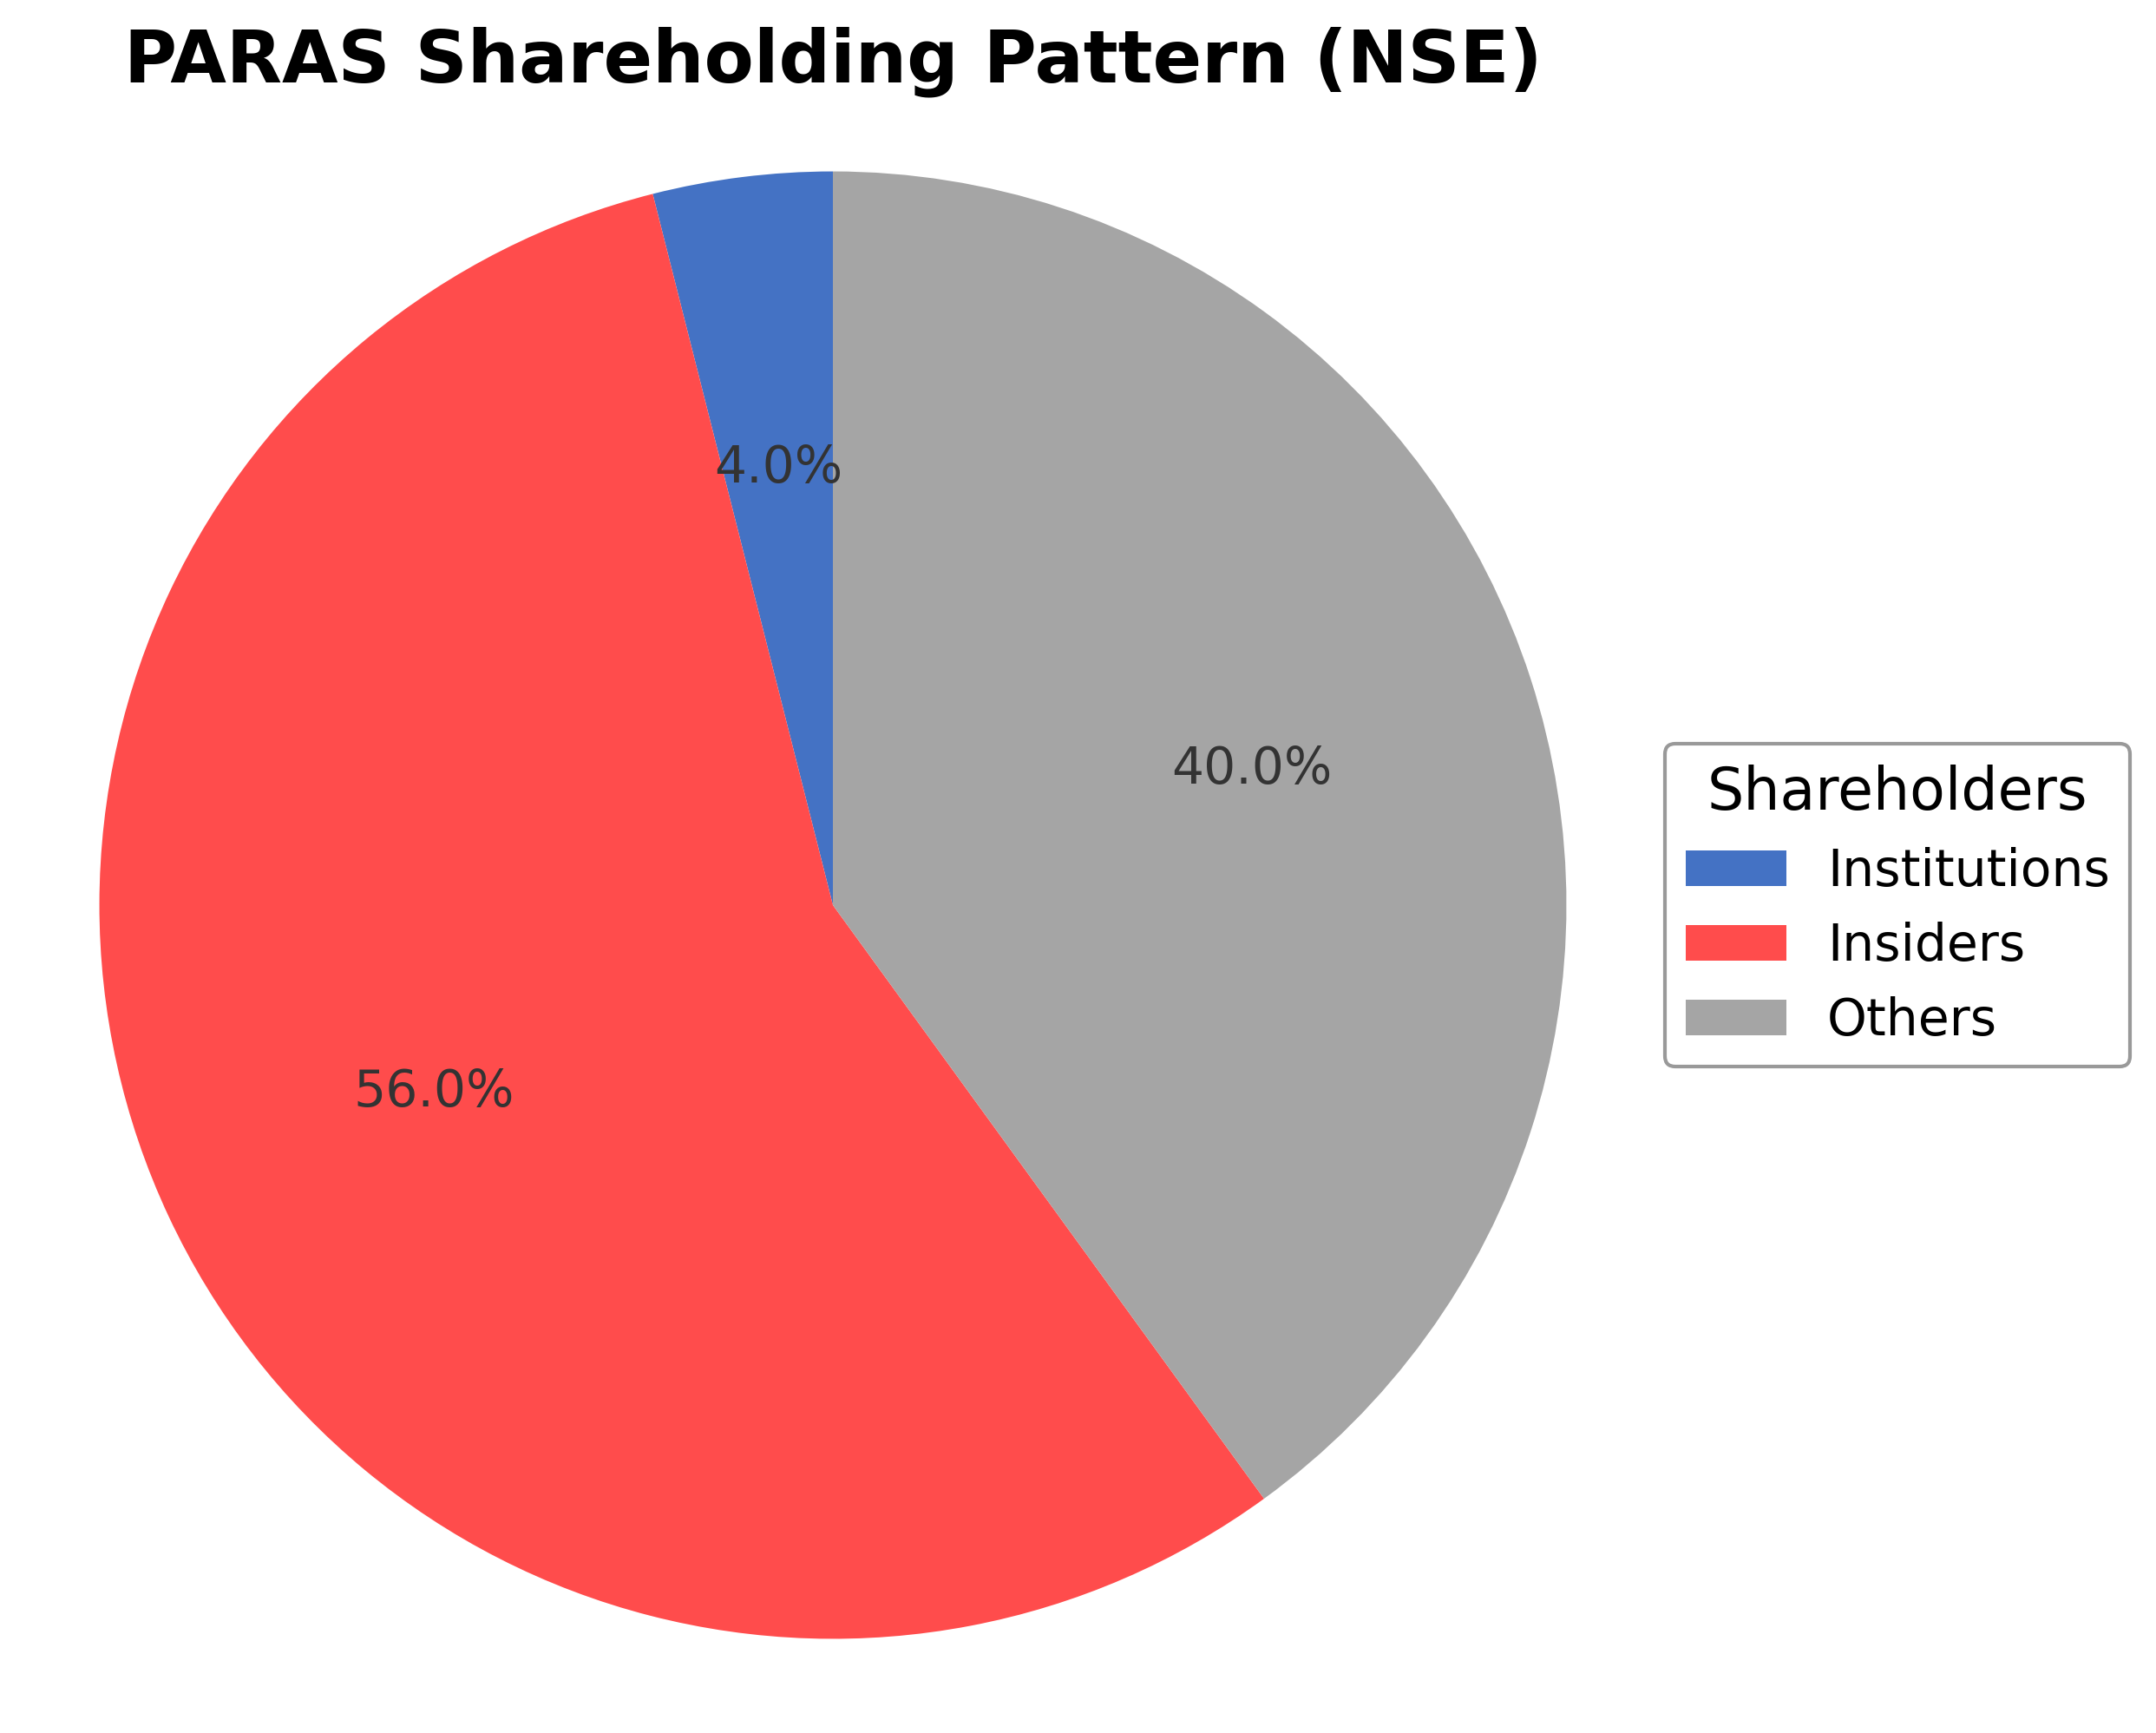
Paras Defence and Space Technologies Limited's ownership structure comprises approximately 56.05% held by insiders including executives and promoter group members, 3.95% by institutional investors such as mutual funds and pension funds, and the remaining 40% by public shareholders including retail investors and employee stock plans. Over the past 12-24 months, promoter shareholding has remained stable with no encumbrances reported, reflecting strong insider confidence. Institutional ownership is relatively low but stable, with no significant accumulation or distribution trends observed recently. This shareholding pattern suggests a governance structure dominated by promoters with moderate external investor participation, which may influence strategic decisions and corporate actions in alignment with promoter interests. The industry context remains competitive with high technology demands and regulatory oversight in the Aerospace & Defense sector.
Sector and Industry Analysis
The defense and space sector in India is a rapidly expanding market driven by increasing government expenditure on indigenous defense manufacturing and space exploration initiatives. The market size has seen consistent growth, with a compounded annual growth rate (CAGR) of around 20-25% over recent years, fueled by modernization programs and strategic partnerships. Key players include both public sector undertakings and private companies like Paras Defence and Space Technologies, Bharat Electronics, and Larsen & Toubro, which contribute significantly to the sector's output.
Industry trends highlight a shift towards advanced technologies such as defense electronics, space optics, and electromagnetic pulse protection solutions. The sector is characterized by high entry barriers due to stringent quality standards, technological complexity, and significant capital requirements. Competitive dynamics favor companies with strong R&D capabilities, government contracts, and diversified product portfolios, enabling firms like Paras Defence to maintain a leading position in niche segments despite intense competition.
The regulatory landscape is shaped by government policies promoting self-reliance under initiatives like Atmanirbhar Bharat, which encourage domestic production and reduce dependence on imports. Defense procurement procedures and export controls are tightly regulated, impacting operational flexibility and market access. Ongoing reforms aim to streamline licensing and enhance private sector participation, which is expected to sustain growth and innovation in the sector over the medium to long term.
Note: Analysis synthesized from industry research, market reports, and regulatory filings. Information is subject to change based on market conditions.
Financial Ratios Dashboard
Illustrative Scenario Analysis
DCF Assumptions:
Method: Two-Stage EPS-Priority Model
Financials
Peer Analysis
| Company Name | Market Cap | P/E Ratio | P/B Ratio | EV/EBITDA | Price to CFO |
|---|---|---|---|---|---|
| Paras Defence and Space Technologies Limited | ₹65.21B | 77.50 | 9.06 | 57.18 | -628.11 |
| Bharat Dynamics Ltd. | ₹500.03B | 86.73 | 11.92 | 99.17 | -90.15 |
| Bharat Electronics Limited | ₹3.15T | 52.98 | 14.65 | 39.26 | 145.09 |
| Data Patterns (India) Ltd. | ₹228.51B | 92.53 | 14.84 | 70.33 | -515.36 |
| Hindustan Aeronautics Ltd. | ₹2.90T | 32.51 | 7.80 | 29.89 | 31.72 |
| Garden Reach Shipbuilders & Engineers Ltd. | ₹335.73B | 49.03 | 14.69 | 49.02 | -580.73 |
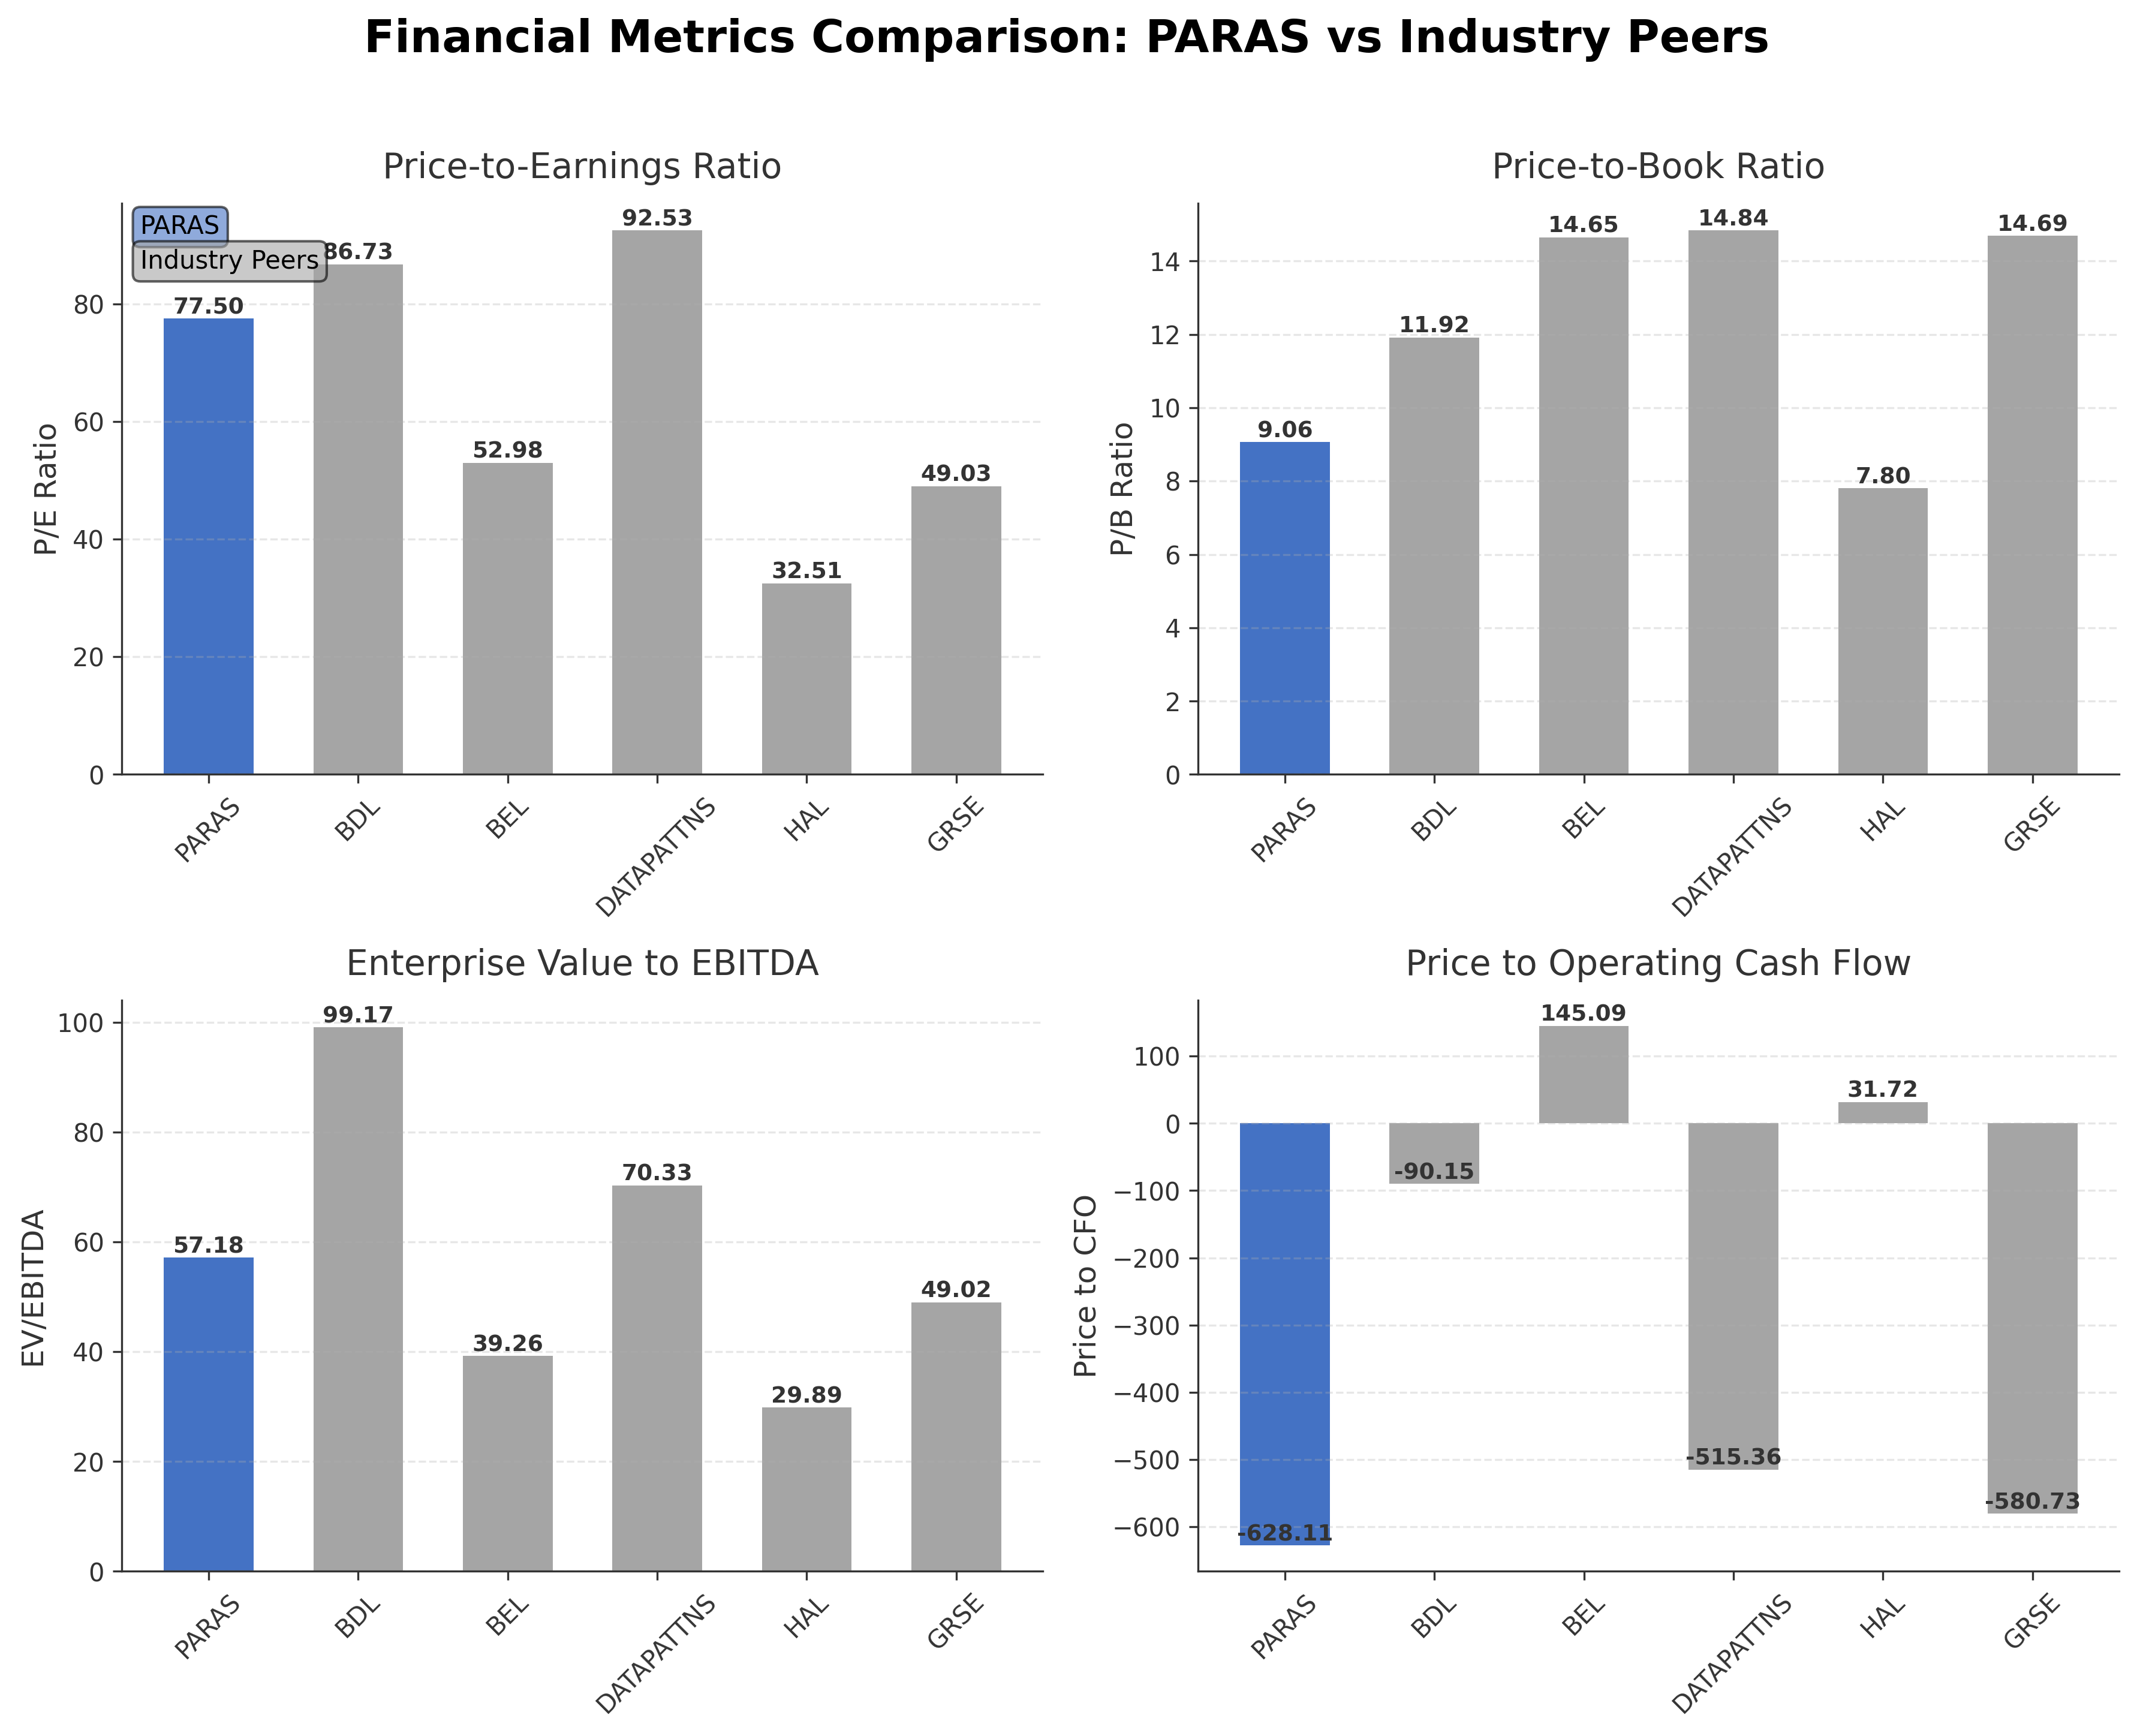
Comparison Analysis: Paras Defence and Space Technologies Limited trades at a lower market capitalization compared to major Indian aerospace and defense peers such as Bharat Dynamics Ltd. and Bharat Electronics Limited. Its P/E ratio of 77.5 is higher than Hindustan Aeronautics Ltd. (32.51) and Bharat Electronics (52.98) but lower than Data Patterns (92.53) and Bharat Dynamics (86.73), indicating a relatively high earnings multiple. The P/B ratio of 9.06 is below most peers except Hindustan Aeronautics (7.80), suggesting moderate valuation relative to book value. The EV/EBITDA multiple of 57.18 is significantly above the peer median, reflecting a premium valuation. Return on equity at 9.97% is lower than all listed peers, indicating comparatively lower profitability efficiency. Overall, Paras Defence shows a premium valuation with room for improvement in profitability metrics relative to its industry competitors.
Financial Metrics Comparison with Peers
Financial Statements
Comprehensive financial data including income, balance sheet, and cash flow metrics
Income Statement
| fiscal_date | 2025-03-31 | 2024-03-31 | 2023-03-31 | 2022-03-31 | 2021-03-31 |
|---|---|---|---|---|---|
| Sales | 3.65B | 2.53B | 2.21B | 1.83B | 1.43B |
| Cost Of Goods | 1.95B | 1.41B | 1.19B | 999.07M | 779.89M |
| Gross Profit | 1.70B | 1.13B | 1.02B | 826.14M | 653.41M |
| Operating Expense Selling General And Administrative | 190.24M | 168.88M | 130.04M | 83.56M | 59.08M |
| Operating Expense Other Operating Expenses | 109.99M | 87.45M | 87.93M | 39.27M | 21.66M |
| Operating Income | 870.20M | 418.88M | 481.66M | 453.53M | 358.06M |
| Non Operating Interest Income | 33.12M | 32.34M | 29.25M | 13.39M | 2.43M |
| Non Operating Interest Expense | 40.72M | 35.44M | 49.82M | 71.06M | 122.67M |
| Pretax Income | 836.01M | 404.69M | 468.45M | 365.73M | 226.10M |
| Income Tax | 221.09M | 104.31M | 109.05M | 94.96M | 68.24M |
| Net Income | 614.91M | 300.38M | 359.40M | 270.77M | 157.86M |
| Eps Basic | 8.01 | 8.22 | 9.25 | 7.78 | 5.53 |
| Eps Diluted | 8.01 | 8.22 | 9.25 | 7.78 | 5.53 |
| Basic Shares Outstanding | 79.25M | 39.00M | 39.00M | 34.80M | 28.44M |
| Diluted Shares Outstanding | 79.25M | 39.00M | 39.00M | 34.80M | 28.44M |
| Ebit | 876.72M | 440.12M | 518.27M | 436.79M | 348.77M |
| Ebitda | 1.01B | 540.86M | 596.51M | 560.28M | 446.94M |
| Net Income Continuous Operations | 836.01M | 404.69M | 468.45M | 365.73M | 226.10M |
| Minority Interests | 19.80M | 20.22M | 1.18M | -342.00K | -605.00K |
| Preferred Stock Dividends | 0.00 | 0.00 | 0.00 | 0.00 | 0.00 |
Source: Financial statements and regulatory filings
Balance Sheet
| fiscal_date | 2025-03-31 | 2024-03-31 | 2023-03-31 | 2022-03-31 | 2021-03-31 |
|---|---|---|---|---|---|
| Cash And Cash Equivalents | 344.72M | 29.82M | 171.07M | 21.80M | 46.83M |
| Accounts Receivable | 2.95B | 1.98B | 1.50B | 1.23B | 948.55M |
| Total Assets | 8.52B | 6.40B | 5.21B | 4.58B | 3.63B |
| Total Liabilities | 2.15B | 1.96B | 1.07B | 791.47M | 1.56B |
| Long Term Debt | 12.80M | 22.84M | 9.46M | 0.00 | 255.89M |
| Shareholders Equity | 6.37B | 4.43B | 4.13B | 3.79B | 2.07B |
Source: Financial statements and regulatory filings
Cash Flow Statement
| fiscal_date | 2025-03-31 | 2024-03-31 | 2023-03-31 | 2022-03-31 | 2021-03-31 |
|---|---|---|---|---|---|
| Operating Activities Net Income | 836.01M | 404.69M | 468.45M | 365.73M | 226.10M |
| Operating Activities Stock Based Compensation | 2.50M | N/A | N/A | N/A | N/A |
| Operating Activities Other Non Cash Items | 33.10M | 22.06M | 37.91M | 64.92M | 121.69M |
| Operating Activities Accounts Receivable | -968.11M | -731.80M | -186.87M | -422.45M | -196.69M |
| Operating Activities Other Assets Liabilities | -7.32M | -568.16M | -267.63M | 80.83M | -142.81M |
| Operating Activities Operating Cash Flow | -103.82M | -873.21M | 51.86M | 89.03M | 8.29M |
| Investing Activities Capital Expenditures | -350.91M | -258.20M | -237.75M | -59.90M | -52.64M |
| Investing Activities Net Acquisitions | 6.00M | -30.00K | -61.75M | -433.00K | 85.00K |
| Investing Activities Purchase Of Investments | -100.21M | -89.25M | -52.30M | -18.80M | -10.76M |
| Investing Activities Sale Of Investments | 72.50M | 30.00M | 20.10M | 0.00 | 90.00K |
| Investing Activities Other Investing Activity | -453.23M | 195.36M | 502.52M | -697.90M | N/A |
| Investing Activities Investing Cash Flow | -825.85M | -122.11M | 170.82M | -777.03M | -63.22M |
| Financing Activities Long Term Debt Issuance | 16.13M | 9.32M | 12.00M | 0.00 | 1.42M |
| Financing Activities Long Term Debt Payments | -23.58M | -2.82M | -489.00K | -380.11M | -52.78M |
| Financing Activities Short Term Debt Issuance | -407.71M | 493.36M | -247.52M | -212.23M | -78.95M |
| Financing Activities Common Stock Issuance | 1.32B | 4.80M | 0.00 | 1.57B | 479.67M |
| Financing Activities Other Financing Charges | -108.01M | -122.60M | -107.44M | 6.24M | -14.16M |
| Financing Activities Financing Cash Flow | 791.87M | 382.07M | -343.45M | 844.22M | 175.00M |
| End Cash Position | 344.72M | 29.82M | 171.07M | 21.80M | 46.83M |
| Free Cash Flow | 95.97M | -715.49M | 203.99M | 29.06M | -10.40M |
| Financing Activities Common Stock Repurchase | N/A | N/A | 0.00 | -139.70M | -160.20M |
Source: Financial statements and regulatory filings
Technical Analysis
Key Insights
- Current trend direction shows a recent bullish momentum supported by the formation of a golden cross where the 50-day moving average crossed above the 200-day moving average.
- Key support levels are identified near ₹652.45 (50-day MA) and ₹685.05 (200-day MA), while resistance is near the 52-week high of ₹972.50.
- The stock price is currently trading above both the 50-day and 200-day moving averages, indicating positive medium- to long-term trend strength.
- Momentum indicators show mixed signals: RSI is moderate, MACD has recently turned positive, and Stochastic oscillators indicate potential short-term consolidation.
- Multi-timeframe analysis reveals daily and weekly charts favoring bullish momentum, while monthly charts suggest cautious optimism due to valuation levels.
- Potential market scenarios include continuation of upward momentum if support levels hold, or a sideways consolidation phase if resistance near ₹972.50 proves strong.
Trending News
1. Headline: Expert strategy Jio Fin, HFCL, Paras Defence: Target prices, outlook |Daily Calls on BTTV - BusinessToday
Summary: At Daily Calls on BTTV, Anshul Jain from Lakshmishree Investment & Securities shared his views on select financial, telecom and defence stocks.
Sentiment: neutral
2. Headline: Paras Defence and Space Technologies Ltd Upgraded to Hold on Technical and Valuation Improvements
Summary: Paras Defence and Space Technologies Ltd has seen its investment rating upgraded from Sell to Hold, reflecting a notable improvement in technical indicators and valuation metrics despite flat recent financial performance. The aerospace and defence company’s enhanced technical trend, coupled ...
Sentiment: positive
3. Headline: Paras Defence and Space Technologies Ltd Shows Bullish Momentum Amid Technical Upgrades
Summary: Paras Defence and Space Technologies Ltd has experienced a notable shift in its technical momentum, moving from a mildly bearish stance to a more bullish outlook. This change is underpinned by a combination of technical indicators including MACD, moving averages, and Bollinger Bands, signalling ...
Sentiment: positive
Summary: The 50-day moving average has crossed above the 200-day moving average for Paras Defence and Space Technologies Ltd on 5 May 2026, signalling a golden cross. Yet, while the stock gained 1.36% on the day, the broader technical indicators present a nuanced picture that tempers the enthusiasm ...
Sentiment: positive
5. Headline: Paras Defence and Space Technologies Ltd Faces Mildly Bearish Technical Shift Amid Mixed Momentum Signals
Summary: Paras Defence and Space Technologies Ltd, a small-cap player in the Aerospace & Defence sector, has recently experienced a shift in price momentum, moving from a sideways trend to a mildly bearish stance. Despite a strong year-to-date return of 14.5%, technical indicators present a nuanced ...
Sentiment: positive
Recent Updates
News Summary
As of April 28, 2026. Paras Defence and Space Technologies Limited has recently entered into a strategic three-way memorandum of understanding to develop specialized defense testing infrastructure, including anechoic chambers critical for radar and antenna testing. The company will lead design, manufacturing, and client engagement, signaling a move toward greater project ownership in defense electronics infrastructure. Additionally, Paras Defence signed a long-term exclusive ten-year agreement with Northstar to develop aerial refuelling capabilities within India, enhancing its position in a specialized aerospace segment aligned with national defense priorities. The company also filed annual regulatory disclosures confirming no promoter share encumbrance for FY26, indicating stable insider ownership and governance. These developments collectively position Paras Defence to expand its technological capabilities and strategic footprint, although near-term financial impact from these initiatives remains limited pending contract execution.
News Sentiment
The overall sentiment from recent updates is cautiously positive, driven by strategic partnerships and infrastructure development initiatives that enhance Paras Defence’s capabilities in niche defense segments. The Northstar aerial refuelling deal and the MoU for defense testing infrastructure reflect growth-oriented moves that have been well received by the market, as evidenced by stock price gains. However, the absence of immediate financial impact from these agreements tempers enthusiasm, maintaining a balanced outlook. The confirmation of unencumbered promoter shareholding supports governance stability, further reinforcing investor confidence. Together, these factors suggest a constructive but measured sentiment toward the company’s near-term prospects.
Source List
- https://hdfcsky.com/news/paras-defence-signs-pact-to-build-defence-testing-capabilities-shares-steady
- https://hdfcsky.com/news/paras-defence-signs-northstar-agreement
- https://scanx.trade/stock-market-news/companies/paras-defence-and-space-technologies-files-annual-disclosure-confirming-no-promoter-share-encumbrance-for-fy26/39161603
Analytical Overview
Analysis Summary
Paras Defence’s valuation metrics, including a trailing P/E of 77.5 and forward P/E of 55.5, are elevated relative to the industry average P/E of 77.5, indicating a premium valuation that reflects growth expectations but also higher risk. The company’s revenue growth rate of 24% year-over-year and positive quarterly earnings growth of 21.1% demonstrate a robust growth trajectory supported by expanding defense contracts and strategic partnerships. Financial health appears solid with a low debt-to-equity ratio of 0.084 and a strong current ratio of 2.68, although operating cash flow is negative at INR -104 million, offset by positive free cash flow of INR 635 million, suggesting effective cash management.
Sector-specific challenges include the capital-intensive nature of defense manufacturing and dependency on government procurement cycles, while opportunities arise from India’s increasing focus on domestic defense production and modernization. Considering India-specific factors, regulatory support for indigenous defense manufacturing and growing defense budgets provide a favorable backdrop, although geopolitical risks and budgetary constraints remain considerations.
Overall Business and Market Assessment
Supporting Factors: Paras Defence’s strong revenue and earnings growth, strategic partnerships such as the Northstar aerial refuelling deal, and a solid balance sheet with low leverage
Risk Factors: the high valuation multiples relative to earnings, negative operating cash flow trends, and execution risks associated with converting MoUs into revenue
SWOT Analysis
Strengths
- Strong revenue growth of 24% year-over-year.
- Low debt-to-equity ratio of 0.084 indicating financial stability.
- Strategic partnerships enhancing technological capabilities.
- Leading position in niche defense and aerospace segments.
Weaknesses
- High valuation multiples with P/E ratio of 77.5.
- Negative operating cash flow despite positive free cash flow.
- Relatively low institutional ownership at 3.95%.
- Profitability metrics such as ROE at 9.97% are modest compared to peers.
Opportunities
- Increasing domestic defense manufacturing and procurement.
- Expansion into aerial refuelling and defense testing infrastructure.
- Government initiatives supporting indigenous defense technology.
- Potential for export growth in satellite communication technologies.
Threats
- Competitive pressures from larger defense companies.
- Dependence on government contracts and regulatory approvals.
- Geopolitical risks affecting defense spending.
- Execution risks in converting strategic agreements into revenue.
Company Description
Paras Defence and Space Technologies Limited is an Indian company specializing in the design, development, manufacturing, and testing of a variety of defense and space engineering products. The company's primary function is to provide sophisticated technology solutions to the defense and space sectors, contributing significantly to national security and space exploration endeavors. Paras Defence engages in the production of defense electronics, electromagnetic pulse protection solutions, and heavy engineering products that play a pivotal role in modern defense systems. In the defense sector, the company impacts areas such as military avionics, naval systems, and electro-magnetic pulse protection, offering products that are crucial to enhancing the capabilities of armed forces. Additionally, in the space sector, Paras Defence contributes to space optics and opto-mechanical assemblies, supporting India's burgeoning space exploration industry. Paras Defence and Space Technologies Limited holds significant market significance due to its integral role in the defense and aerospace ecosystem, leveraging cutting-edge technology to meet the strategic needs of government agencies and contributing to national scientific advancements.