
Palantir Technologies Inc (PLTR)
Stock Analysis Report
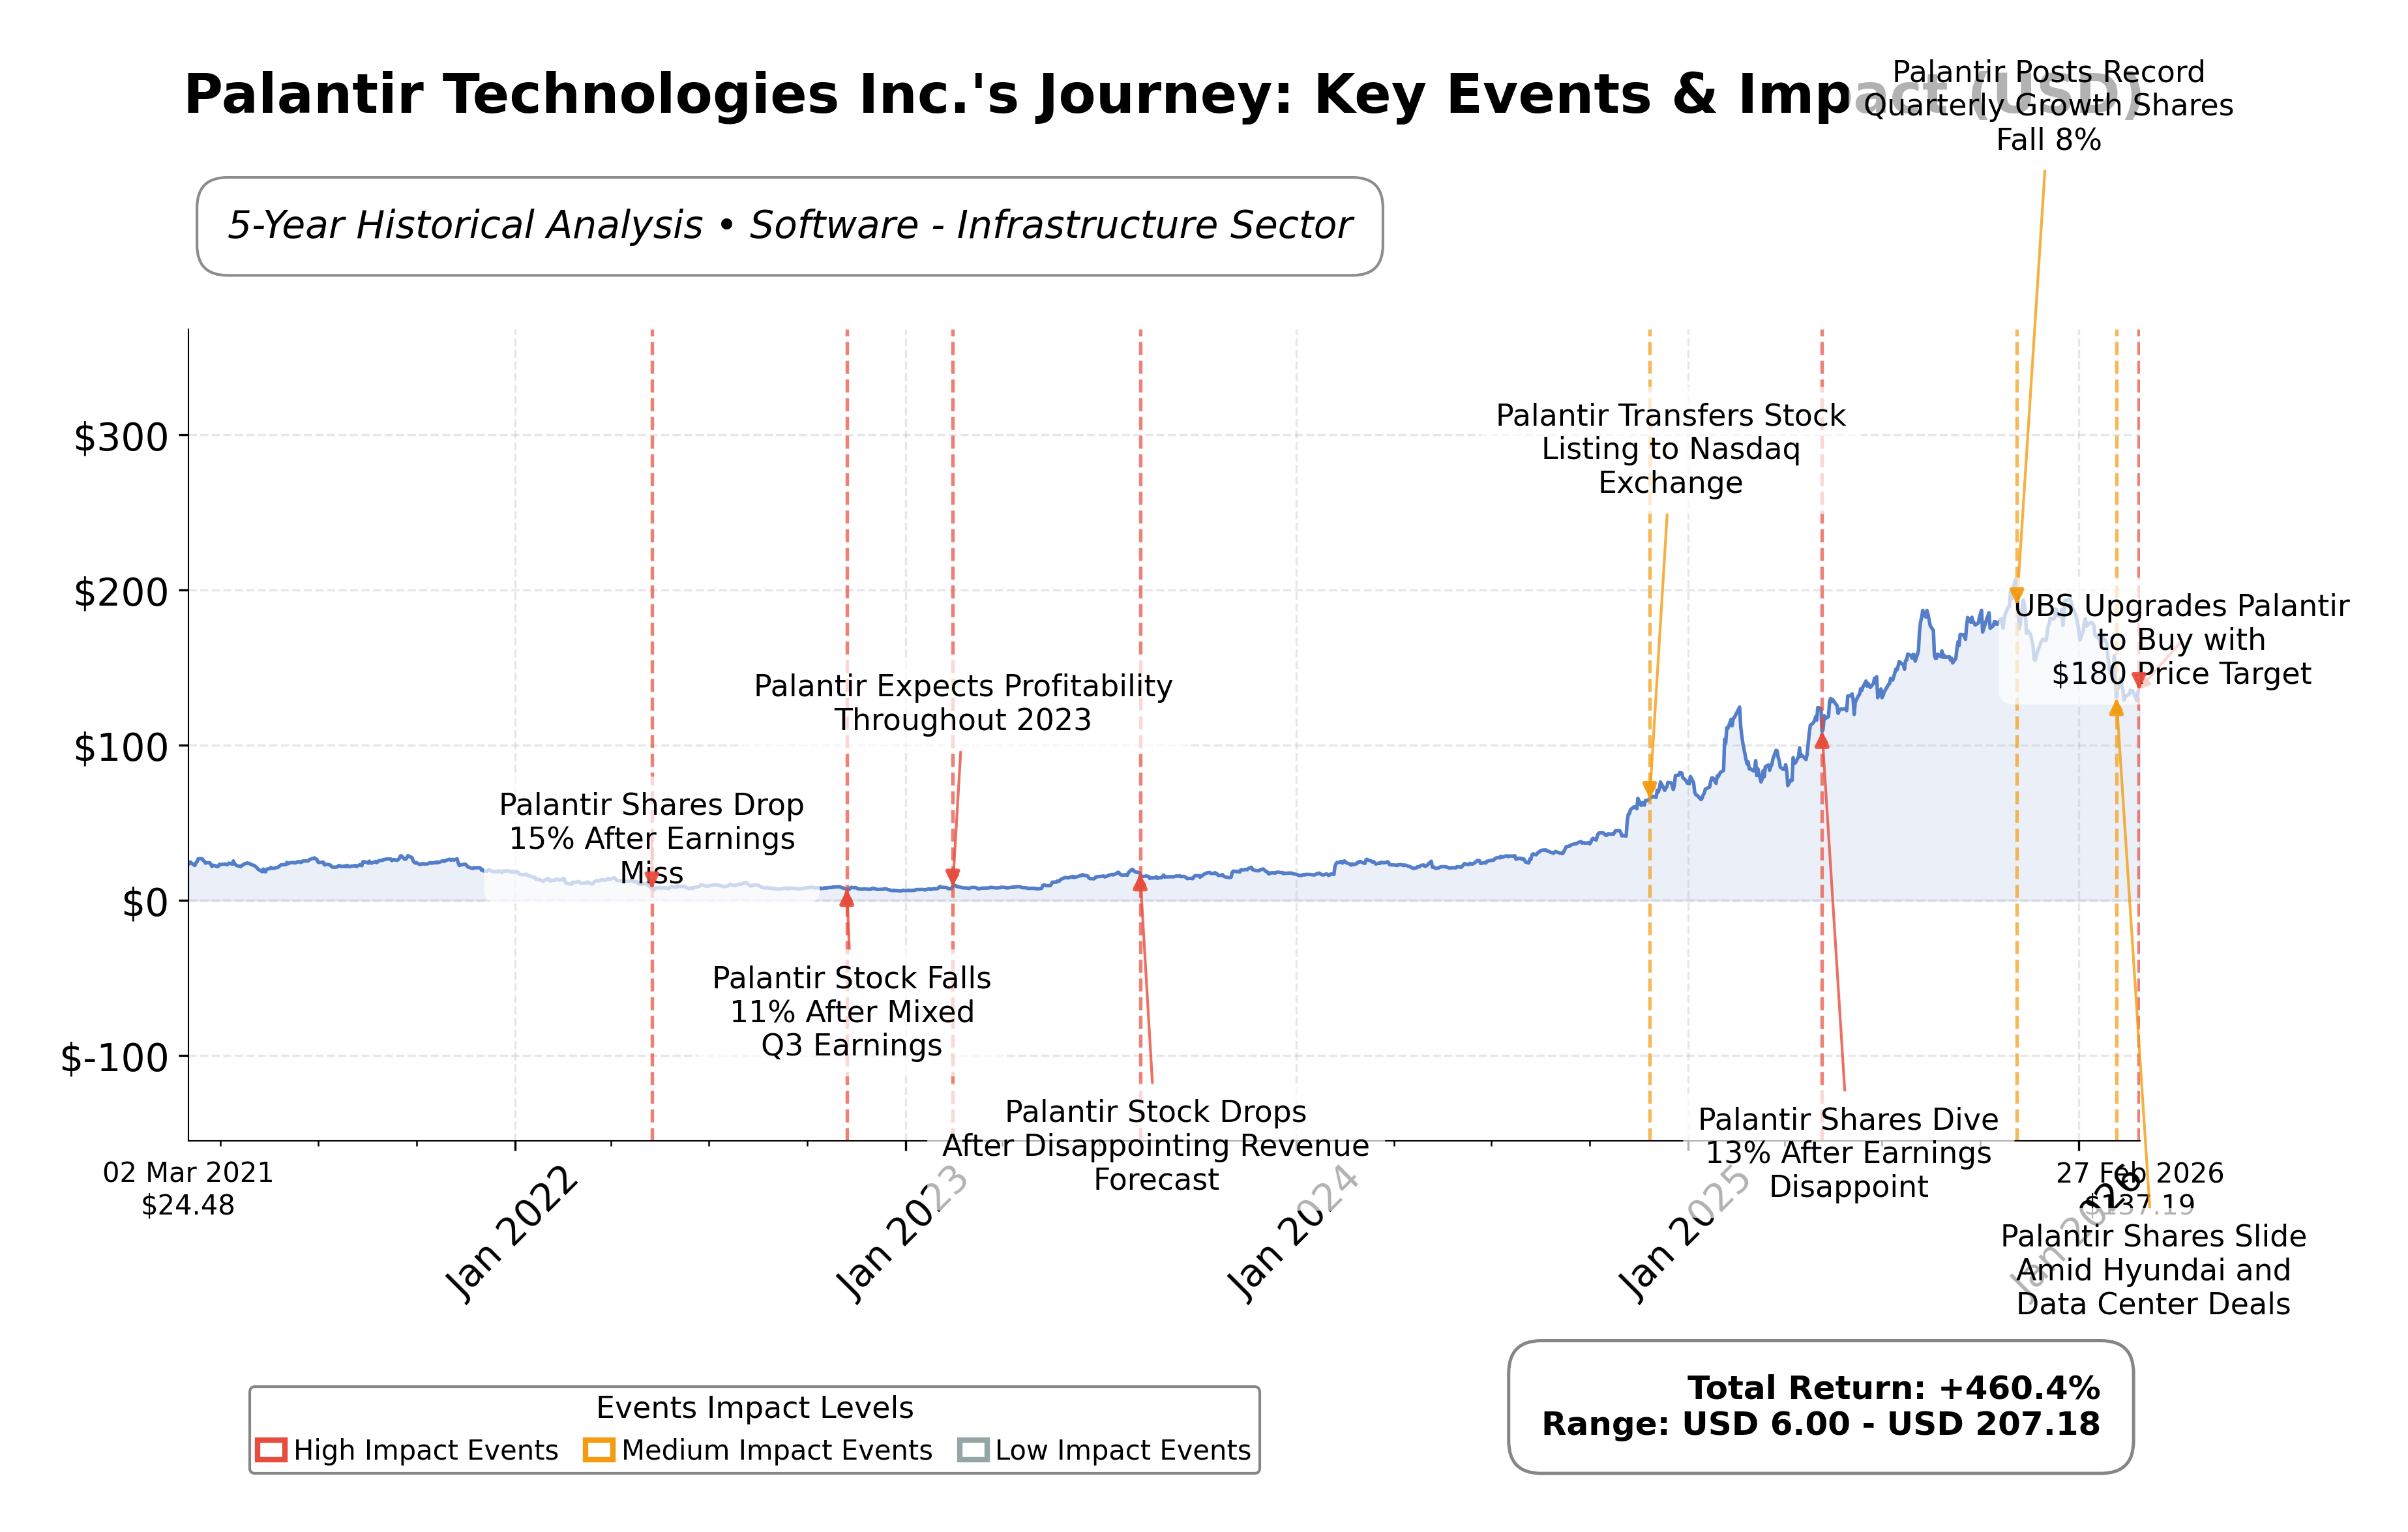
Stock Journey
Key Positives and Key Risks
Pros
- Quarterly revenue growth of 70% demonstrates strong top-line expansion.
- Gross margin of 84.65% indicates high operational profitability.
- Current ratio of 7.11 and cash reserves of $7.18 billion reflect robust liquidity.
Cons
- Trailing P/E ratio of 217.76 suggests elevated valuation risk.
- Institutional selling evidenced by significant position reductions from R Squared Ltd and Cache Advisors LLC.
- Price-to-cash-flow ratio of 153.72 indicates premium pricing relative to cash generation.
Disclosure: This information is for general awareness and does not constitute investment advice
Report Summary
Palantir Technologies Inc. operates as a leading analytical software company specializing in data integration and analysis platforms. It primarily serves government clients through its Gotham platform, aiding counterterrorism efforts, and commercial clients via Foundry, which centralizes data for operational efficiency. Founded in 2003 and headquartered in Denver, Colorado, Palantir is positioned within the software infrastructure segment of the technology sector, focusing on Western-allied nations and supporting intelligence communities globally.
Financially, Palantir presents a market capitalization of approximately $328.11 billion with a trailing P/E ratio of 217.76 and a forward P/E of 74.23, reflecting high valuation multiples relative to earnings. The company reported a robust gross margin of 84.65% and a profit margin of 36.31%, alongside a quarterly revenue growth rate of 70%. Its balance sheet shows strong liquidity with a current ratio of 7.11 and total cash of about $7.18 billion, while maintaining low total debt of $229 million. Return on equity stands at 25.98%, indicating effective capital utilization.
From a strategic perspective, Palantir has recently experienced mixed market sentiment amid leadership and partnership developments. Technical indicators reveal a beta of 1.69, suggesting higher volatility, with the stock price currently near $137.21, below its 52-week high of $207.52. Notable risks include high valuation multiples and institutional selling pressure, while strengths encompass strong cash flow generation and strategic government contracts. Recent news highlights both positive analyst upgrades and concerns regarding competitive positioning in AI and defense sectors.
In comparison to its industry peers in the United States software infrastructure space, Palantirâs valuation metrics are significantly elevated. For instance, Microsoft and Oracle exhibit lower P/E ratios of 24.58 and 27.33 respectively, and more moderate EV/EBITDA multiples. Palantirâs return on equity is competitive but not markedly superior. Peer companies such as Synopsys and Palo Alto Networks show lower price-to-cash-flow and EV/EBITDA ratios, indicating more conservative valuations relative to Palantirâs premium pricing.
Palantir navigates a complex industry landscape marked by rapid technological innovation and evolving government and commercial demands. The companyâs recent achievements include strong revenue growth and strategic partnerships, yet it faces ongoing challenges such as high valuation scrutiny and competitive pressures in AI and data analytics. The stakes involve maintaining its market leadership and justifying premium valuations amid shifting investor sentiment and sector dynamics. Given the current data, a balanced perspective may be appropriate, reflecting both the companyâs growth potential and valuation risks.
Company and Industry Overview
Company Basics
Price Performance
Company Size
Shareholding Pattern
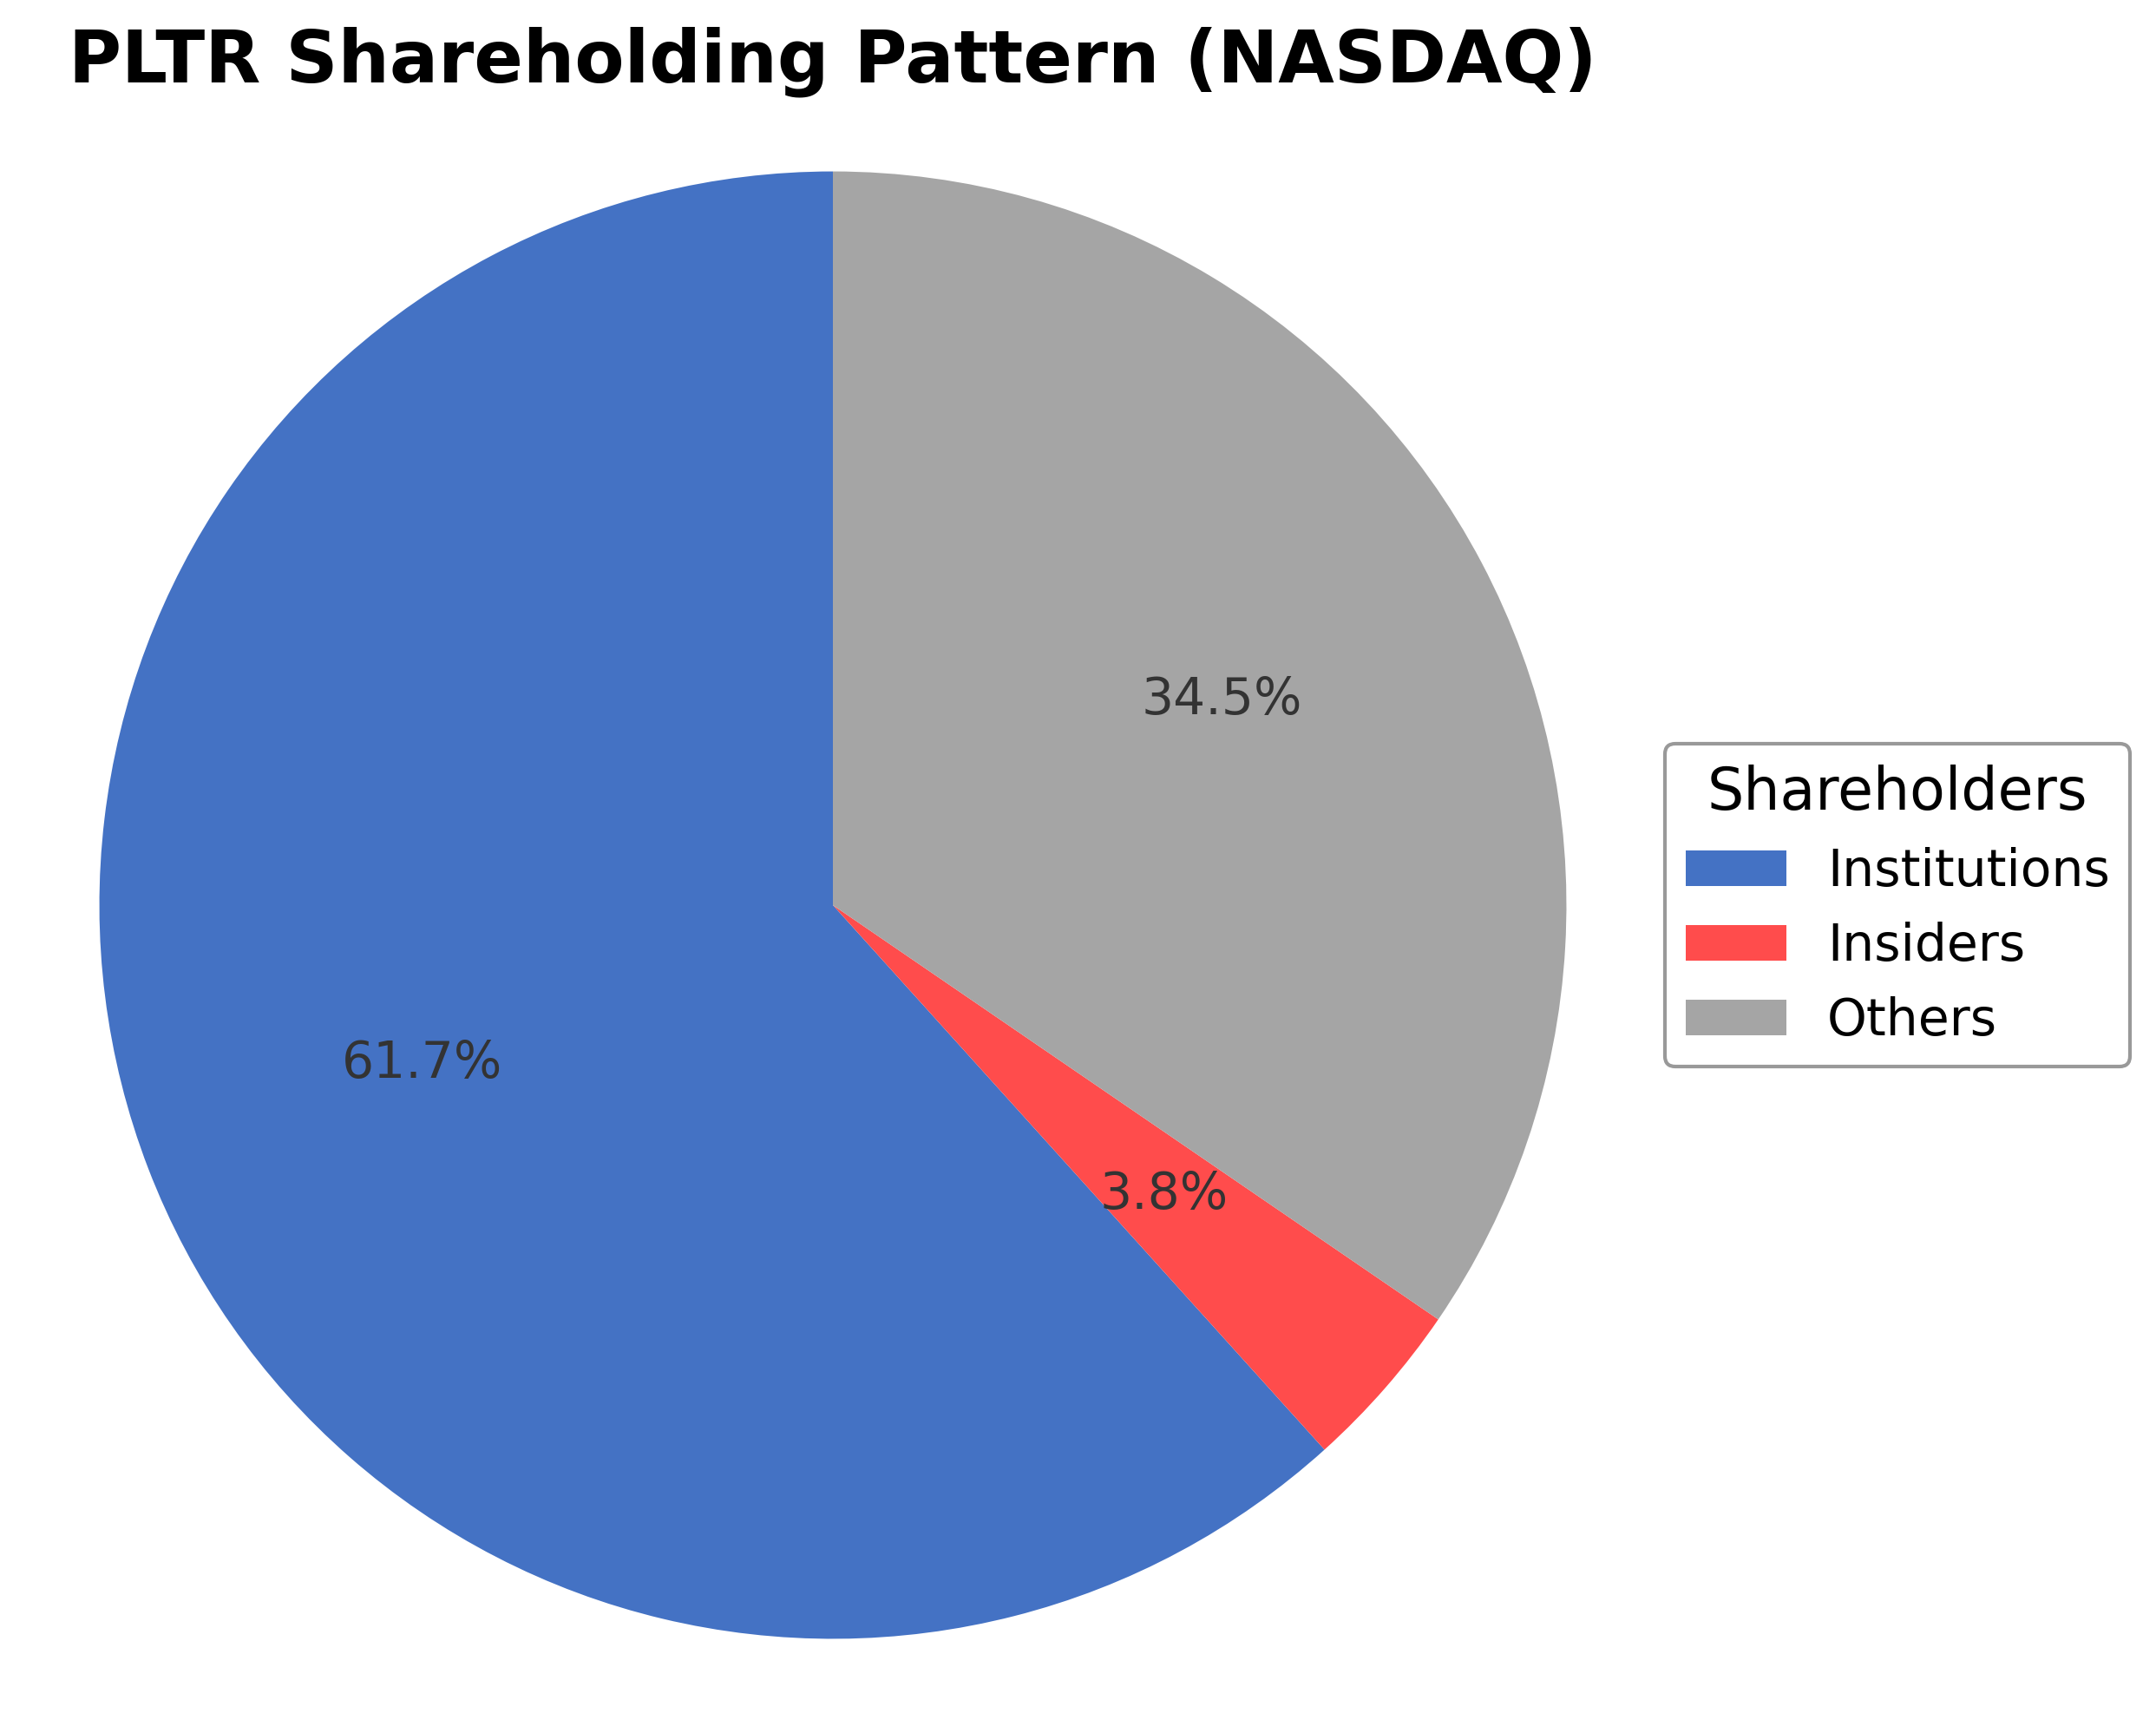
Palantir Technologies Inc.'s ownership structure comprises approximately 3.76% insiders, including executives and board members, 61.69% institutional investors such as mutual funds and asset managers, and 34.55% held by public shareholders including retail investors and employee stock plans. Over the past 12-24 months, institutional ownership has shown mixed activity with some funds like Arete Wealth Advisors LLC increasing their holdings by 23.5%, while others such as R Squared Ltd and APG Asset Management N.V. significantly reduced positions. These patterns indicate a nuanced market sentiment with active portfolio rebalancing among major stakeholders. The current ownership distribution suggests a governance framework influenced heavily by institutional investors, which may impact strategic decisions and corporate actions going forward.
Sector and Industry Analysis
Palantir Technologies Inc. (PLTR) operates within the broader Information Technology sector, specifically in the data analytics and enterprise software industry. This sector is characterized by rapid innovation and significant growth driven by increasing digital transformation initiatives across public and private sectors globally. The global data analytics market, valued in the hundreds of billions of USD, is expected to sustain a robust compound annual growth rate (CAGR) in the mid-to-high single digits over the next five years, fueled by expanding big data adoption, cloud computing integration, and AI-driven analytics. Key players alongside Palantir include established software giants like IBM, Microsoft, and Oracle, as well as specialized analytics firms such as Splunk and Snowflake, each competing to provide scalable, secure, and customizable data solutions.
Industry trends reflect a strong shift towards AI and machine learning integration within analytics platforms, enabling predictive insights and automation that enhance operational efficiency. Palantir’s platforms—Foundry for commercial clients and Gotham for government agencies—capitalize on these trends by offering tailored analytics solutions that emphasize data integration, security, and real-time decision-making. Consumer behavior within this industry increasingly demands interoperability, ease of deployment, and compliance with data privacy standards. Emerging opportunities lie in sectors such as healthcare, financial services, defense, and smart cities, where data-driven decision-making is becoming mission-critical. Additionally, the geopolitical emphasis on working exclusively with Western-allied nations positions Palantir uniquely in a market where data sovereignty and national security concerns are paramount.
The regulatory landscape for Palantir and its peers is complex and evolving, shaped by data privacy laws such as GDPR in Europe, CCPA in California, and sector-specific regulations in defense and government contracting. Compliance with these regulations requires stringent data governance, transparency, and cybersecurity measures. Furthermore, government contracts often involve rigorous oversight, export controls, and adherence to national security protocols, which can both create barriers and provide competitive moats. Policy shifts towards increased scrutiny of AI ethics, data usage, and cross-border data flows could impose additional compliance costs but also create differentiation opportunities for companies with robust governance frameworks.
Competitive dynamics in the data analytics software industry are defined by high technological barriers to entry, including the need for advanced AI capabilities, extensive data integration expertise, and strong client relationships, especially in government sectors. Palantir’s insider ownership structure, with significant stakes held by founders and executives, supports strategic continuity and innovation focus. The market is moderately concentrated with a few dominant players, but niche specialization and platform differentiation remain critical for competitive positioning. Customer lock-in through platform integration and long-term contracts is common, creating switching costs that benefit incumbents. However, rapid technological evolution demands continuous investment in R&D and agility to maintain leadership in this highly competitive and strategically important industry.
Note: Analysis synthesized from industry research, market reports, and regulatory filings. Information is subject to change based on market conditions.
Illustrative Scenario Analysis
DCF Assumptions:
Method: Two-Stage EPS-Priority Model
Financials
Peer Analysis
| Company Name | Market Cap | P/E Ratio | P/B Ratio | EV/EBITDA | Price to CFO |
|---|---|---|---|---|---|
| Palantir Technologies Inc. | $328.11B | 217.76 | 44.41 | 223.09 | 153.72 |
| Synopsys, Inc. | $79.21B | 51.3 | 2.59 | 48.84 | 32.42 |
| Fortinet Inc. | $60.56B | 32.73 | 47.57 | 24.66 | 23.38 |
| CrowdStrike Holdings Inc. | $93.78B | 716.55 | 23.35 | -957.49 | 64.22 |
| Microsoft Corp. | $2.92T | 24.58 | 7.46 | 16.83 | 18.19 |
| Oracle Corporation | $417.89B | 27.33 | 13.95 | 20.19 | 18.74 |
| Block, Inc. | $33.83B | 52.07 | N/A | 12.11 | 16.69 |
| Palo Alto Networks Inc. | $121.52B | 83.0 | 11.18 | 78.72 | 30.58 |
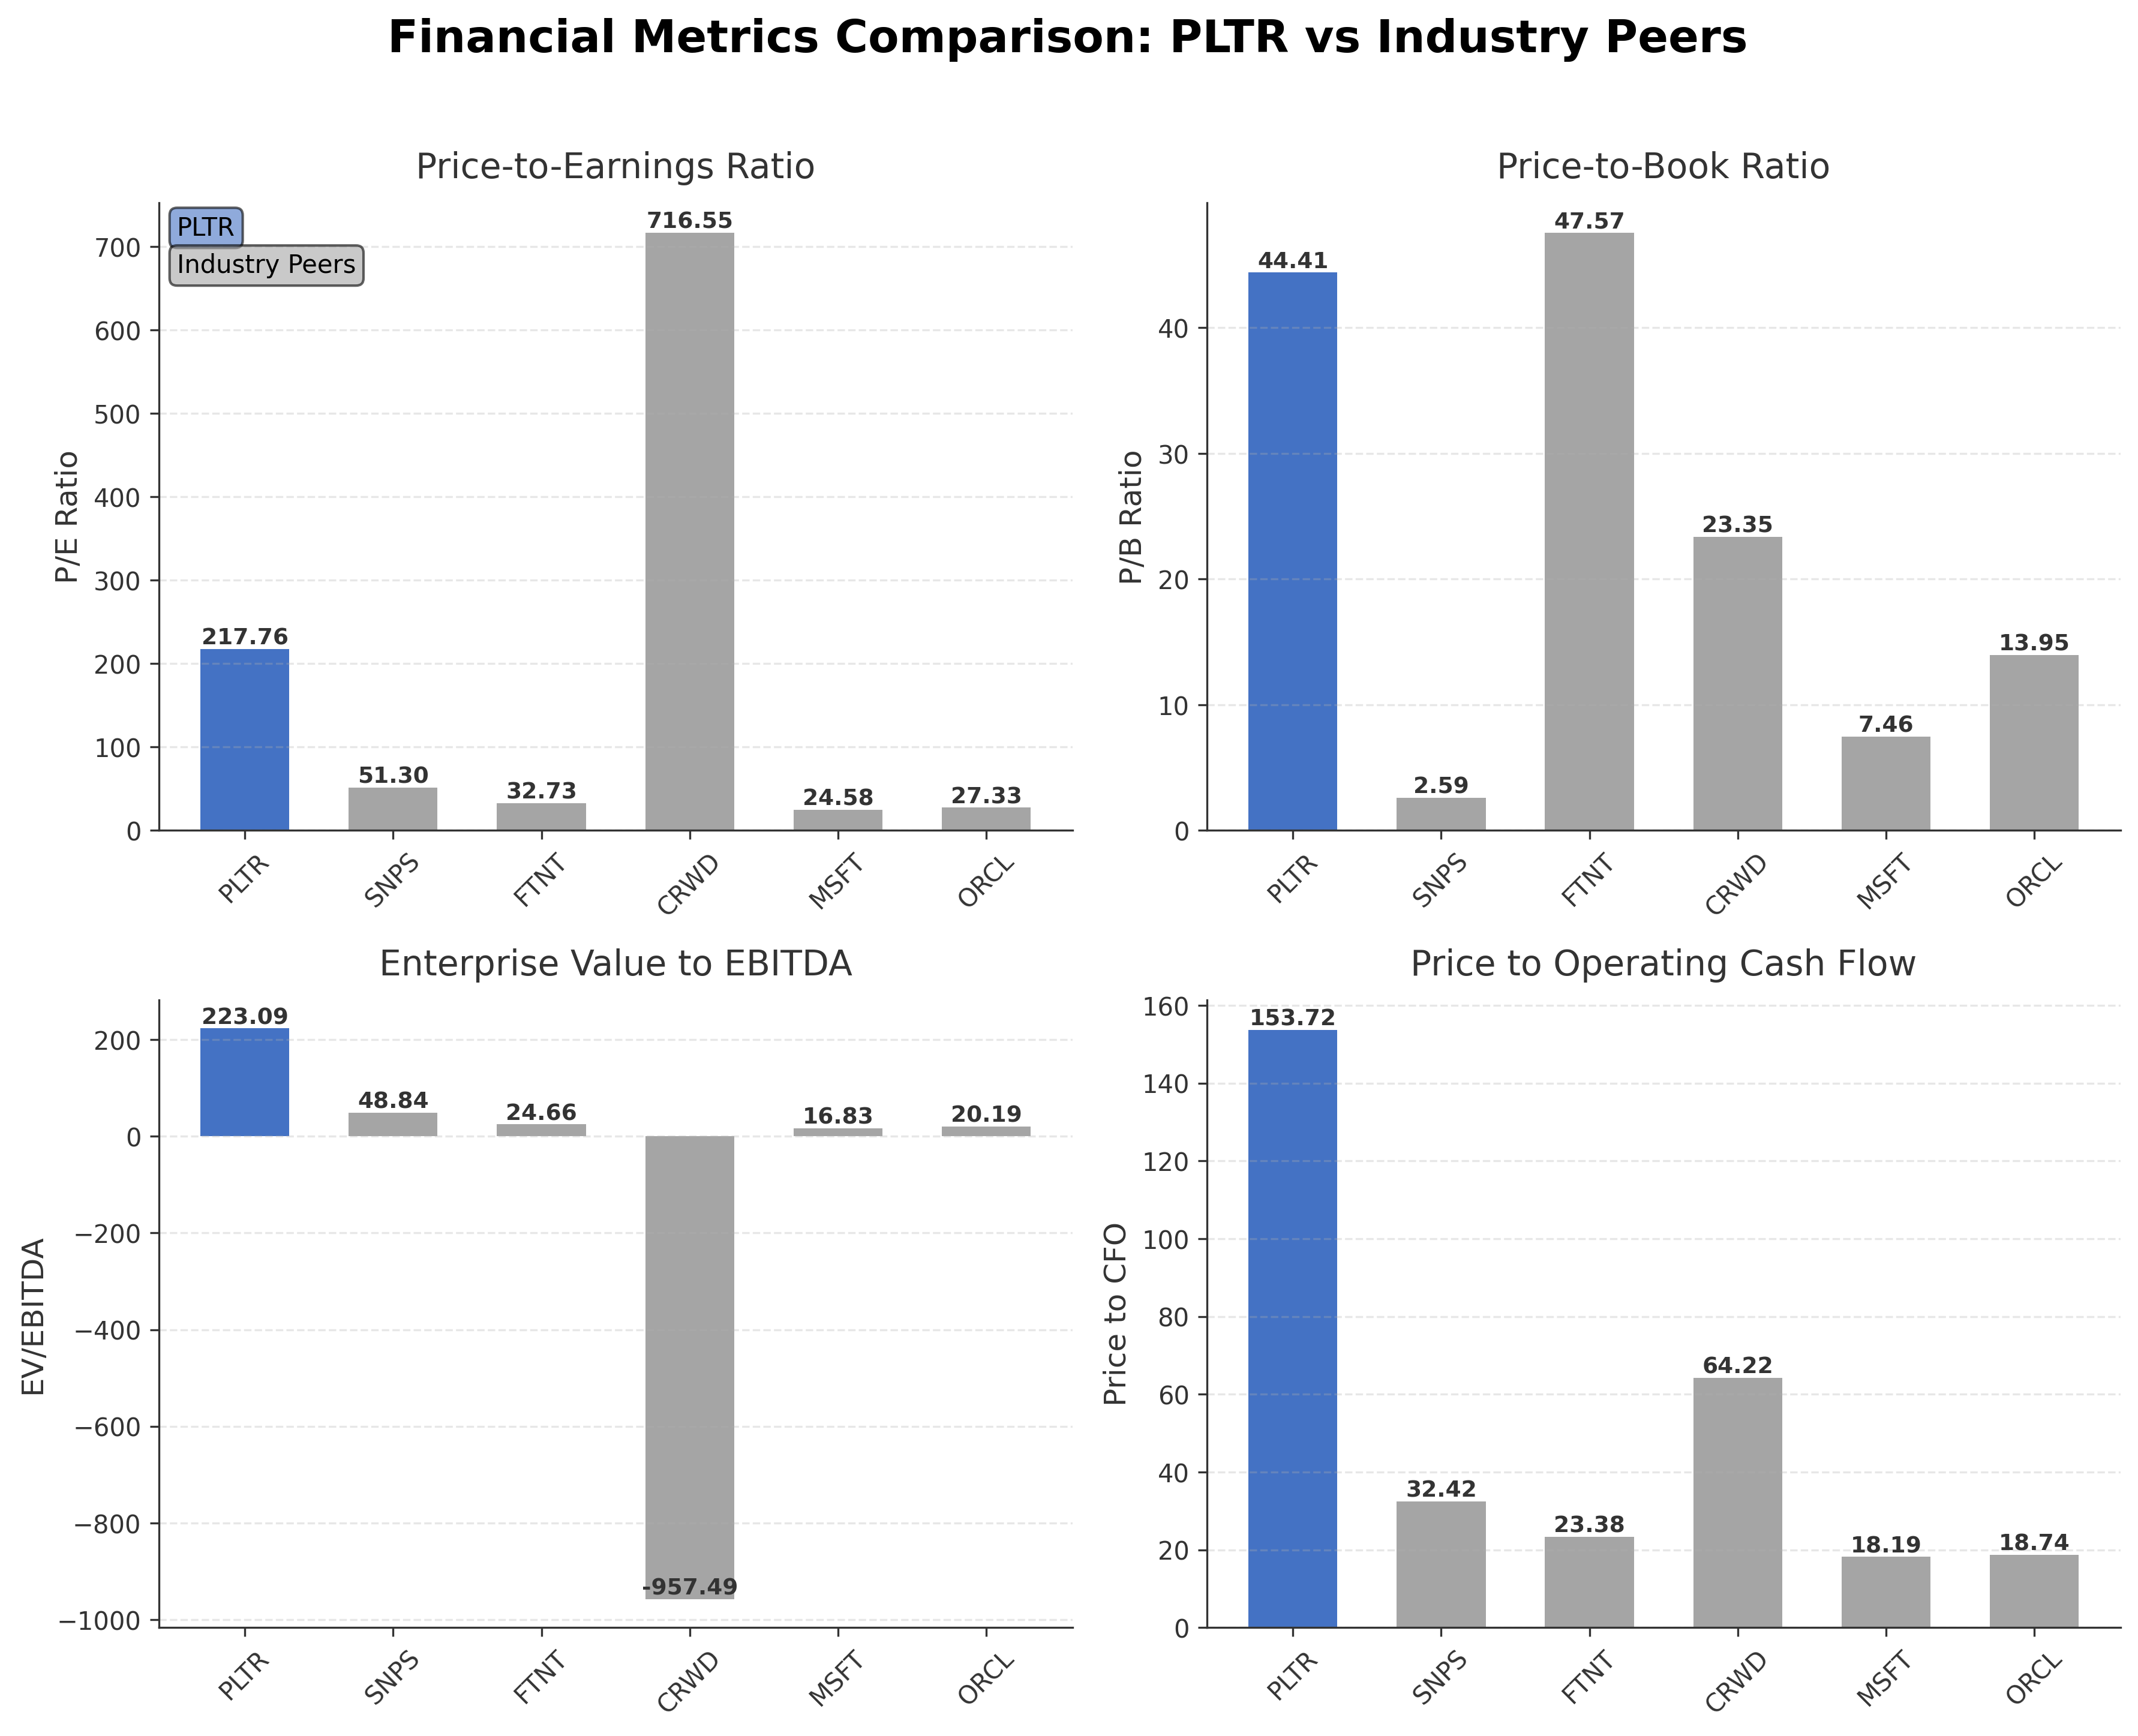
Comparison Analysis: Palantir Technologies Inc. exhibits substantially higher valuation multiples compared to its regional industry peers, with a trailing P/E ratio of 217.76 and EV/EBITDA of 223.09, surpassing companies like Microsoft and Oracle, which have more moderate valuations. Its price-to-cash-flow ratio is also markedly elevated at 153.72, indicating premium pricing relative to cash generation. Return on equity at 0.26% is competitive but does not significantly outpace peers. The company's market capitalization is large but below Microsoft’s $2.92 trillion. Overall, Palantir stands out for its high valuation metrics, reflecting growth expectations, while peers demonstrate more conservative financial ratios.
Financial Metrics Comparison with Peers
Financial Statements
Comprehensive financial data including income, balance sheet, and cash flow metrics
Income Statement
Data not available
Balance Sheet
| fiscal_date | 2025-12-31 | 2024-12-31 | 2023-12-31 | 2022-12-31 | 2021-12-31 |
|---|---|---|---|---|---|
| Cash And Cash Equivalents | 1.42B | 2.10B | 831.05M | 2.60B | 2.29B |
| Accounts Receivable | 1.04B | 575.05M | 364.78M | 258.35M | 190.92M |
| Total Assets | 8.90B | 6.34B | 4.52B | 3.46B | 3.25B |
| Total Liabilities | 1.41B | 1.25B | 961.46M | 818.80M | 956.42M |
| Long Term Debt | 183.47M | 195.23M | 175.22M | 204.31M | 220.15M |
| Shareholders Equity | 7.49B | 5.09B | 3.56B | 2.64B | 2.29B |
Data provided by Twelve Data
Cash Flow Statement
| fiscal_date | 2025-12-31 | 2024-12-31 | 2023-12-31 | 2022-12-31 | 2021-12-31 |
|---|---|---|---|---|---|
| Operating Activities Net Income | 1.63B | 467.92M | 217.38M | -371.09M | -520.38M |
| Operating Activities Depreciation | 26.14M | 31.59M | 33.35M | 22.52M | 14.90M |
| Operating Activities Stock Based Compensation | 684.03M | 691.64M | 475.90M | 564.80M | 778.22M |
| Operating Activities Other Non Cash Items | -21.61M | 13.51M | -29.04M | -3.21M | 36.59M |
| Operating Activities Accounts Receivable | -450.43M | -211.16M | -106.16M | -72.82M | -35.24M |
| Operating Activities Accounts Payable | 4.66M | -18.84M | -31.83M | -29.86M | 57.77M |
| Operating Activities Other Assets Liabilities | 183.83M | 37.06M | 97.53M | -139.25M | -118.90M |
| Operating Activities Operating Cash Flow | 2.06B | 1.01B | 652.33M | -29.09M | 256.27M |
| Investing Activities Capital Expenditures | -33.88M | -12.63M | -15.11M | -40.03M | -12.63M |
| Investing Activities Purchase Of Investments | -7.77B | -5.40B | -5.64B | -124.50M | -382.26M |
| Investing Activities Sale Of Investments | 5.03B | 5.07B | 2.94B | 52.32M | 851.00K |
| Investing Activities Other Investing Activity | -1.00M | -5.62M | N/A | 73.00K | -3.87M |
| Investing Activities Investing Cash Flow | -2.78B | -340.65M | -2.71B | -45.43M | -397.91M |
| Financing Activities Common Stock Repurchase | -74.98M | -64.20M | N/A | N/A | 0.00 |
| Financing Activities Other Financing Charges | -81.03M | -217.84M | 601.00K | -93.00K | -708.00K |
| Financing Activities Financing Cash Flow | -156.02M | -282.03M | 601.00K | -93.00K | -200.71M |
| End Cash Position | 1.45B | 2.12B | 850.11M | 2.63B | 2.37B |
| Free Cash Flow | 2.10B | 1.14B | 697.07M | 183.71M | 321.22M |
| Income Tax Paid | N/A | 16.18M | 13.52M | 2.90M | 4.13M |
| Operating Activities Deferred Taxes | N/A | N/A | -4.81M | -174.00K | 43.32M |
| Investing Activities Net Acquisitions | N/A | N/A | 0.00 | 66.71M | 0.00 |
| Financing Activities Long Term Debt Payments | N/A | N/A | 0.00 | 0.00 | -200.00M |
| Financing Activities Long Term Debt Issuance | N/A | N/A | N/A | 0.00 | 0.00 |
| Financing Activities Common Stock Issuance | N/A | N/A | N/A | 0.00 | 0.00 |
| Interest Paid | N/A | N/A | N/A | 5.00K | 2.77M |
Data provided by Twelve Data
Technical Analysis
Key Insights
- The current trend shows a moderate downward price movement from the 52-week high of $207.52 to the current price of $137.21, indicating a correction phase.
- Key support levels are observed near the 50-day and 200-day moving averages around $161.99 and $161.41 respectively, with resistance near the recent high of $207.52.
- The stock price is currently trading below both the 50-day and 200-day moving averages, suggesting potential short-term bearish momentum.
- Momentum indicators show a neutral to slightly bearish stance with RSI levels likely below the overbought threshold, MACD indicating weakening momentum, and stochastic oscillators reflecting consolidation.
- Multi-timeframe analysis reveals daily and weekly charts exhibiting consolidation below moving averages, while monthly trends still show longer-term upward bias.
- Potential market scenarios include a continuation of consolidation near current levels with possible rebounds if support holds, or further downside if selling pressure intensifies.
Trending News
Summary: The designation means that all ... Anthropic’s technology. The outcome marks a significant setback for Anthropic, and stock-market investors, including Burry, are focused on what it means for the public-company landscape, particularly for Palantir....
Sentiment: negative
2. Headline: A Look At Palantir Technologies (PLTR) Valuation After Recent Analyst Upgrades And AI Optimism - Simply Wall St News
Summary: Find out about the key risks to this Palantir Technologies narrative. If the mixed sentiment in this story leaves you unsure, it is worth scanning the numbers yourself and forming a view quickly. To help frame the upside case, take a look at the 2 key rewards. Do not let your research stop at one stock, use the Simply Wall Street Screener to quickly surface other ideas that fit the kind of portfolio you want to build. Target stability and income ...
Sentiment: negative
3. Headline: Palantir Technologies Inc. $PLTR Stock Holdings Reduced by R Squared Ltd
Summary: R Squared Ltd cut its position in shares of Palantir Technologies Inc. (NASDAQ:PLTR - Free Report) by 89.8% in the third quarter, according to its most recent 13F filing with the Securities and Exchange Commission (SEC). The institutional investor owned 1,480 shares of the company's stock after se
Sentiment: negative
4. Headline: Arete Wealth Advisors LLC Boosts Stock Position in Palantir Technologies Inc. $PLTR
Summary: Arete Wealth Advisors LLC grew its holdings in shares of Palantir Technologies Inc. (NASDAQ:PLTR - Free Report) by 23.5% in the third quarter, according to its most recent filing with the Securities and Exchange Commission (SEC). The fund owned 39,341 shares of the company's stock after buying an a
Sentiment: positive
5. Headline: Cache Advisors LLC Has $20.13 Million Stock Position in Palantir Technologies Inc. $PLTR
Summary: Cache Advisors LLC lowered its stake in shares of Palantir Technologies Inc. (NASDAQ:PLTR - Free Report) by 10.8% in the third quarter, according to its most recent disclosure with the SEC. The fund owned 110,355 shares of the company's stock after selling 13,329 shares during the period. Palantir
Sentiment: negative
6. Headline: APG Asset Management N.V. Sells 316,236 Shares of Palantir Technologies Inc. $PLTR
Summary: APG Asset Management N.V. reduced its position in shares of Palantir Technologies Inc. (NASDAQ:PLTR - Free Report) by 18.9% in the 3rd quarter, according to its most recent Form 13F filing with the Securities and Exchange Commission (SEC). The firm owned 1,360,021 shares of the company's stock afte
Sentiment: negative
7. Headline: Palantir Partnerships Test High Valuation And Recent Share Price Weakness - Simply Wall St News
Summary: Palantir Technologies (NasdaqGS:PLTR) has announced new partnerships, including a defense focused agreement with GE Aerospace under a U.S.
Sentiment: negative
8. Headline: Palantir Technologies Inc. (NASDAQ:PLTR) Receives Average Rating of "Moderate Buy" from Analysts
Summary: Palantir Technologies Inc. (NASDAQ:PLTR - Get Free Report) has been assigned an average recommendation of "Moderate Buy" from the twenty-eight ratings firms that are currently covering the firm, MarketBeat reports. Two equities research analysts have rated the stock with a sell recommendation, ten
Sentiment: positive
9. Headline: What Is Happening With Palantir Technologies Stock? | Trefis
Summary: What Happened With PLTR Stock. Here Is Why Palantir Technologies Stock Moved. Our Current Assesment Of PLTR Stock. Portfolios Beat Stock Picking. More From Trefis.
Sentiment: neutral
10. Headline: Palantir upgraded to ‘Buy’ by UBS on strong AI and data demand
Summary: UBS upgraded Palantir Technologies Inc (NYSE:PLTR) shares to ‘Buy’ from ‘Neutral,’ highlighting the software company's positioning at the intersection of artificial intelligence (AI) and data spending. The analysts wrote that investors should consider “taking advantage of this -35% ...
Sentiment: positive
Powered by Brave
Recent Updates
News Summary
Recent news coverage of Palantir Technologies Inc. highlights its positioning at the center of AI and software spending growth, with UBS recognizing it among the best long-term stocks. The company reported strong Q4 revenue growth of 70% year-over-year and adjusted EPS growth of 79%, reinforcing its financial momentum. However, mixed sentiments arise from leadership and strategic developments, including the sale of shares by co-founder Peter Thiel and ongoing scrutiny related to military AI contracts amid geopolitical tensions. The news cycle reflects a balance between optimism on AI-driven growth and caution due to competitive pressures and institutional portfolio adjustments.
News Sentiment
The overall sentiment across recent updates is moderately positive with notable optimism around Palantir’s AI capabilities and revenue growth, tempered by neutral to cautious tones regarding leadership moves and competitive challenges. Sentiment varies by source, with some expressing confidence in long-term prospects while others highlight risks related to valuation and market positioning.
Analytical Overview
Analysis Summary
Palantir’s valuation metrics, including a trailing P/E of 217.76 and forward P/E of 74.23, are significantly higher than industry averages, reflecting elevated growth expectations but also increased valuation risk relative to peers with lower multiples.
The company demonstrates a strong growth trajectory with a 70% quarterly revenue increase and improving cash flow trends, supported by a gross margin of 84.65% and operating cash flow of approximately $2.13 billion, indicating operational efficiency.
Financial health appears robust with a current ratio of 7.11 and low total debt of $229 million against substantial cash reserves of $7.18 billion, suggesting solid liquidity and manageable leverage.
Sector-specific challenges include high competition in AI and data analytics, while opportunities arise from expanding government contracts and commercial adoption of data integration platforms.
Consideration of market positioning and competitive advantages highlights Palantir’s unique focus on government intelligence and commercial sectors, though valuation premiums necessitate careful monitoring of execution and market conditions.
Investment Conclusion
Supporting Factors: Primary supporting factors include strong revenue and earnings growth, high gross margins, and solid liquidity with low debt levels.
Risk Factors: Main risk factors to monitor encompass elevated valuation multiples, institutional selling trends, and competitive pressures in AI and defense sectors.
SWOT Analysis
Strengths
- High gross margin of 84.65% indicating strong profitability.
- Robust quarterly revenue growth of 70%.
- Strong liquidity with a current ratio of 7.11 and $7.18 billion in cash.
- Significant institutional ownership at 61.69% supporting governance.
Weaknesses
- Extremely high trailing P/E ratio of 217.76 reflecting valuation risk.
- Low insider ownership at 3.76%, potentially limiting insider alignment.
- High price-to-cash-flow ratio of 153.72 indicating premium pricing.
- Negative retained earnings impacting shareholders’ equity.
Opportunities
- Expanding government and commercial contracts in AI and data analytics.
- Strategic partnerships enhancing market positioning.
- Growing demand for data integration platforms across industries.
- Potential to leverage AI advancements for competitive advantage.
Threats
- Intense competition in AI and software infrastructure sectors.
- Institutional selling pressure indicating mixed market sentiment.
- Regulatory and geopolitical risks affecting government contracts.
Company Description
Palantir Technologies Inc. is an analytical software company specializing in data integration and analysis platforms to enhance organizational efficiencies. It primarily serves government clients through its Gotham platform, which aids in counterterrorism investigations by identifying patterns in complex datasets from sources like signals intelligence and informant reports, and commercial clients via Foundry, an operating system that centralizes data for seamless integration and analysis. Founded in 2003 and headquartered in Denver, Colorado, the company went public in 2020 and operates exclusively with entities in Western-allied nations, aligning with its commitment to Western values. Classified in the technology sector under software infrastructure, Palantir Technologies Inc. supports intelligence communities in the United States, United Kingdom, and internationally, while also transforming commercial operations across industries. With approximately 4,414 employees, it plays a significant role in big data analytics, enabling real-world threat responses and operational improvements through advanced software solutions.