

Pace Digitek Limited (PACEDIGITK)
Stock Analysis Report
Stock Journey
Key Positives and Key Risks
Pros
Cons
Report Summary
Pace Digitek Limited operates primarily in the technology sector, specializing in communication equipment with a focus on telecom passive infrastructure solutions. Listed on the National Stock Exchange of India (NSE), the company offers products such as power management systems, lithium-ion battery systems, and solar charge control units. Its market presence extends across India and internationally to regions including Africa and Myanmar, positioning it as a notable player in telecom infrastructure and renewable energy solutions.
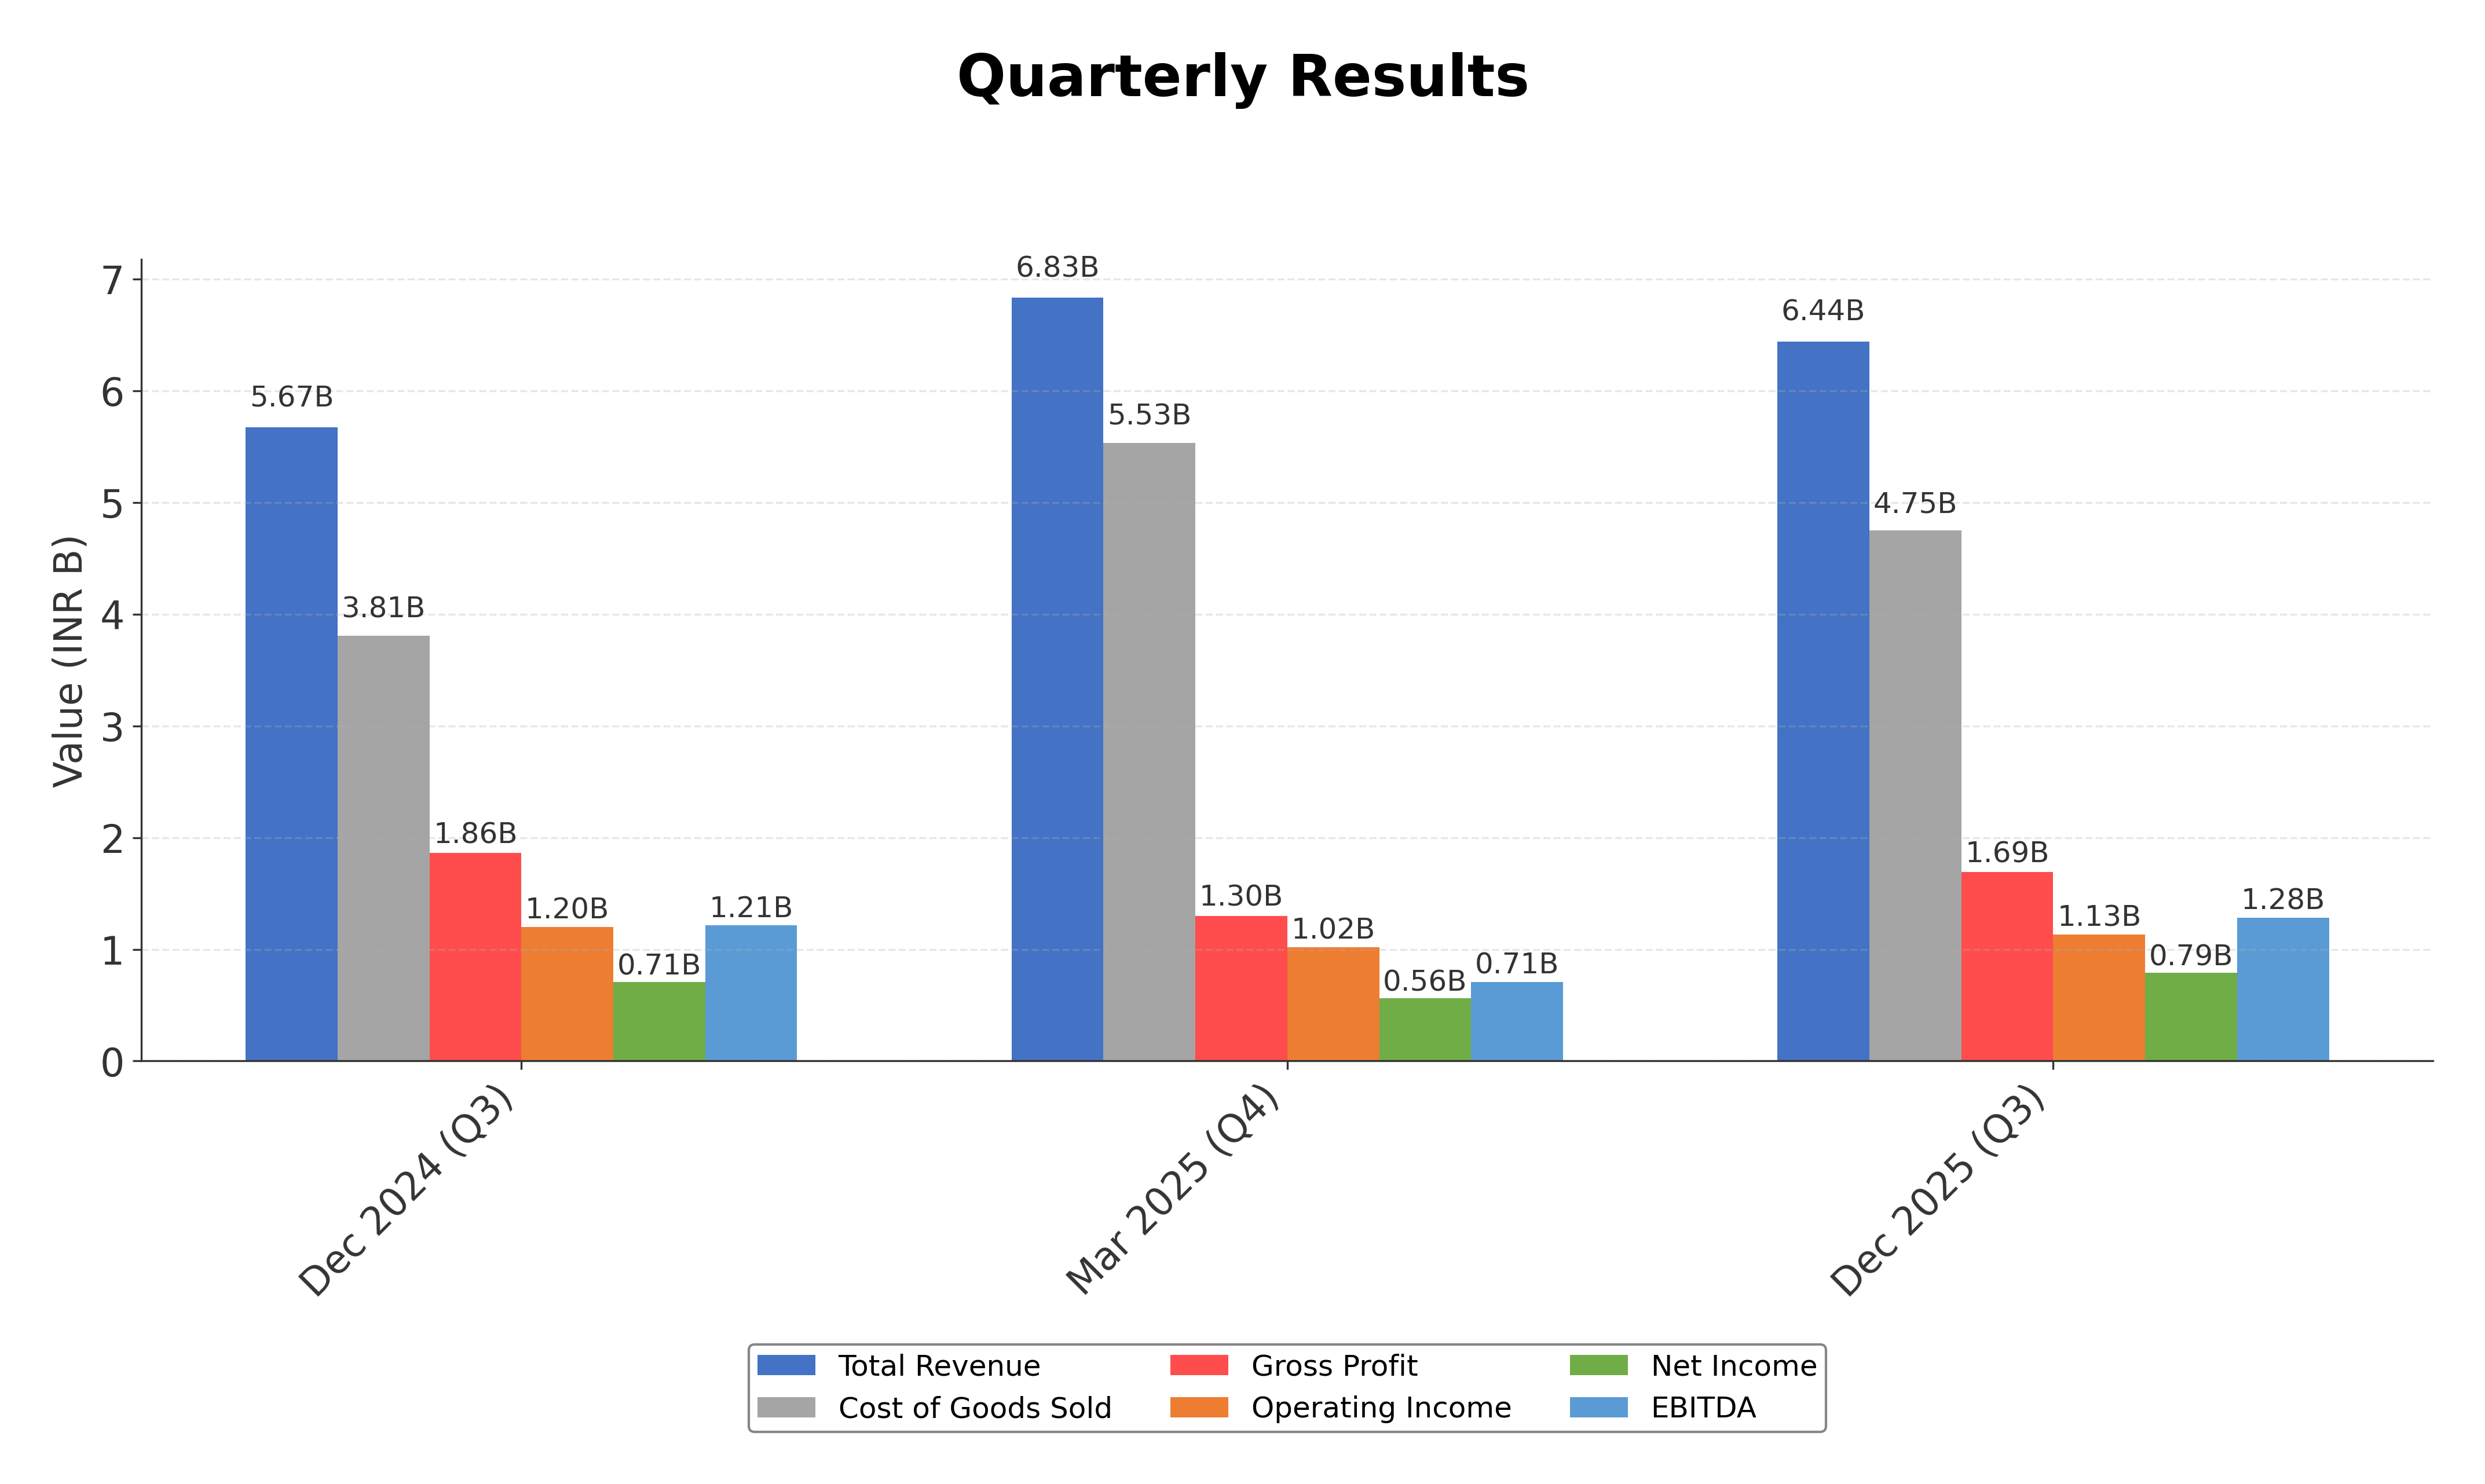
Financially, Pace Digitek reported trailing twelve months (TTM) revenue of approximately INR 22.28 billion with a gross margin of 26.27%, operating margin of 17.6%, and net profit margin of 11.48%. The company’s return on equity (ROE) stands at 22.13%, return on assets (ROA) at 10.10%, and return on invested capital (ROIC) is reflected in an enterprise value to EBITDA ratio of 8.20, indicating solid profitability and operational efficiency. Quarterly revenue growth was 13.5%, with net income rising 8.1% year-over-year, underscoring steady growth momentum.
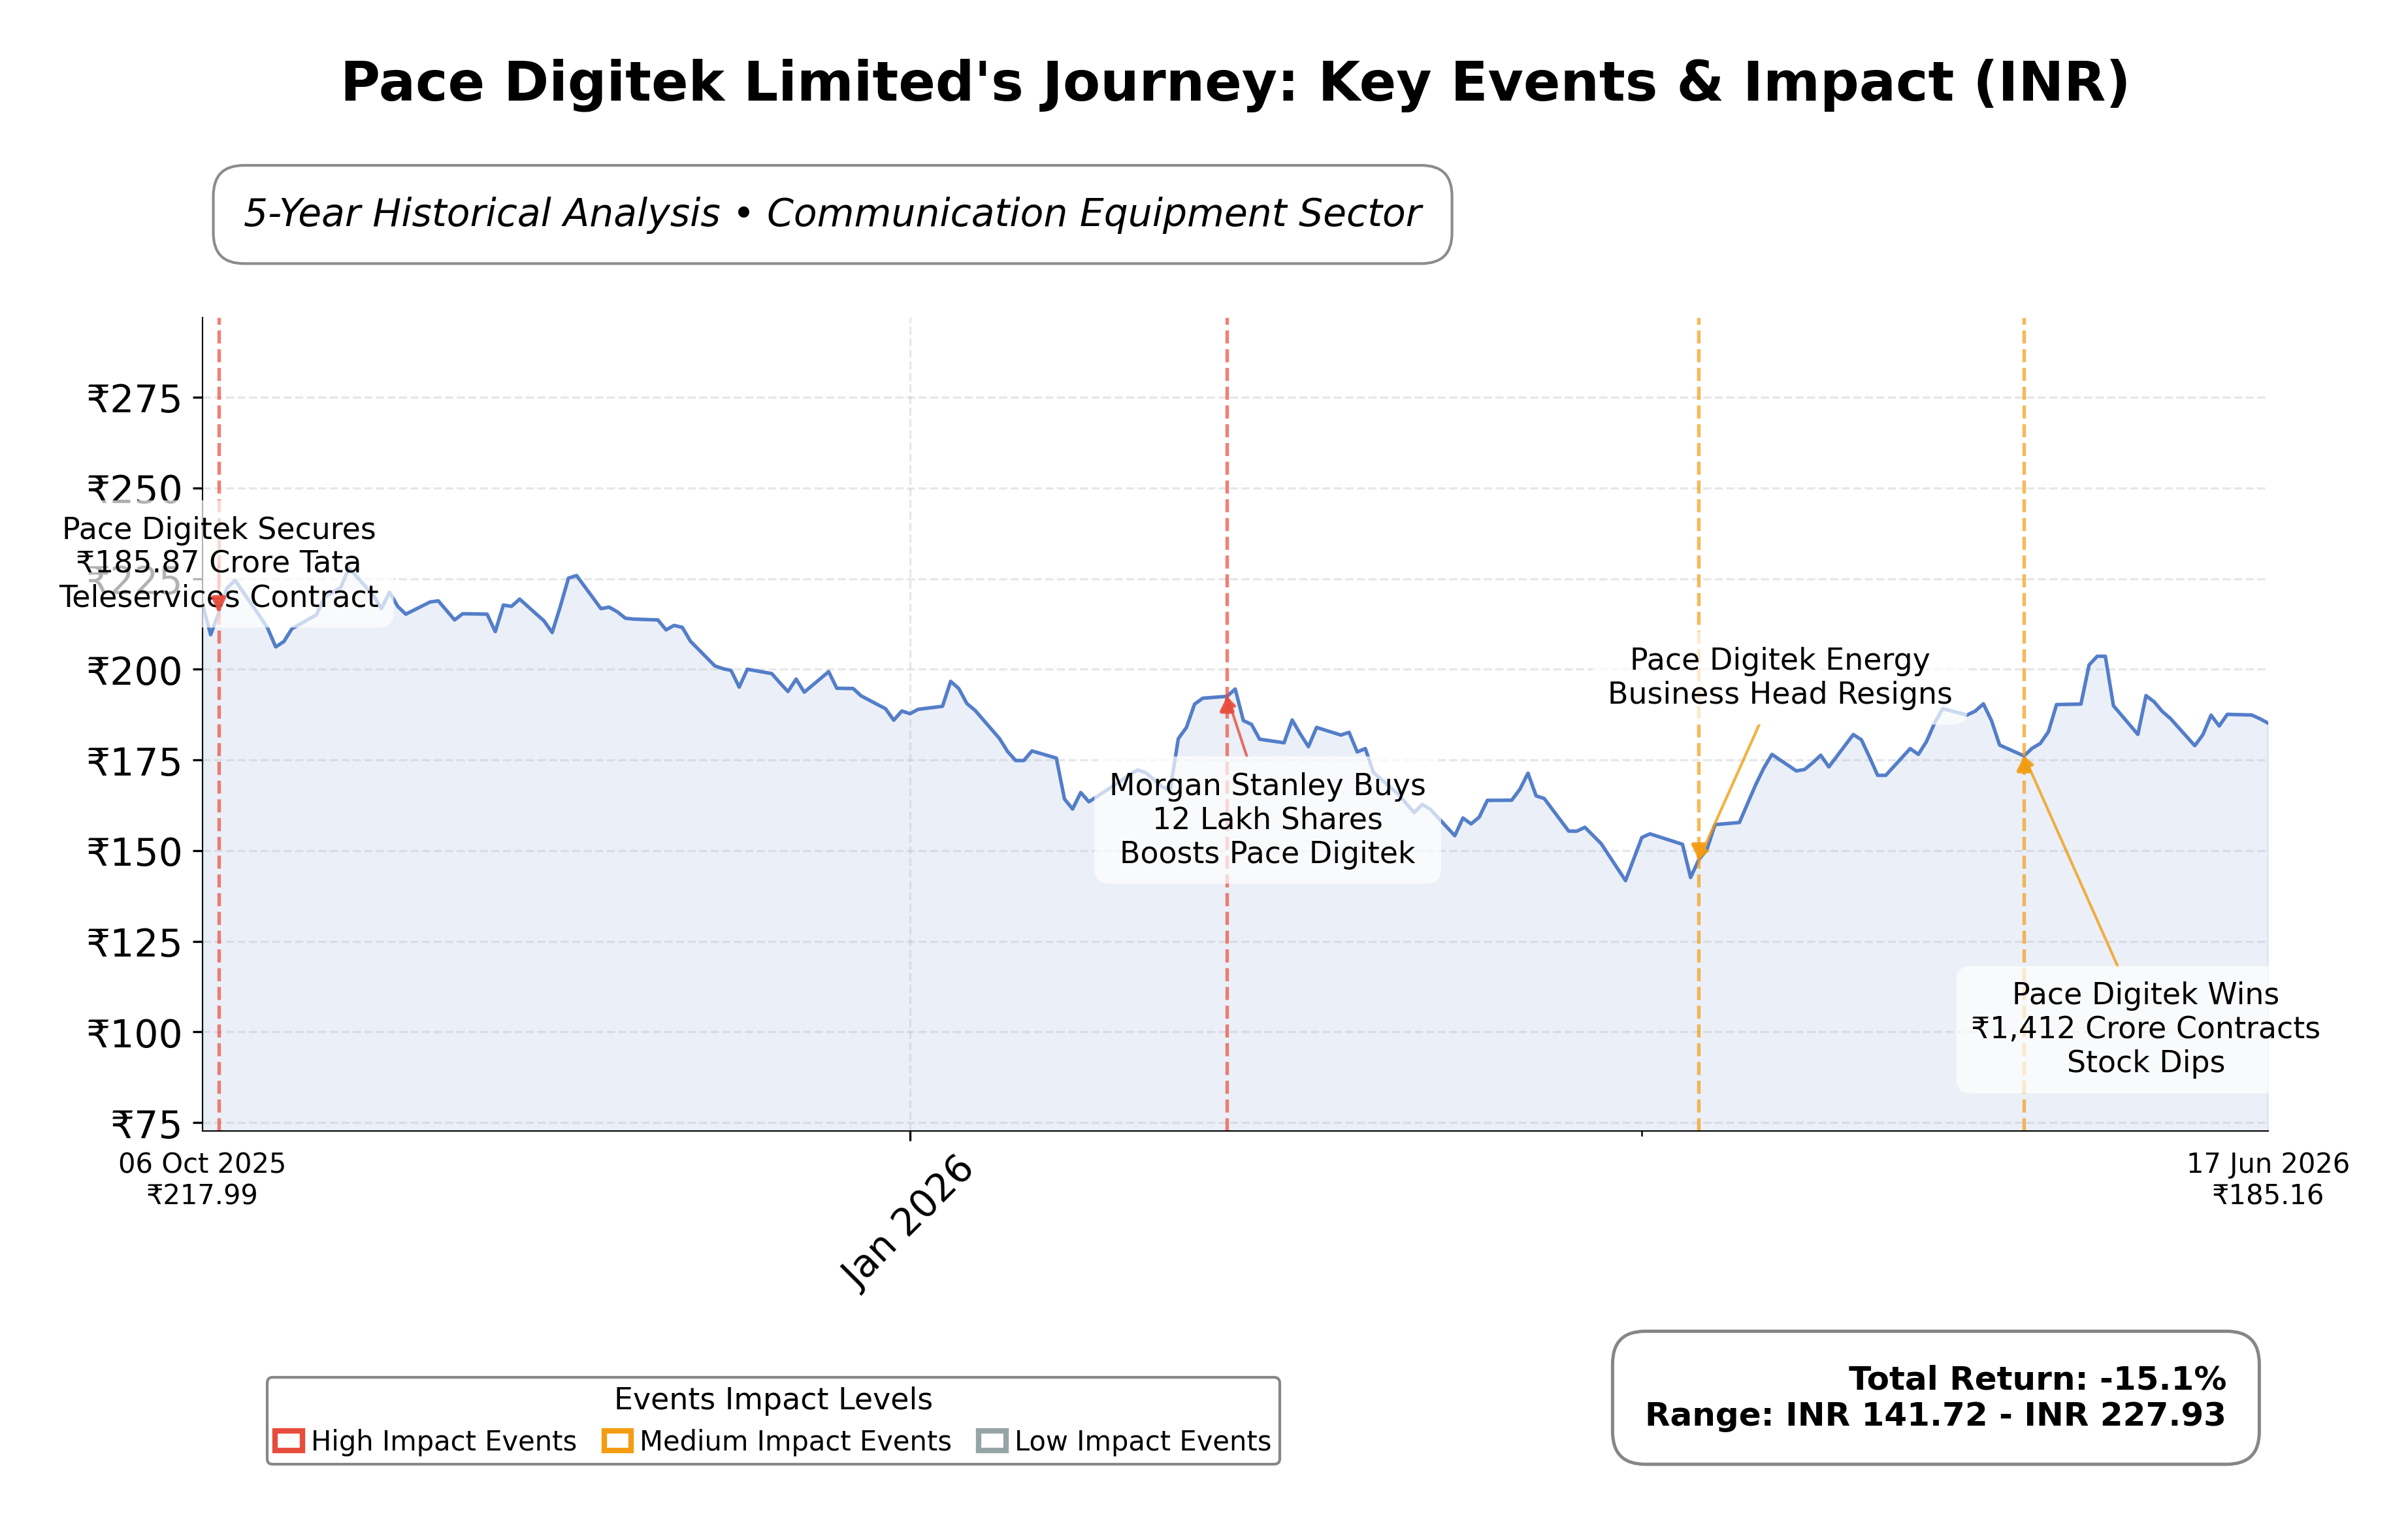
Valuation metrics show a trailing price-to-earnings (P/E) ratio of 12.35 and a forward P/E of 10.42, with a price-to-book (P/B) ratio of 2.58. The market capitalization is approximately INR 38.62 billion. The stock trades within a 52-week range of INR 139.81 to INR 231.95, currently priced at INR 183.34, indicating a downside risk of about 21.83% from its high. The enterprise value to revenue ratio is 1.36, suggesting moderate valuation relative to sales.
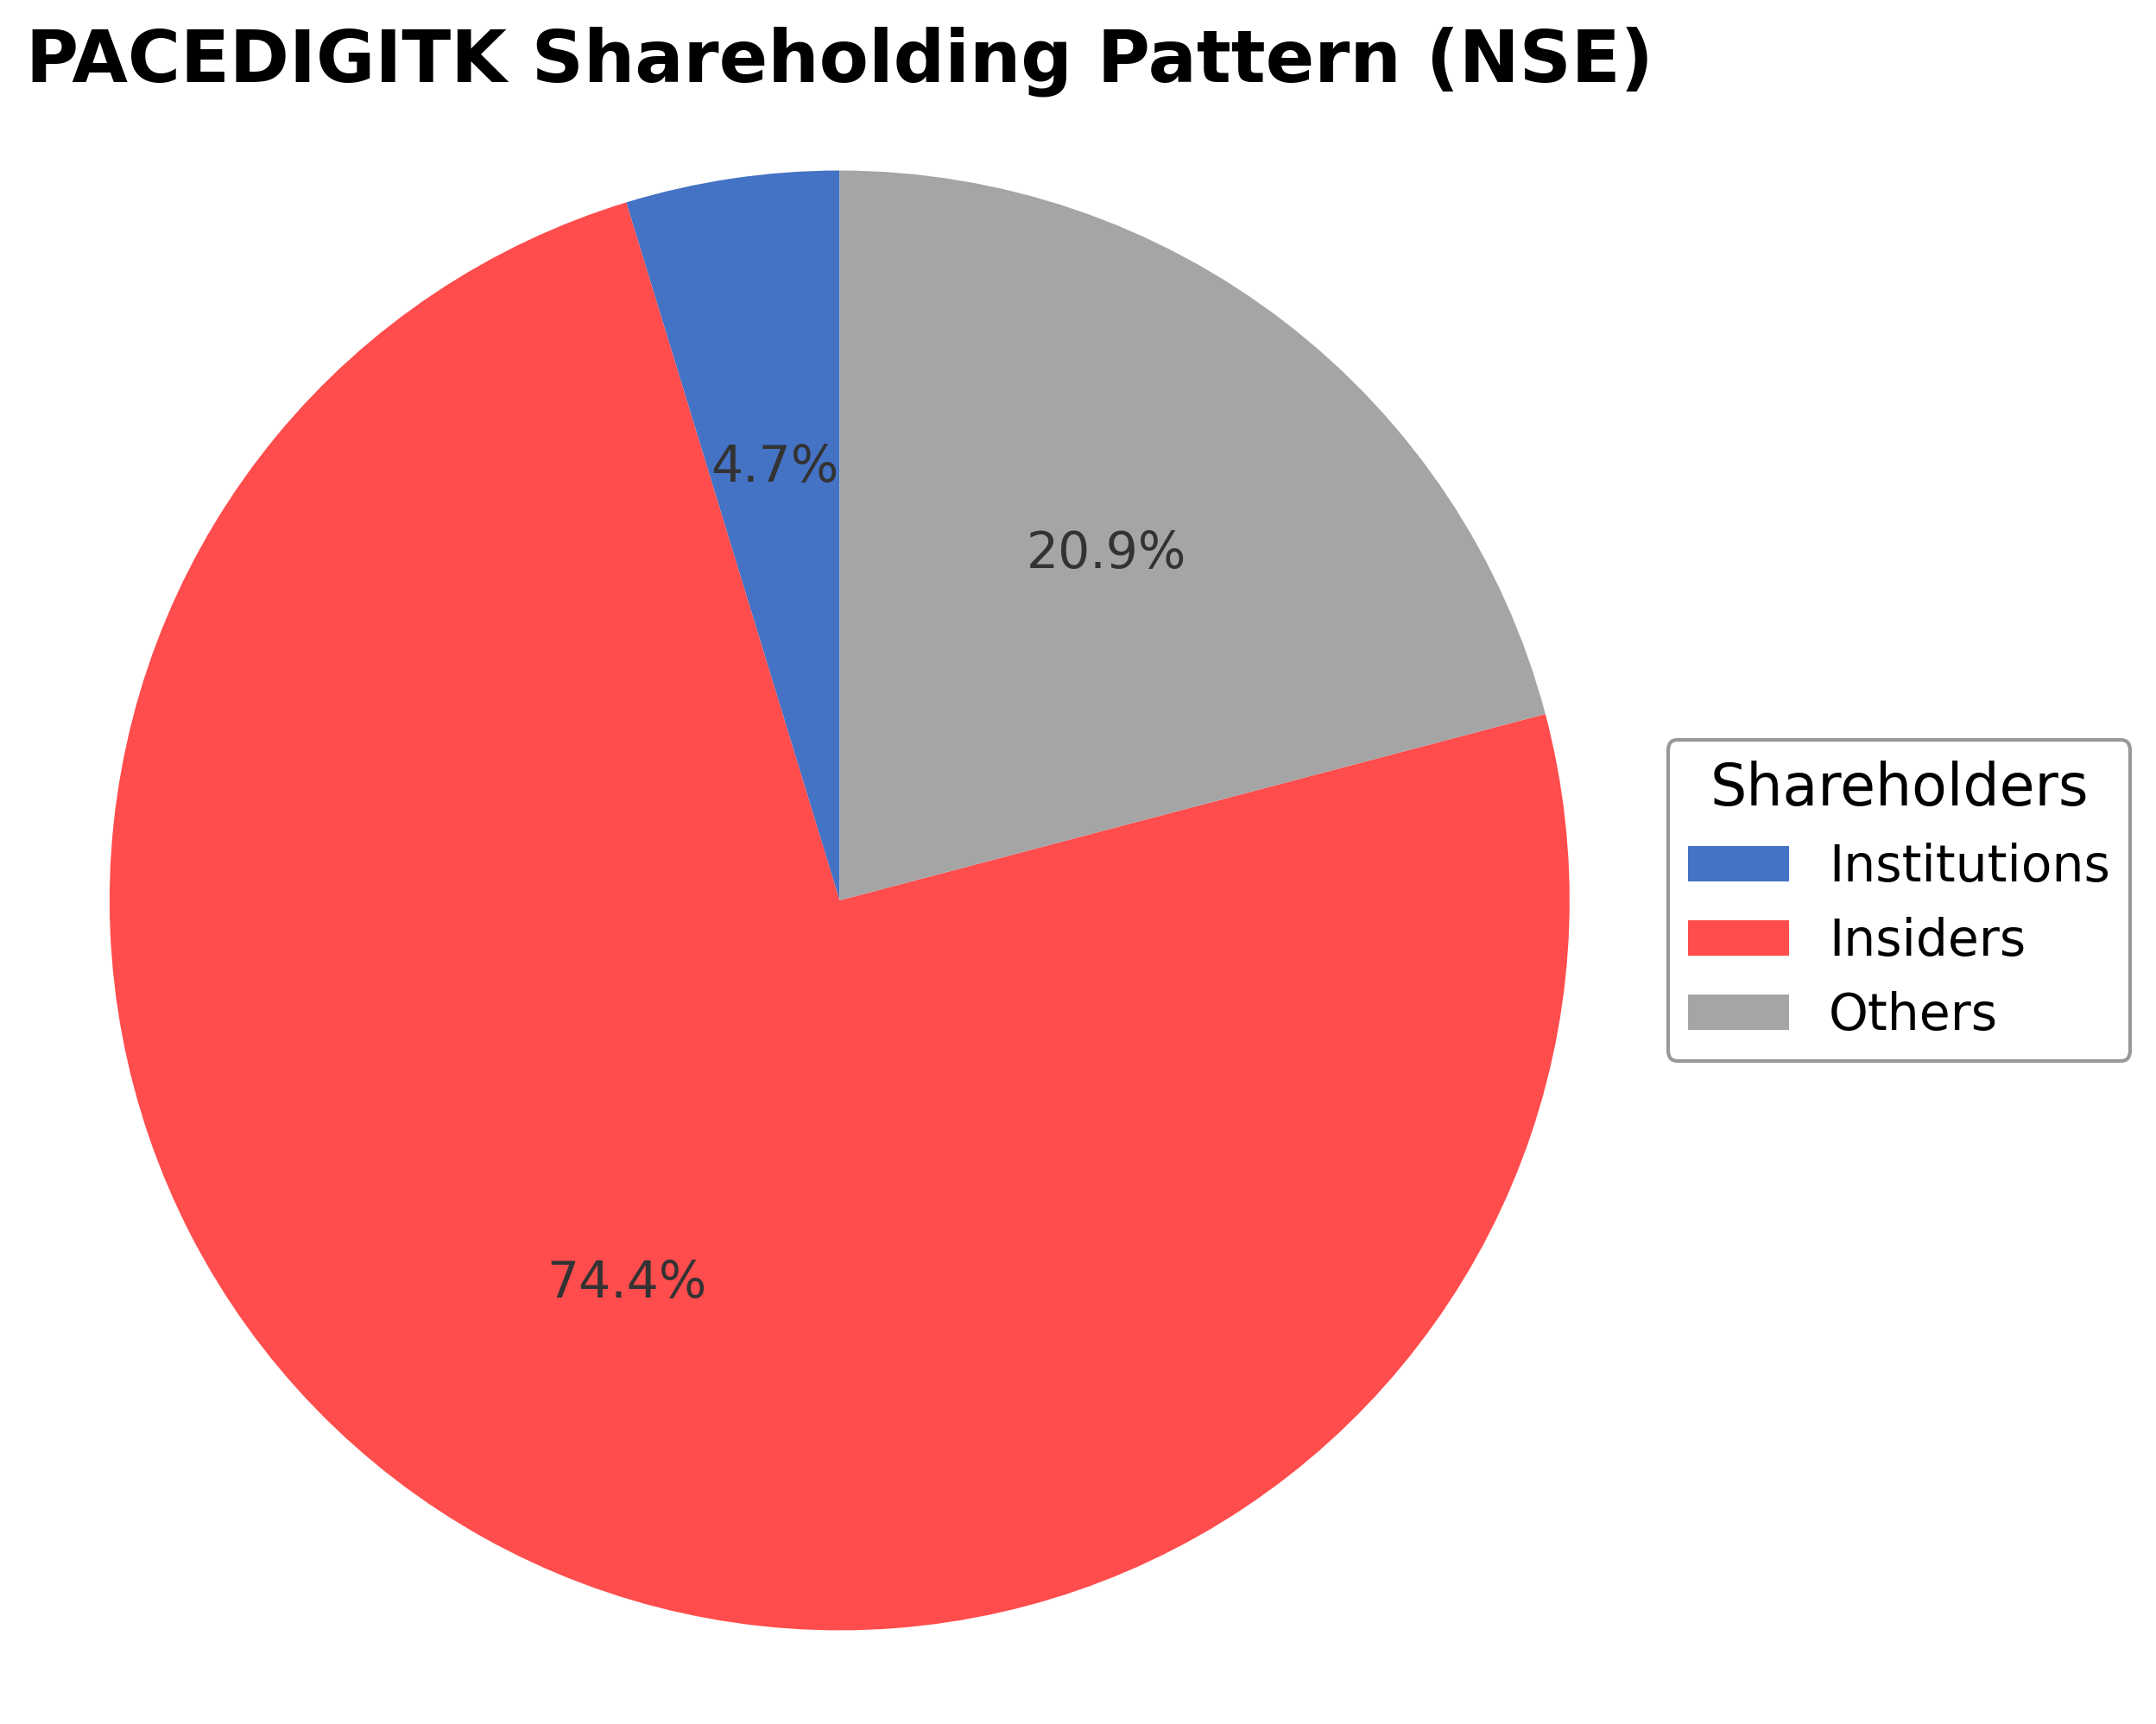
Key strengths include a strong balance sheet with a low debt-to-equity ratio of 0.11, positive free cash flow of INR 2.68 billion, and a robust order book exceeding INR 11,000 crore. Challenges involve negative operating cash flow and limited institutional ownership at 4.7%, which may impact liquidity and market perception. Recent strategic initiatives include expansion of battery energy storage systems (BESS) manufacturing capacity and completion of significant telecom infrastructure projects, reflecting growth and diversification efforts.
Technically, the stock exhibits a mildly bullish momentum with price action above the 50-day moving average but below the 200-day average, supported by positive readings in momentum indicators. Recent news highlights analyst engagement and operational expansion, suggesting cautious optimism. Overall, the data portrays a company with solid fundamentals and growth initiatives, warranting close observation for evolving market conditions.
Company and Industry Overview
Company Basics
Price Performance
Company Size
Shareholding Pattern
Sector and Industry Analysis
The telecom infrastructure sector in India has witnessed robust growth driven by increasing data consumption, 5G rollout, and expanding network coverage. The market size has expanded significantly, with investments in tower infrastructure, optical fiber networks, and power solutions forming the backbone of telecom operators’ expansion plans. Key players include large tower companies and integrated infrastructure providers offering end-to-end solutions, catering to telecom operators and new energy segments like solar and battery storage.
Industry trends highlight a shift towards integrated telecom infrastructure services combining tower erection, fiber deployment, and power management systems, including lithium battery solutions. The competitive landscape is marked by consolidation and technological upgrades to support 5G and renewable energy integration. Barriers to entry remain high due to capital intensity, technical expertise requirements, and long-term contracts with telecom operators, favoring established players with diversified offerings and strong execution capabilities.
The regulatory environment is shaped by policies promoting telecom infrastructure sharing, spectrum allocation, and renewable energy adoption to reduce carbon footprints. Government initiatives like the National Digital Communications Policy and incentives for clean energy integration impact industry growth positively by encouraging infrastructure expansion and sustainability. Compliance with environmental and safety standards remains critical, influencing operational costs and investment decisions within the sector.
Note: Analysis synthesized from industry research, market reports, and regulatory filings. Information is subject to change based on market conditions.
Financial Ratios Dashboard
Illustrative Scenario Analysis
DCF Assumptions:
Method: Two-Stage EPS-Priority Model
Financials
Peer Analysis
| Company Name | Market Cap | P/E Ratio | P/B Ratio | EV/EBITDA | Price to CFO |
|---|---|---|---|---|---|
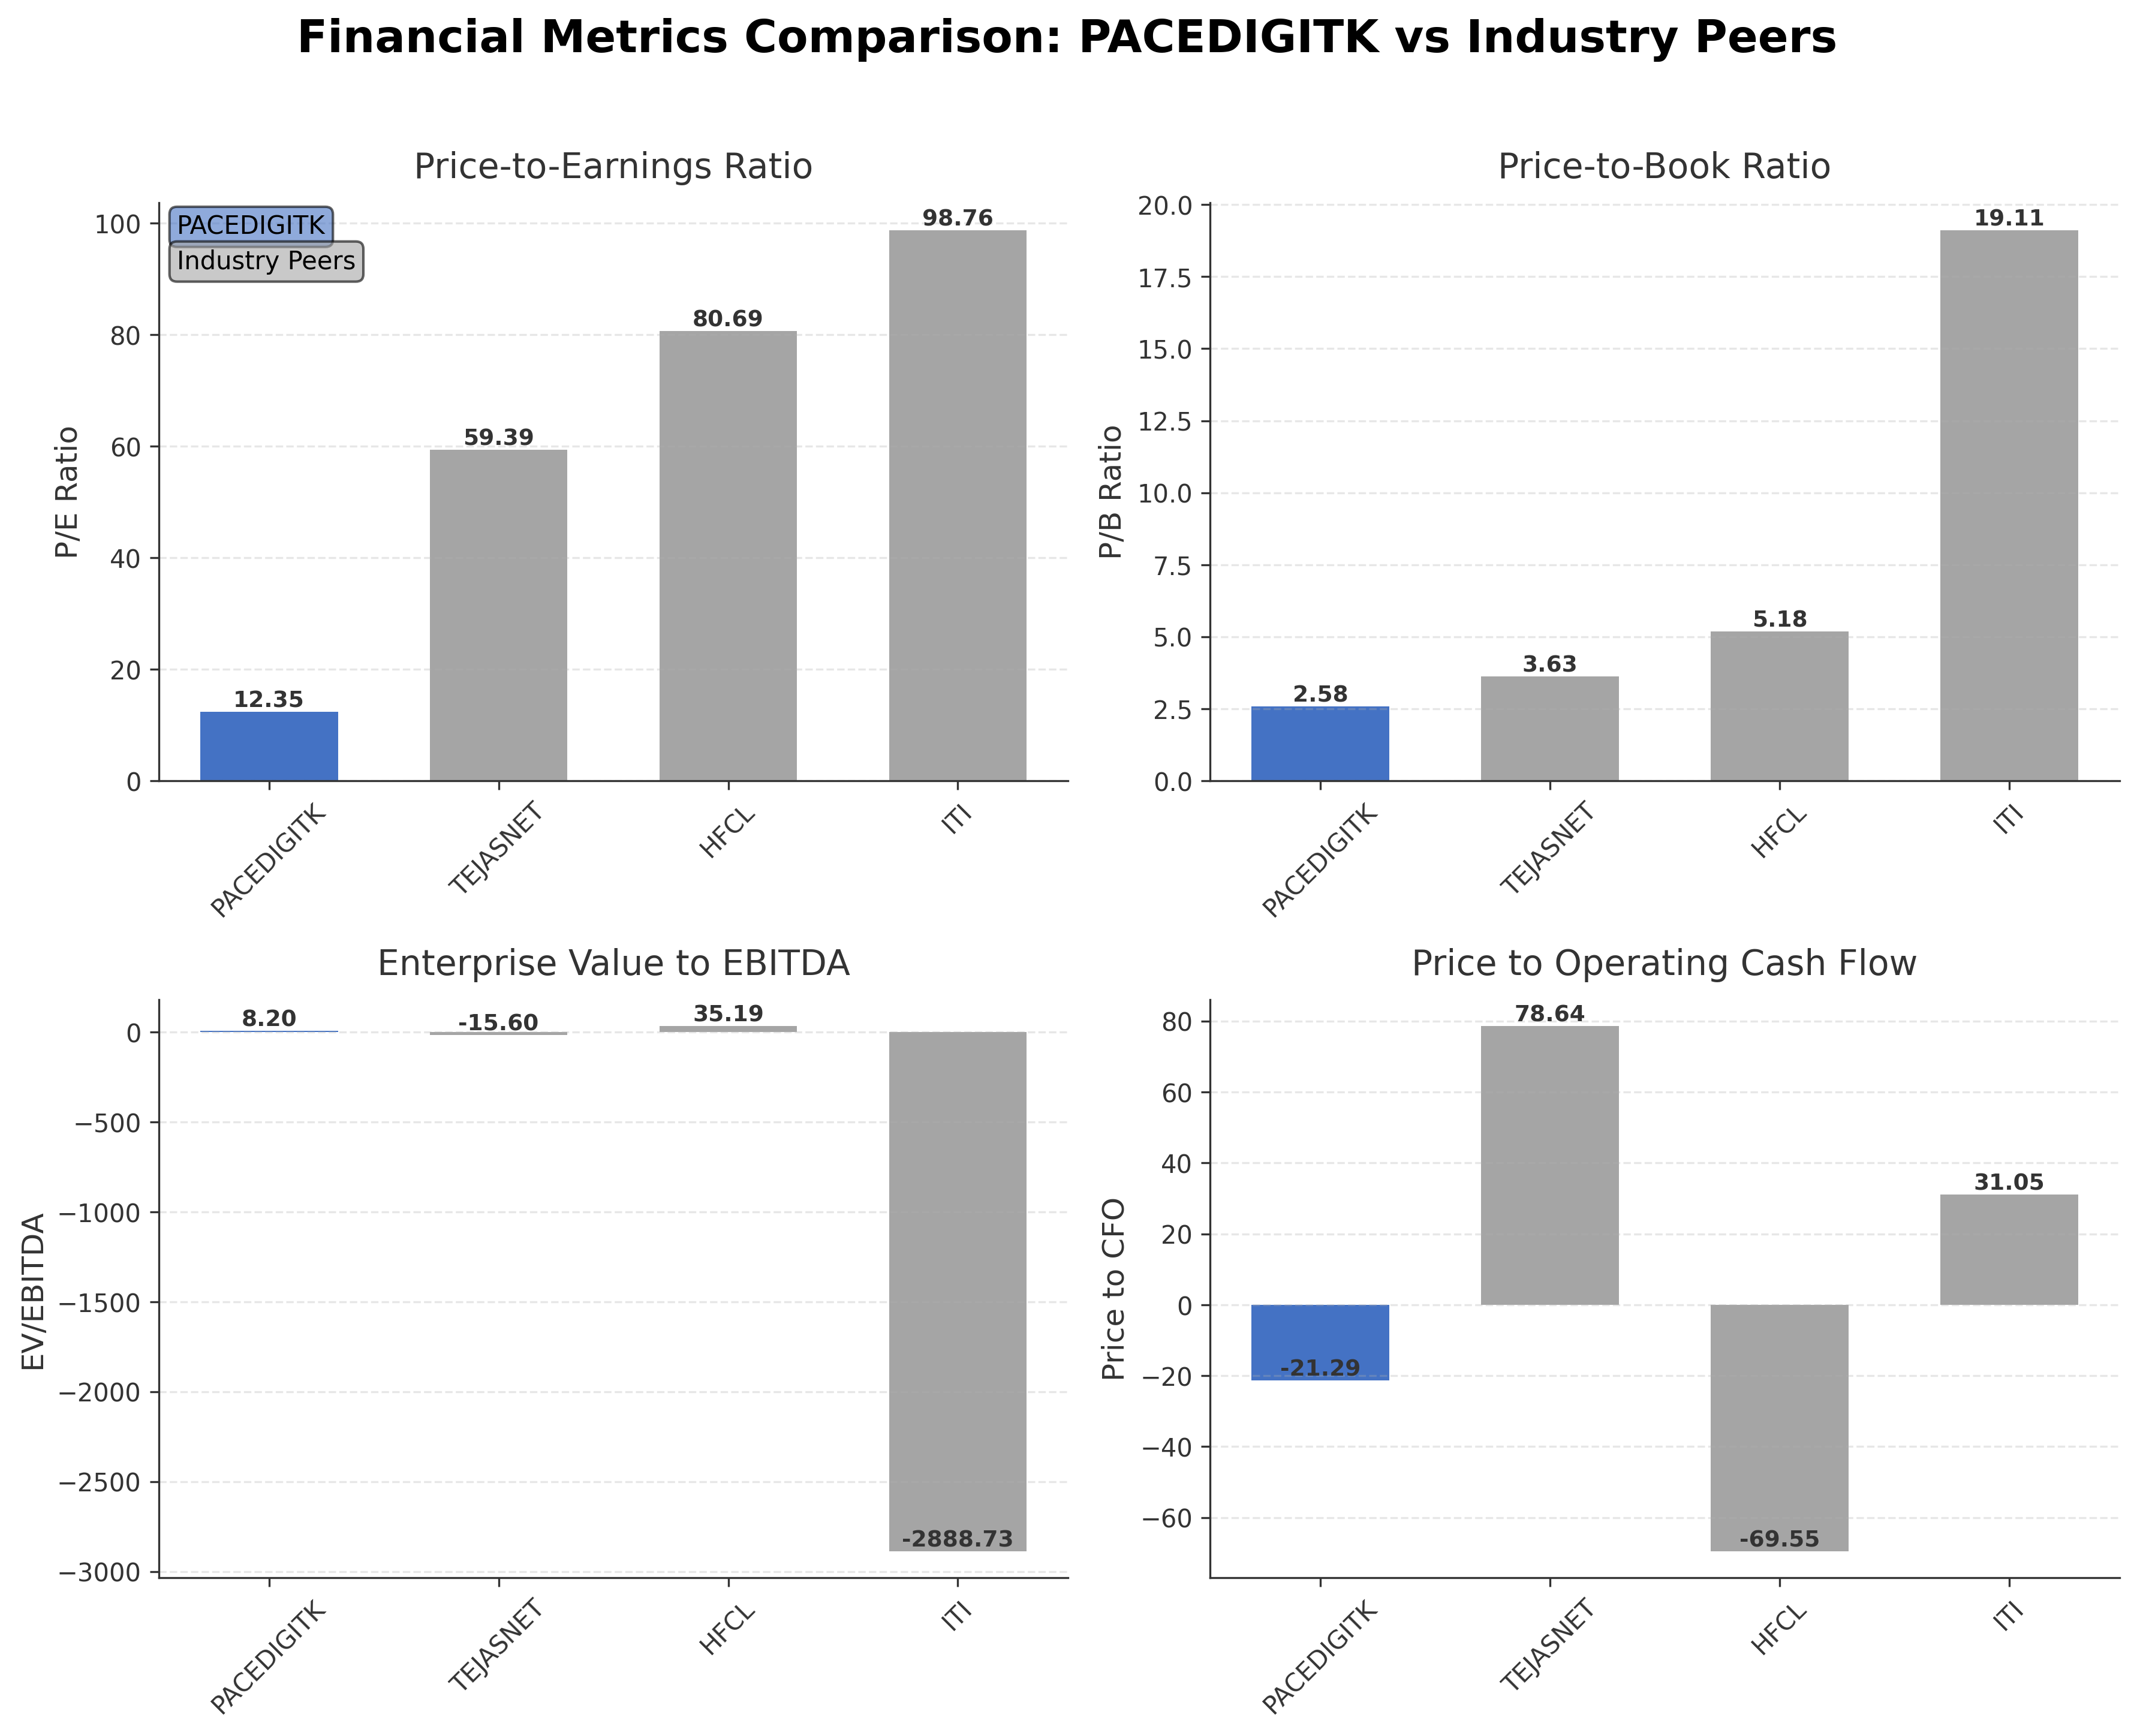
| Pace Digitek Limited | ₹38.62B | 12.35 | 2.58 | 8.20 | -21.29 |
| Tejas Networks Ltd. | ₹106.29B | 59.39 | 3.63 | -15.60 | 78.64 |
| HFCL Ltd. | ₹262.99B | 80.69 | 5.18 | 35.19 | -69.55 |
| ITI Ltd. | ₹288.13B | 98.76 | 19.11 | -2888.73 | 31.05 |
Comparison Analysis: Pace Digitek Limited presents a relatively moderate valuation compared to its industry peers, with a trailing P/E ratio of 12.35 significantly lower than Tejas Networks, HFCL, and ITI, which exhibit P/E ratios above 59. The company’s P/B ratio of 2.58 is also more conservative relative to peers, indicating a less expensive equity valuation. Its EV/EBITDA ratio of 8.20 reflects better operational efficiency compared to the negative or extremely high ratios of peers, suggesting healthier earnings generation. Pace Digitek’s return on equity of 22.13% outperforms the peer group, highlighting superior profitability. However, the negative price to cash flow ratio contrasts with some peers, indicating potential cash flow challenges. Overall, Pace Digitek stands out for its balanced valuation and strong profitability within the communication equipment sector.
Financial Metrics Comparison with Peers
Financial Statements
Comprehensive financial data including income, balance sheet, and cash flow metrics
Income Statement
| fiscal_date | 2026-03-31 | 2025-03-31 | 2024-03-31 | 2023-03-31 |
|---|---|---|---|---|
| Sales | 26.41B | 24.39B | 24.33B | 5.03B |
| Cost Of Goods | 19.65B | 17.24B | 18.78B | 3.61B |
| Gross Profit | 6.77B | 7.15B | 5.55B | 1.42B |
| Operating Expense Other Operating Expenses | 1.25B | 1.67B | 589.64M | 189.08M |
| Operating Income | 4.43B | 4.76B | 4.09B | 238.83M |
| Non Operating Interest Expense | 598.23M | 1.15B | 757.69M | 115.60M |
| Pretax Income | 4.30B | 3.84B | 3.07B | 221.31M |
| Income Tax | 1.22B | 1.05B | 768.75M | 55.98M |
| Net Income | 3.07B | 2.79B | 2.30B | 165.33M |
| Ebit | 4.89B | 4.99B | 3.83B | 336.91M |
| Ebitda | 5.01B | 5.05B | 3.96B | 395.67M |
| Net Income Continuous Operations | 4.30B | 3.84B | 3.07B | 221.31M |
| Minority Interests | -96.96M | -114.94M | -104.36M | -22.41M |
| Preferred Stock Dividends | 0.00 | 0.00 | 0.00 | 0.00 |
| Operating Expense Selling General And Administrative | N/A | 385.73M | 176.27M | 93.42M |
| Non Operating Interest Income | N/A | 187.24M | 230.51M | 86.42M |
| Eps Basic | N/A | 12.40 | N/A | N/A |
| Eps Diluted | N/A | 12.40 | N/A | N/A |
| Basic Shares Outstanding | N/A | 215.85M | N/A | N/A |
| Diluted Shares Outstanding | N/A | 215.85M | N/A | N/A |
Data provided by Twelve Data
Balance Sheet
| fiscal_date | 2026-03-31 | 2025-03-31 | 2024-03-31 | 2023-03-31 |
|---|---|---|---|---|
| Cash And Cash Equivalents | 2.70B | 783.54M | 957.49M | 102.68M |
| Accounts Receivable | 20.67B | 18.43B | 10.76B | 3.94B |
| Total Assets | 53.14B | 26.49B | 22.54B | 8.40B |
| Total Liabilities | 30.62B | 14.40B | 16.87B | 5.05B |
| Long Term Debt | 6.27B | 246.28M | 253.61M | 377.71M |
| Shareholders Equity | 22.52B | 12.09B | 5.67B | 3.35B |
Data provided by Twelve Data
Cash Flow Statement
| fiscal_date | 2026-03-31 | 2025-03-31 | 2024-03-31 | 2023-03-31 |
|---|---|---|---|---|
| Operating Activities Net Income | 4.30B | 3.84B | 3.07B | 221.31M |
| Operating Activities Other Non Cash Items | 246.29M | 946.82M | 905.80M | 67.44M |
| Operating Activities Accounts Receivable | -8.91B | -7.83B | -6.92B | -611.31M |
| Operating Activities Other Assets Liabilities | -11.15B | 1.23B | -3.10B | -20.82M |
| Operating Activities Operating Cash Flow | -15.52B | -1.81B | -6.05B | -343.38M |
| Investing Activities Capital Expenditures | -808.87M | -361.22M | -58.84M | -58.19M |
| Investing Activities Other Investing Activity | 7.81M | 6.93M | 6.93M | 6.02M |
| Investing Activities Investing Cash Flow | -801.06M | 2.25B | -3.50B | -604.79M |
| Financing Activities Long Term Debt Issuance | 8.00B | 218.10M | 0.00 | 7.80M |
| Financing Activities Short Term Debt Issuance | 0.00 | -3.06B | 3.56B | 665.81M |
| Financing Activities Common Stock Issuance | 7.40B | 3.63B | 0.00 | 0.00 |
| Financing Activities Other Financing Charges | -40.31M | N/A | N/A | 10.00K |
| Financing Activities Financing Cash Flow | 15.36B | 301.48M | 2.38B | 591.06M |
| End Cash Position | 2.70B | 783.54M | 957.49M | 102.68M |
| Free Cash Flow | -10.23B | -2.12B | 2.08B | -501.61M |
| Investing Activities Sale Of Investments | N/A | 2.61B | 500.00K | 0.00 |
| Financing Activities Long Term Debt Payments | N/A | -482.06M | -1.18B | -82.56M |
| Investing Activities Purchase Of Investments | N/A | N/A | -3.45B | -552.62M |
Data provided by Twelve Data
Technical Analysis
Key Insights
- Pace Digitek’s current trend shows a mild bullish momentum with recent price action moving above the 50-day moving average but still below the 200-day moving average, indicating potential consolidation.
- Key support levels are observed near INR 140 and INR 170, while resistance is noted around INR 185 and INR 230, corresponding to recent highs.
- The stock price is trading above the 10-day and 50-day moving averages but remains below the 200-day moving average, suggesting short-term strength amid longer-term resistance.
- Momentum indicators show RSI in the mid-50s range indicating neutral momentum; MACD has recently crossed above its signal line, signaling improving momentum; Stochastic oscillators are in the neutral zone.
- Analysis across daily, weekly, and monthly timeframes reveals short-term bullishness with sideways movement on weekly charts and longer-term consolidation on monthly charts.
- Potential scenarios include continuation of mild upward momentum if price sustains above the 50-day MA or a pullback towards support levels if resistance near INR 185 proves strong.
Trending News
1. Headline: Pace Digitek to host analyst meet on June 23 in Mumbai
Summary: The intimation was signed by Meghana ... Digitek Limited. ... What strategic initiatives or growth drivers does Pace Digitek plan to highlight during the GIA Promoter's Conference 2026?fuzz it · How might the outcomes of this conference influence investor sentiment and the company's stock performance ...
Sentiment: neutral
Summary: Pace Digitek Share Price: Find the latest news on Pace Digitek Stock Price. Get all the information on Pace Digitek with historic price charts for NSE / BSE. Experts & Broker view also get the Pace Digitek Ltd. buy/sell tips detailed news, announcements, Forecasts, Analysts, Valuation, Earning ...
Sentiment: neutral
3. Headline: Green Stocks June 16: Suzlon Jumps 4%, Solex and Borosil Advance As Green Pack Ends Mixed
Summary: Suzlon Energy surged over 4 percent to lead renewable energy stocks, while Solex Energy and Borosil Renewables also gained in a mixed trading session.
Sentiment: positive
4. Headline: Pace Digitek Ltd Valuation Shifts to Very Expensive Amid Mixed Market Returns
Summary: In summary, while Pace Digitek’s valuation has shifted to a very expensive level, its operational metrics and relative valuation within the sector provide a nuanced picture. Investors are advised to monitor earnings updates, sector trends, and market conditions closely to determine the stock’s suitability within their portfolios. Get 33% Off on our 1 Year Plan - Limited ...
Sentiment: negative
5. Headline: Pace Digitek Ltd Shows Mildly Bullish Technical Momentum Amid Market Challenges
Summary: Pace Digitek Ltd, a small-cap player in the Telecom - Equipment & Accessories sector, has exhibited a notable shift in its technical momentum, moving from a sideways trend to a mildly bullish stance. Recent technical indicators including the MACD, RSI, Bollinger Bands, and On-Balance Volume ...
Sentiment: positive
Powered by Brave
Recent Updates
News Summary
As of 2026-05-26. Pace Digitek Limited reported robust financial performance for FY26, with revenue from operations growing 8.3% year-over-year to INR 2,641.3 crore and profit after tax increasing 10.1% to INR 307.3 crore. The company significantly expanded its Battery Energy Storage Systems (BESS) manufacturing capacity to 2.5 GWh and delivered 178 BESS containers during the year, with an executable energy order book exceeding INR 8,854 crore. In the telecom sector, Pace Digitek completed major projects including the BSNL 4G saturation tower deployment and expanded its operations and maintenance footprint across India. The total executable order book stood at INR 11,338 crore as of May 2026, reflecting strong demand and operational scale. The company also announced an upcoming analyst meet scheduled for June 23, 2026, in Mumbai to discuss strategic initiatives and growth drivers.
News Sentiment
The overall sentiment from recent updates is positive, driven by strong revenue growth, expanding order books, and operational advancements in both energy storage and telecom infrastructure segments. The increase in profit margins and successful project completions contribute to favorable business momentum. However, neutral tones emerge from the scheduled analyst meet emphasizing only publicly available information, reflecting transparency without new material disclosures. No significant negative developments were reported in the recent updates, supporting a stable outlook based on current operational performance.
Source List
Analytical Overview
Analysis Summary
Pace Digitek’s valuation metrics, including a trailing P/E of 12.35 and forward P/E of 10.42, are below the industry average, suggesting relatively attractive pricing compared to peers with higher multiples. The company demonstrates a positive growth trajectory with quarterly revenue growth of 13.5% and a healthy 8.3% annual revenue increase, supported by expanding order books in energy storage and telecom infrastructure. Financial health appears solid with a low debt-to-equity ratio of 0.11 and positive free cash flow of INR 2.68 billion, despite negative operating cash flow, indicating effective capital management. Sector-specific opportunities include growth in renewable energy and telecom infrastructure expansion in India, aligned with government initiatives and increasing connectivity demands. The regulatory environment in India favors renewable energy adoption and telecom infrastructure development, providing a supportive backdrop for Pace Digitek’s business model.
Overall Business and Market Assessment
Supporting Factors: strong revenue and profit growth, expanding order books in key segments, and a conservative valuation relative to peers
Risk Factors: operating cash flow negativity, limited institutional ownership, and margin sustainability concerns highlighted in recent reports
SWOT Analysis
Strengths
- Pace Digitek holds a strong market position in telecom passive infrastructure and renewable energy solutions.
- The company maintains a low debt-to-equity ratio of 0.11, indicating financial stability.
- Robust order book exceeding INR 11,000 crore supports future revenue visibility.
- High return on equity of 22.13% reflects efficient capital utilization.
Weaknesses
- Negative operating cash flow may indicate short-term liquidity challenges.
- Limited institutional ownership at 4.7% could affect stock liquidity and market perception.
- Profit margins, while positive, show pressure and concerns over sustainability.
- Price to cash flow ratio is negative, suggesting cash flow management issues.
Opportunities
- Expansion in Battery Energy Storage Systems manufacturing aligns with growing renewable energy demand.
- Government initiatives to enhance telecom infrastructure provide growth avenues.
- Increasing international presence in Africa and Myanmar offers market diversification.
- Localization and automation efforts can improve operational efficiency and margins.
Threats
- Competitive pressures in telecom equipment and energy storage sectors may impact market share.
- Regulatory changes or delays in project execution could affect revenue streams.
- Macroeconomic volatility and currency fluctuations may influence profitability.
- Limited institutional interest might constrain capital raising and stock performance.
Company Description
Pace Digitek Limited is a listed company focusing on providing multi-disciplinary solutions, particularly in the telecom passive infrastructure sector. It specializes in power management solutions, including switch-mode power supplies and hybrid DC power systems, as well as solar solutions like charge control units. The company also manufactures lithium-ion battery systems for energy storage in telecom applications and is venturing into battery energy storage systems (BESS). Pace Digitek offers turnkey solutions across India and internationally, with operations in Africa and Myanmar. The company's products and services play a crucial role in supporting telecom tower infrastructure, contributing to the growth of the telecommunications industry and enhancing connectivity globally. With a strong emphasis on innovation and sustainability, Pace Digitek continues to expand its footprint in renewable energy and telecom power solutions.