
Oracle Corporation (ORCL)
Stock Analysis Report
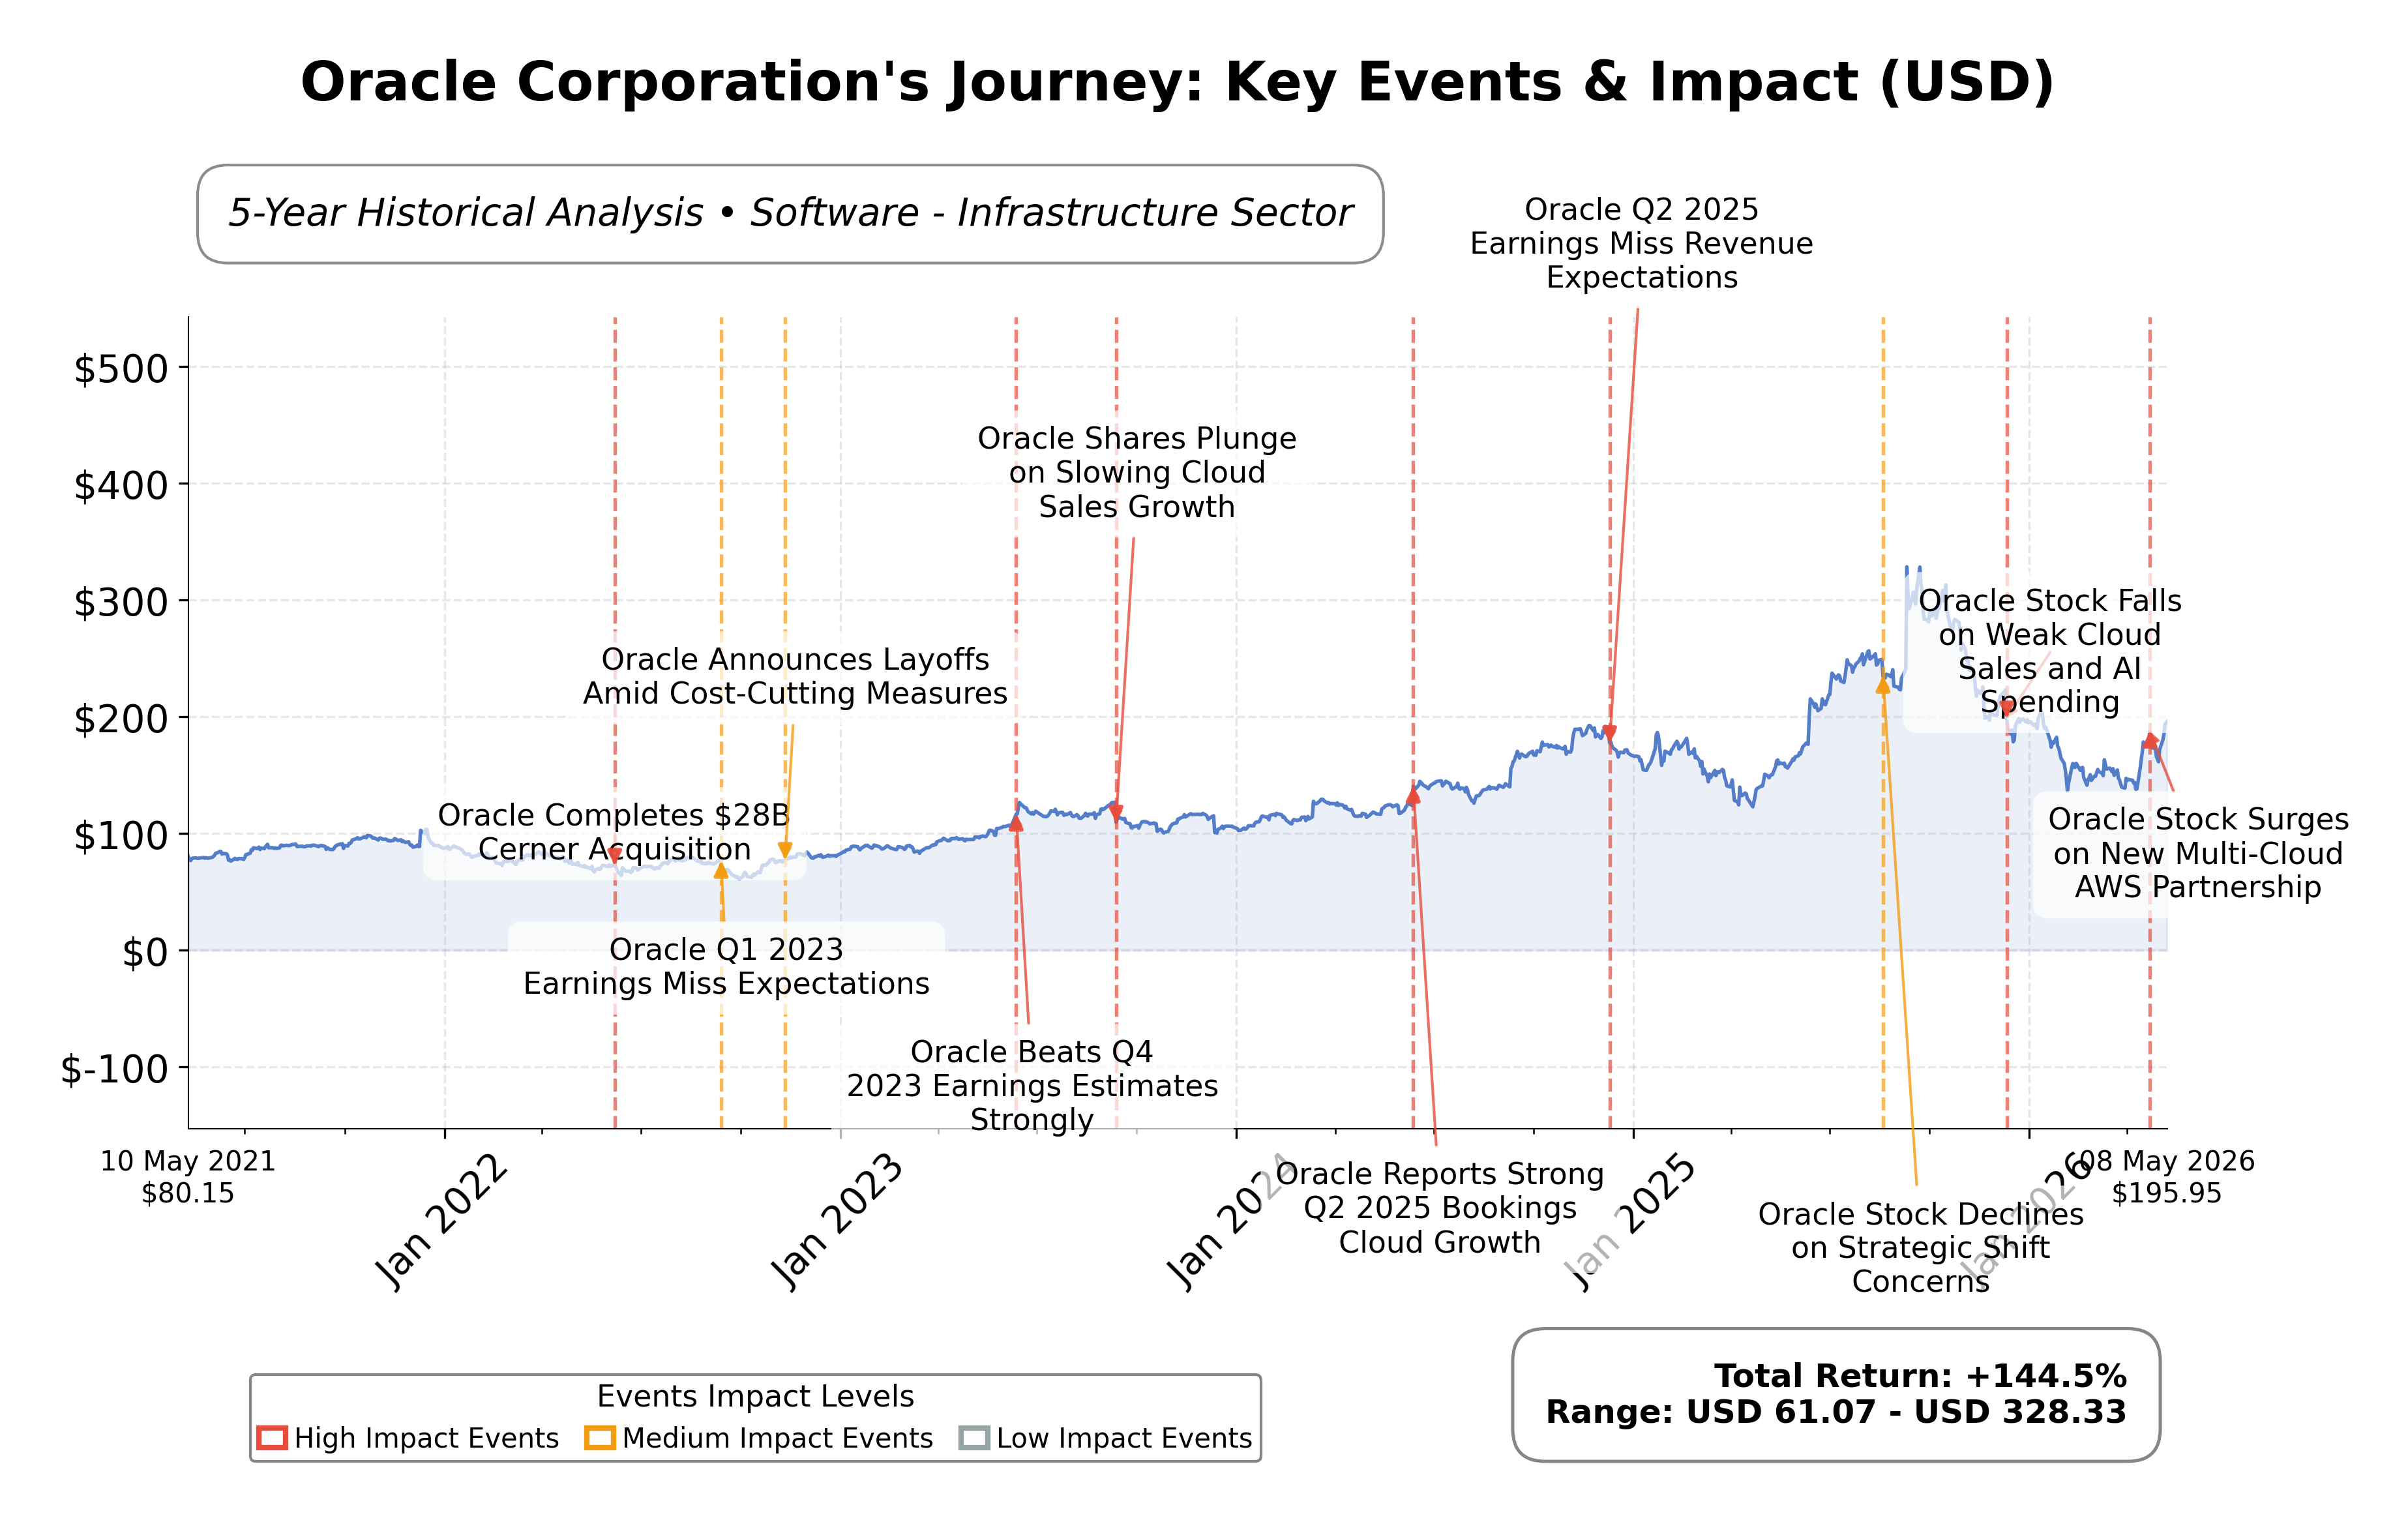
Stock Journey
Key Positives and Key Risks
Pros
- Strong profitability with a return on equity (ROE) of 57.57%, indicating efficient capital use and earnings generation.
- Robust revenue growth with quarterly revenue increasing by 21.7% and Oracle Cloud Infrastructure revenue up 84% year over year, reflecting accelerating demand.
- Substantial market capitalization of $494.19 billion and a large backlog of $553 billion in remaining performance obligations supporting future revenue visibility.
Cons
- High financial leverage with total debt of $162.16 billion and a debt-to-equity ratio exceeding 400%, posing balance sheet risks.
- Negative free cash flow of approximately -$22.30 billion, indicating significant capital expenditures and cash outflows.
- Customer concentration risk due to reliance on a few large AI hyperscalers and contracts, increasing exposure to execution and counterparty risks.
Disclosure: This information is for general awareness and does not constitute investment advice
Report Summary
Oracle Corporation operates as a leading provider of enterprise software and cloud infrastructure solutions globally. Listed on the NYSE under the symbol ORCL, it competes in the Technology sector, specifically within the Software - Infrastructure industry. The company’s product portfolio includes Oracle Cloud applications such as ERP, EPM, SCM, HCM, and NetSuite, along with cloud infrastructure services, databases, middleware, and hardware systems. Oracle serves a broad customer base across industries, government agencies, and educational institutions, leveraging both direct and indirect sales channels.
Financially, Oracle reported trailing twelve months (TTM) revenue of approximately $64.08 billion, with a gross margin of 64.56%, operating margin of 32.68%, and a net profit margin of 25.30%. The company’s return on equity (ROE) stands at an impressive 57.57%, while return on assets (ROA) is 6.34%, indicating strong profitability and efficient asset utilization. Oracle’s operating cash flow totaled about $23.51 billion TTM, although free cash flow was negative at approximately -$22.30 billion, reflecting significant capital expenditures and investments.
Valuation metrics show Oracle trading at a trailing price-to-earnings (P/E) ratio of 30.85 and a forward P/E of 21.39, with a price-to-book (P/B) ratio of 14.73 and an enterprise value to EBITDA (EV/EBITDA) multiple of 22.69. The market capitalization is approximately $494.19 billion. The stock’s 52-week range spans from $134.57 to $345.72, with the current price at $195.94, positioning it below its recent highs but well above the low, suggesting a moderate valuation relative to its historical price range.
Oracle’s strengths include a robust backlog of $553 billion in remaining performance obligations, strong AI-driven cloud revenue growth with Oracle Cloud Infrastructure (OCI) revenue up 84% year over year, and a leading market position in enterprise software and cloud infrastructure. Key risks involve high leverage with total debt exceeding $162 billion, customer concentration particularly with large AI hyperscalers, and execution risks related to aggressive capacity expansion. Recent strategic moves include a $16 billion financing for a Michigan AI data center and classified U.S. Department of Defense AI contracts, underscoring its commitment to AI infrastructure.
Technically, the stock exhibits a mixed trend with price below the 200-day moving average but above the 50-day average, and momentum indicators showing moderate strength. Recent news highlights strong AI-related growth but also investor concerns over debt and customer concentration risks. Overall, the data suggests a nuanced outlook where market participants may consider accumulation on strength while remaining vigilant to execution and leverage risks.
Company and Industry Overview
Company Basics
Price Performance
Company Size
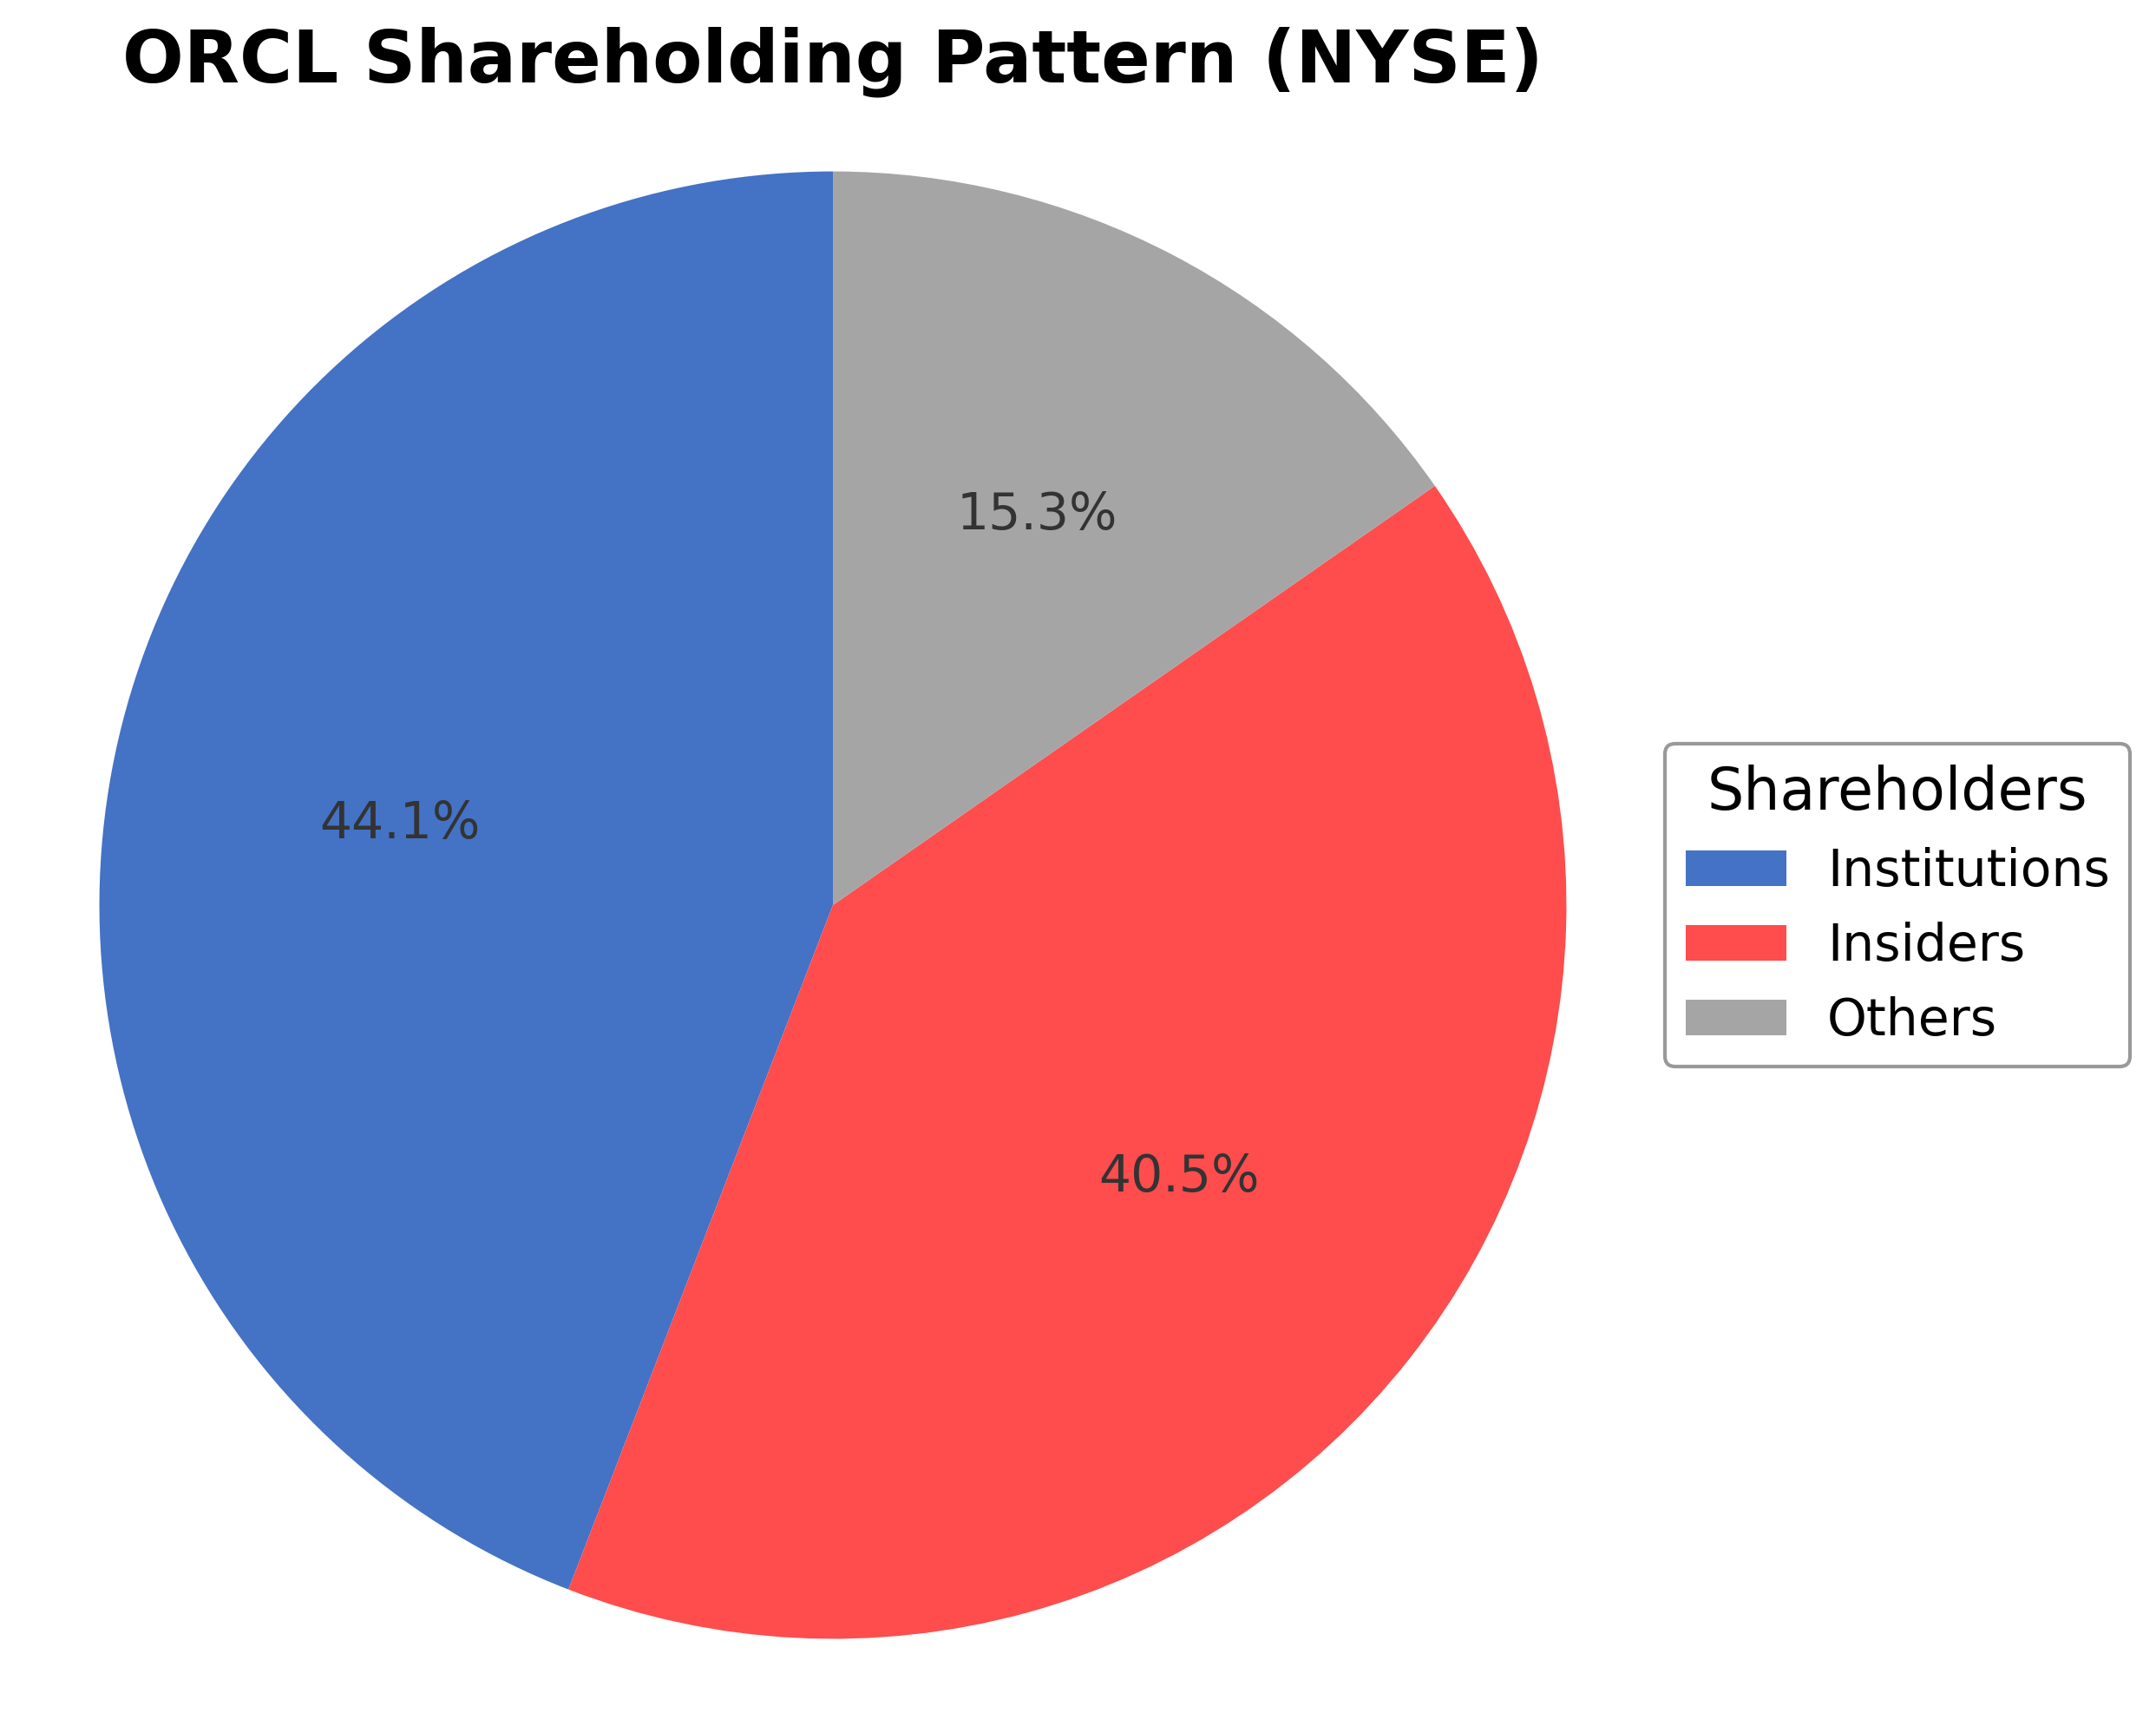
Shareholding Pattern
Sector and Industry Analysis
The enterprise software and cloud services sector, encompassing database management and cloud infrastructure, is experiencing robust growth with a global market valued at $60.5 billion in 2024. Forecasts indicate continued expansion through 2033, driven by increasing digital transformation across industries such as finance, healthcare, and telecommunications. Key players include Oracle Corporation, which offers a broad portfolio of database software, cloud applications, and hardware systems critical for data management and operational analytics.
Industry trends highlight accelerated cloud adoption and migration, fueled by the COVID-19 pandemic and rising demand for secure, scalable cloud solutions. Competitive dynamics emphasize the importance of hybrid cloud architectures, AI workloads, and sovereign infrastructure mandates, creating high barriers to entry for new entrants lacking localized cloud regions and regulatory alignment. Established firms like Oracle leverage extensive R&D investments and regional partnerships to maintain market leadership amid rapid technological advancements and evolving customer needs.
The regulatory landscape is increasingly shaped by data sovereignty and cybersecurity requirements, particularly in mature markets like North America, where policy incentives support domestic cloud infrastructure development. Government cloud budgets and digital modernization initiatives are driving demand for compliant, AI-capable platforms. These regulations necessitate that providers deepen sovereign-grade infrastructure and adapt offerings to meet stringent compliance standards, influencing strategic investments and market positioning across regions.
Note: Analysis synthesized from industry research, market reports, and regulatory filings. Information is subject to change based on market conditions.
Financial Ratios Dashboard
Illustrative Scenario Analysis
DCF Assumptions:
Method: Two-Stage EPS-Priority Model
Financials

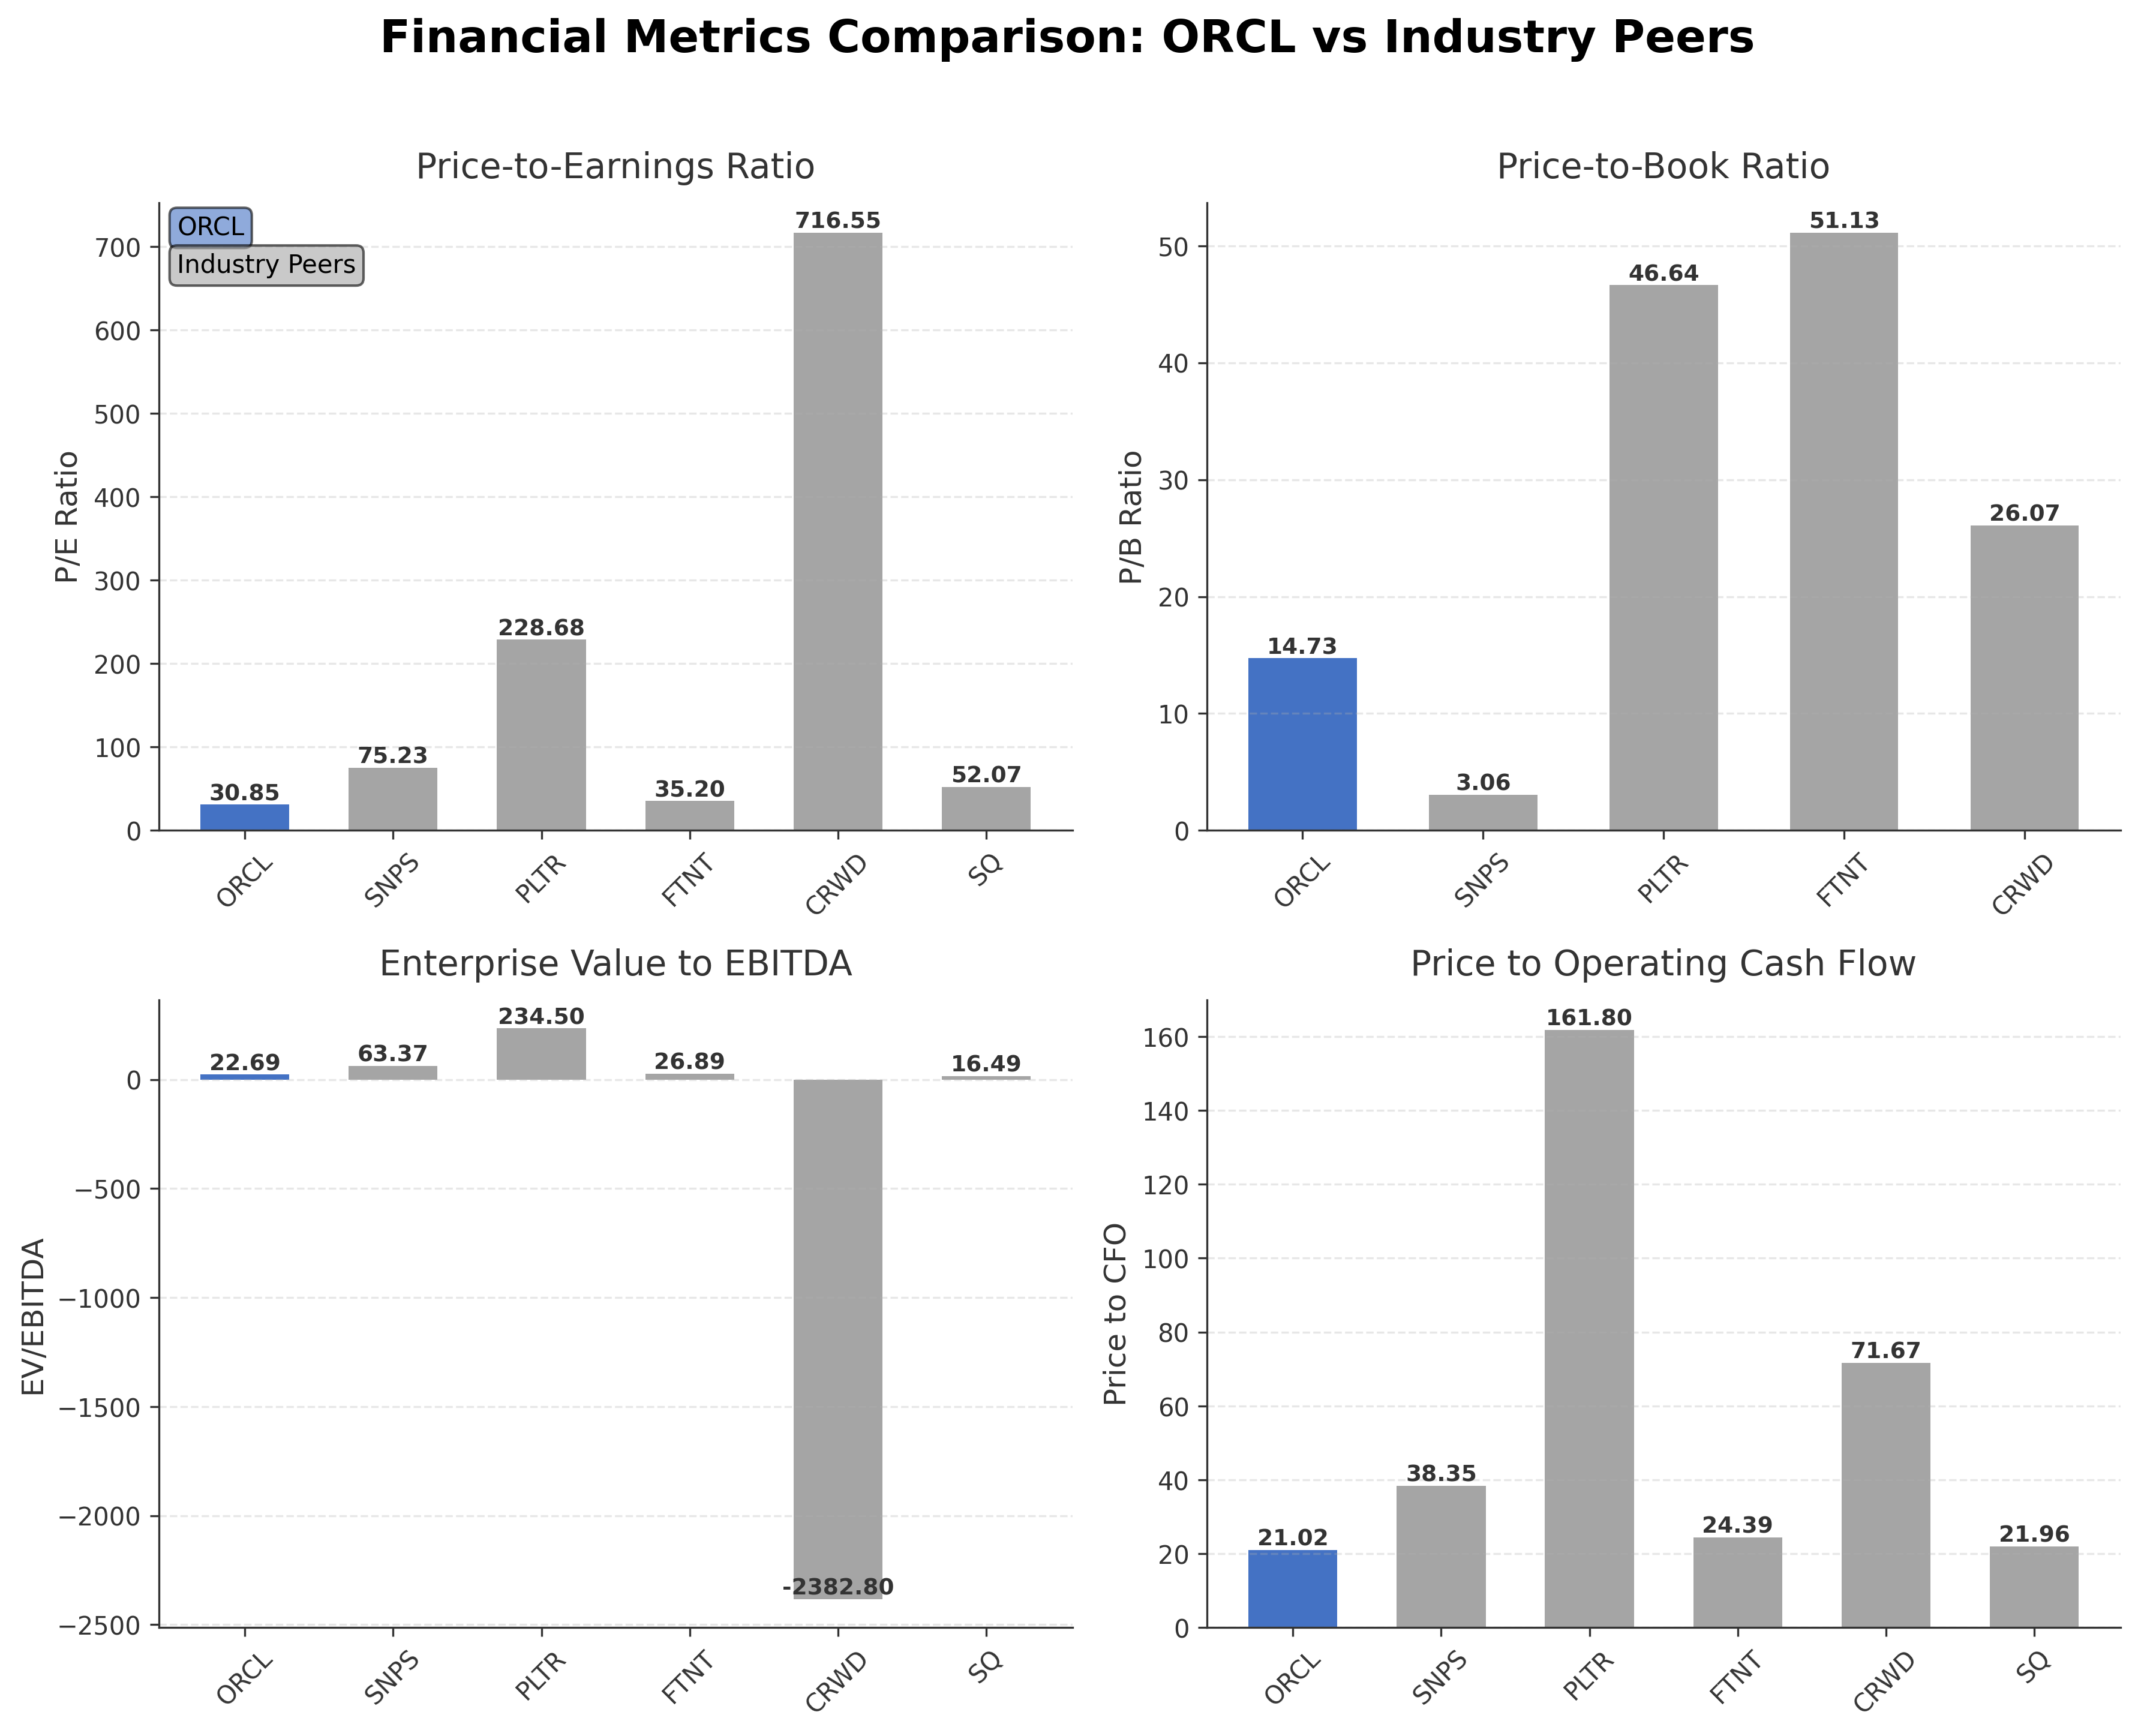
Peer Analysis
| Company Name | Market Cap | P/E Ratio | P/B Ratio | EV/EBITDA | Price to CFO |
|---|---|---|---|---|---|
| Oracle Corporation | $494.19B | 30.85 | 14.73 | 22.69 | 21.02 |
| Synopsys, Inc. | $93.68B | 75.23 | 3.06 | 63.37 | 38.35 |
| Palantir Technologies Inc. | $345.36B | 228.68 | 46.64 | 234.50 | 161.80 |
| Fortinet Inc. | $63.17B | 35.20 | 51.13 | 26.89 | 24.39 |
| CrowdStrike Holdings, Inc. | $115.56B | 716.55 | 26.07 | -2382.80 | 71.67 |
| Block, Inc. | $44.50B | 52.07 | N/A | 16.49 | 21.96 |
| Microsoft Corp | $3.08T | 24.70 | 7.88 | 16.95 | 18.10 |
| Palo Alto Networks Inc. | $146.86B | 99.44 | 13.32 | 92.58 | 36.95 |
Comparison Analysis: Oracle Corporation exhibits a strong return on equity (57.57%) significantly higher than its peers, reflecting robust profitability. Its valuation multiples such as P/E of 30.85 and EV/EBITDA of 22.69 are moderate relative to high-growth peers like Palantir and CrowdStrike, which trade at substantially higher multiples but with lower profitability. Oracle’s price-to-book ratio of 14.73 is elevated compared to most peers, indicating premium valuation possibly due to its market leadership and scale. Market capitalization at $494.19 billion positions Oracle as a large-cap leader, second only to Microsoft among the group. Overall, Oracle balances strong fundamentals with a valuation profile that suggests mature growth relative to more speculative peers.
Financial Metrics Comparison with Peers
Financial Statements
Comprehensive financial data including income, balance sheet, and cash flow metrics
Income Statement
| fiscal_date | 2025-05-31 | 2024-05-31 | 2023-05-31 | 2022-05-31 | 2021-05-31 |
|---|---|---|---|---|---|
| Sales | 57.40B | 52.96B | 49.95B | 42.44B | 40.48B |
| Cost Of Goods | 16.93B | 15.14B | 13.56B | 8.88B | 7.86B |
| Gross Profit | 40.47B | 37.82B | 36.39B | 33.56B | 32.62B |
| Operating Expense Research And Development | 9.86B | 8.91B | 8.62B | 7.22B | 6.53B |
| Operating Expense Selling General And Administrative | 10.25B | 9.82B | 10.41B | 9.36B | 8.94B |
| Operating Income | 18.05B | 16.07B | 13.77B | 15.83B | 15.78B |
| Non Operating Interest Income | 578.00M | 451.00M | 285.00M | 94.00M | 101.00M |
| Non Operating Interest Expense | 3.58B | 3.51B | 3.50B | 2.75B | 2.50B |
| Other Income Expense | -892.00M | -1.27B | -1.43B | -5.52B | -388.00M |
| Pretax Income | 14.16B | 11.74B | 9.13B | 7.65B | 13.00B |
| Income Tax | 1.72B | 1.27B | 623.00M | 932.00M | -747.00M |
| Net Income | 12.44B | 10.47B | 8.50B | 6.72B | 13.75B |
| Eps Basic | 4.46 | 3.82 | 3.15 | 2.49 | 4.67 |
| Eps Diluted | 4.34 | 3.71 | 3.07 | 2.41 | 4.55 |
| Basic Shares Outstanding | 2.79B | 2.74B | 2.70B | 2.70B | 2.94B |
| Diluted Shares Outstanding | 2.79B | 2.74B | 2.70B | 2.70B | 2.94B |
| Ebit | 17.74B | 15.26B | 12.63B | 10.40B | 15.49B |
| Ebitda | 24.71B | 22.64B | 20.00B | 18.78B | 18.83B |
| Net Income Continuous Operations | 12.44B | 10.47B | 8.50B | 6.72B | 13.75B |
| Operating Expense Other Operating Expenses | N/A | N/A | 103.00M | 4.69B | 129.00M |
Source: Financial statements and regulatory filings
Balance Sheet
| fiscal_date | 2025-05-31 | 2024-05-31 | 2023-05-31 | 2022-05-31 | 2021-05-31 |
|---|---|---|---|---|---|
| Cash And Cash Equivalents | 10.79B | 10.45B | 9.77B | 21.38B | 30.10B |
| Accounts Receivable | 8.56B | 7.87B | 6.92B | 5.95B | 5.41B |
| Total Assets | 168.36B | 140.98B | 134.38B | 109.30B | 131.11B |
| Total Liabilities | 147.39B | 131.74B | 132.83B | 115.06B | 125.16B |
| Long Term Debt | 96.83B | 76.26B | 86.42B | 72.13B | 76.00B |
| Shareholders Equity | 20.97B | 9.24B | 1.56B | -5.77B | 5.95B |
Source: Financial statements and regulatory filings
Cash Flow Statement
| fiscal_date | 2025-05-31 | 2024-05-31 | 2023-05-31 | 2022-05-31 | 2021-05-31 |
|---|---|---|---|---|---|
| Operating Activities Net Income | 12.44B | 10.47B | 8.50B | 6.72B | 13.75B |
| Operating Activities Depreciation | 6.17B | 6.14B | 6.11B | 3.12B | 2.92B |
| Operating Activities Deferred Taxes | -1.64B | -2.14B | -2.17B | -1.15B | -2.42B |
| Operating Activities Stock Based Compensation | 4.67B | 3.97B | 3.55B | 2.61B | 1.84B |
| Operating Activities Other Non Cash Items | 667.00M | 720.00M | 661.00M | 220.00M | -39.00M |
| Operating Activities Accounts Receivable | -653.00M | -965.00M | -151.00M | -874.00M | 333.00M |
| Operating Activities Accounts Payable | -608.00M | -594.00M | -281.00M | -733.00M | -23.00M |
| Operating Activities Other Assets Liabilities | 154.00M | 656.00M | 781.00M | 7.00M | 405.00M |
| Operating Activities Operating Cash Flow | 21.21B | 18.26B | 17.00B | 9.93B | 16.75B |
| Investing Activities Net Acquisitions | 0.00 | -63.00M | -27.72B | -148.00M | -41.00M |
| Investing Activities Purchase Of Investments | -1.27B | -1.00B | -1.18B | -10.27B | -37.98B |
| Investing Activities Sale Of Investments | 776.00M | 572.00M | 1.11B | 26.15B | 27.06B |
| Investing Activities Investing Cash Flow | -496.00M | -494.00M | -27.79B | 15.73B | -10.96B |
| Financing Activities Long Term Debt Issuance | 19.55B | 0.00 | 33.49B | 0.00 | 14.93B |
| Financing Activities Long Term Debt Payments | -15.84B | -3.50B | -21.05B | -8.25B | -2.63B |
| Financing Activities Short Term Debt Issuance | 1.89B | -167.00M | 500.00M | 0.00 | 0.00 |
| Financing Activities Common Stock Issuance | 653.00M | 742.00M | 1.19B | 482.00M | 1.79B |
| Financing Activities Common Stock Repurchase | -1.50B | -3.24B | -2.50B | -17.34B | -21.60B |
| Financing Activities Common Dividends | -4.74B | -4.39B | -3.67B | -3.46B | -3.06B |
| Financing Activities Other Financing Charges | 1.09B | 4.00M | -55.00M | -560.00M | 196.00M |
| Financing Activities Financing Cash Flow | 1.10B | -10.55B | 7.91B | -29.13B | -10.38B |
| End Cash Position | 10.79B | 10.45B | 9.77B | 21.38B | 30.10B |
| Income Tax Paid | 4.02B | 3.56B | 3.01B | 2.57B | 3.19B |
| Interest Paid | 3.37B | 3.65B | 3.25B | 2.73B | 2.41B |
| Free Cash Flow | -394.00M | 11.81B | 8.47B | 5.03B | 13.75B |
Source: Financial statements and regulatory filings
Technical Analysis
Key Insights
- Oracle’s current trend shows consolidation with price trading below the 200-day moving average ($212.33) but above the 50-day moving average ($155.48), indicating mixed momentum.
- Key support levels are near $135 and $155, while resistance is observed around $210 and the 52-week high of $345.72.
- The stock is positioned between its short-term and long-term moving averages, suggesting potential indecision among traders.
- Momentum indicators show the Relative Strength Index (RSI) in a neutral range around mid-50s, MACD near the signal line, and stochastic oscillators indicating no extreme conditions.
- Multi-timeframe analysis reveals daily charts with sideways movement, weekly charts showing a mild downtrend from recent highs, and monthly charts indicating a longer-term uptrend.
- Potential market scenarios include a breakout above $210 to resume uptrend or a breakdown below $155 support triggering further consolidation or decline.
Trending News
1. Headline: Oracle Corporation stock (US68389X1054): AI?driven cloud growth lifts shares and RPO to record level
Summary: Oracle Corporation's stock has climbed on strong AI?driven cloud growth, with remaining performance obligations surging to $553 billion and OCI revenue up 84% year over year in the latest quarter.
Sentiment: positive
2. Headline: Winch Advisory Services LLC Sells 7,725 Shares of Oracle Corporation $ORCL
Summary: Winch Advisory Services LLC lessened its stake in Oracle Corporation (NYSE:ORCL - Free Report) by 24.0% in the 4th quarter, according to the company in its most recent Form 13F filing with the SEC. The firm owned 24,502 shares of the enterprise software provider's stock after selling 7,725 shares d
Sentiment: positive
3. Headline: JLB & Associates Inc. Has $31.21 Million Stock Holdings in Oracle Corporation $ORCL
Summary: JLB & Associates Inc. lessened its holdings in Oracle Corporation (NYSE:ORCL - Free Report) by 2.9% during the 4th quarter, according to its most recent filing with the Securities and Exchange Commission (SEC). The firm owned 160,099 shares of the enterprise software provider's stock after selling
Sentiment: positive
4. Headline: ORCL Stock Drops after Hours as CoreWeave Losses and OpenAI Concerns Weigh on AI Boom - Forex News by FX Leaders
Summary: Oracle shares moved sharply lower as concerns surrounding OpenAI’s spending outlook and widening losses at CoreWeave intensified investor fears about the long-term sustainability of the AI infrastructure .
Sentiment: negative
5. Headline: Oracle Stock Rallies As AI Data Center Bets Accelerate
Summary: As Tim Sykes likes to remind his ... trading Oracle Corporation around this AI buildout, that means cutting losses fast, respecting the leverage, and letting only the best setups ride. This content is for educational and research purposes only and is not investment advice. This is stock news, not investment ...
Sentiment: positive
Recent Updates
News Summary
As of 2026-05-08. Oracle Corporation has advanced its AI infrastructure capabilities through significant contracts and financing arrangements, including a classified U.S. Department of Defense AI contract and $16 billion financing for a Michigan data center supporting OpenAI applications. The company reported record AI-driven cloud growth with Oracle Cloud Infrastructure revenue increasing 84% year over year and remaining performance obligations reaching $553 billion, indicating a substantial backlog. These developments underscore Oracle’s growing role in AI and cloud infrastructure, though they also highlight increased customer concentration and leverage risks. Institutional investors have made modest portfolio adjustments, with some reducing holdings slightly during the fourth quarter.
News Sentiment
The overall sentiment from recent updates is cautiously optimistic, driven by strong AI-related revenue growth and strategic contracts that reinforce Oracle’s market position. Positive momentum is tempered by concerns over high leverage and reliance on a few large customers, which introduces execution and financial risks. Institutional ownership changes suggest measured confidence with some profit-taking. The balance of news points to a company navigating growth opportunities alongside capital structure challenges, resulting in a nuanced outlook.
Source List
- https://finance.yahoo.com/markets/stocks/articles/why-oracle-orcl-18-4-052219402.html
- https://www.marketbeat.com/instant-alerts/filing-winch-advisory-services-llc-sells-7725-shares-of-oracle-corporation-orcl-2026-05-08/
Analytical Overview
Analysis Summary
Oracle’s valuation metrics, including a trailing P/E of 30.85 and forward P/E of 21.39, are moderate relative to the industry average P/E of approximately 30.85, suggesting the stock is fairly valued given its growth prospects. The company demonstrates a strong growth trajectory with 21.7% quarterly revenue growth and accelerating cloud revenue, supported by AI infrastructure expansion. Financial health shows high leverage with a total debt to equity ratio exceeding 400%, and negative free cash flow, indicating capital intensity and balance sheet risks. Sector-specific opportunities include the expanding AI and cloud infrastructure markets, while challenges involve execution risks and customer concentration. Market positioning benefits from Oracle’s scale and diversified software and cloud offerings, with competitive advantages in integrated enterprise solutions.
Overall Business and Market Assessment
Supporting Factors: Oracle’s robust AI-driven cloud revenue growth, substantial contract backlog, and strong profitability metrics such as a 57.57% ROE
Risk Factors: the elevated debt levels and reliance on a limited number of large customers, which could impact financial flexibility and execution
SWOT Analysis
Strengths
- Strong market leadership in enterprise software and cloud infrastructure.
- Robust profitability with a 57.57% return on equity.
- Substantial backlog of $553 billion in remaining performance obligations.
- Accelerating AI-driven cloud revenue growth, with OCI revenue up 84% year over year.
Weaknesses
- High leverage with total debt exceeding $162 billion and debt-to-equity ratio over 400%.
- Negative free cash flow indicating capital-intensive investments.
- Customer concentration risks with reliance on a few large AI hyperscalers.
- Price-to-book ratio significantly higher than industry peers, reflecting premium valuation.
Opportunities
- Expanding AI and cloud infrastructure markets driving demand for Oracle’s services.
- Strategic contracts including U.S. Department of Defense AI projects and large data center financing.
- Growing adoption of integrated cloud applications and autonomous database technologies.
- Increasing enterprise digital transformation accelerating software subscription growth.
Threats
- Execution risks related to aggressive capacity expansion and debt management.
- Competitive pressures from other large cloud and software providers.
- Potential regulatory scrutiny on data privacy and technology infrastructure.
- Market volatility impacting technology sector valuations and investment sentiment.
Company Description
Oracle Corporation provides products and services addressing enterprise information technology environments worldwide. Its core offerings include Oracle Cloud software as a service applications such as Oracle Fusion Cloud Enterprise Resource Planning (ERP), Enterprise Performance Management (EPM), Supply Chain and Manufacturing Management (SCM), Human Capital Management (HCM), NetSuite applications suite, and Oracle Health applications, along with Fusion Sales, Service, and Marketing. The company delivers cloud-based infrastructure technologies featuring Oracle Database, MySQL Database, Java development language, middleware tools, autonomous database, AI, Internet-of-Things, machine learning, digital assistants, and blockchain capabilities, as well as compute, storage, and networking services. Oracle Corporation also supplies hardware solutions like engineered systems, enterprise servers, storage, industry-specific hardware, virtualization software, operating systems, and management tools. Its services segment encompasses consulting, advanced support, and education. Operating through Cloud and License, Hardware, and Services segments, Oracle Corporation serves businesses across industries, government agencies, and educational institutions via direct sales and indirect channels. Founded in 1977 and headquartered in Austin, Texas, it plays a pivotal role in enterprise software and cloud infrastructure markets.