

One 97 Communications Ltd (PAYTM)
Stock Analysis Report
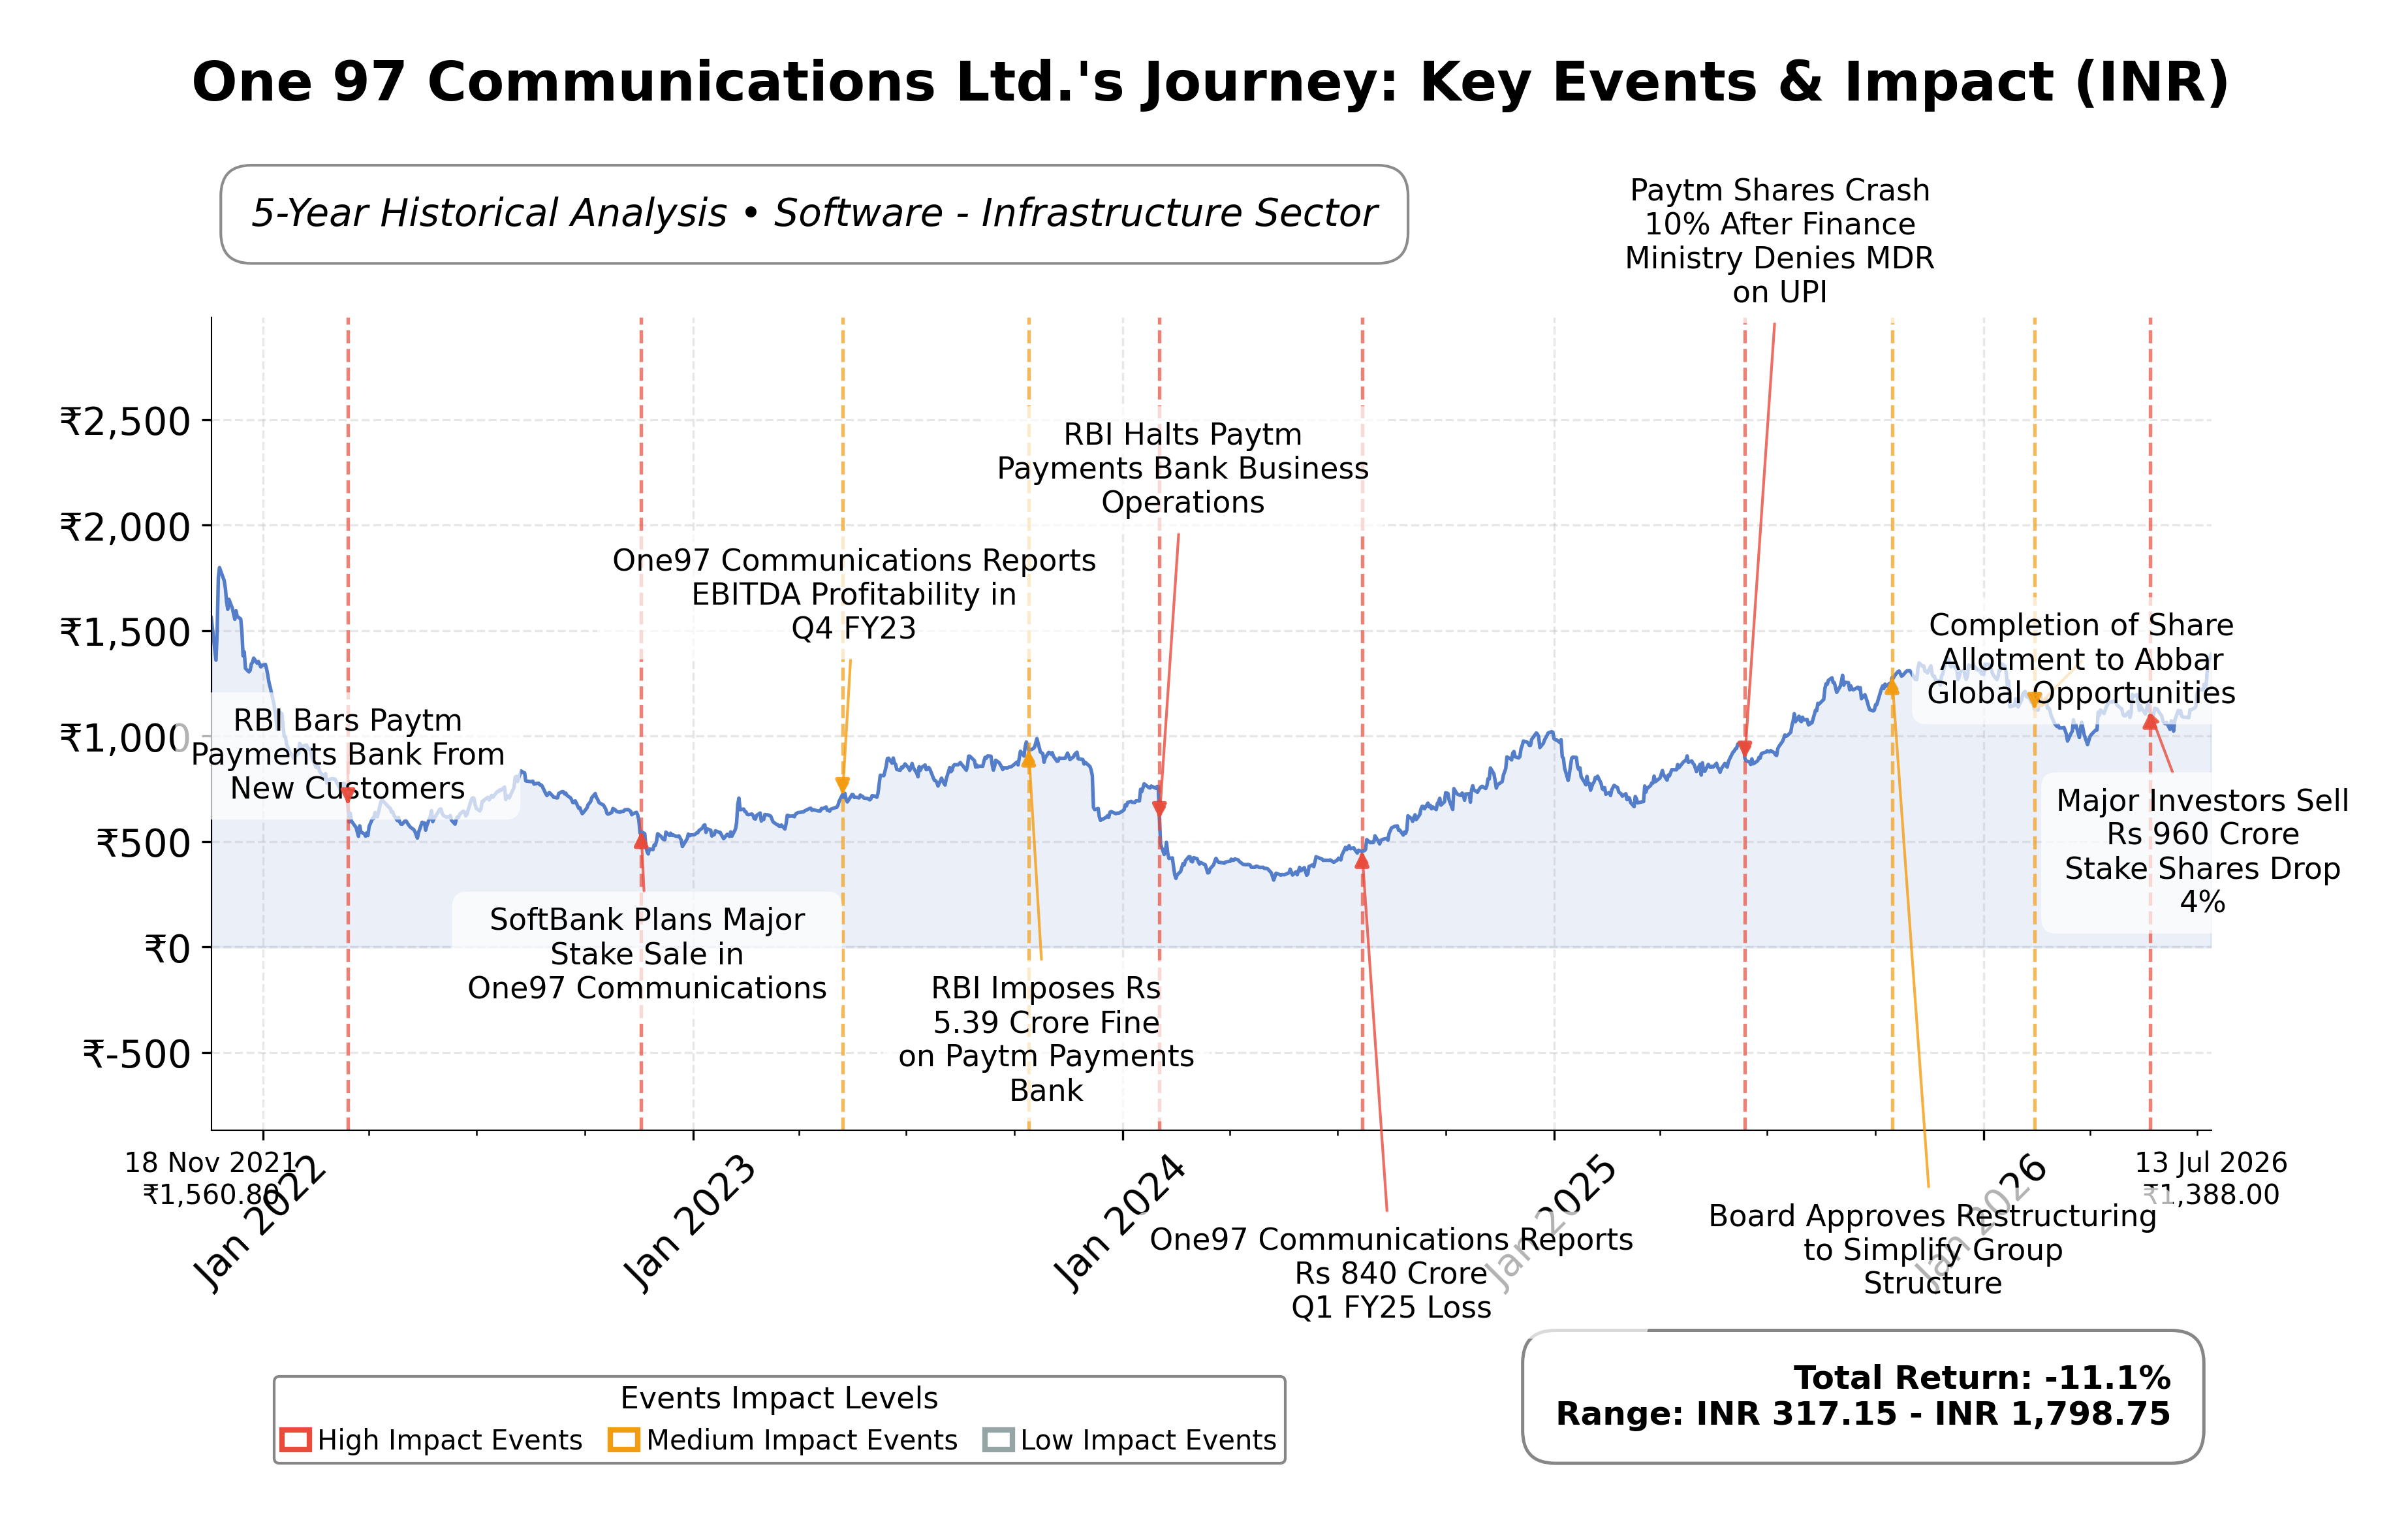
Stock Journey
Key Positives and Key Risks
Pros
- Achieved first full year of profitability with EBITDA of ₹502 crore and net income of ₹552 crore, indicating operational turnaround.
- Strong cash reserves of ₹1,459 crore and low debt of ₹17.2 crore support financial stability and liquidity.
- Robust revenue growth of 22% year-over-year demonstrates expanding market presence and business momentum.
Cons
- High trailing P/E ratio of 147.54 and EV/EBITDA of 132.57 suggest elevated valuation relative to earnings and cash flow.
- Negative operating cash flow of ₹-743 crore raises concerns about core cash generation despite positive free cash flow.
- Return on equity of 3.56% is modest, indicating limited profitability efficiency compared to industry peers.
Disclosure: This information is for general awareness and does not constitute investment advice
Report Summary
One 97 Communications Ltd., widely known by its brand Paytm, is a leading Indian technology company operating in the digital payments and financial technology sector. Listed on the NSE under the symbol PAYTM, it offers a broad ecosystem of services including mobile payments, digital wallets, utility bill payments, point-of-sale terminals, and financial products such as loans and insurance. The company is positioned as a key player in India's transition to a cashless economy, serving a large consumer base and numerous merchants across urban and rural markets. It operates primarily in the technology sector within the software infrastructure industry.
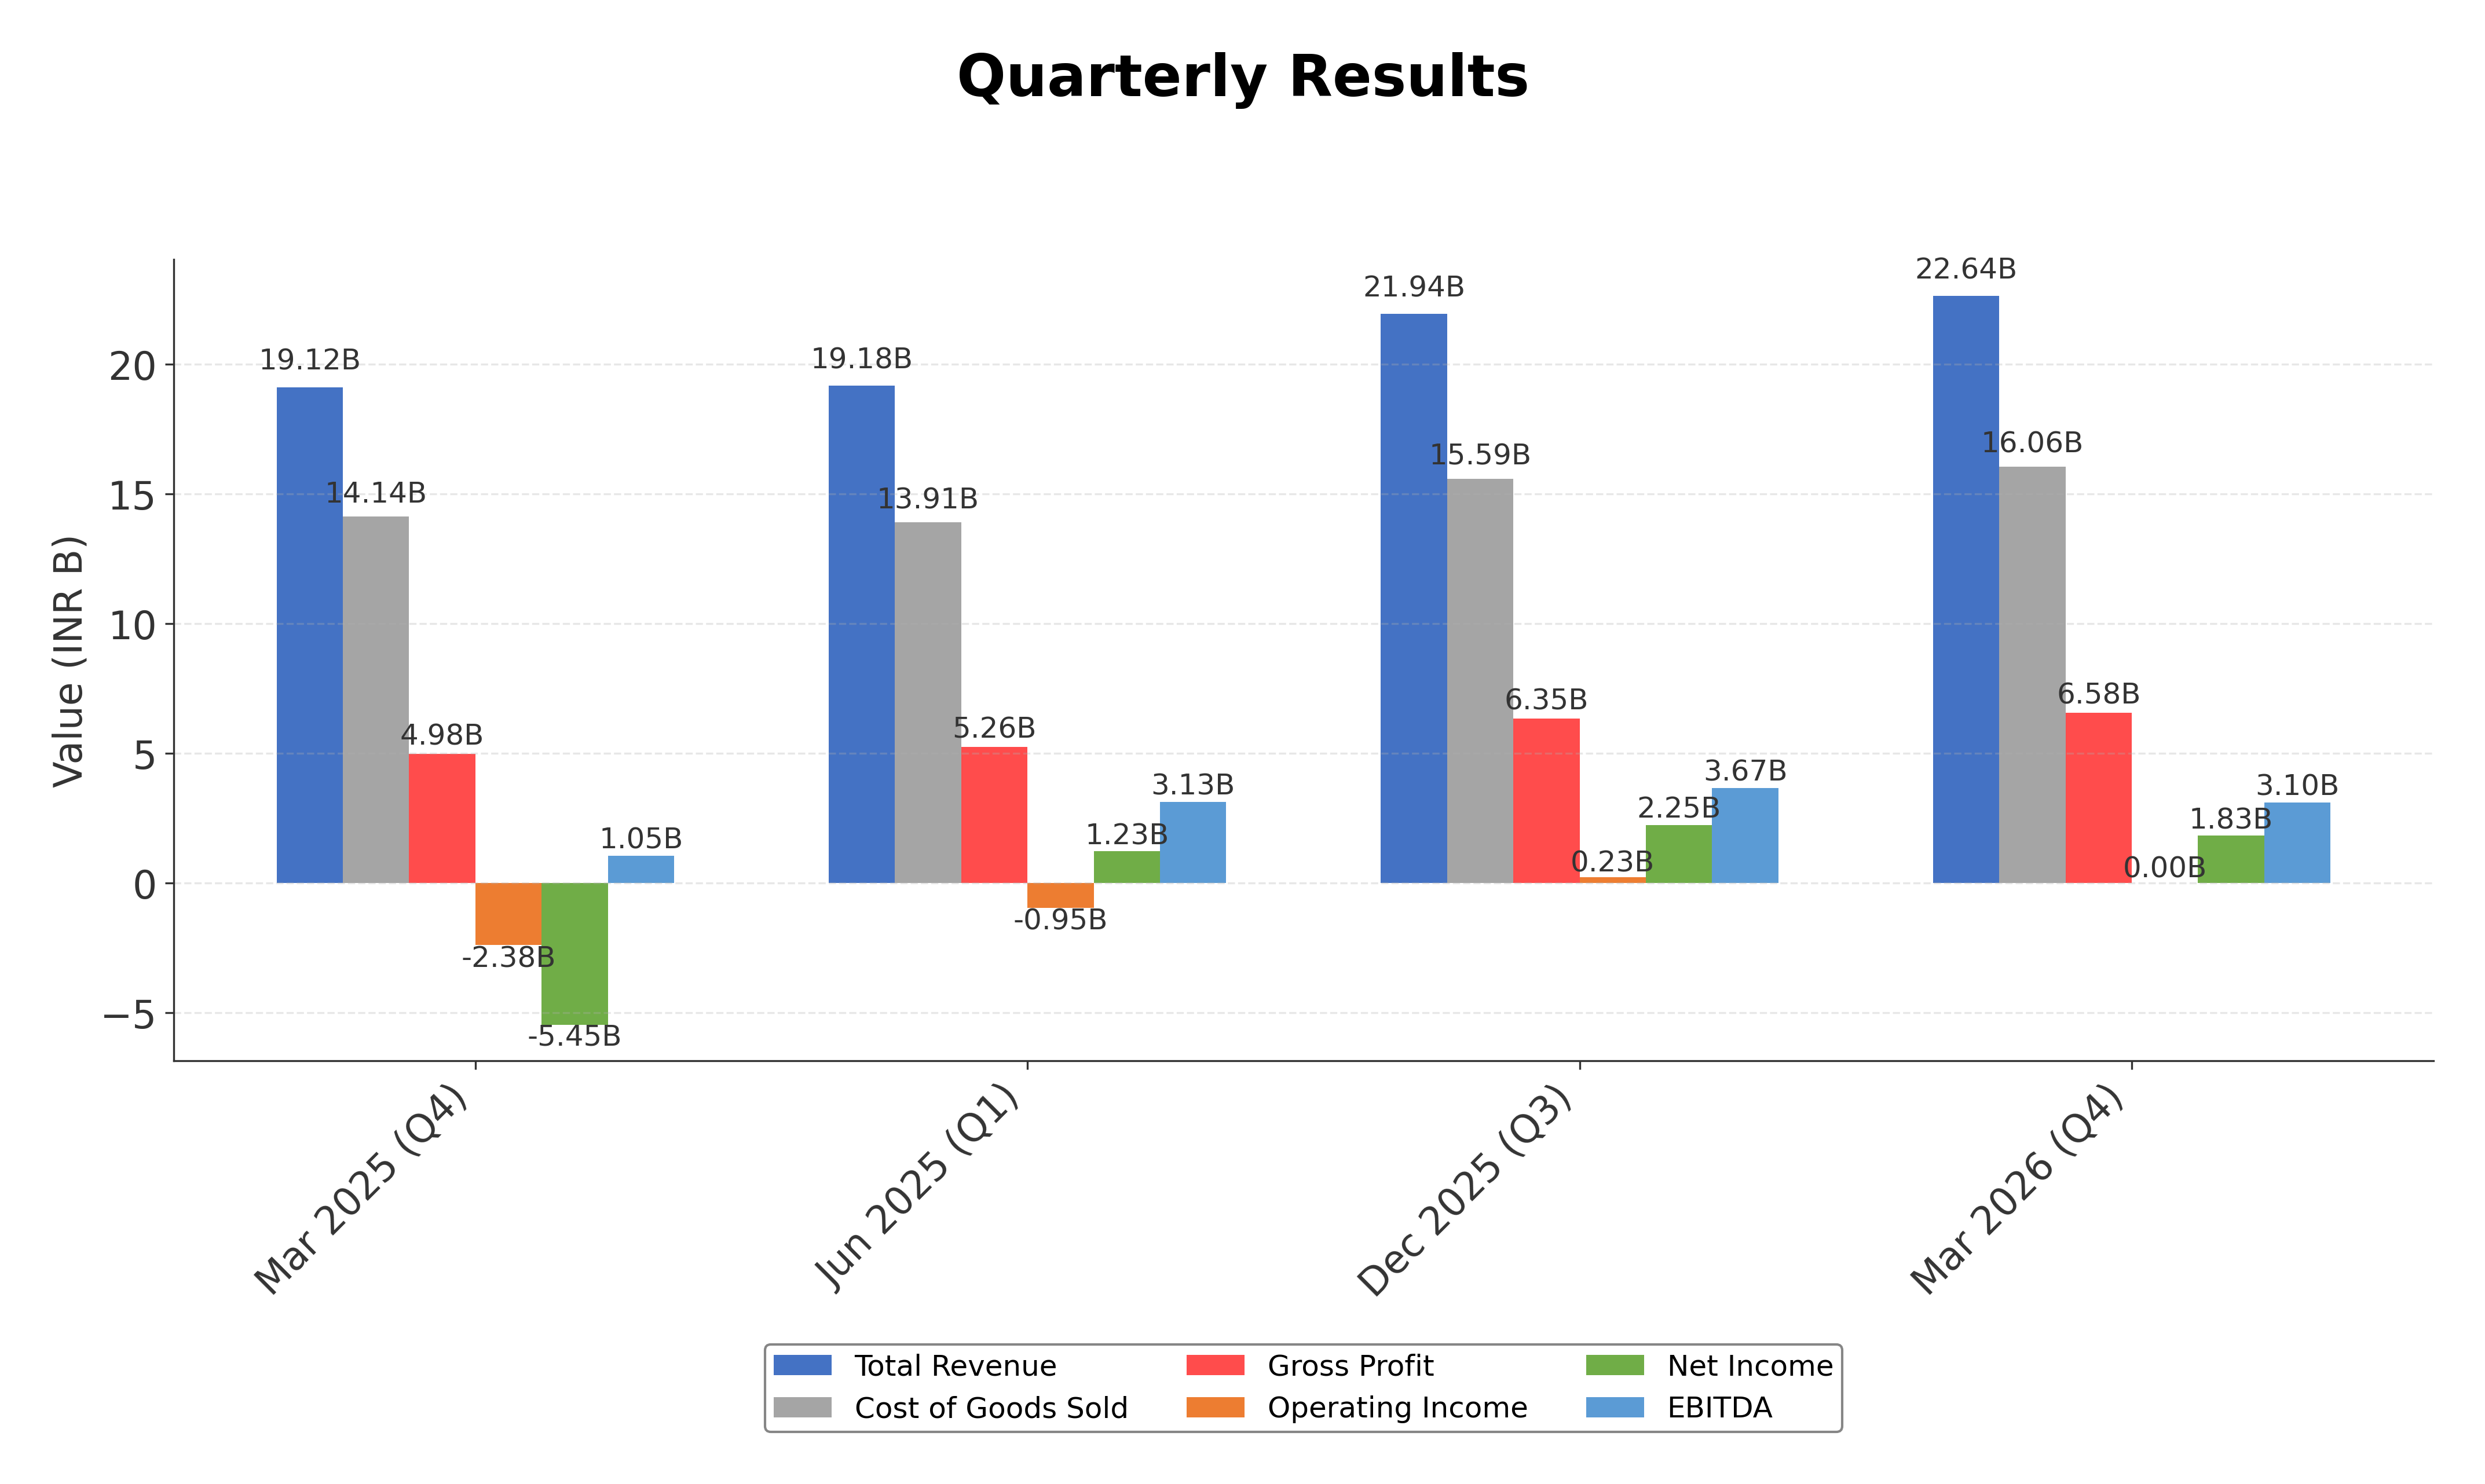
Financially, the company reported trailing twelve months (TTM) revenue of approximately ₹8,437 crore with a gross margin of 29.06%, an operating margin of 7.11%, and a net profit margin of 6.55%. Its return on equity (ROE) stands at 3.56%, and return on assets (ROA) is slightly negative at -0.12%, indicating modest profitability and some challenges in asset utilization. The company achieved a positive EBITDA of ₹502 crore for FY 2026, marking a significant turnaround from prior losses, and demonstrated a quarterly revenue growth rate of 18.4% year-over-year, reflecting strong operational momentum.
Valuation metrics show a trailing price-to-earnings (P/E) ratio of 147.54 and a forward P/E of 40.56, suggesting the stock is priced at a premium relative to current earnings but with expectations of improved profitability. The price-to-book (P/B) ratio is 5.05, and the enterprise value to EBITDA (EV/EBITDA) ratio is notably high at 132.57, indicating elevated valuation multiples. The stock trades near its 52-week high of ₹1,381.80, with a current price of ₹1,376.90, reflecting recent strength in the share price within a 52-week range of ₹930.60 to ₹1,381.80.
Key strengths include a strong cash position of approximately ₹1,459 crore and very low debt of ₹17.2 crore, resulting in a robust current ratio of 2.55, which supports liquidity and operational flexibility. The company has demonstrated market leadership in digital payments and has recently secured regulatory approvals such as a Luxembourg payment institution license for its European arm. Risks include regulatory challenges, intense competition in fintech, and the high valuation multiples that may pressure future returns. Recent strategic actions include prioritizing AI investments for product and operational enhancements and focusing on technology partnerships rather than pursuing an NBFC license.
Technically, the stock exhibits a positive trend, trading near its 52-week high and above key moving averages, with mixed momentum indicators suggesting cautious optimism. Market activity has increased, evidenced by a surge in derivatives open interest. Overall, the data suggests a market environment where accumulation may be considered by some participants, while others may maintain a watchful stance given valuation and momentum factors.
Company and Industry Overview
Company Basics
Price Performance
Company Size
Shareholding Pattern
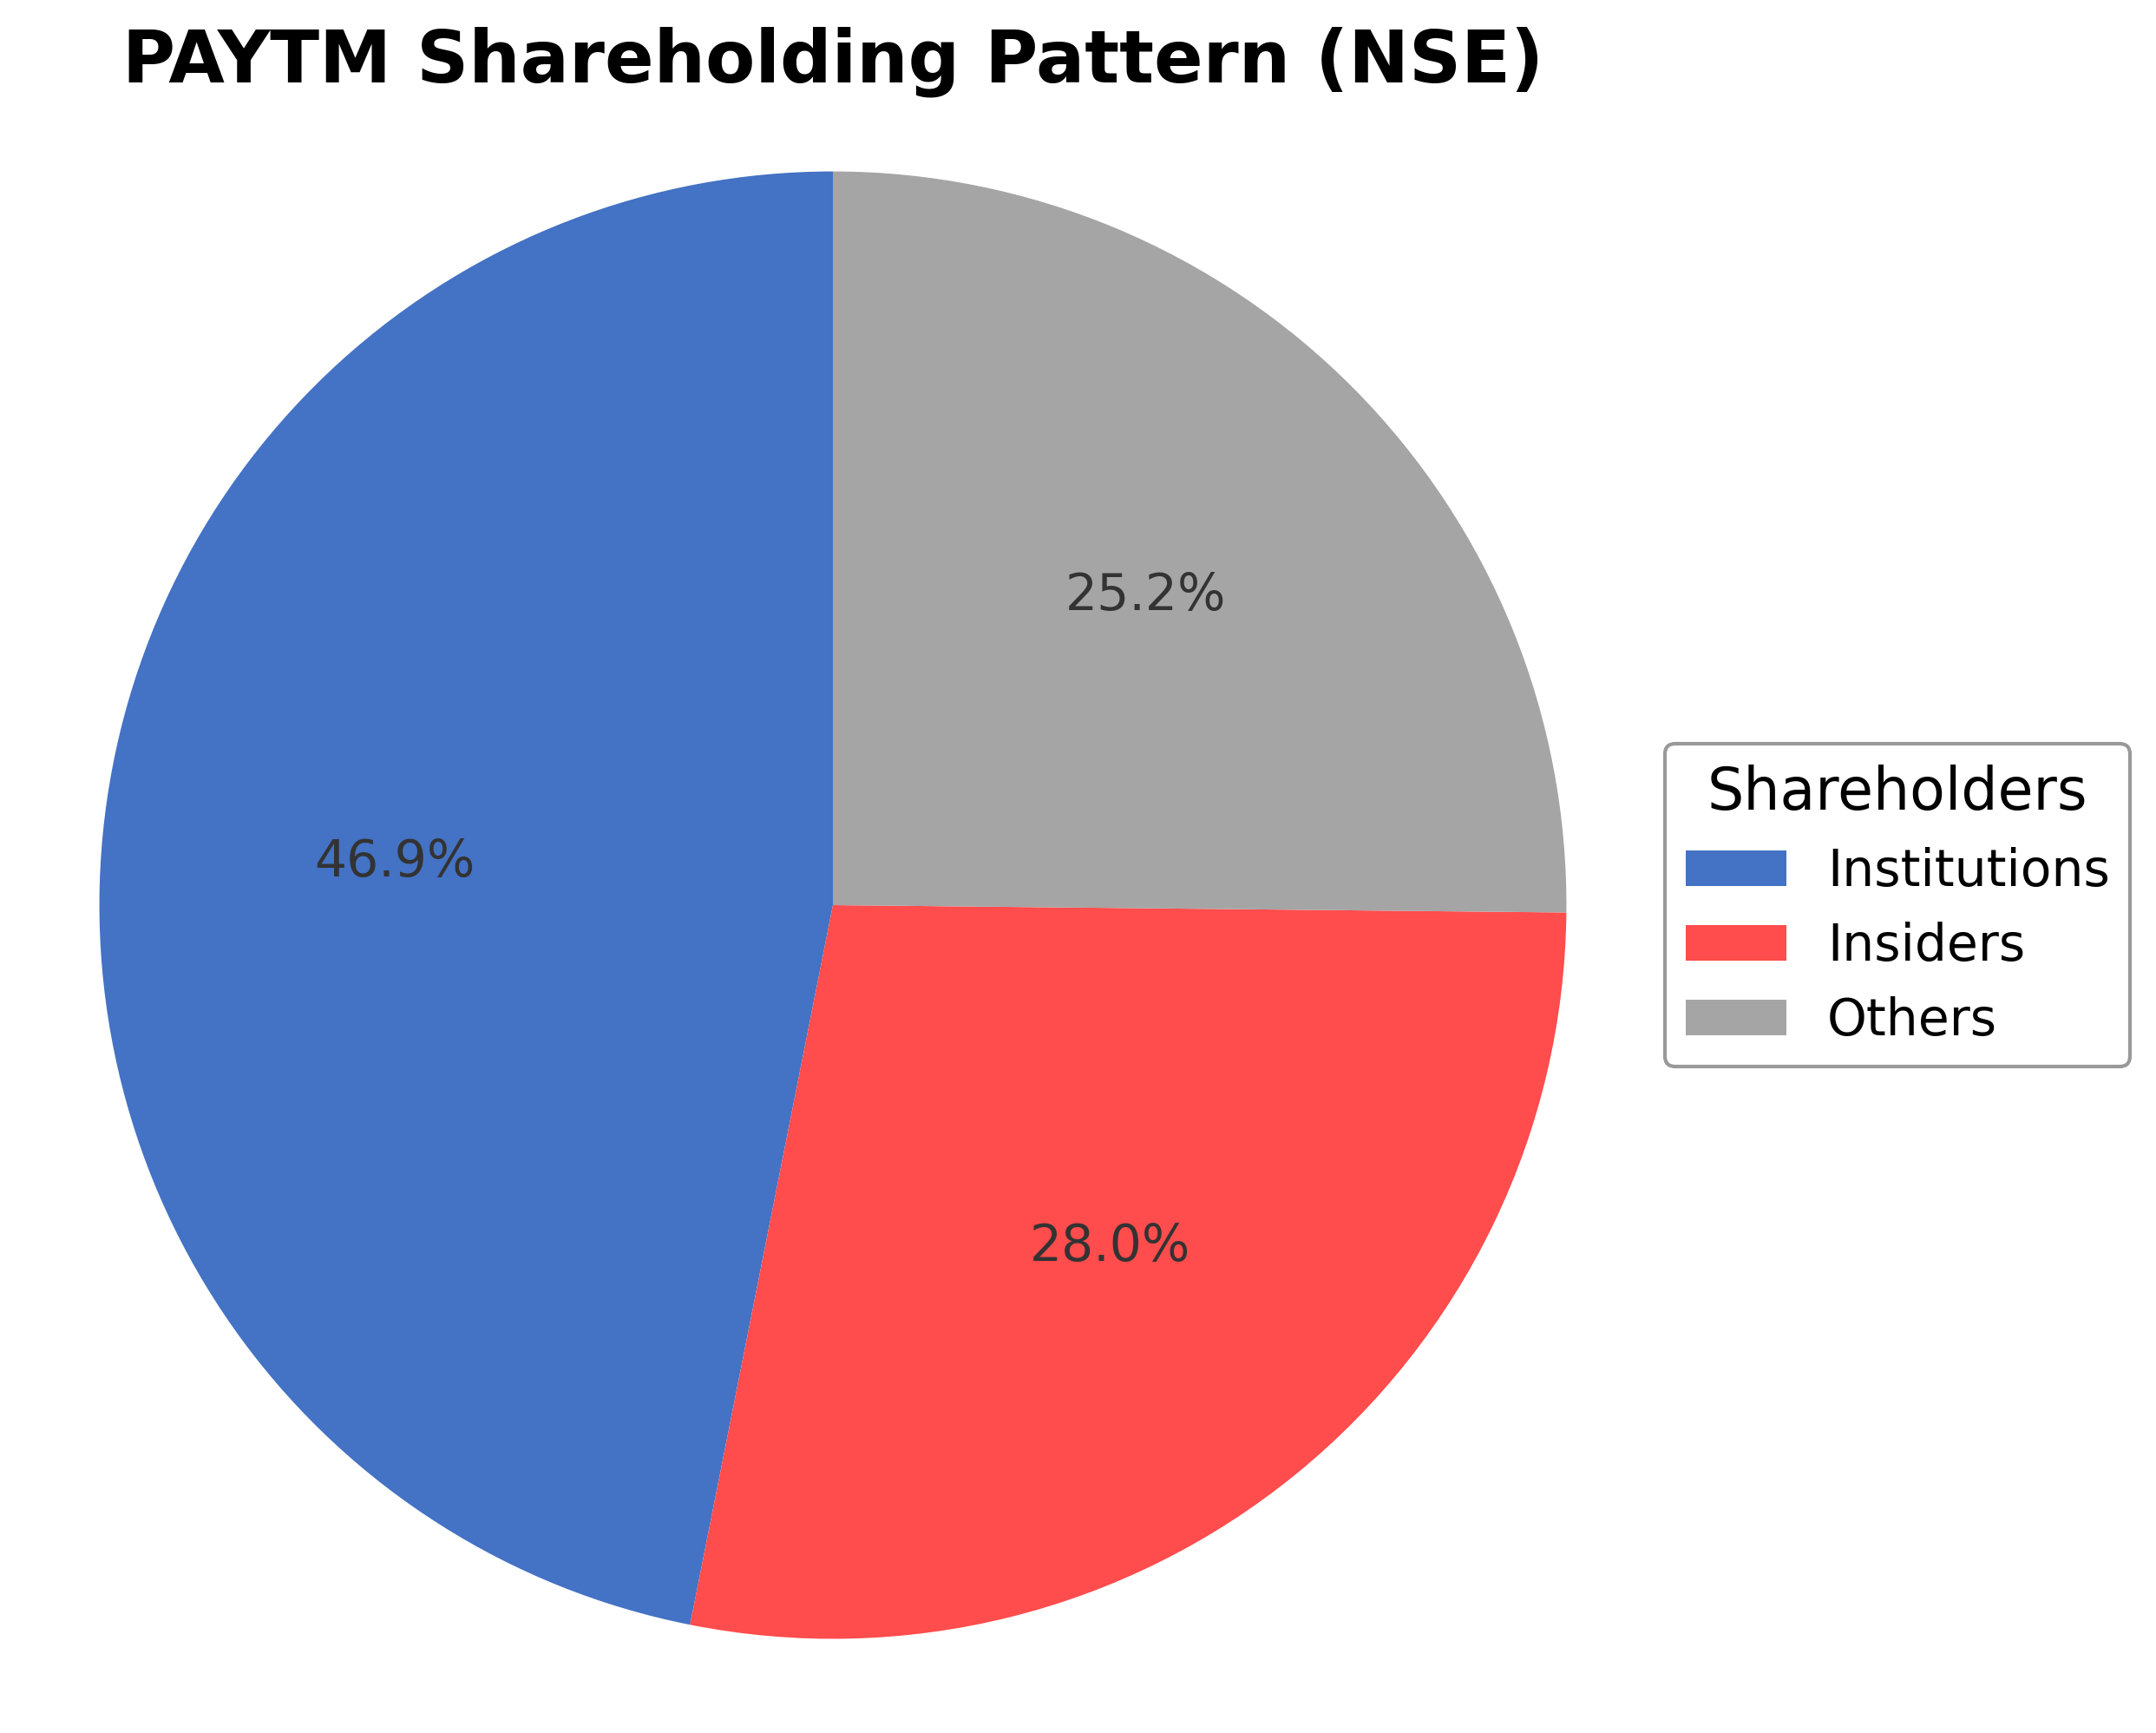
The ownership structure of One 97 Communications Ltd. comprises insiders holding approximately 27.96% of shares, institutional investors owning 46.88%, and other shareholders including retail investors and employee stock plans holding around 25.16%. Over the past 12-24 months, institutional investors have shown active accumulation, with several major funds increasing their stakes, reflecting growing confidence in the company's strategic direction and market positioning. The significant institutional ownership suggests strong governance oversight and alignment with shareholder interests. This shareholding pattern indicates a balanced market sentiment, with insiders maintaining meaningful stakes while institutions provide liquidity and strategic support, potentially influencing future corporate actions and governance.
Sector and Industry Analysis
The digital payments and fintech sector in India has witnessed rapid expansion, driven by increasing smartphone penetration and government initiatives promoting cashless transactions. The market size has grown substantially, with transaction volumes and values rising year-over-year, positioning India as one of the largest and fastest-growing fintech markets globally. Key players include Paytm (One97 Communications Ltd.), PhonePe, Google Pay, and traditional banks expanding their digital offerings.
Industry trends highlight a shift towards integrated financial services platforms offering payments, lending, insurance, and wealth management. Competitive dynamics are intense, with firms investing heavily in technology and customer acquisition to build scale and ecosystem lock-in. Barriers to entry include regulatory compliance, technological infrastructure, and the need for extensive user trust and network effects, which favor established players like Paytm.
The regulatory environment is evolving, with authorities emphasizing data security, consumer protection, and licensing requirements for payment institutions. Recent approvals, such as Paytm Europe Payments S.A.’s license from Luxembourg’s financial regulator, reflect the sector’s international expansion and compliance focus. Ongoing regulatory scrutiny and evolving norms are expected to shape operational practices and market access in the near term.
Note: Analysis synthesized from industry research, market reports, and regulatory filings. Information is subject to change based on market conditions.
Financial Ratios Dashboard
Illustrative Scenario Analysis
DCF Assumptions:
Method: Two-Stage EPS-Priority Model
Financials
Peer Analysis
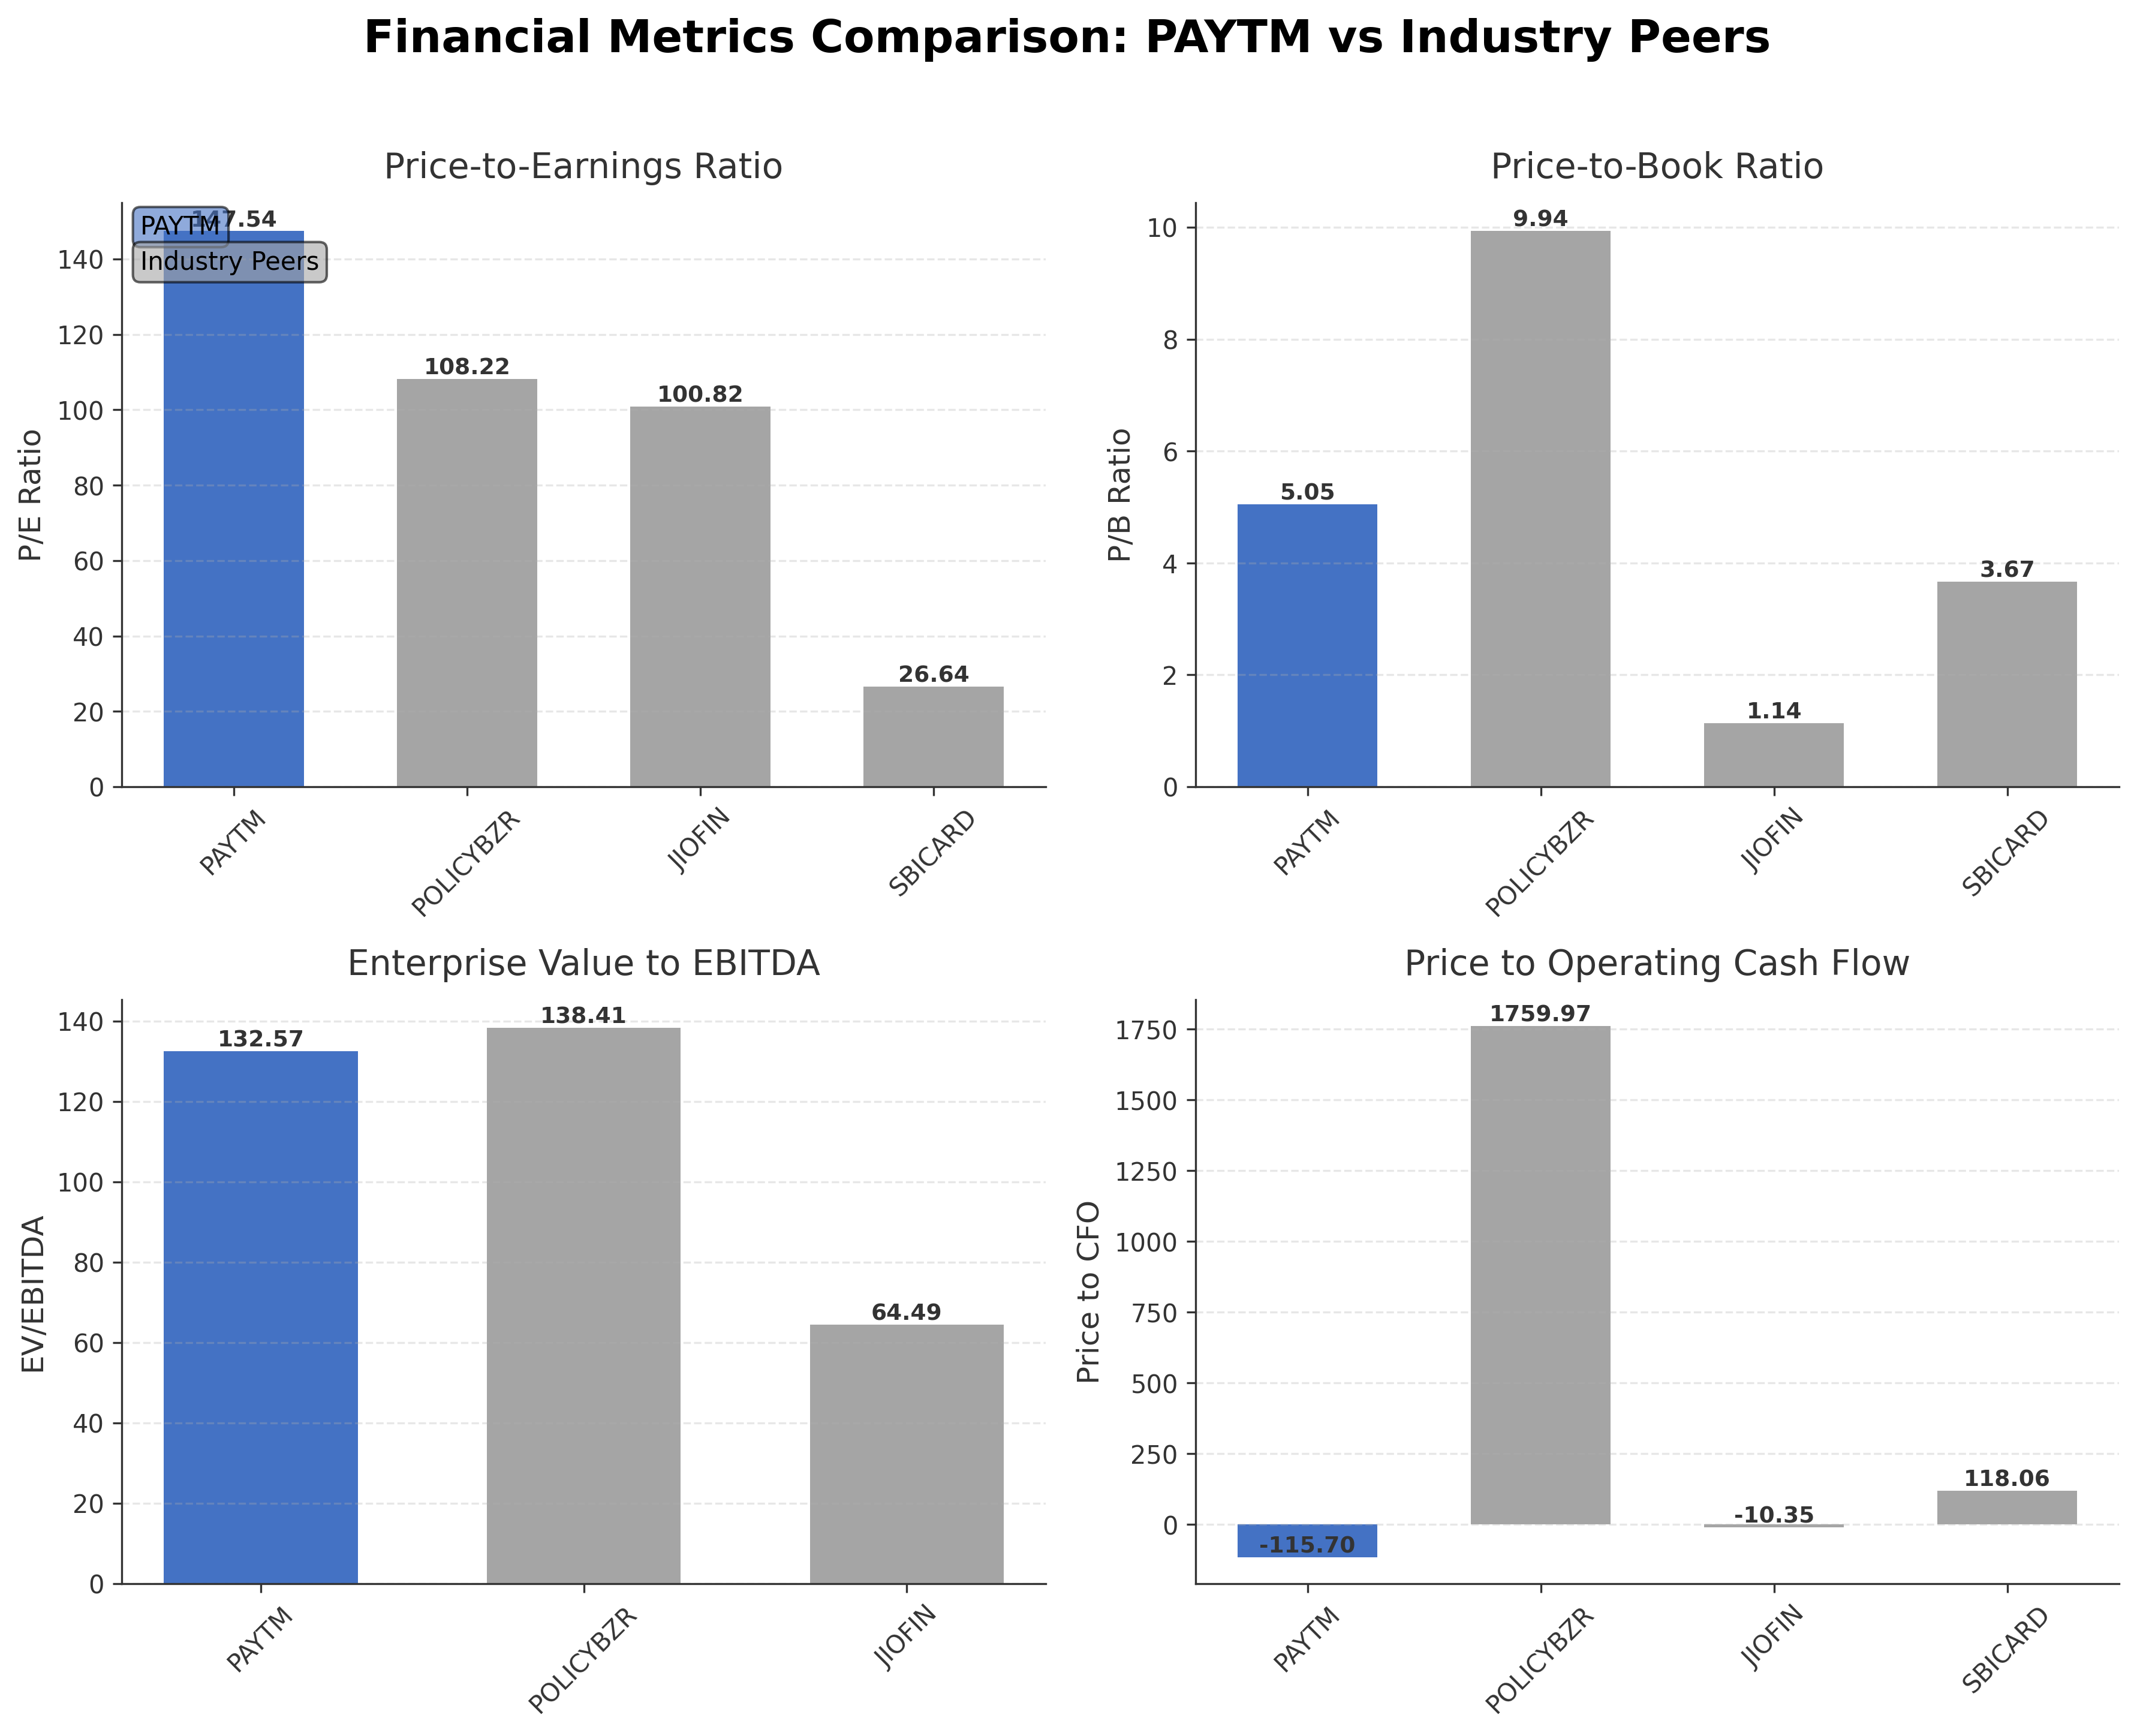
| Company Name | Market Cap | P/E Ratio | P/B Ratio | EV/EBITDA | Price to CFO |
|---|---|---|---|---|---|
| One 97 Communications Ltd. | ₹859.67B | 147.54 | 5.05 | 132.57 | -115.70 |
| Pb Fintech Ltd. | ₹730.21B | 108.22 | 9.94 | 138.41 | 1759.97 |
| Jio Financial Services Limited | ₹1.60T | 100.82 | 1.14 | 64.49 | -10.35 |
| SBI Cards and Payment Services Ltd. | ₹582.06B | 26.64 | 3.67 | N/A | 118.06 |
Comparison Analysis: One 97 Communications Ltd. trades at higher valuation multiples compared to its regional peers, with a trailing P/E of 147.54 significantly above SBI Cards and Payment Services Ltd.'s 26.64 and Jio Financial Services' 100.82. Its P/B ratio of 5.05 is moderate relative to Pb Fintech Ltd.'s 9.94 but higher than Jio Financial's 1.14. The EV/EBITDA ratio of 132.57 is notably elevated, indicating premium pricing relative to earnings before interest, taxes, depreciation, and amortization. The company’s return on equity of 3.56% is lower than peers such as SBI Cards (14.69%) and Pb Fintech (9.74%), suggesting comparatively modest profitability. Price to CFO is negative, reflecting operational cash flow challenges, contrasting with positive values for some peers. Overall, One 97 Communications shows strong market capitalization but faces valuation and profitability headwinds relative to its industry competitors.
Financial Metrics Comparison with Peers
Financial Statements
Comprehensive financial data including income, balance sheet, and cash flow metrics
Income Statement
| fiscal_date | 2026-03-31 | 2025-03-31 | 2024-03-31 | 2023-03-31 | 2022-03-31 |
|---|---|---|---|---|---|
| Sales | 84.37B | 69.00B | 98.70B | 79.04B | 49.62B |
| Cost Of Goods | 59.81B | 60.53B | 69.16B | 58.79B | 56.86B |
| Gross Profit | 24.56B | 8.47B | 29.54B | 20.25B | -7.23B |
| Operating Expense Selling General And Administrative | 5.36B | 6.59B | 10.46B | 11.90B | 10.04B |
| Operating Expense Other Operating Expenses | 14.18B | 16.95B | 12.90B | 9.70B | 5.63B |
| Operating Income | -420.00M | -21.80B | -16.12B | -20.91B | -25.36B |
| Non Operating Interest Expense | 180.00M | 160.00M | 243.00M | 233.00M | 394.00M |
| Pretax Income | 5.82B | -6.45B | -13.90B | -17.43B | -23.85B |
| Income Tax | 300.00M | 180.00M | 320.00M | 336.00M | 113.00M |
| Net Income | 5.52B | -6.63B | -14.22B | -17.77B | -23.96B |
| Eps Basic | 8.66 | -10.35 | -22.00 | -27.00 | -38.00 |
| Eps Diluted | 8.55 | -10.35 | -22.00 | -27.00 | -38.00 |
| Basic Shares Outstanding | 638.57M | 636.71M | 634.53M | 645.79M | 621.76M |
| Diluted Shares Outstanding | 638.57M | 636.71M | 634.53M | 645.79M | 621.76M |
| Ebit | 6.00B | -6.29B | -13.66B | -17.20B | -23.46B |
| Ebitda | 13.78B | -8.09B | -4.66B | -12.82B | -20.80B |
| Net Income Continuous Operations | 5.82B | -6.45B | -13.90B | -17.43B | -23.85B |
| Minority Interests | 10.00M | 40.00M | 54.00M | 6.00M | 35.00M |
| Preferred Stock Dividends | 0.00 | 0.00 | 0.00 | 0.00 | 0.00 |
| Non Operating Interest Income | N/A | 5.53B | 4.61B | 3.21B | 2.61B |
Data provided by Twelve Data
Balance Sheet
| fiscal_date | 2026-03-31 | 2025-03-31 | 2024-03-31 | 2023-03-31 | 2022-03-31 |
|---|---|---|---|---|---|
| Cash And Cash Equivalents | 32.85B | 20.77B | 42.77B | 33.12B | 13.79B |
| Accounts Receivable | 11.86B | 10.36B | 11.78B | 8.16B | 7.46B |
| Total Assets | 239.15B | 214.48B | 171.39B | 179.66B | 179.92B |
| Total Liabilities | 78.87B | 64.51B | 38.41B | 49.73B | 38.62B |
| Long Term Debt | 1.37B | 1.21B | 1.45B | 1.88B | 1.82B |
| Shareholders Equity | 160.28B | 149.97B | 132.98B | 129.93B | 141.29B |
Data provided by Twelve Data
Cash Flow Statement
| fiscal_date | 2026-03-31 | 2025-03-31 | 2024-03-31 | 2023-03-31 | 2022-03-31 |
|---|---|---|---|---|---|
| Operating Activities Net Income | 5.82B | -6.45B | -13.90B | -17.43B | -23.85B |
| Operating Activities Stock Based Compensation | 1.74B | 13.08B | 14.66B | 14.56B | 8.09B |
| Operating Activities Other Non Cash Items | -5.74B | -2.33B | -4.55B | -3.07B | -2.25B |
| Operating Activities Accounts Receivable | -4.74B | -1.19B | -5.06B | -5.54B | -3.19B |
| Operating Activities Other Assets Liabilities | -15.27B | -750.00M | 5.20B | 9.96B | 4.76B |
| Operating Activities Operating Cash Flow | -18.19B | 2.36B | -3.66B | -1.52B | -16.44B |
| Investing Activities Capital Expenditures | -4.68B | -3.17B | -8.12B | -6.97B | -5.04B |
| Investing Activities Net Acquisitions | 0.00 | 20.04B | N/A | N/A | 0.00 |
| Investing Activities Purchase Of Investments | -269.05B | -644.50B | -288.29B | -420.77B | -180.79B |
| Investing Activities Sale Of Investments | 283.34B | 602.88B | 294.86B | 450.44B | 128.91B |
| Investing Activities Investing Cash Flow | 9.61B | -24.75B | -680.00M | 22.70B | -56.92B |
| Financing Activities Common Stock Issuance | 20.00M | -60.00M | 296.00M | 76.00M | 83.07B |
| Financing Activities Financing Cash Flow | 20.00M | -139.00M | 299.00M | -10.48B | 81.76B |
| End Cash Position | 32.85B | 20.72B | 42.77B | 33.10B | 13.79B |
| Free Cash Flow | -12.22B | -4.43B | -1.71B | -2.90B | -17.43B |
| Financing Activities Other Financing Charges | N/A | -79.00M | 3.00M | -1.98B | -435.00M |
| Investing Activities Other Investing Activity | N/A | N/A | 877.00M | N/A | N/A |
| Financing Activities Common Stock Repurchase | N/A | N/A | 0.00 | -8.58B | 0.00 |
| Financing Activities Long Term Debt Payments | N/A | N/A | N/A | 0.00 | -435.00M |
| Financing Activities Short Term Debt Issuance | N/A | N/A | N/A | 0.00 | -435.00M |
Data provided by Twelve Data
Technical Analysis
Key Insights
- The stock is currently in an uptrend, trading near its 52-week high of ₹1,381.80, indicating recent price strength and bullish momentum.
- Key support levels are identified near ₹1,123 (50-day moving average) and ₹1,185 (200-day moving average), with resistance around the 52-week high of ₹1,381.80.
- The price is above the 10-day, 50-day, and 200-day moving averages, suggesting positive medium- and long-term trend alignment.
- Momentum indicators show mixed signals: RSI is near overbought levels, MACD indicates positive momentum but with potential for consolidation, and Stochastic oscillators suggest short-term caution.
- Across daily, weekly, and monthly timeframes, the stock demonstrates consistent upward price action but with signs of potential short-term volatility.
- Potential market scenarios include continuation of the uptrend if support levels hold, or a pullback towards moving averages if momentum indicators weaken.
Trending News
Summary: Regarding stocks to buy today, ... — Technical Research at Prabhudas Lilladher, recommended these eight buy-or-sell stocks for intraday trading: Laurus Labs Ltd, One 97 Communications Ltd (Paytm), Kotak Mahindra Bank Ltd, Bharat Forge Ltd, Bharat Electronics Ltd (BEL), ...
Sentiment: negative
Summary: One 97 Paytm Share Price: Find the latest news on One 97 Paytm Stock Price. Get all the information on One 97 Paytm with historic price charts for NSE / BSE. Experts & Broker view also get the One 97 Paytm Ltd. buy/sell tips detailed news, announcements, Forecasts, Analysts, Valuation, Earning ...
Sentiment: neutral
3. Headline: One 97 Communications Compliance Certificate for Quarter Ended June 30, 2026 | InvestyWise
Summary: One 97 Communications Limited announces compliance with SEBI (Depositories and Participants) Regulations, 2018, for the quarter ended June 30, 2026. Confirms no demat requests were processed.
Sentiment: neutral
4. Headline: One 97 Communications Ltd Upgraded to Hold on Improved Technicals and Financial Trends
Summary: Technically, the stock’s recent ... signals counsel caution. The stock’s 52-week high is ₹1,381.75, with a low of ₹896.05, and it currently trades near the upper end of this range, reflecting recent strength. One 97 Communications Ltd or something better?...
Sentiment: positive
5. Headline: Paytm’s European Arm Secures Luxembourg Payment Institution Licence - TipRanks.com
Summary: Discover top stock picks and new investment opportunities through TipRanks' Smart Investor Newsletter. One 97 Communications Ltd.
Sentiment: neutral
Powered by Brave
Recent Updates
News Summary
As of July 14, 2026. One 97 Communications Ltd. has demonstrated regulatory compliance with SEBI regulations for Q1 2026, reinforcing governance standards. The company reported its first full year of profitability in FY 2026, achieving EBITDA of ₹502 crore and net profit of ₹552 crore, supported by 22% revenue growth to ₹8,437 crore. Payments and financial services contributed significantly to this growth, with payments accounting for 55% and financial services 30% of revenue. The company is prioritizing AI investments to enhance product offerings and operational efficiency, with plans for revenue acceleration and EBITDA margin expansion in FY 2027. Additionally, the firm has secured a Luxembourg payment institution license, facilitating European market expansion. Overall, these developments reflect strategic progress and financial improvement.
News Sentiment
The recent updates convey a generally positive sentiment driven by the company's return to profitability, strong revenue growth, and strategic focus on AI and international expansion. Regulatory compliance announcements support confidence in governance. However, some neutral tones arise from routine compliance updates and mixed technical signals in the market. The balance of positive earnings performance and strategic initiatives outweighs neutral elements, suggesting constructive momentum in the company's business trajectory.
Source List
- https://investywise.com/one-97-communications-compliance-certificate-for-q1-2026
- https://quartr.com/companies/one97-communications-limited_11387
Analytical Overview
Analysis Summary
One 97 Communications Ltd. exhibits a high trailing P/E ratio of 147.54 compared to the industry average, with a forward P/E of 40.56 indicating expectations of improved earnings. This premium valuation reflects market optimism but also implies elevated expectations relative to peers. The company’s revenue growth of 18.4% quarterly and 22% annually demonstrates a robust growth trajectory supported by expanding payments and financial services segments. However, operating cash flow remains negative at ₹-743 crore TTM, although levered free cash flow is positive at ₹3,269 crore, indicating mixed cash flow dynamics. The company maintains a low debt level with a debt-to-equity ratio of 1.07 and a strong current ratio of 2.55, underscoring financial stability. Sector-specific challenges include intense competition in fintech and regulatory scrutiny, while opportunities arise from AI-driven innovation and expanding digital payments adoption in India’s growing economy. The regulatory environment in India favors digital financial inclusion, and consumer trends support increasing fintech penetration.
Overall Business and Market Assessment
Supporting Factors: No data
Risk Factors: The company’s primary strengths include its leadership in India’s digital payments ecosystem, strong revenue growth, and recent profitability turnaround. Key risks to monitor are the high valuation multiples and negative operating cash flow, which may pressure future returns if growth slows. The investment timeframe suitable for this profile is medium to long term, considering ongoing AI investments and market expansion efforts. Overall, the company presents a balanced risk-reward profile with improving fundamentals tempered by valuation and cash flow considerations.
SWOT Analysis
Strengths
- Market leader in India's digital payments and fintech ecosystem.
- Strong cash position with low debt supporting financial flexibility.
- Achieved first full year of profitability with positive EBITDA and net income.
- Robust revenue growth driven by payments and financial services segments.
Weaknesses
- High valuation multiples relative to earnings and cash flow.
- Negative operating cash flow despite positive free cash flow.
- Modest return on equity indicating limited profitability efficiency.
- Dependence on regulatory approvals and compliance in multiple jurisdictions.
Opportunities
- Expansion into European markets following Luxembourg payment institution license.
- AI-driven product innovation to enhance operational efficiency and customer experience.
- Growing digital payments adoption in India’s expanding economy.
- Strategic partnerships with lenders to broaden financial services distribution.
Threats
- Intense competition in the fintech and digital payments industry.
- Regulatory risks including compliance and licensing challenges.
- Market volatility impacting stock valuation and investor sentiment.
- Potential macroeconomic headwinds affecting consumer spending and digital transactions.
Company Description
One 97 Communications Ltd. is a prominent player in India's digital payments and financial technology sector. The company operates a comprehensive ecosystem of services under its widely recognized brand, Paytm. Its primary function revolves around facilitating digital transactions, offering a seamless payment gateway for consumers and merchants alike. Notable features include mobile recharge services, utility bill payments, digital wallets, and point-of-sale terminals, which significantly influence sectors like retail, e-commerce, and transportation. Additionally, One 97 Communications Ltd. extends its services to financial products such as loans, insurance, and wealth management, broadening its impact in fintech. By spearheading innovations in cashless payments, it plays a pivotal role in India's transition towards a digital economy, supporting both urban and rural inclusion. Founded in 2000 and based in Noida, India, the company continues to enhance its offerings, adapting to evolving consumer needs and technological advances in the financial market.