

Omnitech Engineering Limited (OMNI)
Stock Analysis Report
Stock Journey
Key Positives and Key Risks
Pros
- Revenue growth of 38.5% year-over-year demonstrates strong top-line expansion.
- Return on equity of 17.96% indicates efficient use of shareholder capital.
- Robust order book exceeding ₹30.55 billion provides revenue visibility.
Cons
- Negative free cash flow of approximately ₹3.01 billion raises concerns about cash generation.
- High trailing P/E ratio of 69.24 suggests the stock is priced at a premium relative to earnings.
- Debt-to-equity ratio of 63.96% indicates moderate leverage which may impact financial flexibility.
Disclosure: This information is for general awareness and does not constitute investment advice
Report Summary
Omnitech Engineering Limited is a manufacturer specializing in high precision engineered components and assemblies, including cylinder liners, pistons, gearboxes, shafts, and connecting rods. Operating in the Specialty Industrial Machinery industry within the Industrials sector, the company is listed on the National Stock Exchange of India (NSE). It serves diverse sectors such as energy, oil and gas, power, earth-moving equipment, and aerospace, with a strong export focus to over 24 countries including the United States and Europe. Omnitech operates three manufacturing facilities in Rajkot, Gujarat, equipped with advanced CNC and machining technologies, and holds multiple certifications for quality and environmental standards.
Financially, Omnitech reported trailing twelve months (TTM) revenue of approximately ₹5.11 billion with a robust gross margin of 75.46%, operating margin of 32.55%, and net profit margin of 15.52%. The company’s return on equity (ROE) stands at 17.96%, and return on assets (ROA) at 9.80%, indicating efficient use of equity and assets in generating profits. Despite strong profitability, operating cash flow is slightly negative at -₹19.82 million TTM, and free cash flow is also negative at -₹3.01 billion, signaling some cash generation challenges.
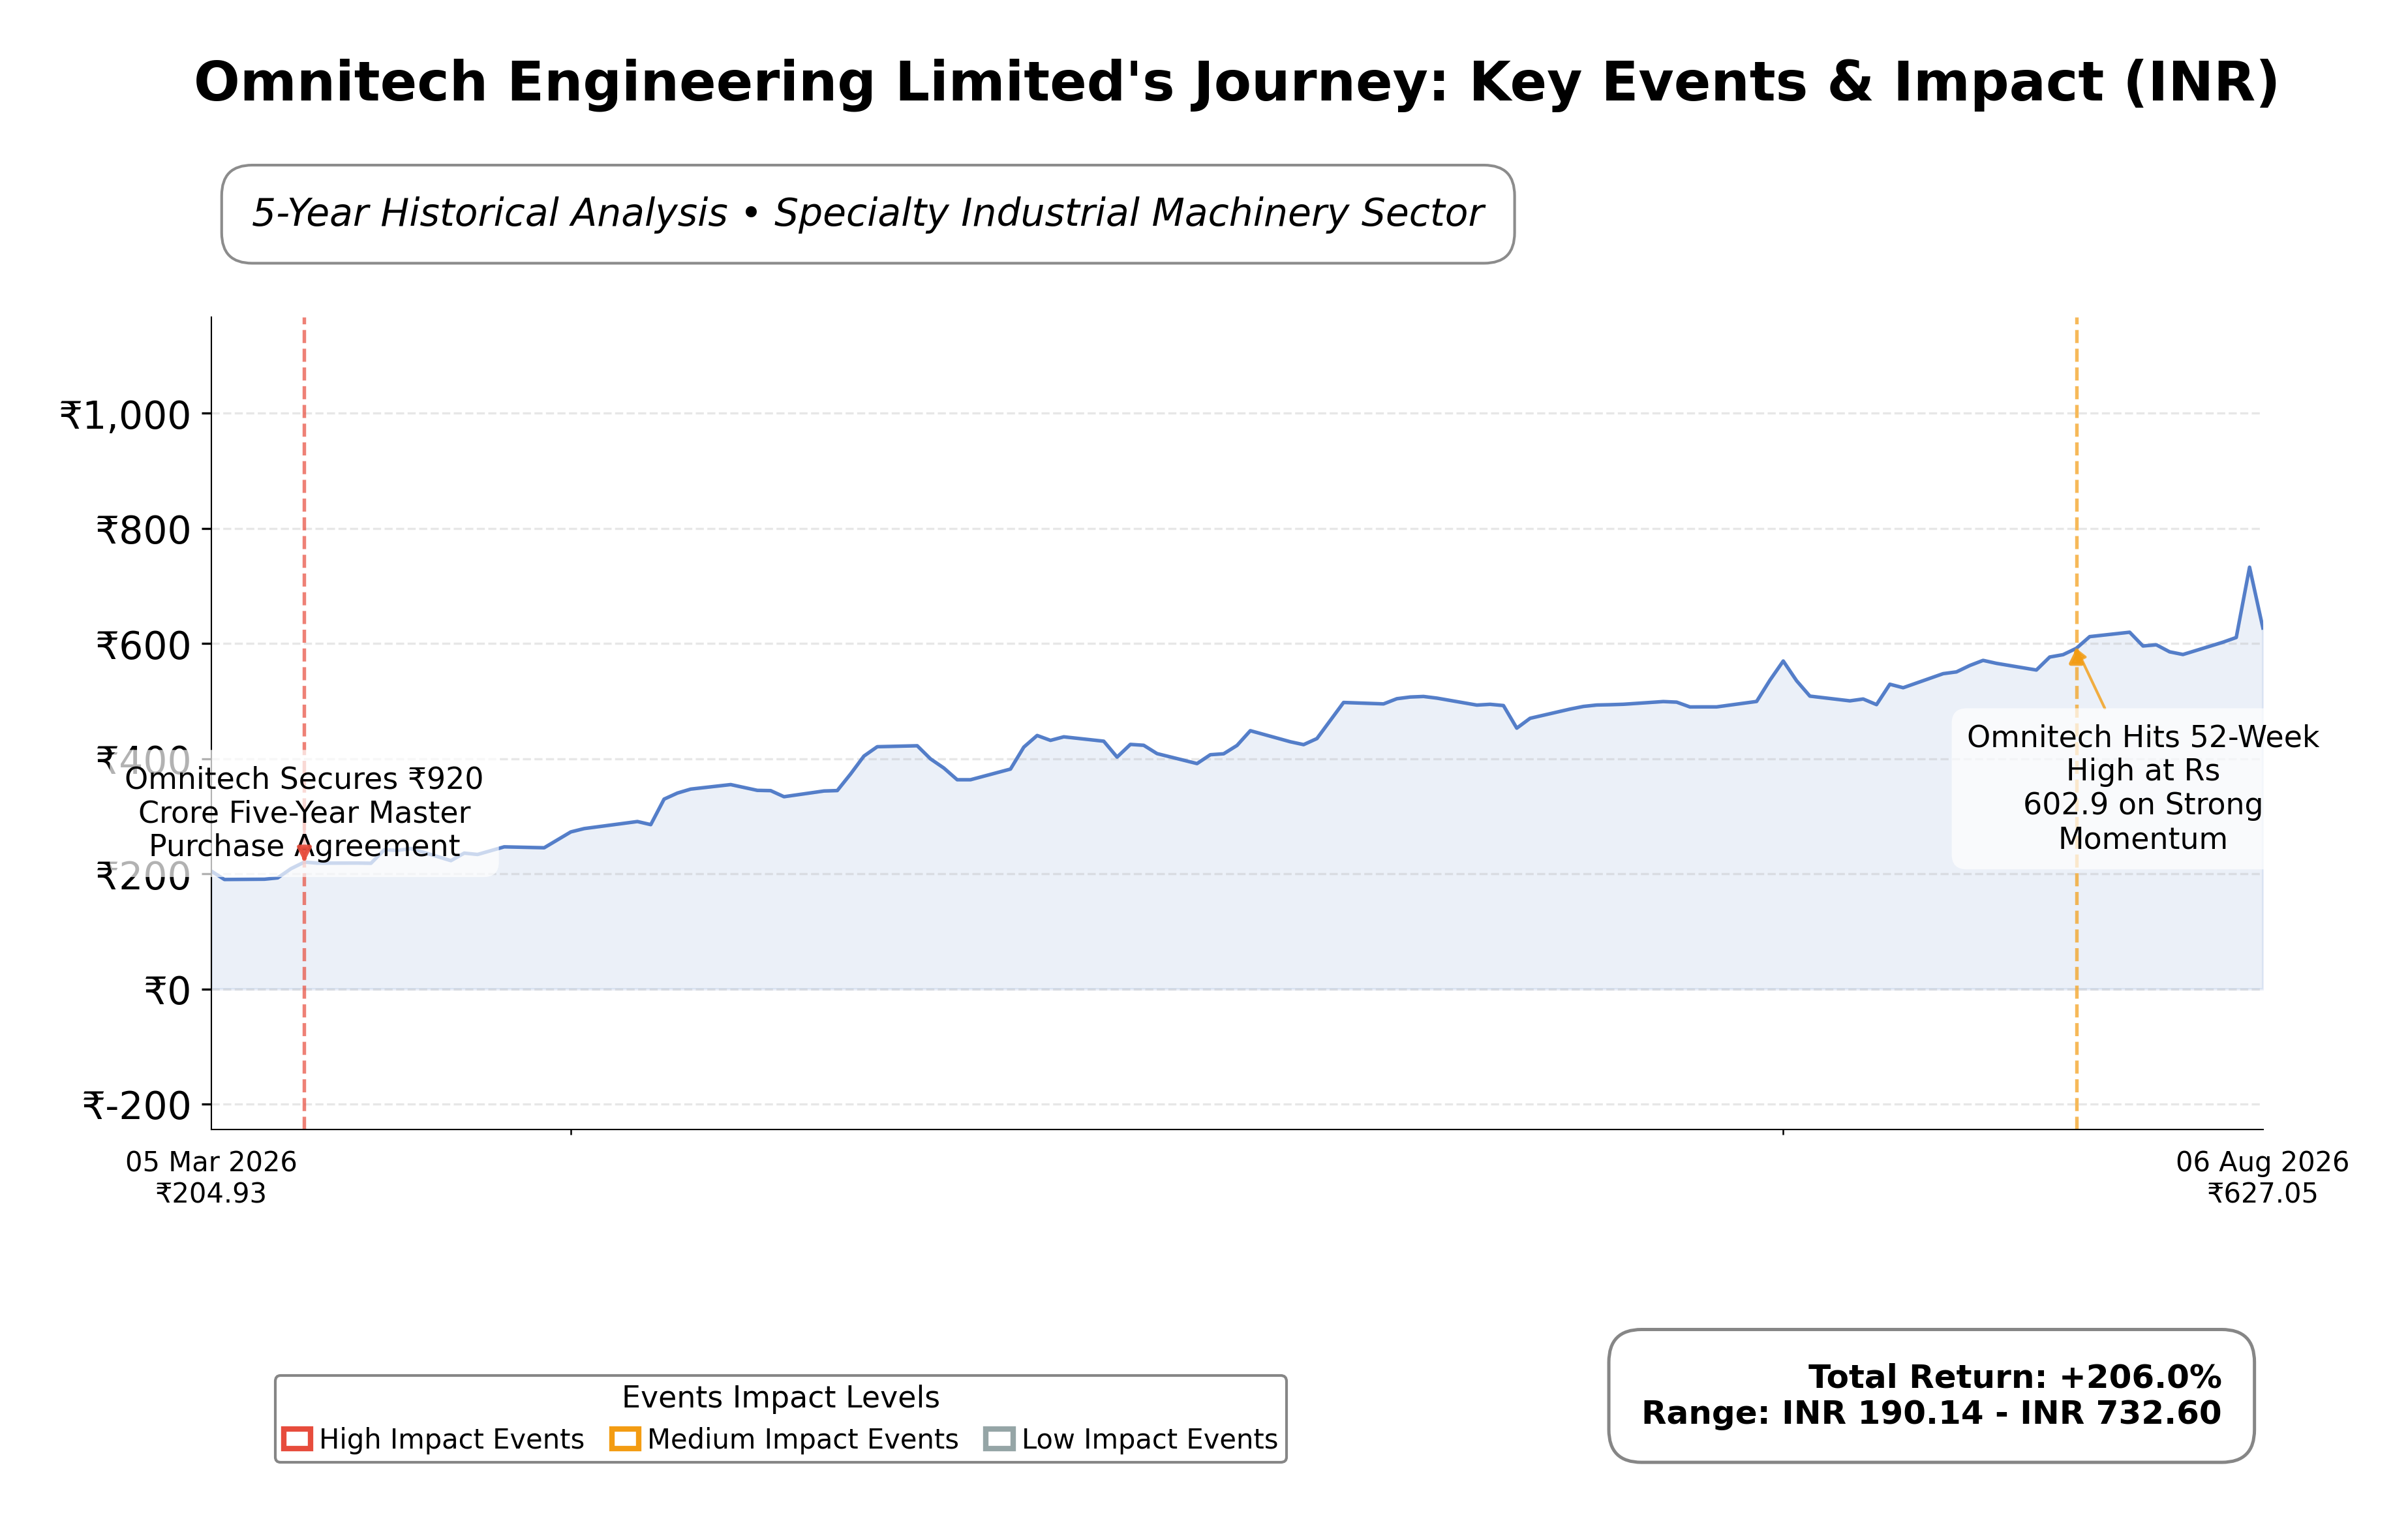
Valuation metrics show a trailing price-to-earnings (P/E) ratio of 69.24, price-to-book (P/B) ratio of 10.07, and enterprise value to EBITDA (EV/EBITDA) of 35.89, which are elevated relative to typical industry standards, reflecting a premium pricing of the stock. The market capitalization is approximately ₹77.54 billion. The stock’s 52-week range spans from ₹176.25 to ₹764.85, with the current price of ₹627.05 trading closer to the upper end, indicating recent strong price appreciation.
Key strengths include a diversified global customer base, strong order book exceeding ₹30.55 billion, and certifications supporting high-quality manufacturing. Risks involve high valuation multiples, negative free cash flow, and a debt-to-equity ratio of 63.96%, which could impact financial flexibility. Recent strategic actions include a change in depreciation accounting method to straight-line, boosting reported profits, and securing a multi-year order from Weatherford, enhancing revenue visibility.
Technically, the stock has demonstrated strong momentum, reaching all-time highs and aligning well with moving averages, supported by positive earnings surprises. The current trajectory suggests robust market interest and operational performance, warranting close monitoring for sustainability of cash flows and valuation levels. Overall, the data reflects a company with solid fundamentals but elevated valuation and cash flow considerations, meriting a balanced observation.
Company and Industry Overview
Company Basics
Price Performance
Company Size
Shareholding Pattern
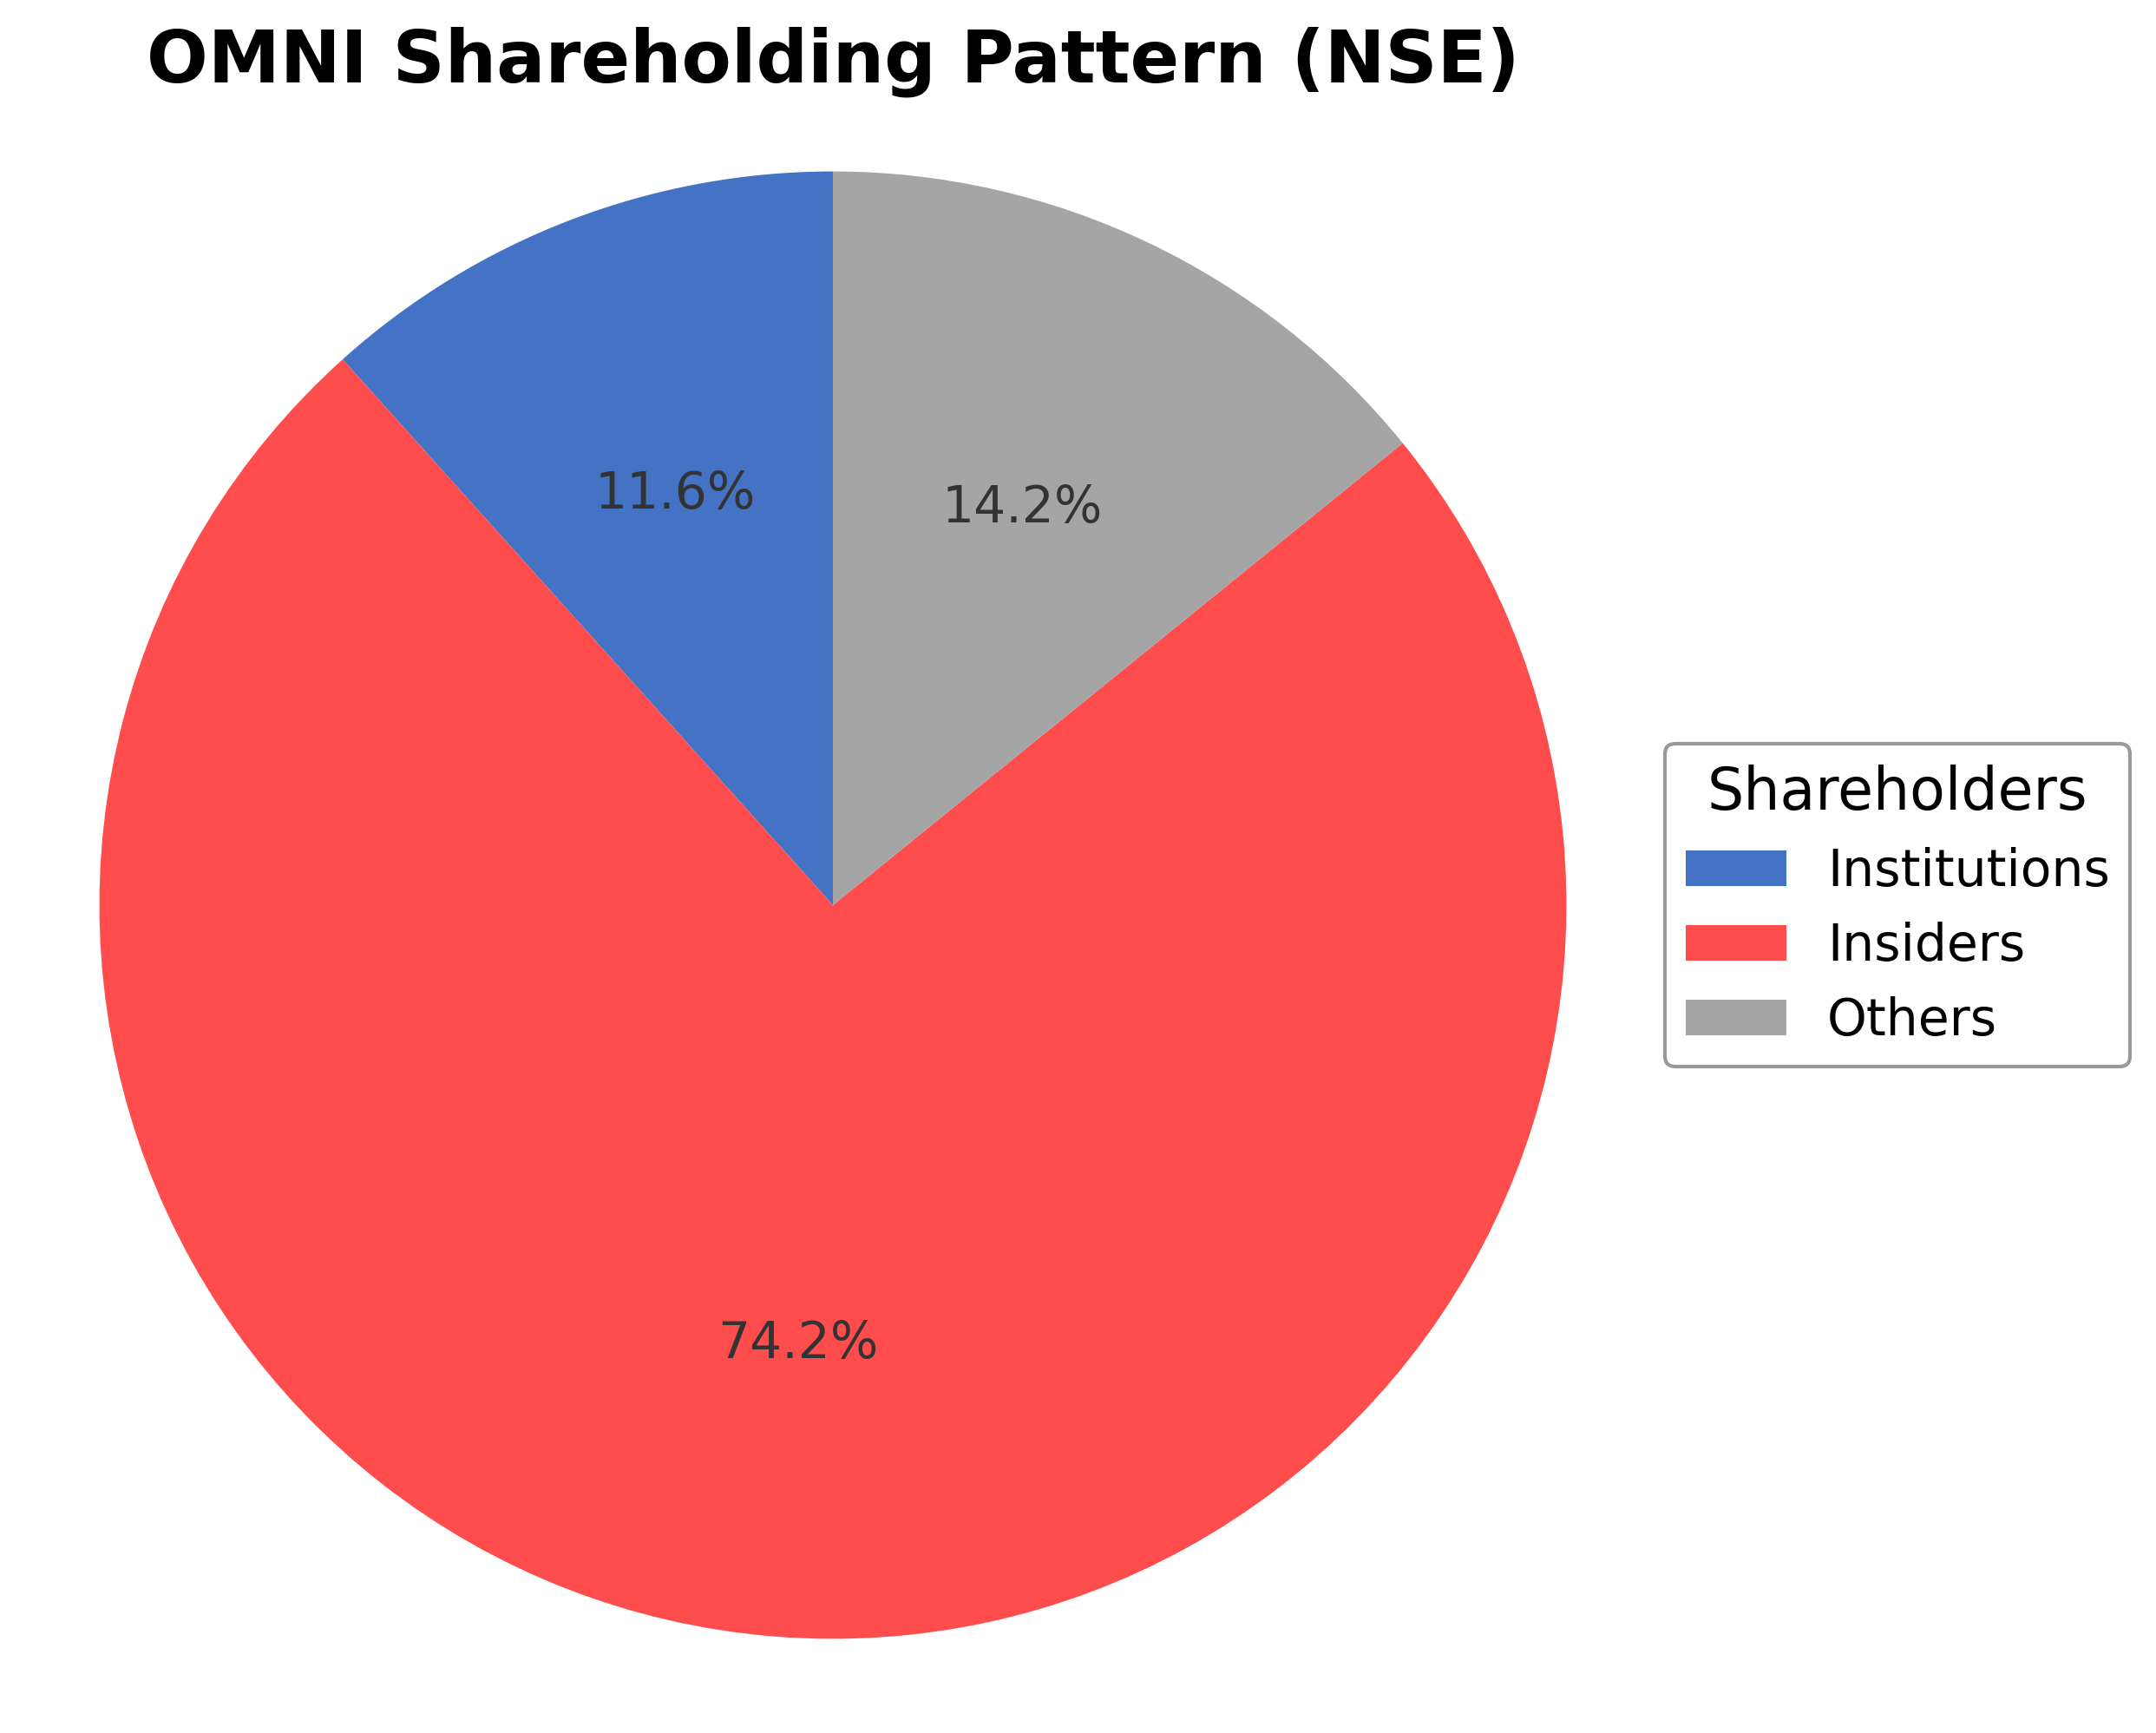
Omnitech Engineering Limited's shareholding structure is predominantly controlled by insiders, including executives and board members, who hold approximately 74.19% of shares. Institutional investors, comprising mutual funds, pension funds, and asset managers, account for 11.65%, while the remaining 14.16% is held by public shareholders and other retail investors. Over the past 12 to 24 months, insider ownership has remained stable, while institutional holdings have shown modest accumulation, reflecting growing confidence from professional investors. Major funds have increased positions in line with the company's improving financial performance and robust order book. This ownership pattern suggests strong governance influence by promoters with increasing institutional oversight, potentially supporting strategic continuity and disciplined capital allocation.
Sector and Industry Analysis
The precision engineering sector, integral to industries such as energy, automation, and industrial equipment, is experiencing steady growth driven by rising global investments in energy infrastructure and clean technologies. Total global energy spending is projected to reach approximately USD 3.3 trillion by 2025, supporting demand for high-precision components. Key players in this sector include established manufacturers with advanced machining capabilities and global delivery networks, serving diverse markets including oil & gas, renewables, and industrial automation.
Industry trends highlight increasing demand for precision-engineered components tailored to safety-critical applications, with a focus on customization and quality certifications like ISO and AS9100. India is emerging as a competitive manufacturing hub due to skilled labor, cost advantages, and government initiatives such as Make in India and Production Linked Incentives (PLI), attracting global OEMs. Barriers to entry remain significant given the need for advanced manufacturing infrastructure, stringent quality standards, and established customer relationships that favor incumbents with proven capabilities.
The regulatory environment emphasizes compliance with international quality and safety standards, including aerospace and oil & gas certifications, which are critical for market access and customer trust. Government policies promoting domestic manufacturing and export competitiveness support sector growth, while geopolitical tensions and commodity price volatility pose risks to supply chains and input costs. Overall, the outlook is shaped by sustained investments in energy and industrial sectors, balanced against macroeconomic and geopolitical uncertainties.
Note: Analysis synthesized from industry research, market reports, and regulatory filings. Information is subject to change based on market conditions.
Financial Ratios Dashboard
Illustrative Scenario Analysis
DCF Assumptions:
Method: Two-Stage EPS-Priority Model
Financials
Peer Analysis
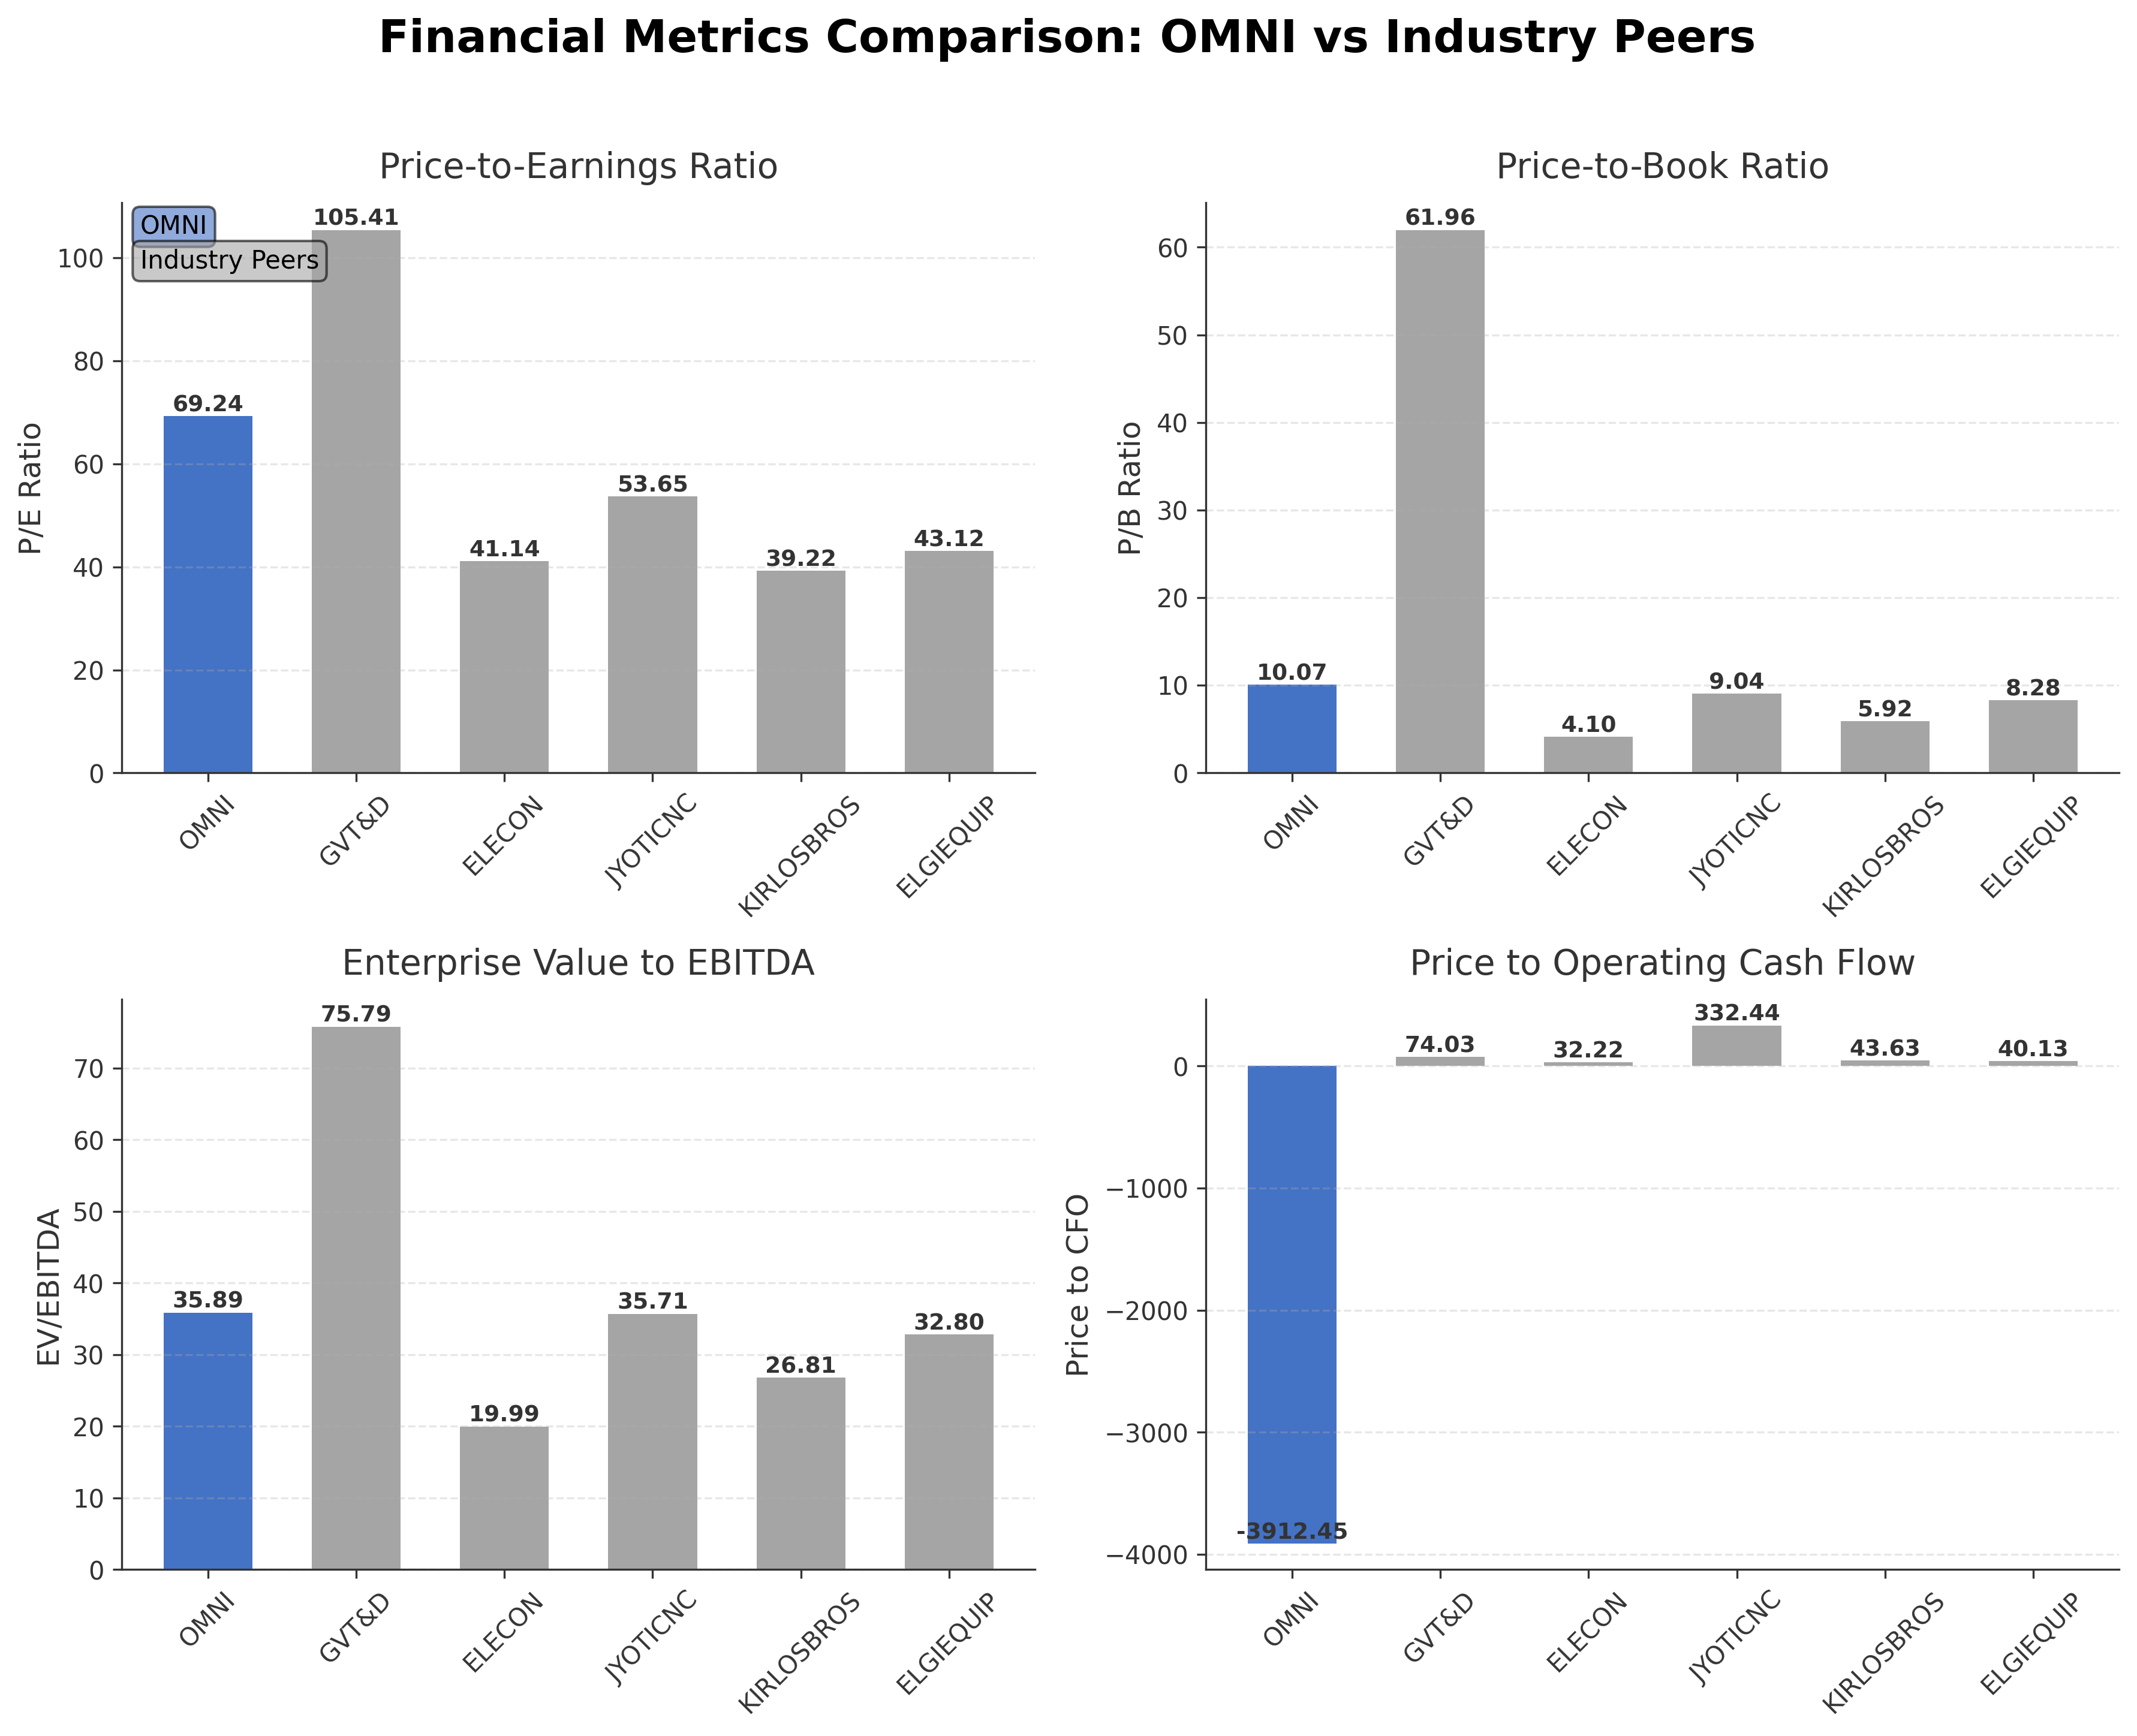
| Company Name | Market Cap | P/E Ratio | P/B Ratio | EV/EBITDA | Price to CFO |
|---|---|---|---|---|---|
| Omnitech Engineering Limited | ₹77.54B | 69.24 | 10.07 | 35.89 | -3912.45 |
| GE Vernova T&D India Ltd | ₹1.27T | 105.41 | 61.96 | 75.79 | 74.03 |
| Elecon Engineering Co. Ltd. | ₹94.62B | 41.14 | 4.10 | 19.99 | 32.22 |
| Jyoti CNC Automation Ltd. | ₹180.81B | 53.65 | 9.04 | 35.71 | 332.44 |
| Kirloskar Brothers Limited | ₹145.80B | 39.22 | 5.92 | 26.81 | 43.63 |
| Elgi Equipments Ltd. | ₹181.99B | 43.12 | 8.28 | 32.80 | 40.13 |
Comparison Analysis: Omnitech Engineering Limited trades at a higher P/E ratio of 69.24 compared to most peers, indicating a premium valuation relative to industry standards. Its P/B ratio of 10.07 is also elevated but remains below the extreme levels seen in GE Vernova T&D India Ltd. The EV/EBITDA multiple of 35.89 aligns closely with Jyoti CNC Automation Ltd but is higher than Elecon Engineering and Kirloskar Brothers. Omnitech’s return on equity of 17.96% is competitive within the peer group, surpassing Elecon and Kirloskar Brothers but trailing Elgi Equipments and GE Vernova. The company’s price to CFO ratio is negative, reflecting recent cash flow challenges, contrasting with positive cash flow metrics for peers. Overall, Omnitech demonstrates strong profitability metrics but faces valuation and cash flow efficiency pressures relative to its regional industry peers.
Financial Metrics Comparison with Peers
Financial Statements
Comprehensive financial data including income, balance sheet, and cash flow metrics
Income Statement
| fiscal_date | 2026-03-31 | 2025-03-31 | 2024-03-31 | 2023-03-31 |
|---|---|---|---|---|
| Sales | 5.11B | 3.43B | 1.66B | 1.65B |
| Cost Of Goods | 1.21B | 812.61M | 640.79M | 679.97M |
| Gross Profit | 3.90B | 2.62B | 1.02B | 970.79M |
| Operating Expense Other Operating Expenses | 1.35B | 889.83M | 152.93M | 128.21M |
| Operating Income | 1.23B | 791.28M | 419.61M | 469.42M |
| Non Operating Interest Expense | 394.83M | 297.34M | 118.69M | 65.90M |
| Pretax Income | 1.08B | 561.87M | 314.86M | 439.66M |
| Income Tax | 285.36M | 123.22M | 125.78M | 116.74M |
| Net Income | 793.37M | 438.65M | 189.08M | 322.92M |
| Ebit | 1.47B | 859.21M | 433.55M | 505.56M |
| Ebitda | 1.96B | 1.24B | 662.91M | 670.70M |
| Net Income Continuous Operations | 1.08B | 561.87M | 314.86M | 439.66M |
| Minority Interests | -270.00K | -220.00K | 0.00 | 0.00 |
| Preferred Stock Dividends | 0.00 | 0.00 | 0.00 | 0.00 |
| Operating Expense Selling General And Administrative | N/A | 124.45M | 71.99M | 66.75M |
| Non Operating Interest Income | N/A | 2.67M | 1.39M | 550.00K |
| Eps Basic | N/A | 3.55 | 1.53 | 2.61 |
| Eps Diluted | N/A | 3.55 | 1.53 | 2.61 |
| Basic Shares Outstanding | N/A | 123.67M | 123.67M | 123.67M |
| Diluted Shares Outstanding | N/A | 123.67M | 123.67M | 123.67M |
Data provided by Twelve Data
Balance Sheet
| fiscal_date | 2026-03-31 | 2025-03-31 | 2024-03-31 | 2023-03-31 |
|---|---|---|---|---|
| Cash And Cash Equivalents | 1.64B | 51.33M | 22.80M | 17.78M |
| Accounts Receivable | 2.14B | 1.28B | 434.90M | 334.17M |
| Total Assets | 12.55B | 6.26B | 3.87B | 1.85B |
| Total Liabilities | 5.75B | 4.23B | 3.08B | 1.25B |
| Long Term Debt | 1.20B | 1.49B | 1.28B | 317.05M |
| Shareholders Equity | 6.80B | 2.04B | 794.75M | 599.38M |
Data provided by Twelve Data
Cash Flow Statement
| fiscal_date | 2026-03-31 | 2025-03-31 | 2024-03-31 | 2023-03-31 |
|---|---|---|---|---|
| Operating Activities Net Income | 1.08B | 561.87M | 314.86M | 439.66M |
| Operating Activities Other Non Cash Items | 380.04M | 294.67M | 133.76M | 93.03M |
| Operating Activities Accounts Receivable | -857.34M | -845.75M | -100.73M | -12.80M |
| Operating Activities Other Assets Liabilities | -1.53B | -1.01B | -470.89M | -59.03M |
| Operating Activities Operating Cash Flow | -19.82M | -689.85M | 212.99M | 460.86M |
| Investing Activities Purchase Of Investments | -1.30B | 0.00 | -22.00M | 0.00 |
| Investing Activities Sale Of Investments | 8.12M | 0.00 | N/A | N/A |
| Investing Activities Investing Cash Flow | -1.30B | 0.00 | -22.00M | -463.42M |
| Financing Activities Long Term Debt Issuance | 1.43B | 3.05B | 2.60B | 1.13B |
| Financing Activities Long Term Debt Payments | -755.88M | -2.05B | -1.18B | -986.88M |
| Financing Activities Common Stock Issuance | 4.18B | 818.38M | 0.00 | 0.00 |
| Financing Activities Financing Cash Flow | 4.85B | 1.82B | 1.42B | 142.67M |
| End Cash Position | 1.64B | 51.33M | 22.80M | 17.78M |
| Free Cash Flow | -1.29B | -1.44B | -1.22B | -69.87M |
| Financing Activities Other Financing Charges | N/A | 240.00K | N/A | N/A |
| Investing Activities Capital Expenditures | N/A | N/A | N/A | -463.42M |
Data provided by Twelve Data
Technical Analysis
Key Insights
- The current trend shows strong upward momentum with the stock price recently reaching all-time highs near ₹635, supported by consistent higher highs and higher lows.
- Key support levels are identified around ₹520 and ₹420, corresponding to the 50-day and 200-day moving averages respectively, while resistance is near the recent high of ₹765.
- The stock price is trading above the 10-day, 50-day, and 200-day moving averages, indicating a bullish alignment across short, medium, and long-term trends.
- Momentum indicators reveal an RSI near 70, suggesting the stock is approaching overbought conditions; MACD remains positive with a bullish crossover, and stochastic oscillators confirm strong upward momentum.
- Multi-timeframe analysis shows daily and weekly charts in strong uptrends, while monthly charts indicate a steady long-term appreciation trajectory.
- Potential market scenarios include continuation of the upward trend if support levels hold, while a breach below the 50-day moving average could signal consolidation or correction phases.
Trending News
1. Headline: Omnitech Engineering share price tumbles 14% after Q1 results | Markets News - Business Standard
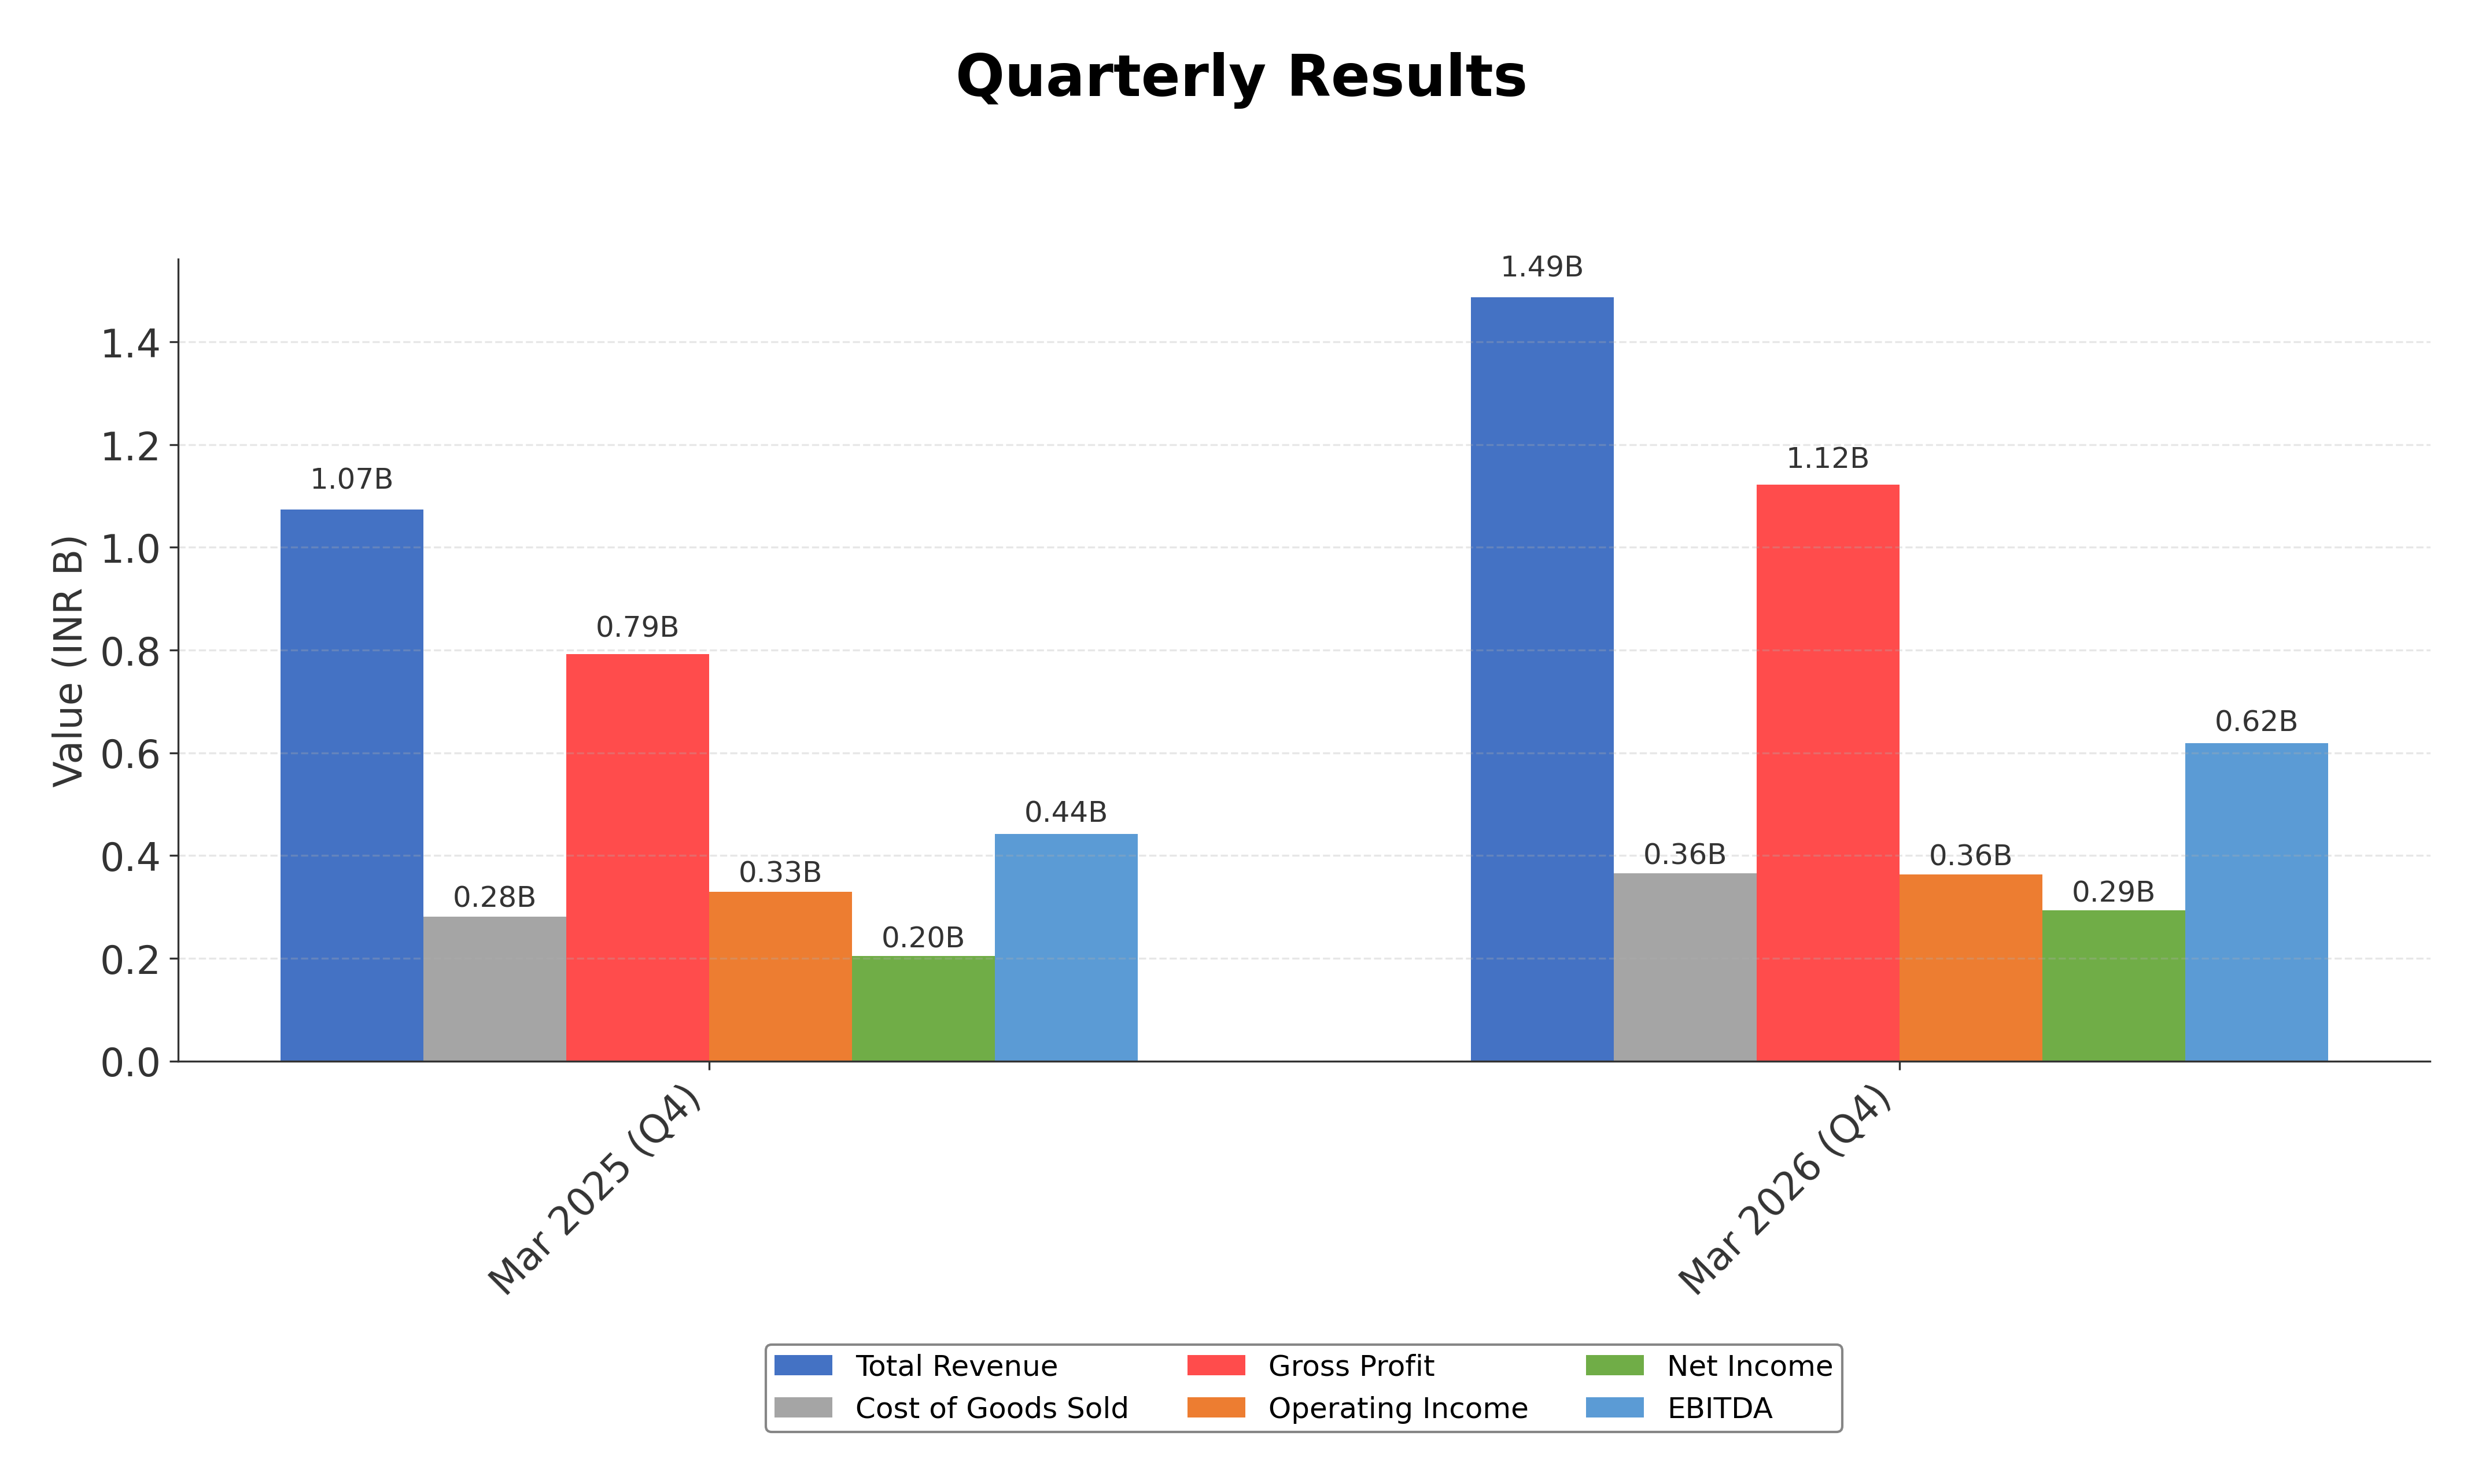
Summary: Net profit of Omnitech Engineering rose 43.19 per cent to ₹29.31 crore in the quarter ended March 2026 as against ₹20.47 crore during the previous quarter ended March 2025.
Sentiment: positive
Summary: 20% Upper Circuit: Stock Skyrockets After Reporting 470% YoY Increase in Net Profit https://t.co/TaTAlEasbi
Sentiment: positive
3. Headline: Omnitech Engineering Shares Soar Over 15% After Q1 Profit Jumps Nearly Six-Fold
Summary: For Q1FY27, the company reported a consolidated net profit of Rs 29.7 crore, compared with Rs 5.2 crore in the corresponding period last year, marking an almost six-fold jump.
Sentiment: positive
4. Headline: Omnitech Engineering Reports Q1 Standalone Net Profit of ₹29.4 Crore vs ₹5.2 Crore YoY
Summary: Omnitech Engineering Q1 standalone net profit jumped to ₹29.4 crore from ₹5.2 crore YoY, while net sales rose to ₹148.72 crore, driven by robust volume
Sentiment: positive
5. Headline: Omnitech Engineering Q1FY27 net profit surges to ₹294M on revenue growth
Summary: Omnitech Engineering reported robust Q1FY27 results with standalone net profit rising to ₹294.05 million, up from ₹52.49 million in Q1FY26. Revenue grew to ₹1,692.22 million. The company switched to straight-line depreciation, boosting reported profits, and confirmed strict adherence ...
Sentiment: positive
Powered by Brave
Recent Updates
News Summary
As of August 5, 2026. Omnitech Engineering reported a significant 469% increase in consolidated net profit to ₹297.3 million for Q1FY27, driven by a 61.5% rise in revenue to ₹1,666.6 million and improved operational leverage. EBITDA nearly doubled to ₹506.2 million, and profit before tax surged to ₹396.8 million. The company adopted a straight-line depreciation method, reducing expenses and enhancing reported profits by approximately ₹75.73 million. The order book remains strong at over ₹30.55 billion, including a multi-year contract from Weatherford valued above US$100 million, underscoring robust demand and revenue visibility. The company has utilized a significant portion of its IPO proceeds, with remaining funds securely invested in fixed deposits.
News Sentiment
The overall sentiment from recent updates is positive, driven by strong earnings growth, substantial order inflows, and operational improvements. The shift to straight-line depreciation positively impacted profitability metrics, while the large order book provides confidence in future revenue streams. No significant negative developments were reported, and management's transparent communication supports a constructive market perception. This positive tone is tempered slightly by the company's ongoing cash flow challenges, but the financial results and order pipeline dominate the sentiment landscape.
Source List
- https://scanx.trade/stock-market-news/companies/omnitech-engineering-q1-results-net-profit-surges-to-294m-yoy/47456969
- https://sahi.com/news/omnitech-engineering-reports-q1-standalone-net-profit-of-29-4-crore-vs-5-2-crore-yoy-6679193-PE1_
Analytical Overview
Analysis Summary
Omnitech Engineering’s valuation metrics, including a trailing P/E of 69.24, are elevated compared to the industry average, reflecting a premium pricing that may incorporate growth expectations. The company’s revenue growth of 38.5% and a 43.2% increase in quarterly earnings year-over-year indicate a strong growth trajectory supported by robust order inflows. However, operating cash flow remains negative, and free cash flow is significantly negative, raising concerns about cash generation despite profitability. Sector-specific opportunities include expanding demand in energy and industrial machinery exports, while challenges involve managing working capital and sustaining operational efficiency. Considering the Indian market context, regulatory compliance and export diversification are strengths, but economic fluctuations and currency risks remain relevant factors.
Overall Business and Market Assessment
Supporting Factors: Key supporting factors include strong revenue and profit growth, a substantial order book, and diversified global market exposure. Risks to monitor encompass elevated valuation multiples, negative free cash flow, and moderately high leverage with a debt-to-equity ratio near 64%. The appropriate investment timeframe would be medium to long-term to assess cash flow normalization and operational scaling. Overall, Omnitech presents a mixed profile of growth potential balanced against financial and valuation considerations.
Risk Factors: No data
SWOT Analysis
Strengths
- Strong revenue growth of 38.5% and profit margin of 15.5%.
- Robust order book exceeding ₹30.55 billion supporting future revenue.
- Diverse global customer base with exports to over 24 countries.
- Multiple quality and environmental certifications enhancing credibility.
Weaknesses
- Negative free cash flow of approximately ₹3.01 billion indicating cash generation issues.
- High valuation multiples with a P/E ratio of 69.24 and P/B ratio of 10.07.
- Debt-to-equity ratio of 63.96% reflecting moderate leverage.
- Operating cash flow slightly negative at -₹19.82 million TTM.
Opportunities
- Growing demand in energy and industrial machinery sectors globally.
- Potential to leverage multi-year contracts like the Weatherford order.
- Expansion in export markets with increasing industrial automation.
- Adoption of advanced manufacturing technologies to improve efficiency.
Threats
- Macroeconomic volatility impacting export demand and currency fluctuations.
- Competitive pressures from global and domestic specialty machinery manufacturers.
- Regulatory changes affecting manufacturing and export compliance.
- Sustained negative cash flow could constrain operational flexibility.
Company Description
Omnitech Engineering Limited is a manufacturer of high precision engineered components and assemblies, specializing in turned and machined parts such as cylinder liners, pistons, gearboxes, shafts, and connecting rods. These customized products, made from stainless steel, alloy bars, forgings, and castings, serve diverse industries including energy, oil and gas, power, earth-moving equipment, airport ground support, hydraulics, motion control, automation, industrial equipment systems, and metal forming. The company operates three manufacturing facilities in Rajkot, Gujarat, India, equipped with advanced machinery like CNC machines, vertical machining centers, turn mill centers, grinding, gear, gun-drill, honing, lapping, laser cutting, and welding equipment. Omnitech Engineering Limited primarily focuses on exports to over 24 countries, including the United States, Europe, United Arab Emirates, Germany, and others, catering directly to original equipment manufacturers with a diversified customer base. Its facilities hold prestigious certifications such as ISO 9001:2015, ISO 14001:2015, ISO 45001:2018, IATF 16949 for automotive quality, AS9100:2016 for aviation, space and defense, and API specifications for oil and gas applications, ensuring high standards of quality, environmental management, and occupational health. Headquartered in Rajkot, Gujarat, the company maintains a strong emphasis on precision manufacturing to meet stringent customer specifications across global markets.