
Oil & Natural Gas Corporation Ltd (ONGC)
Stock Analysis Report
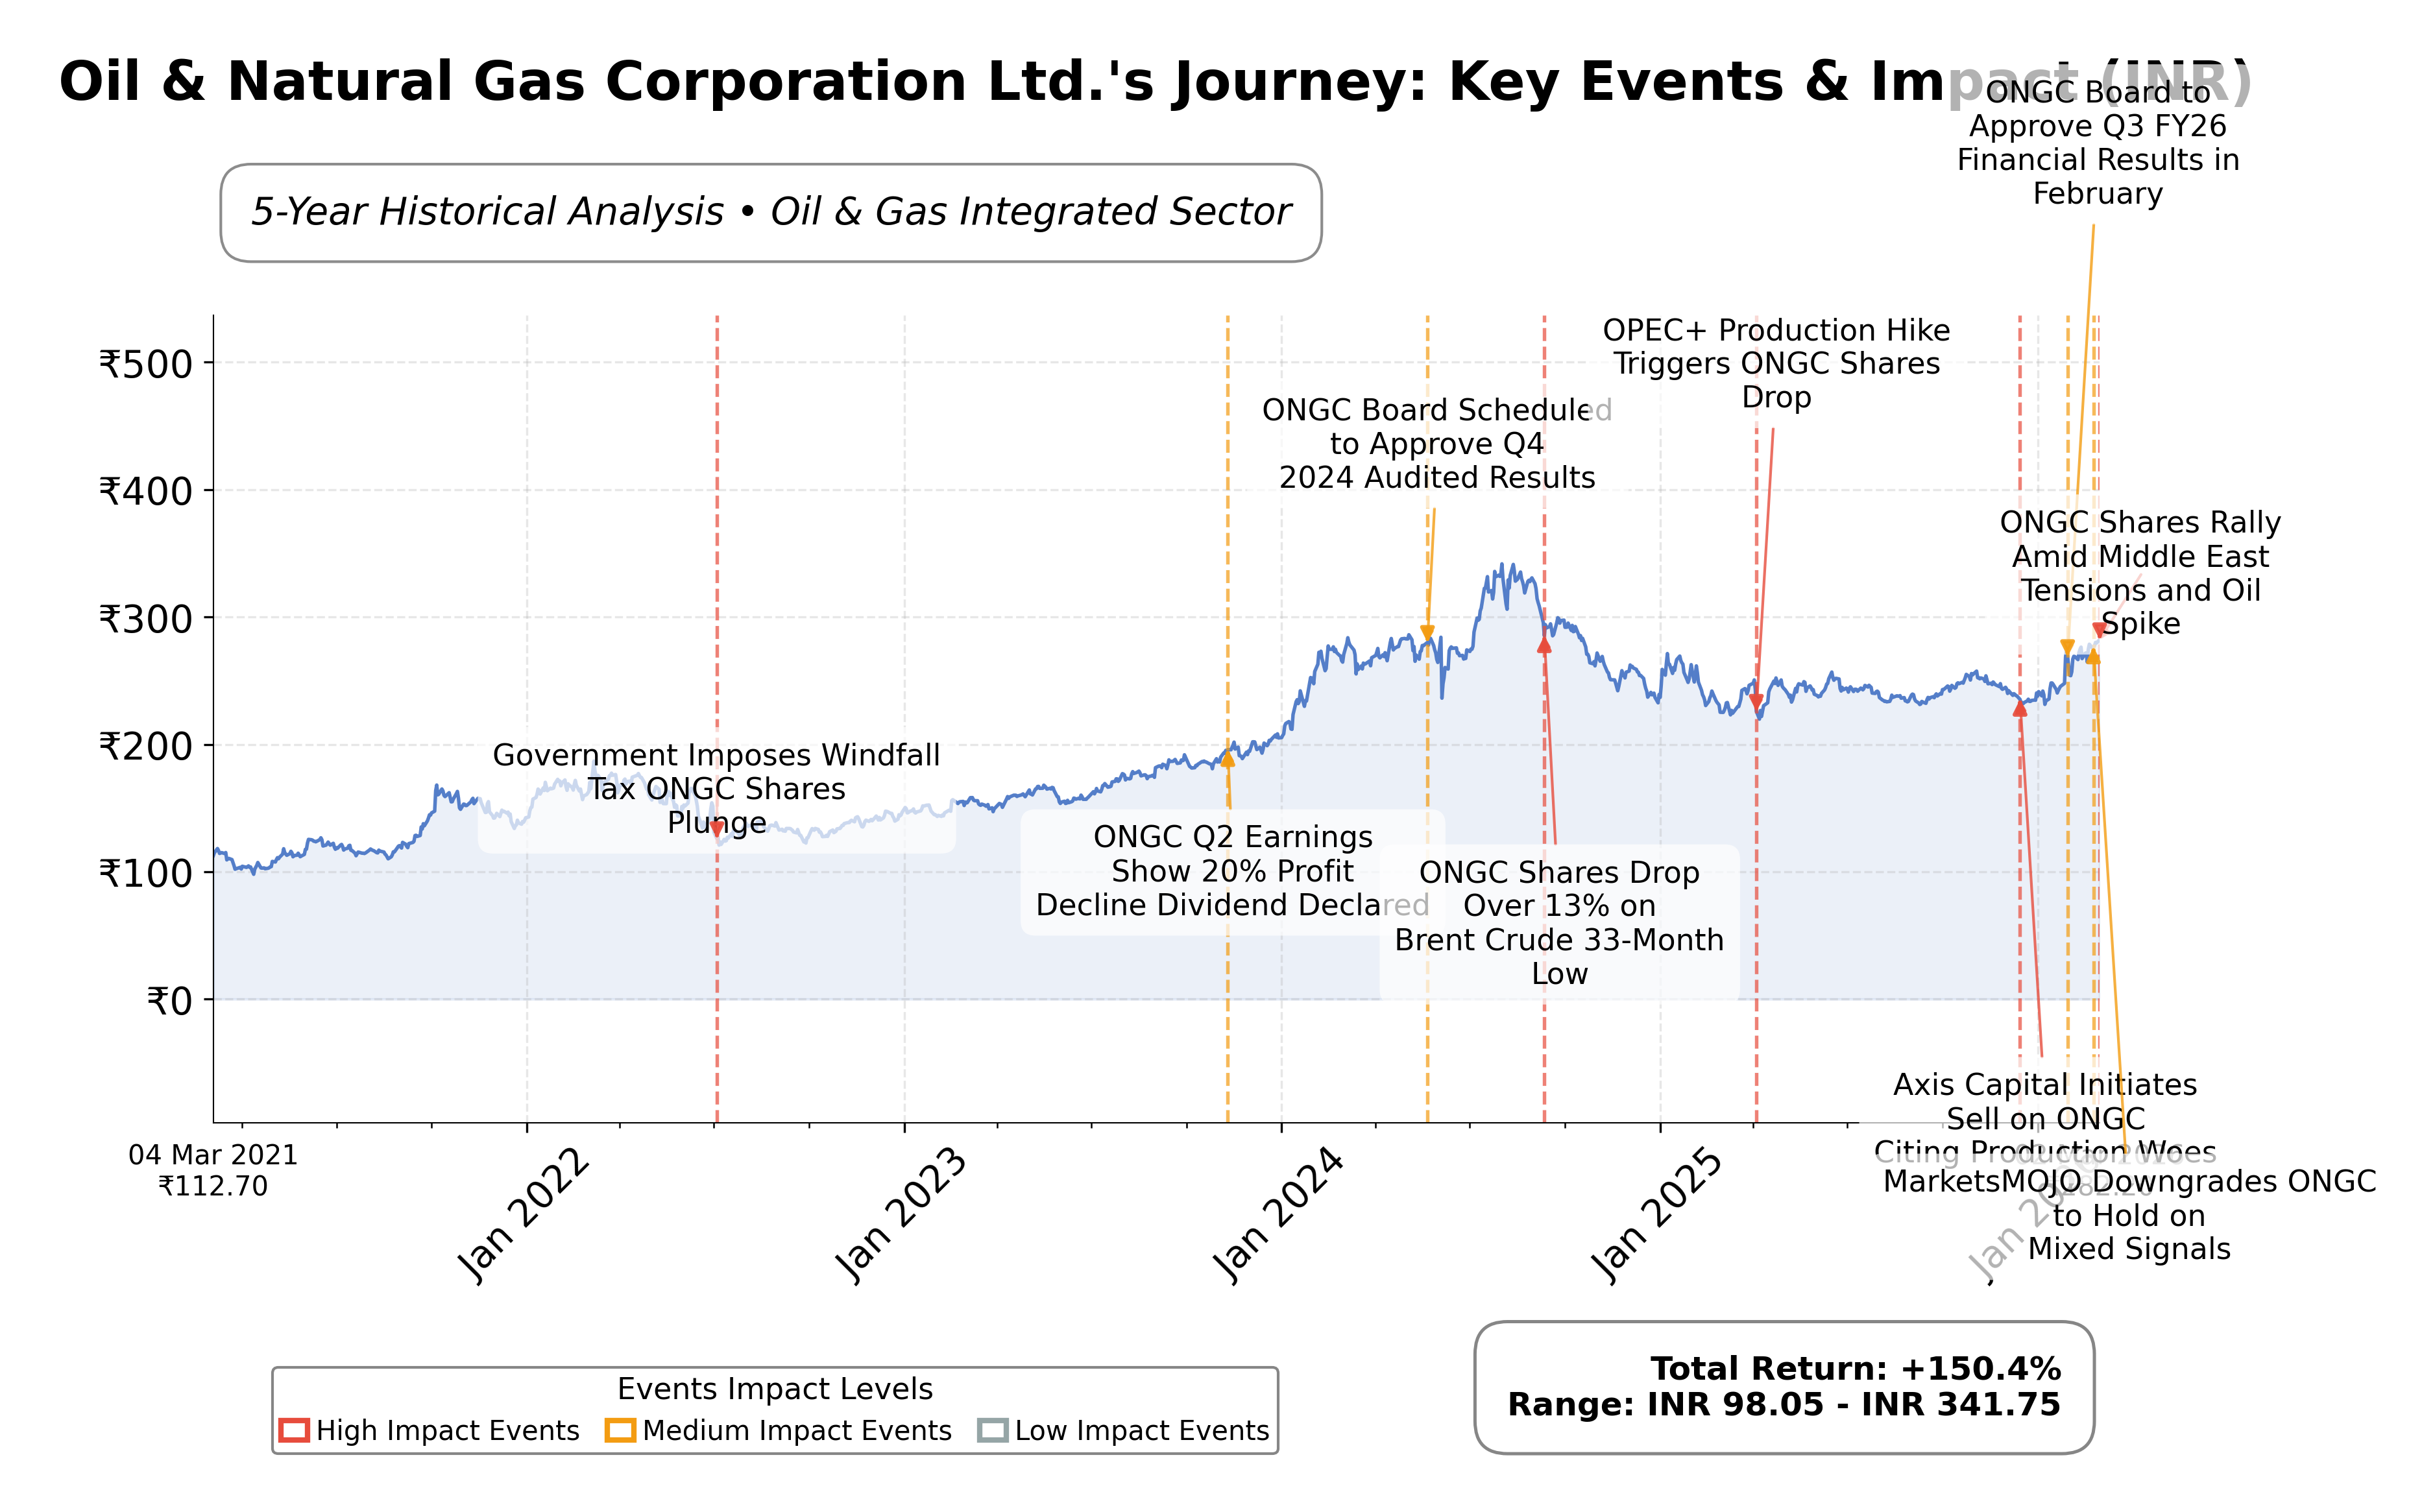
Stock Journey
Key Positives and Key Risks
Pros
- Market capitalization of ₹3.52 trillion reflects strong market presence and scale.
- Trailing P/E ratio of 9.25 and forward P/E of 7.77 suggest attractive valuation relative to industry average of 9.25.
- Positive free cash flow of ₹362 billion indicates solid cash generation supporting investments and dividends.
Cons
- Current ratio of 0.87 indicates potential short-term liquidity constraints.
- Modest quarterly revenue growth of 0.8% may limit near-term expansion momentum.
- Exposure to geopolitical tensions and volatile global oil prices poses operational risks.
Disclosure: This information is for general awareness and does not constitute investment advice
Report Summary
Oil & Natural Gas Corporation Ltd. (ONGC) is a leading Indian multinational energy company primarily engaged in the exploration, production, and distribution of oil and natural gas. As the largest producer of crude oil and natural gas in India, ONGC plays a central role in the country's energy supply chain and operates across the entire oil and gas value chain. The companyâs government ownership and extensive operations position it as a key player in Indiaâs energy sector, with significant influence on domestic energy security and industrial activity.
Financially, ONGC exhibits solid valuation metrics with a trailing P/E ratio of 9.25 and a forward P/E of 7.77, both below or near industry averages, indicating relative valuation attractiveness. The company reported a market capitalization of approximately â¹3.52 trillion and an enterprise value of â¹5.12 trillion. Key profitability measures include a gross margin of 32.3%, operating margin of 9.5%, and a modest profit margin near 5.8%. Return on equity stands at roughly 9.7%, reflecting moderate efficiency in generating shareholder returns. The firm maintains a dividend yield of about 6.6%, with a payout ratio of 40.5%, supporting steady income distribution.
From a strategic and technical perspective, ONGC has recently appointed Vikram Saxena as interim head of Strategy & Corporate Affairs, signaling potential shifts in corporate governance and strategic direction. The companyâs stock has reached a new 52-week high, supported by institutional interest and resilience amid geopolitical tensions affecting the energy sector. Risks include exposure to volatile global energy prices and regional geopolitical instability, while strengths lie in its dominant market position and government backing. Technical indicators show the stock trading above key moving averages, suggesting positive momentum.
In peer comparison within the Indian oil and gas sector, ONGC stands out with a significantly larger market capitalization compared to peers such as Oil Country Tubular Ltd. (OIL). ONGCâs valuation multiples, including P/E and EV/EBITDA, are generally lower, indicating a more conservative valuation relative to smaller peers. Return on equity is comparable but slightly lower than some peers, reflecting the scale and maturity of ONGCâs operations. This positioning underscores ONGCâs role as a market leader with stable fundamentals amidst a competitive landscape.
ONGC navigates a complex industry landscape marked by energy demand growth, geopolitical risks, and evolving regulatory frameworks. Recent achievements include reaching new stock highs and strategic leadership appointments, while challenges persist in managing supply disruptions and transitioning toward renewable energy. The companyâs ability to balance traditional hydrocarbon production with emerging energy trends will be pivotal. Given the current data, a measured stance that monitors ongoing developments and market conditions may be most appropriate for those assessing the stockâs potential.
Company and Industry Overview
Company Basics
Price Performance
Company Size
Shareholding Pattern
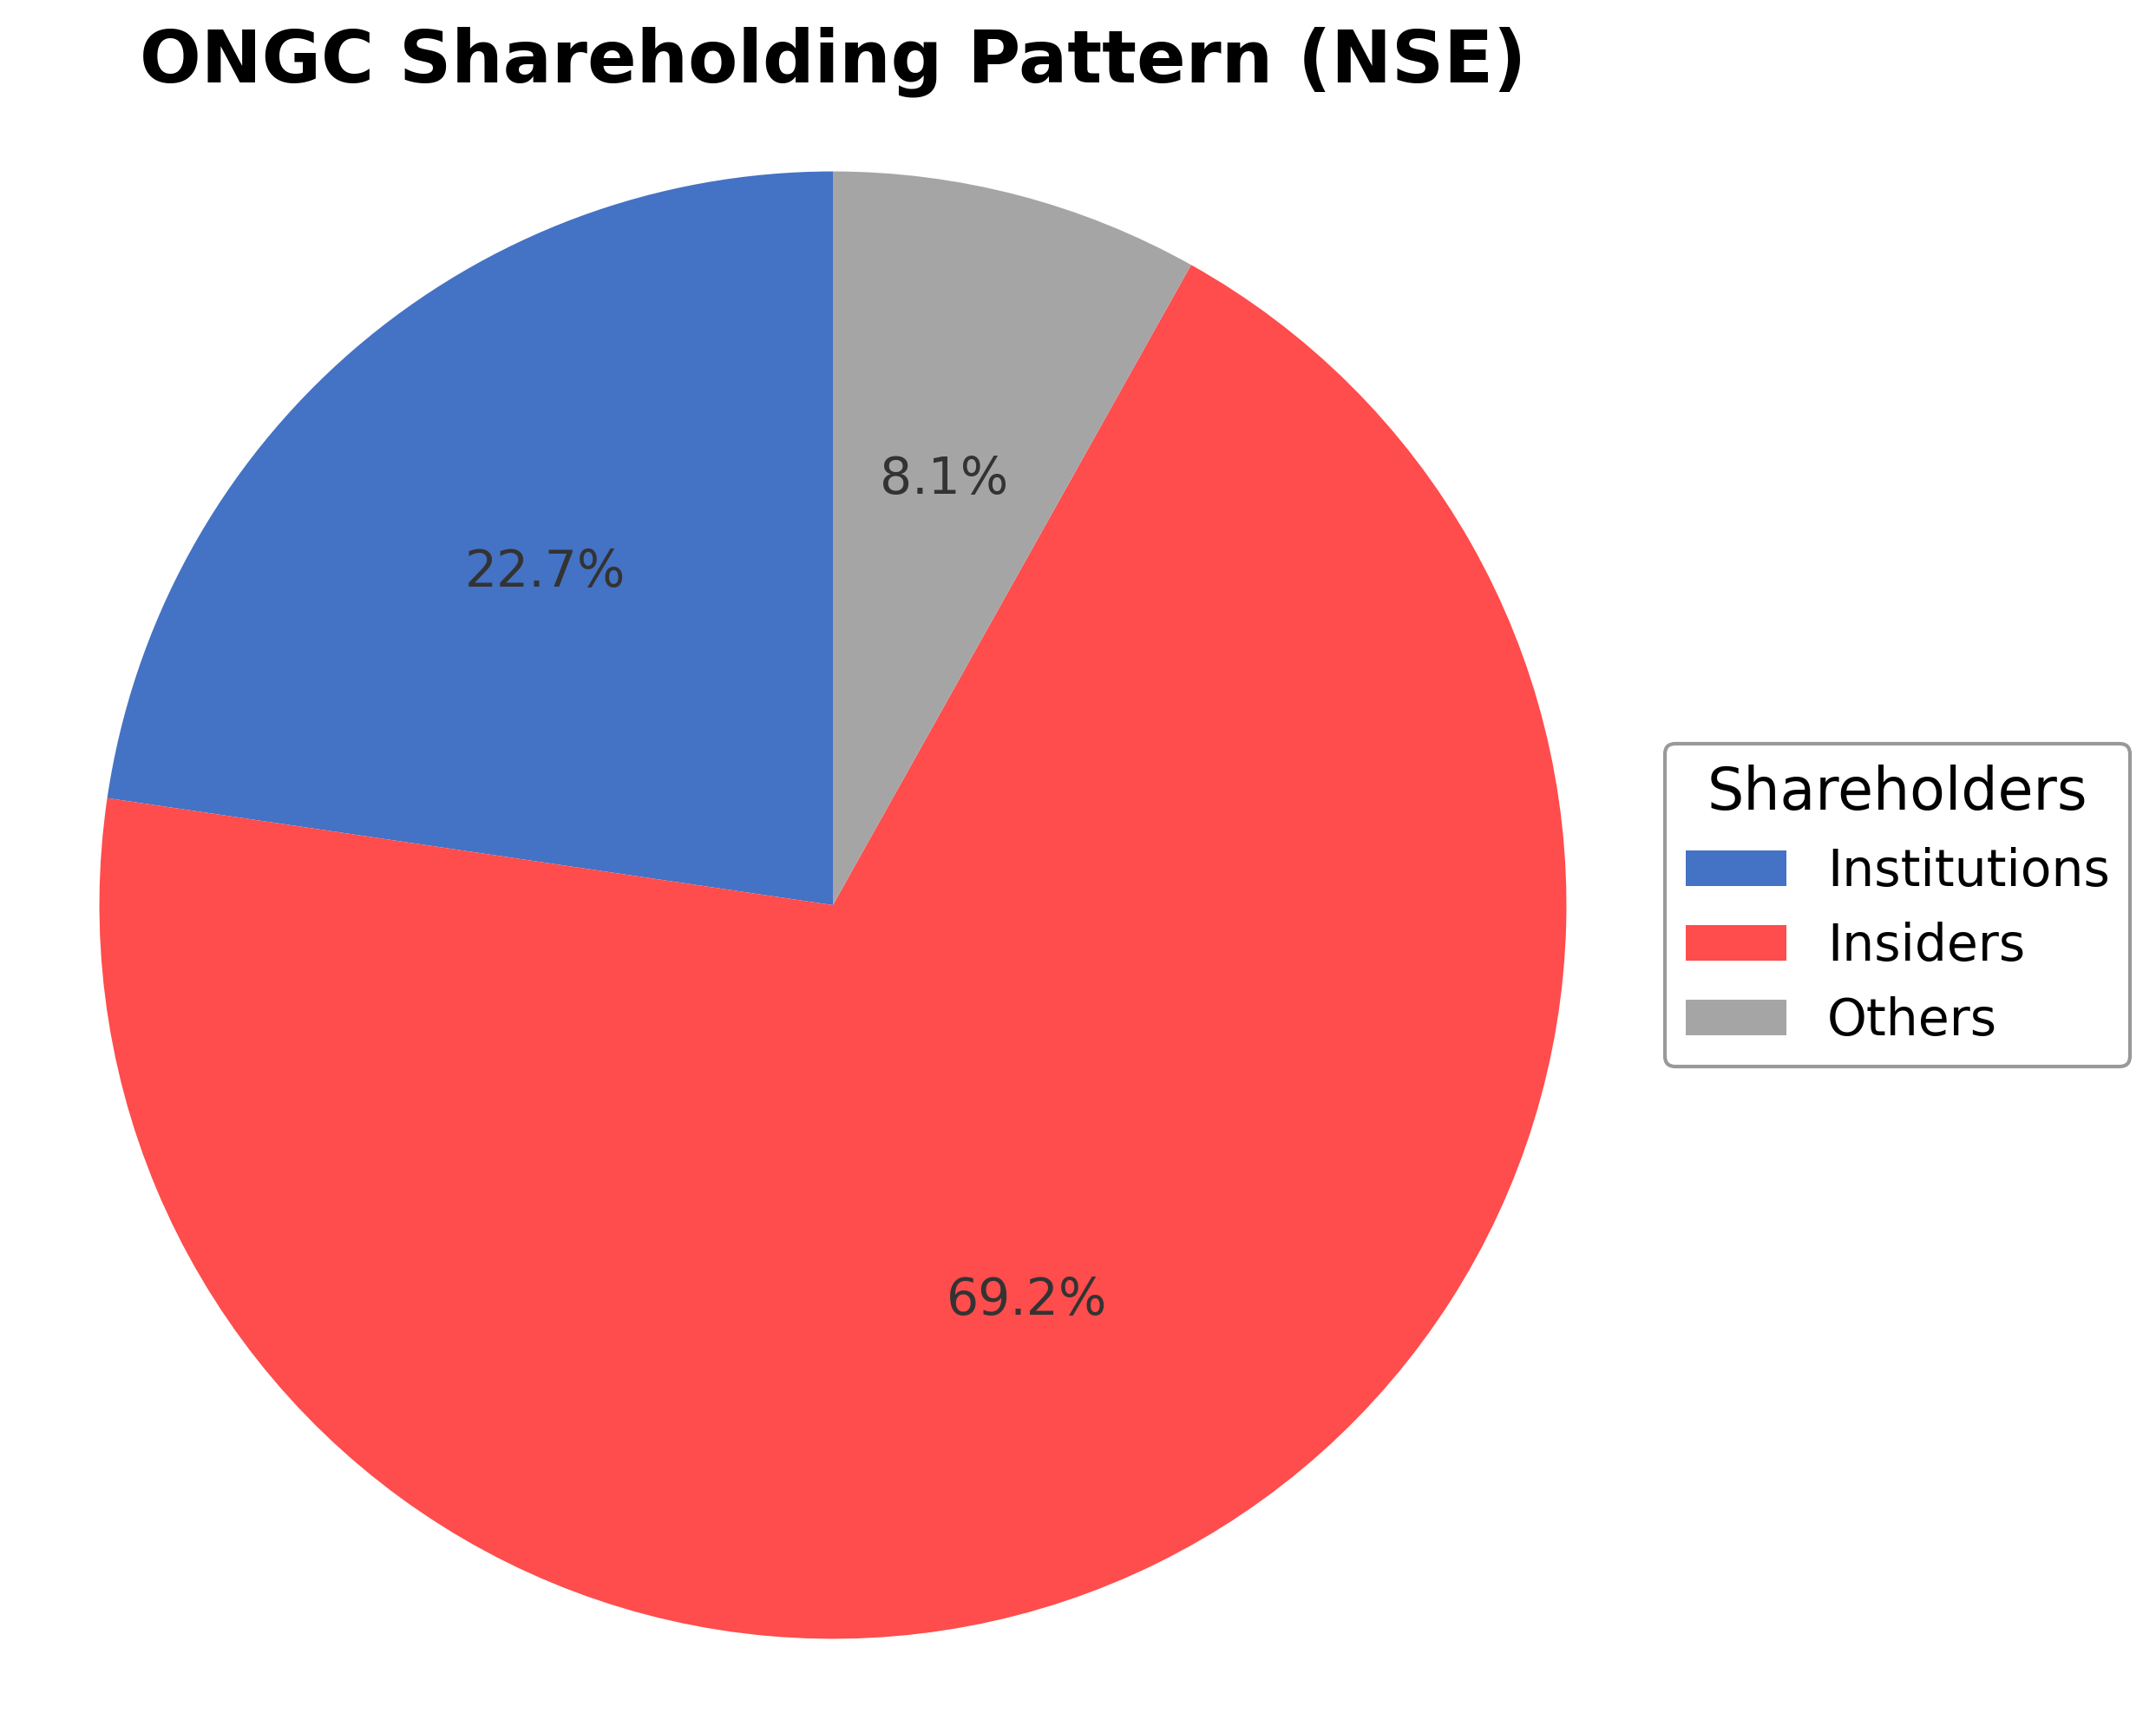
The shareholding structure of Oil & Natural Gas Corporation Ltd. is predominantly held by insiders, including executives and government-affiliated entities, accounting for approximately 69.21% ownership. Institutional investors, such as mutual funds and pension funds, hold about 22.67% of shares, while public and retail investors comprise roughly 8.12%. Over the past 12 to 24 months, institutional ownership has shown moderate stability with no significant accumulation or distribution trends reported. Major funds maintaining positions include prominent Indian and global asset managers, reflecting steady market confidence. This ownership distribution suggests strong government influence on governance and strategic direction, with institutional participation supporting liquidity and market interest. The current structure is likely to influence corporate actions toward balancing public mandates and commercial objectives within the integrated oil and gas industry in India.
Sector and Industry Analysis
The Oil & Natural Gas sector, encompassing exploration, production, refining, and distribution of hydrocarbons, remains a cornerstone of the global energy landscape. In India, this sector is dominated by large-cap entities such as Oil & Natural Gas Corporation Ltd. (ONGC), which is the country’s largest crude oil and natural gas producer with a market capitalization exceeding ₹3.6 trillion. The sector’s growth trajectory is closely tied to global oil price volatility, domestic energy demand growth, and government policies aimed at energy security and self-reliance. Despite the global push towards renewable energy, oil and gas continue to account for a significant share of India’s energy mix, driven by industrialization, urbanization, and transportation needs.
Industry trends reflect a gradual but steady integration of advanced technologies such as enhanced oil recovery (EOR), digital oilfield technologies, and automation to improve operational efficiency and reduce costs. There is also a growing emphasis on natural gas as a transition fuel, supported by infrastructure expansion in LNG terminals and pipeline networks. Consumer behavior is evolving with increased demand for cleaner fuels and petrochemical derivatives, creating opportunities in downstream diversification. Additionally, exploration activities are expanding offshore and in unconventional reserves, leveraging seismic imaging and data analytics to unlock new resources.
The regulatory environment in India’s oil and gas sector is characterized by a mix of central government policies and international compliance standards. Key regulations include the Hydrocarbon Exploration and Licensing Policy (HELP), the Petroleum and Natural Gas Regulatory Board (PNGRB) Act, and environmental norms governing emissions and waste management. The government’s focus on increasing domestic production through incentivization of exploration and production (E&P) activities, along with pricing reforms and subsidy rationalization, significantly impact industry dynamics. Compliance with environmental and safety standards is increasingly stringent, reflecting global climate commitments and local sustainability goals.
Competitive dynamics in the sector are shaped by a few dominant public sector undertakings such as ONGC, Oil India Ltd., and Indian Oil Corporation, alongside private and international players in specific segments. Market structure is oligopolistic with high entry barriers due to capital intensity, technological complexity, and regulatory approvals. ONGC’s strategic positioning benefits from its integrated operations, extensive asset base, and government backing. However, competition is intensifying in upstream exploration and downstream refining, with private players leveraging agility and innovation. The sector’s capital-intensive nature, coupled with geopolitical risks and price cyclicality, necessitates robust risk management and operational excellence to maintain competitive advantage.
Note: Analysis synthesized from industry research, market reports, and regulatory filings. Information is subject to change based on market conditions.
Illustrative Scenario Analysis
DCF Assumptions:
Method: Two-Stage EPS-Priority Model
Financials
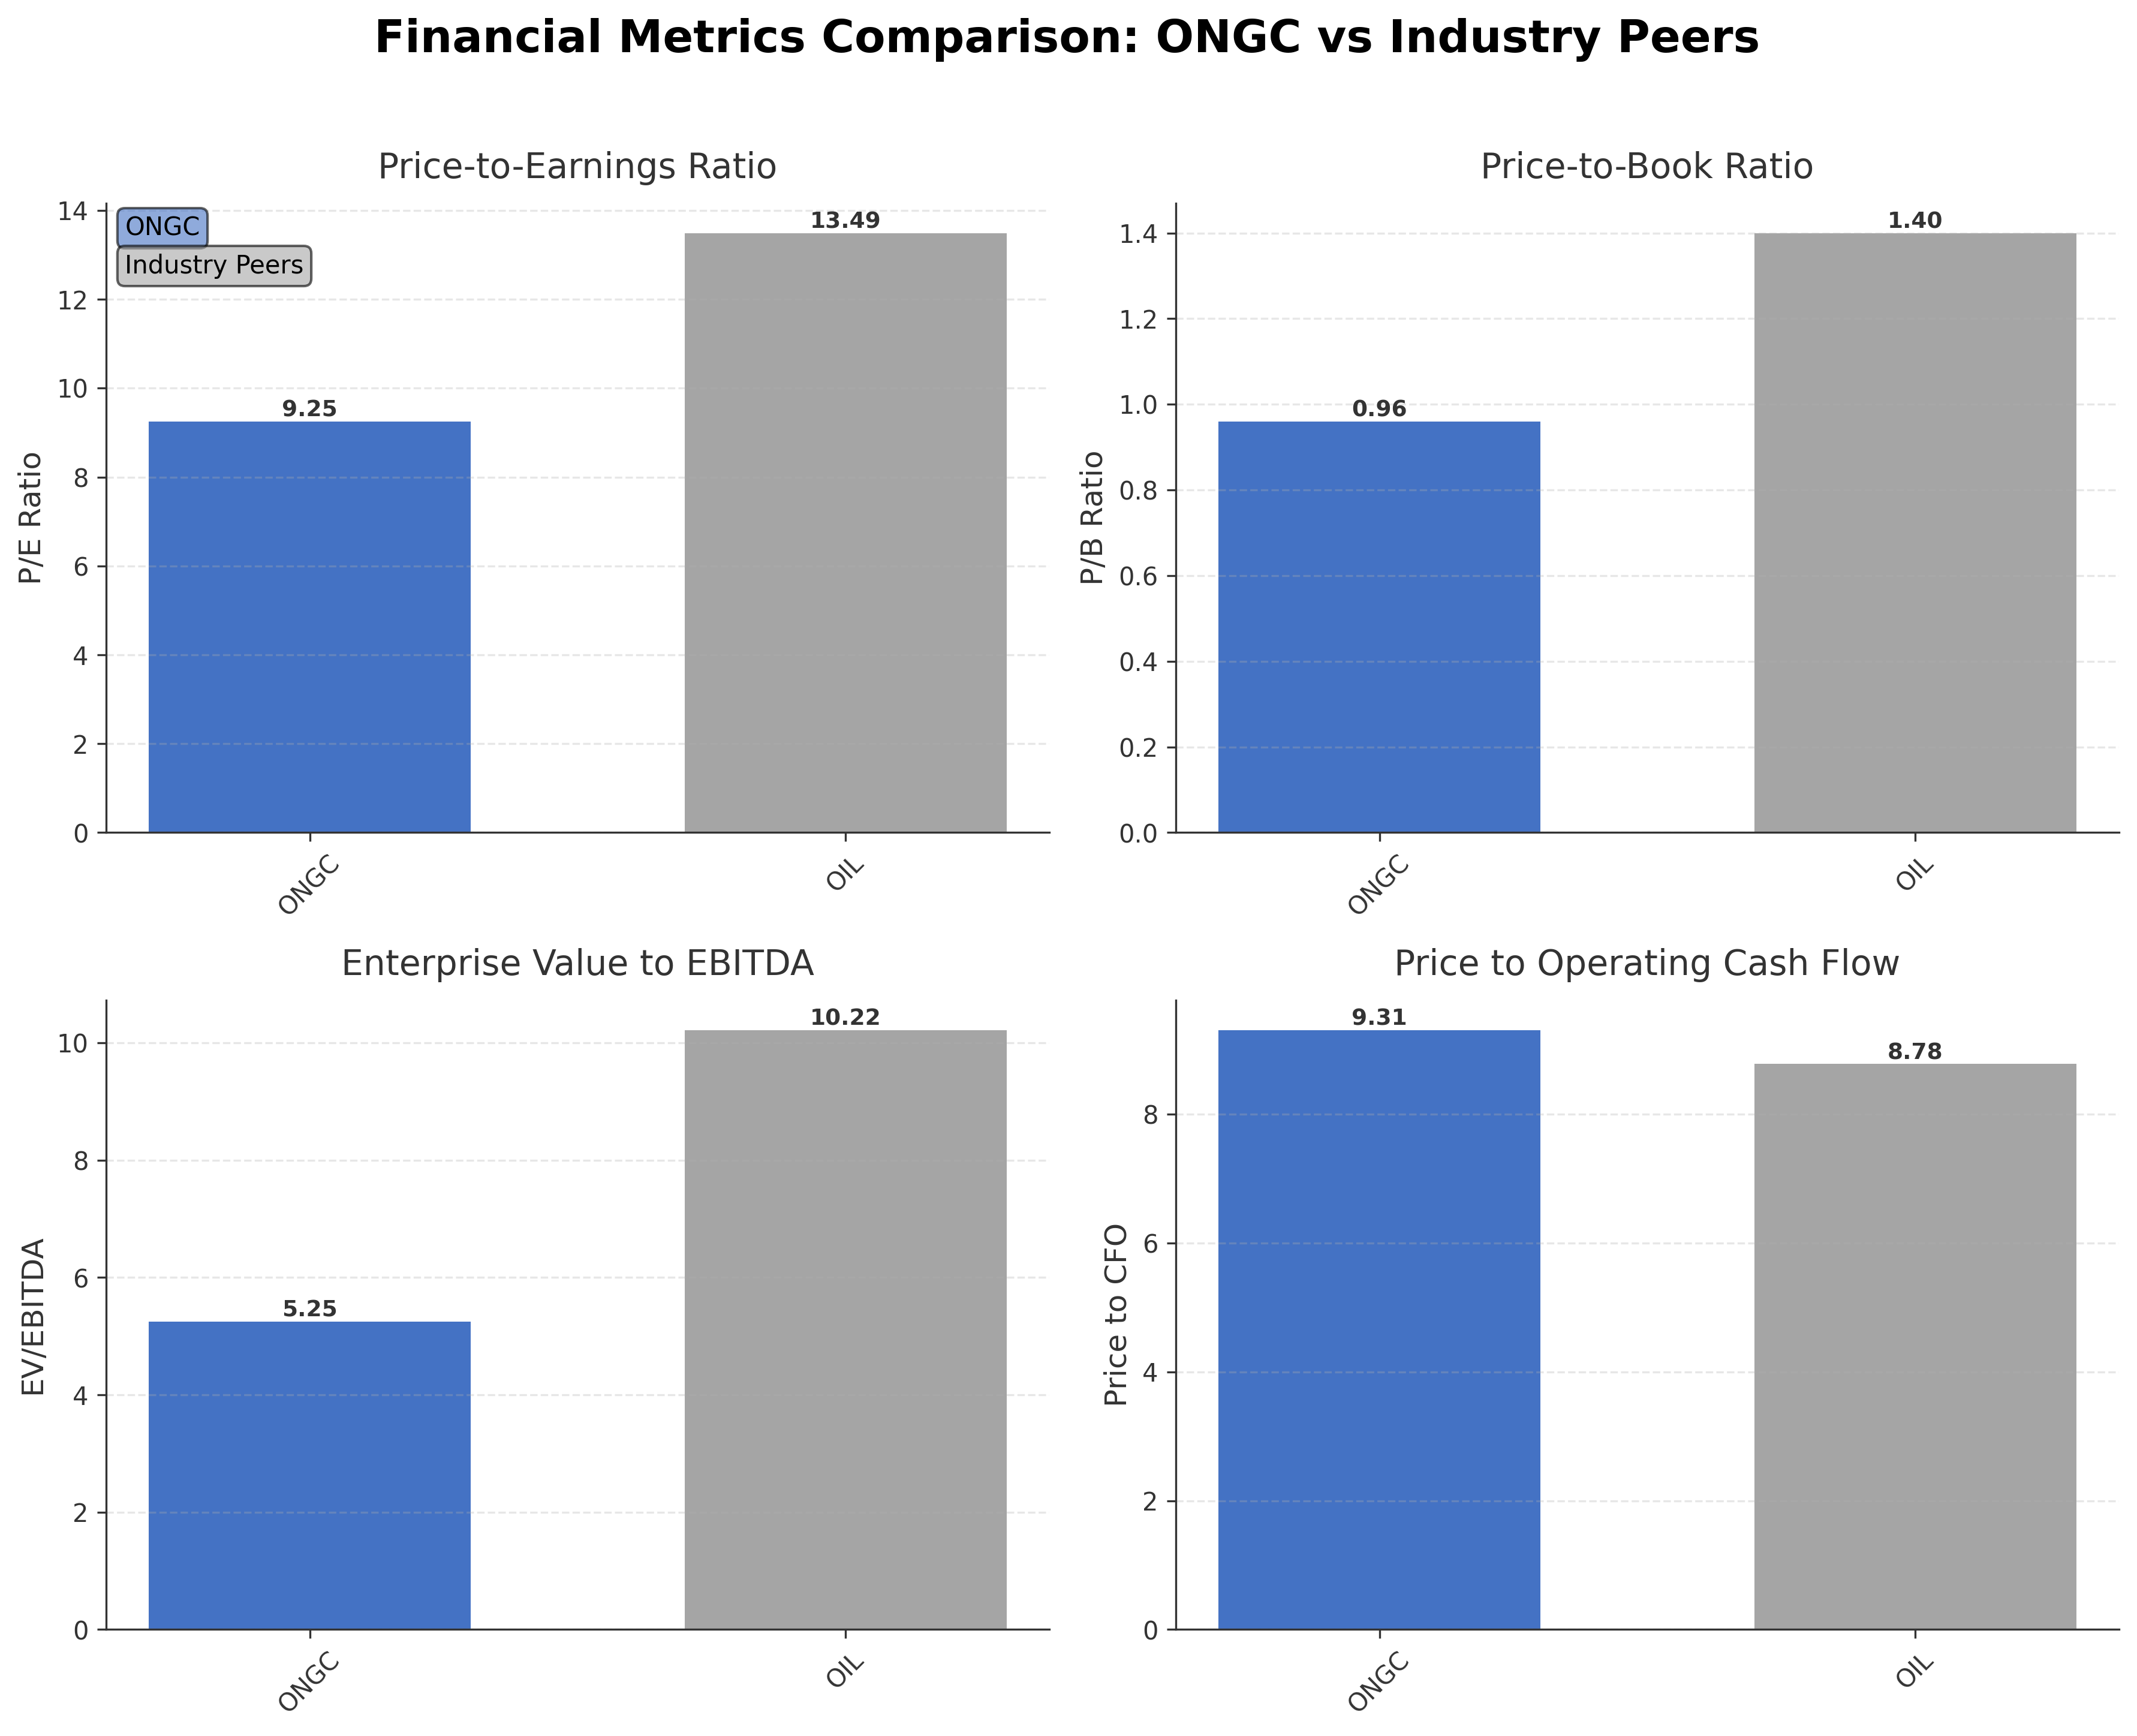
Peer Analysis
| Company Name | Market Cap | P/E Ratio | P/B Ratio | EV/EBITDA | Price to CFO |
|---|---|---|---|---|---|
| Oil & Natural Gas Corporation Ltd. | ₹3.52T | 9.25 | 0.96 | 5.25 | 9.31 |
| Oil Country Tubular Ltd. | ₹0.79T | 13.49 | 1.4 | 10.22 | 8.78 |
Comparison Analysis: Oil & Natural Gas Corporation Ltd. (ONGC) holds a dominant market capitalization position relative to its peer Oil Country Tubular Ltd. (OIL) within the Indian oil and gas sector. ONGC’s valuation multiples, including a P/E ratio of 9.25 and EV/EBITDA of 5.25, are lower than OIL’s respective 13.49 and 10.22, indicating a more conservative valuation profile. The price-to-book ratio of ONGC at 0.96 is also below OIL’s 1.40, suggesting ONGC’s stock trades closer to its book value. Return on equity for ONGC is slightly lower at 10% compared to OIL’s 12%, reflecting ONGC’s larger scale and operational maturity. Overall, ONGC presents as a market leader with stable fundamentals and relatively attractive valuation metrics compared to regional peers.
Financial Metrics Comparison with Peers
Financial Statements
Comprehensive financial data including income, balance sheet, and cash flow metrics
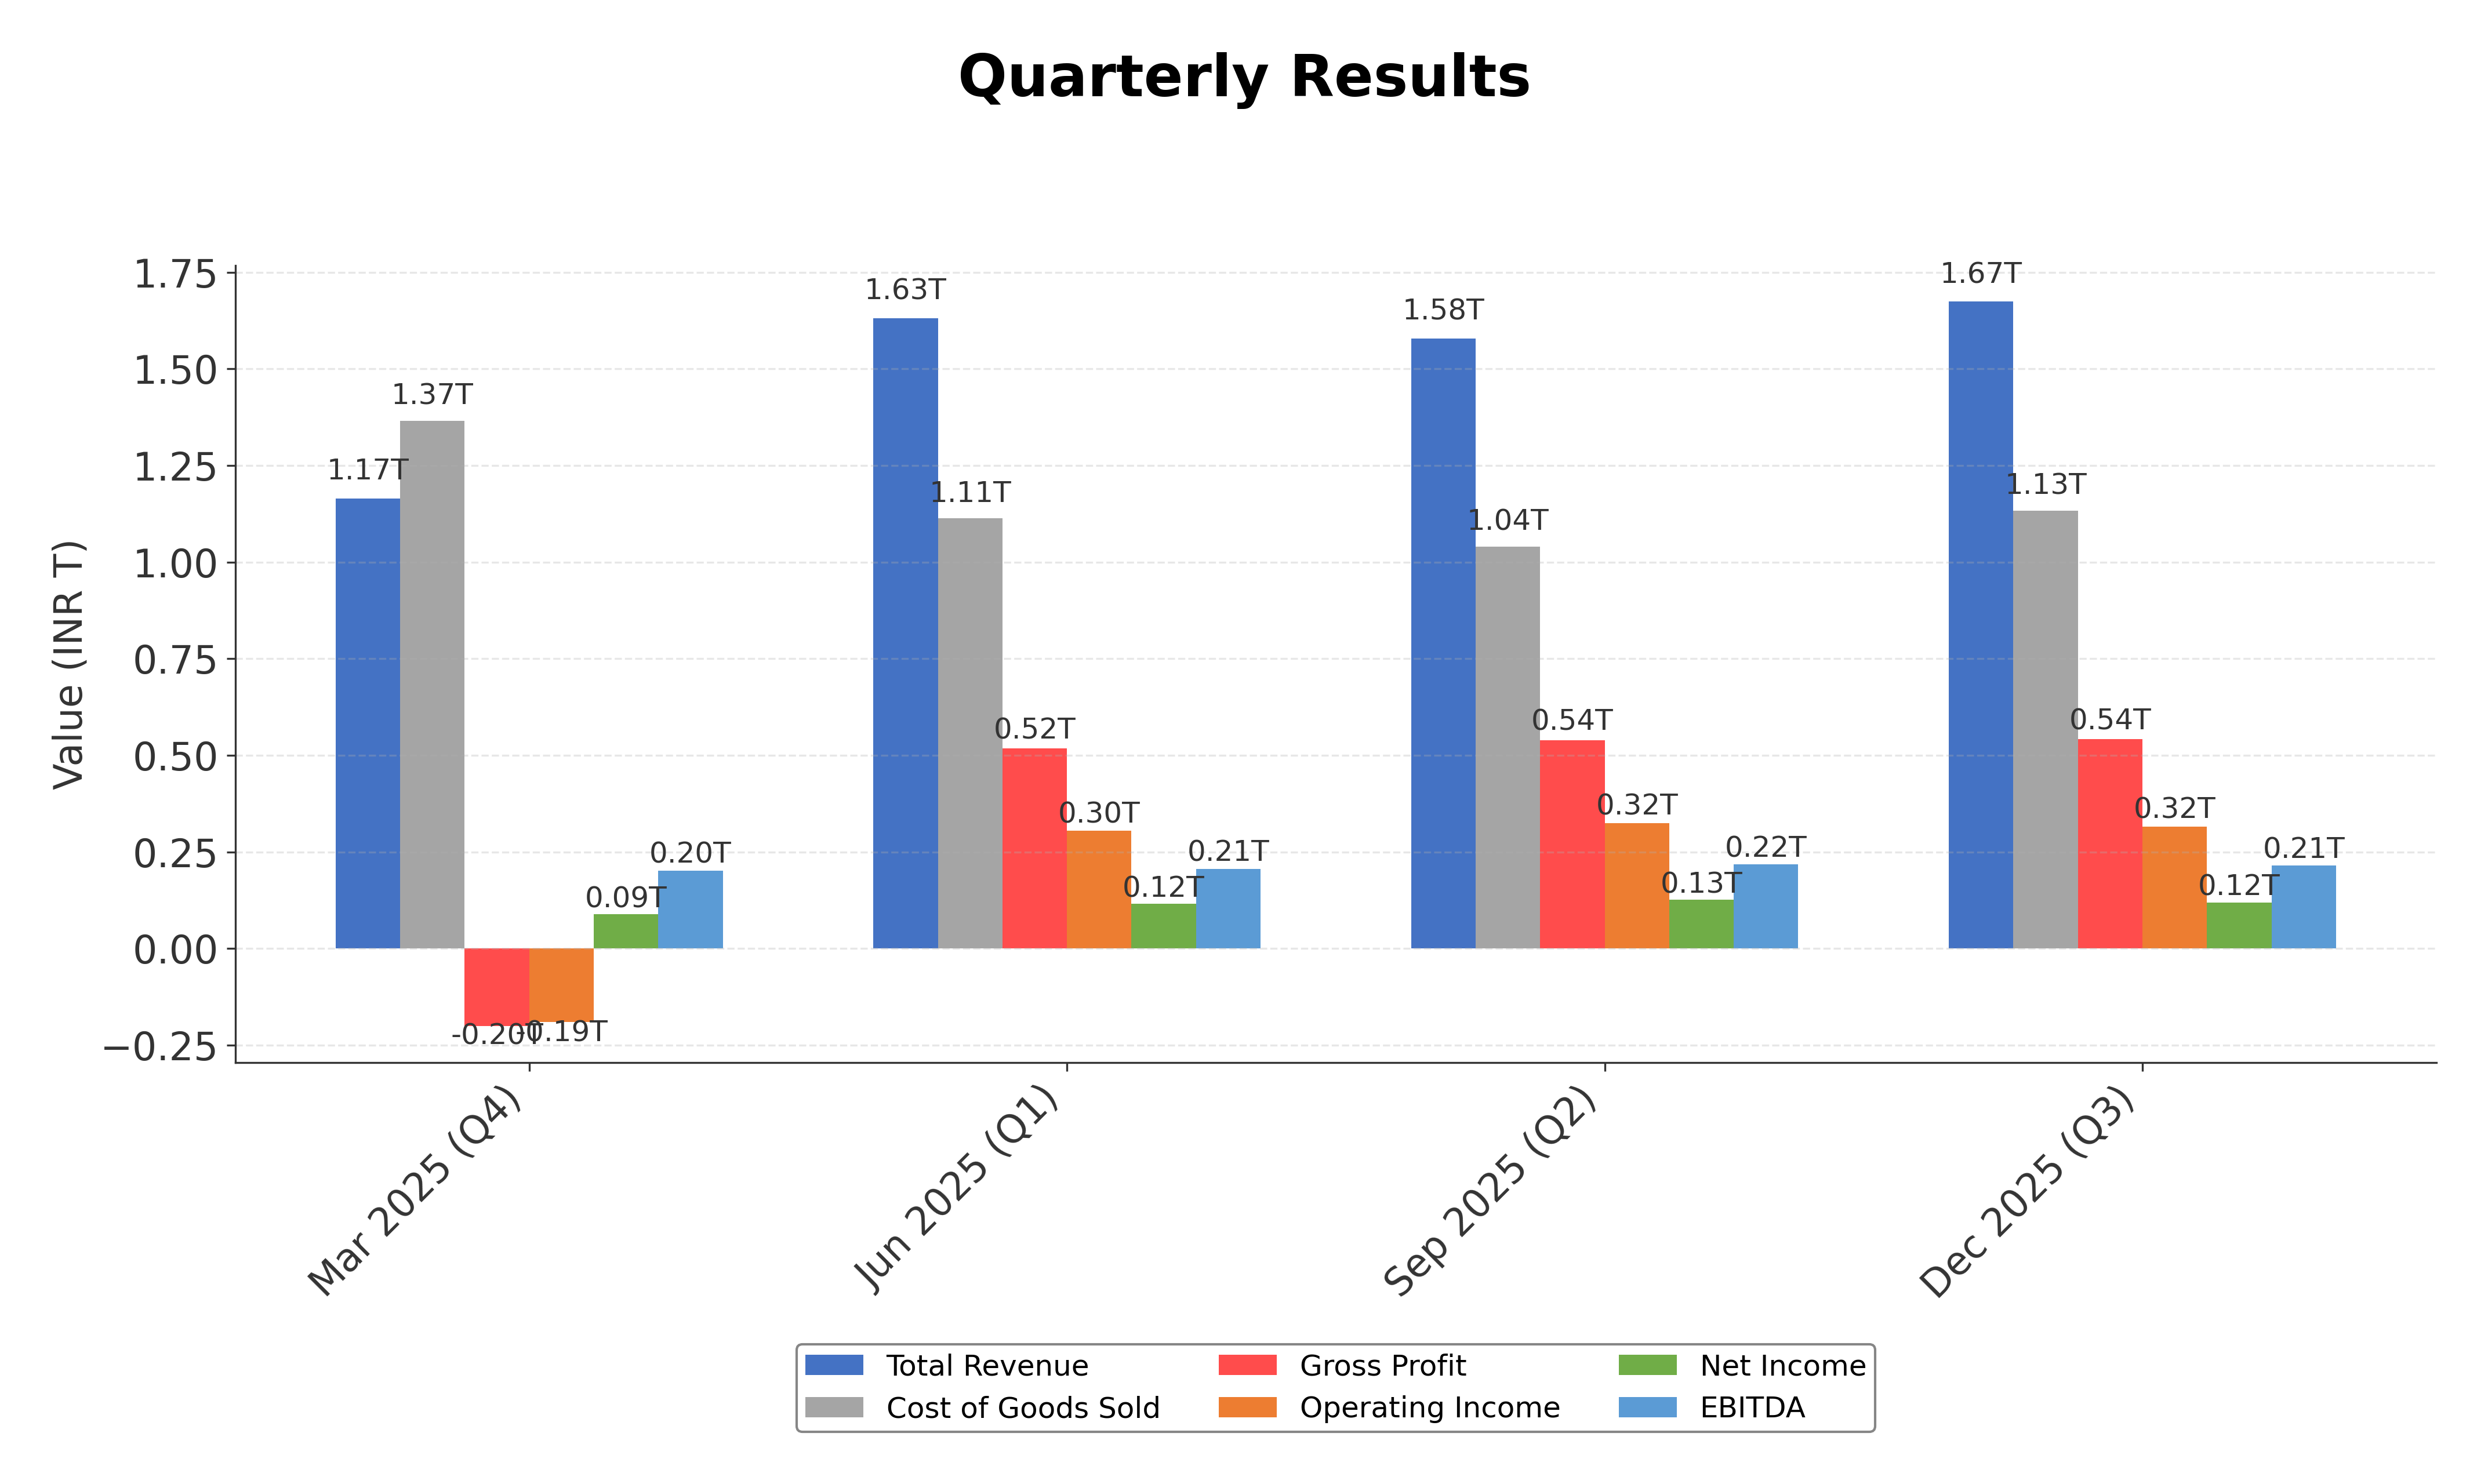
Income Statement
| fiscal_date | 2025-03-31 | 2024-03-31 | 2023-03-31 | 2022-03-31 | 2021-03-31 |
|---|---|---|---|---|---|
| Sales | 6089.51B | 5885.10B | 6295.10B | 4893.01B | 3022.16B |
| Cost Of Goods | 4802.26B | 4506.46B | 5082.29B | 3786.13B | 2295.86B |
| Gross Profit | 1287.24B | 1378.64B | 1212.81B | 1106.89B | 726.30B |
| Operating Expense Research And Development | 6.29B | 6.17B | 5.42B | 5.13B | 5.54B |
| Operating Expense Selling General And Administrative | 171.66B | 155.02B | 148.87B | 137.77B | 121.53B |
| Operating Expense Other Operating Expenses | 410.85B | 338.19B | 330.13B | 291.62B | 208.75B |
| Operating Income | 636.23B | 818.99B | 673.14B | 610.42B | 328.66B |
| Non Operating Interest Income | 46.37B | 42.71B | 20.77B | 10.21B | 7.54B |
| Non Operating Interest Expense | 118.40B | 92.12B | 70.35B | 46.76B | 46.35B |
| Pretax Income | 523.98B | 768.60B | 447.46B | 540.91B | 301.26B |
| Income Tax | 140.69B | 197.59B | 107.00B | 47.97B | 87.66B |
| Net Income | 383.29B | 571.01B | 340.46B | 492.94B | 213.60B |
| Eps Basic | 28.80 | 39.13 | 29.18 | 36.19 | 12.92 |
| Eps Diluted | 28.80 | 39.13 | 29.18 | 36.19 | 12.92 |
| Basic Shares Outstanding | 12.58B | 12.58B | 12.58B | 12.58B | 12.58B |
| Diluted Shares Outstanding | 12.58B | 12.58B | 12.58B | 12.58B | 12.58B |
| Ebit | 642.38B | 860.73B | 517.81B | 587.68B | 347.61B |
| Ebitda | 1101.76B | 1260.09B | 971.22B | 949.12B | 677.93B |
| Net Income Continuous Operations | 383.29B | 571.01B | 340.46B | 492.94B | 213.60B |
| Minority Interests | -21.03B | -78.79B | 26.63B | -37.72B | -50.56B |
| Preferred Stock Dividends | 0.00 | 0.00 | 0.00 | 0.00 | 0.00 |
Data provided by Twelve Data
Balance Sheet
| fiscal_date | 2025-03-31 | 2024-03-31 | 2023-03-31 | 2022-03-31 | 2021-03-31 |
|---|---|---|---|---|---|
| Cash And Cash Equivalents | 16.68B | 41.33B | 26.40B | 50.35B | 40.19B |
| Accounts Receivable | 212.28B | 197.63B | 187.52B | 191.87B | 160.16B |
| Total Assets | 7587.23B | 7101.93B | 6182.78B | 5865.38B | 5432.79B |
| Total Liabilities | 3844.88B | 3451.02B | 3146.26B | 3012.04B | 3006.82B |
| Long Term Debt | 1228.59B | 1032.17B | 1066.53B | 972.59B | 946.20B |
| Shareholders Equity | 3742.35B | 3650.91B | 3033.83B | 2841.87B | 2425.97B |
Data provided by Twelve Data
Cash Flow Statement
| fiscal_date | 2025-03-31 | 2024-03-31 | 2023-03-31 | 2022-03-31 | 2021-03-31 |
|---|---|---|---|---|---|
| Operating Activities Net Income | 383.29B | 571.01B | 340.46B | 492.94B | 213.60B |
| Operating Activities Other Non Cash Items | 77.96B | 34.67B | 38.09B | 38.21B | 23.83B |
| Operating Activities Accounts Receivable | -17.42B | -22.71B | 11.42B | -35.18B | -14.30B |
| Operating Activities Other Assets Liabilities | -65.81B | -72.33B | 122.06B | -111.24B | -159.16B |
| Operating Activities Operating Cash Flow | 378.01B | 510.65B | 512.03B | 384.74B | 63.97B |
| Investing Activities Capital Expenditures | -553.60B | -516.51B | -505.91B | -441.60B | -427.04B |
| Investing Activities Net Acquisitions | -44.79B | -35.30B | -35.36B | -24.47B | -25.26B |
| Investing Activities Other Investing Activity | -22.54B | -18.10B | -16.92B | -13.55B | -12.32B |
| Investing Activities Investing Cash Flow | -620.92B | -569.91B | -558.19B | -470.11B | -451.15B |
| Financing Activities Long Term Debt Issuance | 256.10B | 224.59B | 232.59B | 176.85B | 187.80B |
| Financing Activities Long Term Debt Payments | -435.47B | -368.02B | -102.67B | -138.35B | -135.34B |
| Financing Activities Short Term Debt Issuance | 105.48B | -10.78B | 44.42B | -168.44B | 539.87M |
| Financing Activities Common Dividends | -169.85B | -128.95B | -176.09B | -129.24B | -30.96B |
| Financing Activities Other Financing Charges | -4.94B | -6.09B | -6.19B | -2.78B | -9.21B |
| Financing Activities Financing Cash Flow | -248.67B | -289.25B | -7.94B | -261.96B | 12.83B |
| End Cash Position | -22.98B | -23.66B | 12.25B | 27.29B | 14.68B |
| Free Cash Flow | 351.92B | 473.61B | 351.32B | 337.22B | 42.01B |
| Investing Activities Purchase Of Investments | N/A | N/A | N/A | -8.36B | -3.27B |
| Investing Activities Sale Of Investments | N/A | N/A | N/A | 17.86B | 16.73B |
Data provided by Twelve Data
Technical Analysis
Key Insights
- The current trend shows ONGC’s stock trading near its 52-week high, indicating a strong upward price momentum.
- Key support levels are identified near ₹254.69 (50-day moving average) and ₹245.49 (200-day moving average), with resistance around the recent high of ₹282.50.
- The stock price is above the 10-day, 50-day, and 200-day moving averages, suggesting a bullish medium to long-term trend.
- Momentum indicators show RSI in a moderately overbought zone, MACD remains positive, and stochastic oscillators indicate sustained buying pressure.
- Multi-timeframe analysis across daily, weekly, and monthly charts confirms consistent upward momentum without significant reversal signals.
- Potential market scenarios include continuation of the uptrend if support levels hold, while a breach below moving averages could signal consolidation or correction.
Trending News
1. Headline: India's Industrial Gas Supply Slashed After Qatar Suspends Output | OilPrice.com
Summary: India’s biggest LNG importer Petronet LNG Ltd late on Monday told the top gas marketer GAIL (India) and other firms that supply would be reduced. GAIL and state-held Indian Oil Corporation have, in turn, told their customers that gas supply would be reduced by between 10% and 30%, according ...
Sentiment: negative
2. Headline: ONGC Assigns Interim Charge of Strategy & Corporate Affairs to Vikram Saxena - TipRanks.com
Summary: Oil & Natural Gas Corp. Ltd. ( ($IN:ONGC) ) has provided an announcement. Oil & Natural Gas Corporation Limited has announced a leadership change in its strategy fu...
Sentiment: neutral
3. Headline: ONGC Appoints Vikram Saxena as Additional Director for Strategy & Corporate Affairs
Summary: Oil and Natural Gas Corporation Limited has appointed Shri Vikram Saxena as additional Director (Strategy & Corporate Affairs) for three months starting March 1, 2026. Saxena, currently Director (Technology & Field Services), will hold the additional charge until a regular incumbent is appointed ...
Sentiment: neutral
4. Headline: Exclusive: India reduces gas supply to industries after Qatar outage, sources say | Reuters
Summary: Qatar halted its liquefied natural gas production on Monday, as Iran continued to strike Gulf countries in retaliation for Israeli and U.S. strikes against it. The attacks have also halted oil and gas shipments through the Strait of Hormuz, driving up global energy prices and shipping costs. Sign up here. India, the world's fourth-largest buyer of LNG, relies heavily on the Middle East for its imports. Top LNG importer Petronet LNG Ltd ...
Sentiment: negative
5. Headline: Gas prices soar as QatarEnergy halts LNG production after Iran attacks | Energy News | Al Jazeera
Summary: This comes after Saudi Arabia announced the temporary closure of one of its largest oil facilities following drone attacks.
Sentiment: negative
6. Headline: Gas Prices Surge as Qatar Shuts World’s Largest LNG Export Plant - Bloomberg
Summary: Qatar shut LNG production at the world’s largest export facility after it was targeted in an Iranian drone attack, sending European gas prices surging as much as 54%.
Sentiment: negative
7. Headline: Oil & Natural Gas Corporation Ltd. Surges to New 52-Week High Amidst Nifty 50 Benchmark Significance
Summary: Oil & Natural Gas Corporation Ltd. (ONGC), a pivotal constituent of the Nifty 50 index, has demonstrated robust market performance and institutional interest, reinforcing its benchmark status within the Indian oil sector. Recent trading activity and fundamental metrics underscore its significance ...
Sentiment: positive
8. Headline: BPCL, HPCL, IOC, ONGC, GAIL, Oil India shares in focus amid Iran war with US and Israel - BusinessToday
Summary: Shares of oil marketing companies ... Ltd (HPCL) and Indian Oil Corporation Ltd (IOC) could be under pressure on Monday amid the ongoing conflict involving Iran, the US and Israel across the Middle East. Upstream stocks such as Oil & Natural Gas Corpn Ltd (ONGC), GAIL and Oil ...
Sentiment: negative
9. Headline: This $58 Billion Merger Is Creating a New U.S. Oil and Gas Giant | The Motley Fool
Summary: Devon Energy is combining with Coterra Energy to create a leading shale energy business.
Sentiment: positive
10. Headline: Oil & Natural Gas Corporation Ltd Gains 0.43%: 5 Key Factors Driving the Week
Summary: Oil & Natural Gas Corporation Ltd (ONGC) closed the week ending 27 February 2026 with a modest gain of 0.43%, outperforming the Sensex which declined by 0.96% over the same period. The stock demonstrated resilience amid mixed technical signals and a volatile market backdrop, hitting new 52-week ...
Sentiment: positive
Powered by Brave
Recent Updates
News Summary
Recent updates for Oil & Natural Gas Corporation Ltd. highlight a leadership change with Vikram Saxena assuming interim charge of Strategy & Corporate Affairs, signaling potential strategic realignment. Market sentiment has been buoyed by an upgrade from MarketsMOJO citing strong technical and valuation metrics. ONGC is also pursuing renewable energy acquisitions targeting 2.5-3 GW capacity by 2030, reflecting diversification efforts. The company’s shares rallied amid crude oil price spikes, underscoring sensitivity to global energy markets. Additionally, recent revenue beats indicate operational resilience, supporting positive market interest despite geopolitical challenges impacting supply chains.
News Sentiment
Sentiment across recent news is mixed to moderately positive, with leadership changes and strategic initiatives viewed neutrally, while market upgrades and operational performance contribute to optimism. Negative sentiment is primarily linked to external geopolitical events affecting energy supply and pricing. Overall, the sentiment reflects cautious optimism balanced with awareness of external risks.
Analytical Overview
Analysis Summary
ONGC’s valuation metrics, including a trailing P/E of 9.25 and forward P/E of 7.77, are below or near the industry average of 9.25, suggesting relatively attractive pricing compared to peers. The PEG ratio of 0.57 indicates potential undervaluation relative to earnings growth.
The company’s revenue growth is modest at 0.8% quarterly, supported by positive quarterly earnings growth of 16.2%. Operating and free cash flows are positive, indicating healthy cash generation supporting ongoing operations and investments.
Financial health is stable with a total debt to equity ratio of 43.8%, manageable given the company’s cash reserves of approximately ₹503 billion. The current ratio below 1 (0.87) suggests tight short-term liquidity, but operating cash flow remains positive.
Sector-specific challenges include exposure to volatile global oil and gas prices and geopolitical risks impacting supply chains. Opportunities arise from ONGC’s plans to acquire renewable energy projects totaling 2.5-3 GW by 2030, reflecting diversification and alignment with energy transition trends.
Considering India-specific factors, ONGC benefits from government ownership and policy support, but must navigate regulatory frameworks and shifting consumer energy demands. The company’s strategic initiatives in renewables align with India’s broader economic and environmental outlook.
Investment Conclusion
Supporting Factors: Primary supporting factors include ONGC’s strong market position as India’s largest oil and gas producer, attractive valuation metrics relative to peers, and positive cash flow generation.
Risk Factors: Main risks involve geopolitical tensions affecting energy supply, modest revenue growth, and liquidity constraints indicated by a current ratio below 1.
SWOT Analysis
Strengths
- Largest producer of crude oil and natural gas in India with significant market share.
- Strong government ownership providing strategic support and stability.
- Robust cash flow generation supporting operations and investments.
- Attractive valuation metrics with a low price-to-earnings ratio relative to industry.
Weaknesses
- Current ratio below 1 indicating potential short-term liquidity constraints.
- Modest revenue growth limiting near-term expansion prospects.
- Profit margins remain relatively low compared to global peers.
- High dependence on volatile global oil and gas prices.
Opportunities
- Expansion into renewable energy projects targeting 2.5-3 GW capacity by 2030.
- Increasing domestic energy demand in India supporting long-term growth.
- Potential for strategic partnerships and acquisitions to diversify portfolio.
- Government policies favoring energy security and sustainability initiatives.
Threats
- Geopolitical tensions disrupting global energy supply chains.
- Regulatory changes impacting operational costs and project approvals.
- Competition from private and international energy firms.
- Volatility in crude oil and natural gas prices affecting profitability.
Company Description
Oil & Natural Gas Corporation Ltd. is a leading Indian multinational energy company engaged primarily in the exploration and production of oil and natural gas. As the largest producer of crude oil and natural gas in India, its operations are central to meeting national energy demands. The company's primary function is to locate, extract, and sell hydrocarbons, contributing significantly to the country's energy supply chain. ONGC operates across the entire oil and gas value chain, including exploration, development, production, refining, and distribution. The corporation plays a pivotal role in ensuring India's energy security and has a substantial impact on sectors such as industrial manufacturing, transportation, and utilities. Its activities not only facilitate domestic energy requirements but also influence global energy markets, given its scale and reach. Founded in 1956 and headquartered in Dehradun, India, ONGC is a government-owned entity that holds a significant place in the country’s economic framework. It also engages in sustainable practices and innovation in energy technology, striving to balance resource extraction and environmental considerations.