

Nmdc Limited (NMDC)
Stock Analysis Report
Stock Journey
Key Positives and Key Risks
Pros
- Nmdc Limited’s trailing P/E ratio of 9.87 and forward P/E of 8.15 are below industry averages, indicating attractive valuation relative to earnings.
- The company reports a strong return on equity of 23.36%, reflecting efficient use of shareholder capital and robust profitability.
Cons
- Negative levered free cash flow of approximately ₹13.96 billion suggests potential liquidity or capital expenditure pressures.
- Iron ore price reductions for two consecutive months may negatively impact near-term revenue and profit margins.
- Price to cash flow from operations ratio of 14.70 is elevated compared to peers, indicating a premium valuation on cash flow.
Disclosure: This information is for general awareness and does not constitute investment advice
Report Summary
Nmdc Limited is a leading Indian mining company primarily engaged in the exploration and production of iron ore, a critical raw material for steel manufacturing and various industries. Listed on the NSE under the Basic Materials sector, it operates several mines across India, notably in Chhattisgarh and Karnataka. The company also explores other minerals such as copper, limestone, and rock phosphate, positioning itself as a key player in India's mineral resource sector with a strong domestic and international presence.
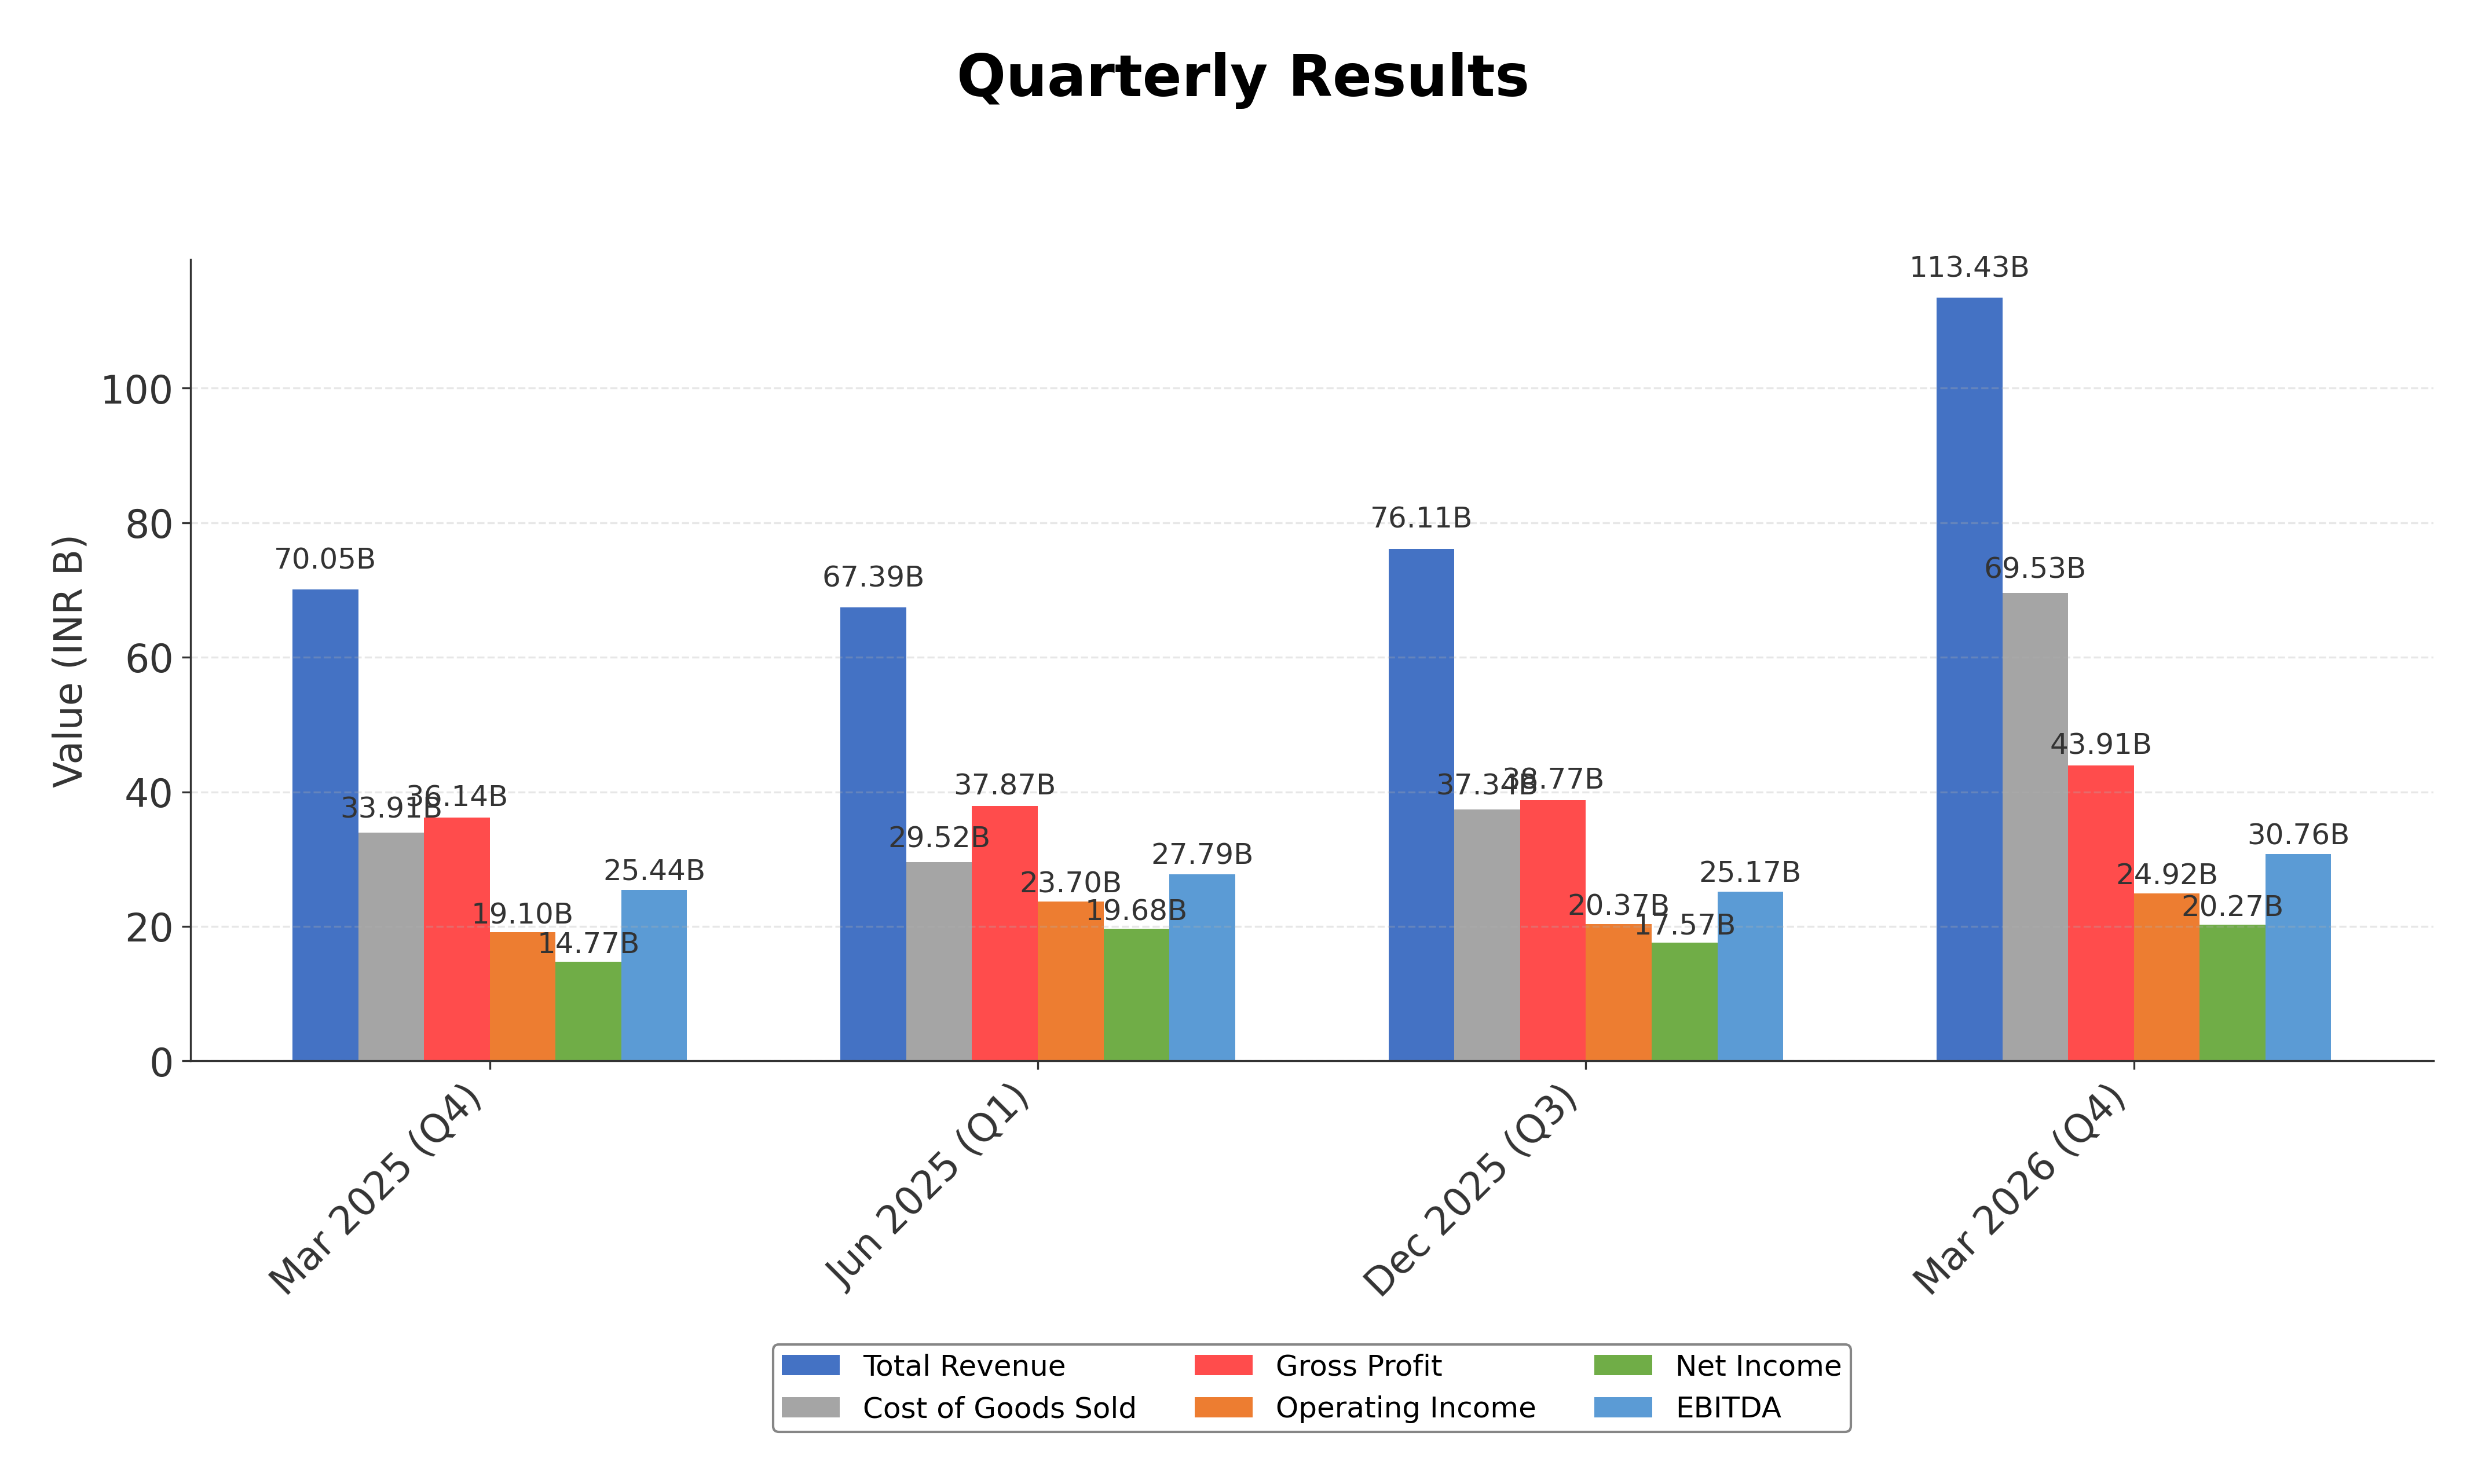
Financially, Nmdc Limited reported trailing twelve months (TTM) revenue of approximately ₹320.7 billion with a gross margin of 38.7%, operating margin of 21.97%, and net profit margin of 23.23%. The company demonstrates efficient capital utilization with a return on equity (ROE) of 23.36% and return on assets (ROA) of 12.29%. Its return on invested capital (ROIC) is reflected in an enterprise value to EBITDA ratio of 7.38, indicating solid profitability and operational efficiency.
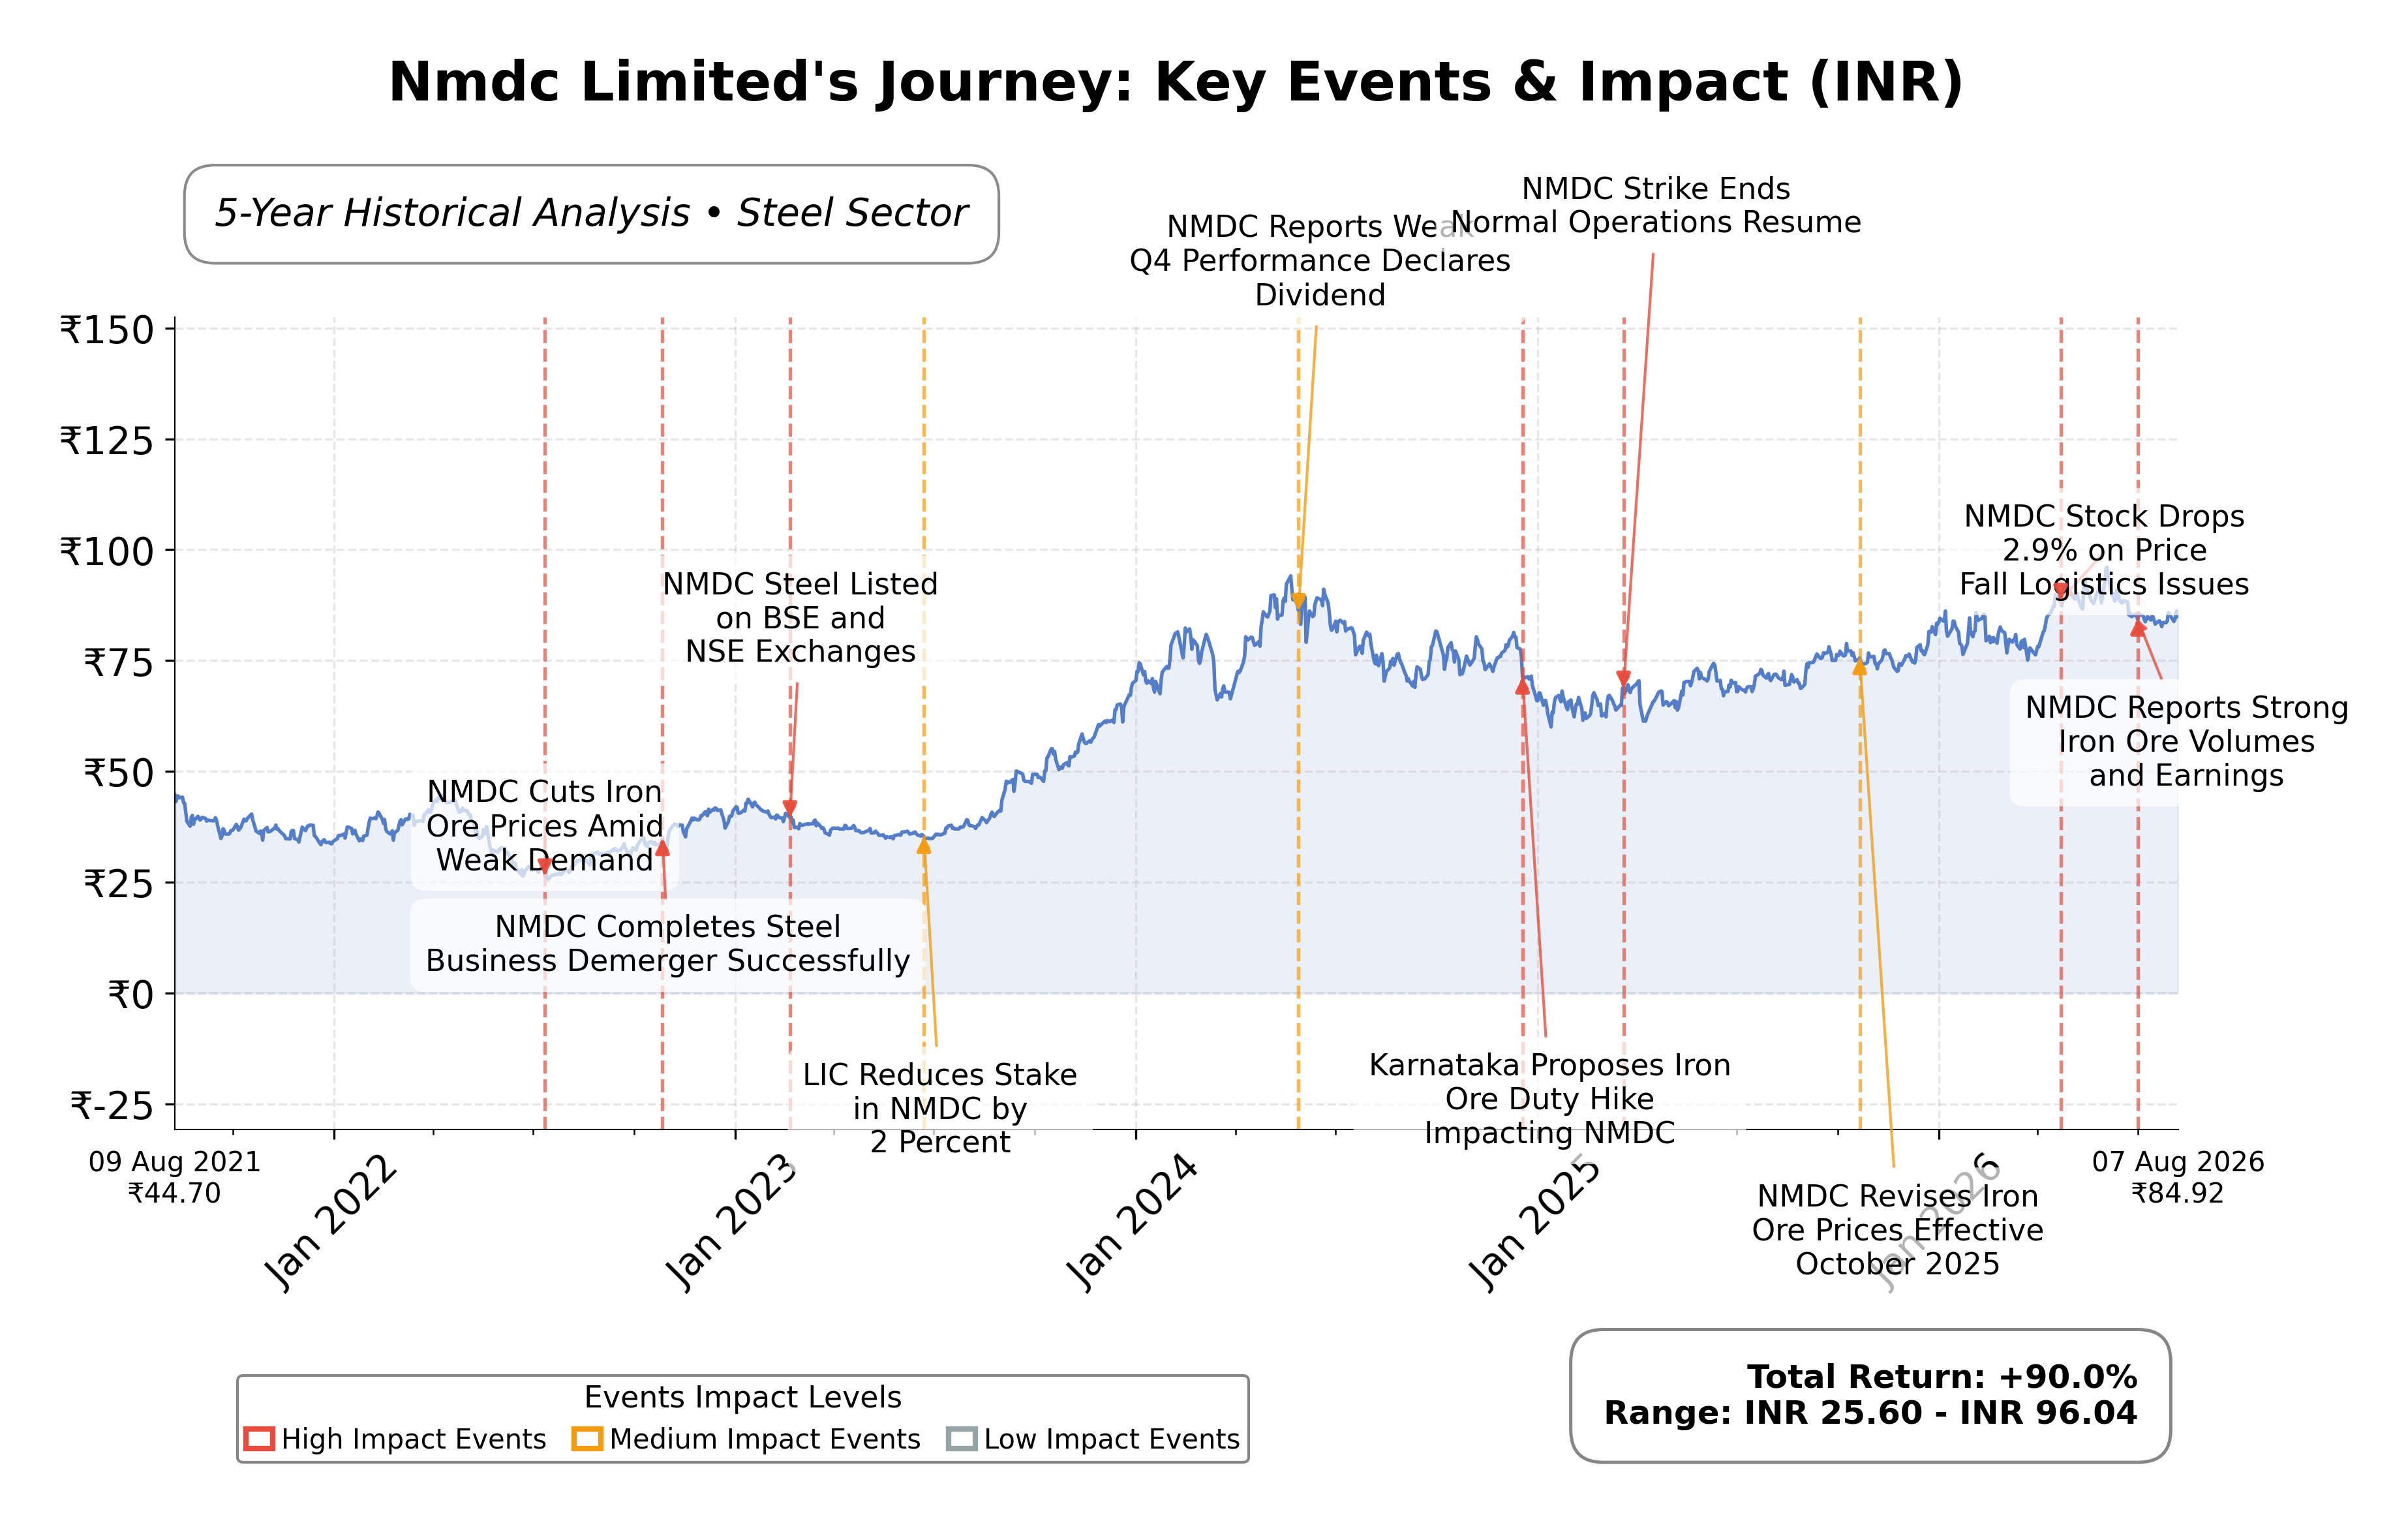
Valuation metrics show a trailing price-to-earnings (P/E) ratio of 9.87 and a forward P/E of 8.15, suggesting the stock is reasonably priced relative to earnings expectations. The price-to-book (P/B) ratio stands at 2.15, and the enterprise value to revenue ratio is 2.13. With a market capitalization of approximately ₹734.6 billion, the stock trades within a 52-week range of ₹68.19 to ₹97.49, currently priced at ₹84.92, indicating it is closer to the mid-to-upper range of its recent trading band.
Key strengths include a robust cash position of ₹113.9 billion against total debt of ₹64.1 billion, a healthy current ratio of 2.43, and consistent profitability with strong margins. The company maintains a semi-annual dividend with a forward yield of 6.0%. Risks involve fluctuating iron ore prices, regulatory changes in mining policies, and competitive pressures from other mining and steel producers. Recent strategic actions include leadership changes with new appointments to the board and compliance officer roles, alongside ongoing price adjustments in iron ore to respond to market conditions.
Technically, the stock is trading above its 50-day (₹87.63) and 200-day (₹82.28) moving averages, with moderate momentum indicators suggesting a stable trend. Recent news highlights price cuts in iron ore and steady operational updates, indicating a cautious but steady market environment. Overall, the data suggests a balanced stance with conditions suitable for monitoring developments closely rather than immediate repositioning.
Company and Industry Overview
Company Basics
Price Performance
Company Size
Shareholding Pattern
Sector and Industry Analysis
The Indian mining sector, particularly iron ore mining, is a significant contributor to the country's industrial growth, with a market size driven by domestic steel production and exports. The sector has experienced steady growth supported by infrastructure development and rising demand from the steel industry. Key players include NMDC Limited, the largest government-owned iron ore producer, alongside private and other public sector companies, collectively shaping the competitive landscape.
Industry trends highlight a focus on high-grade iron ore production and diversification into related minerals such as copper, limestone, and diamonds, as seen with NMDC's portfolio. Technological advancements and increased mechanization have improved operational efficiencies, while barriers to entry remain high due to capital intensity, regulatory approvals, and resource access. Competitive dynamics favor established firms with strong government backing and integrated operations, enabling them to maintain market share and profitability.
The regulatory environment is governed by the Ministry of Steel and the Ministry of Mines, with policies emphasizing sustainable mining practices, environmental compliance, and resource conservation. Recent reforms aim to enhance transparency in mineral auctions and promote private sector participation, impacting operational strategies. Continued regulatory oversight ensures adherence to environmental standards, influencing investment decisions and long-term sector outlook.
Note: Analysis synthesized from industry research, market reports, and regulatory filings. Information is subject to change based on market conditions.
Financial Ratios Dashboard
Illustrative Scenario Analysis
DCF Assumptions:
Method: Two-Stage EPS-Priority Model
Financials
Peer Analysis
| Company Name | Market Cap | P/E Ratio | P/B Ratio | EV/EBITDA | Price to CFO |
|---|---|---|---|---|---|
| Nmdc Limited | ₹734.64B | 9.87 | 2.15 | 7.38 | 14.70 |
| Vedanta Ltd. | ₹1.03T | 14.75 | 2.08 | 4.98 | 2.62 |
| Hindalco Industries Ltd. | ₹2.09T | 15.66 | 1.53 | 8.11 | 20.42 |
| Tata Steel Ltd. | ₹2.28T | 21.09 | 2.23 | 9.59 | 6.50 |
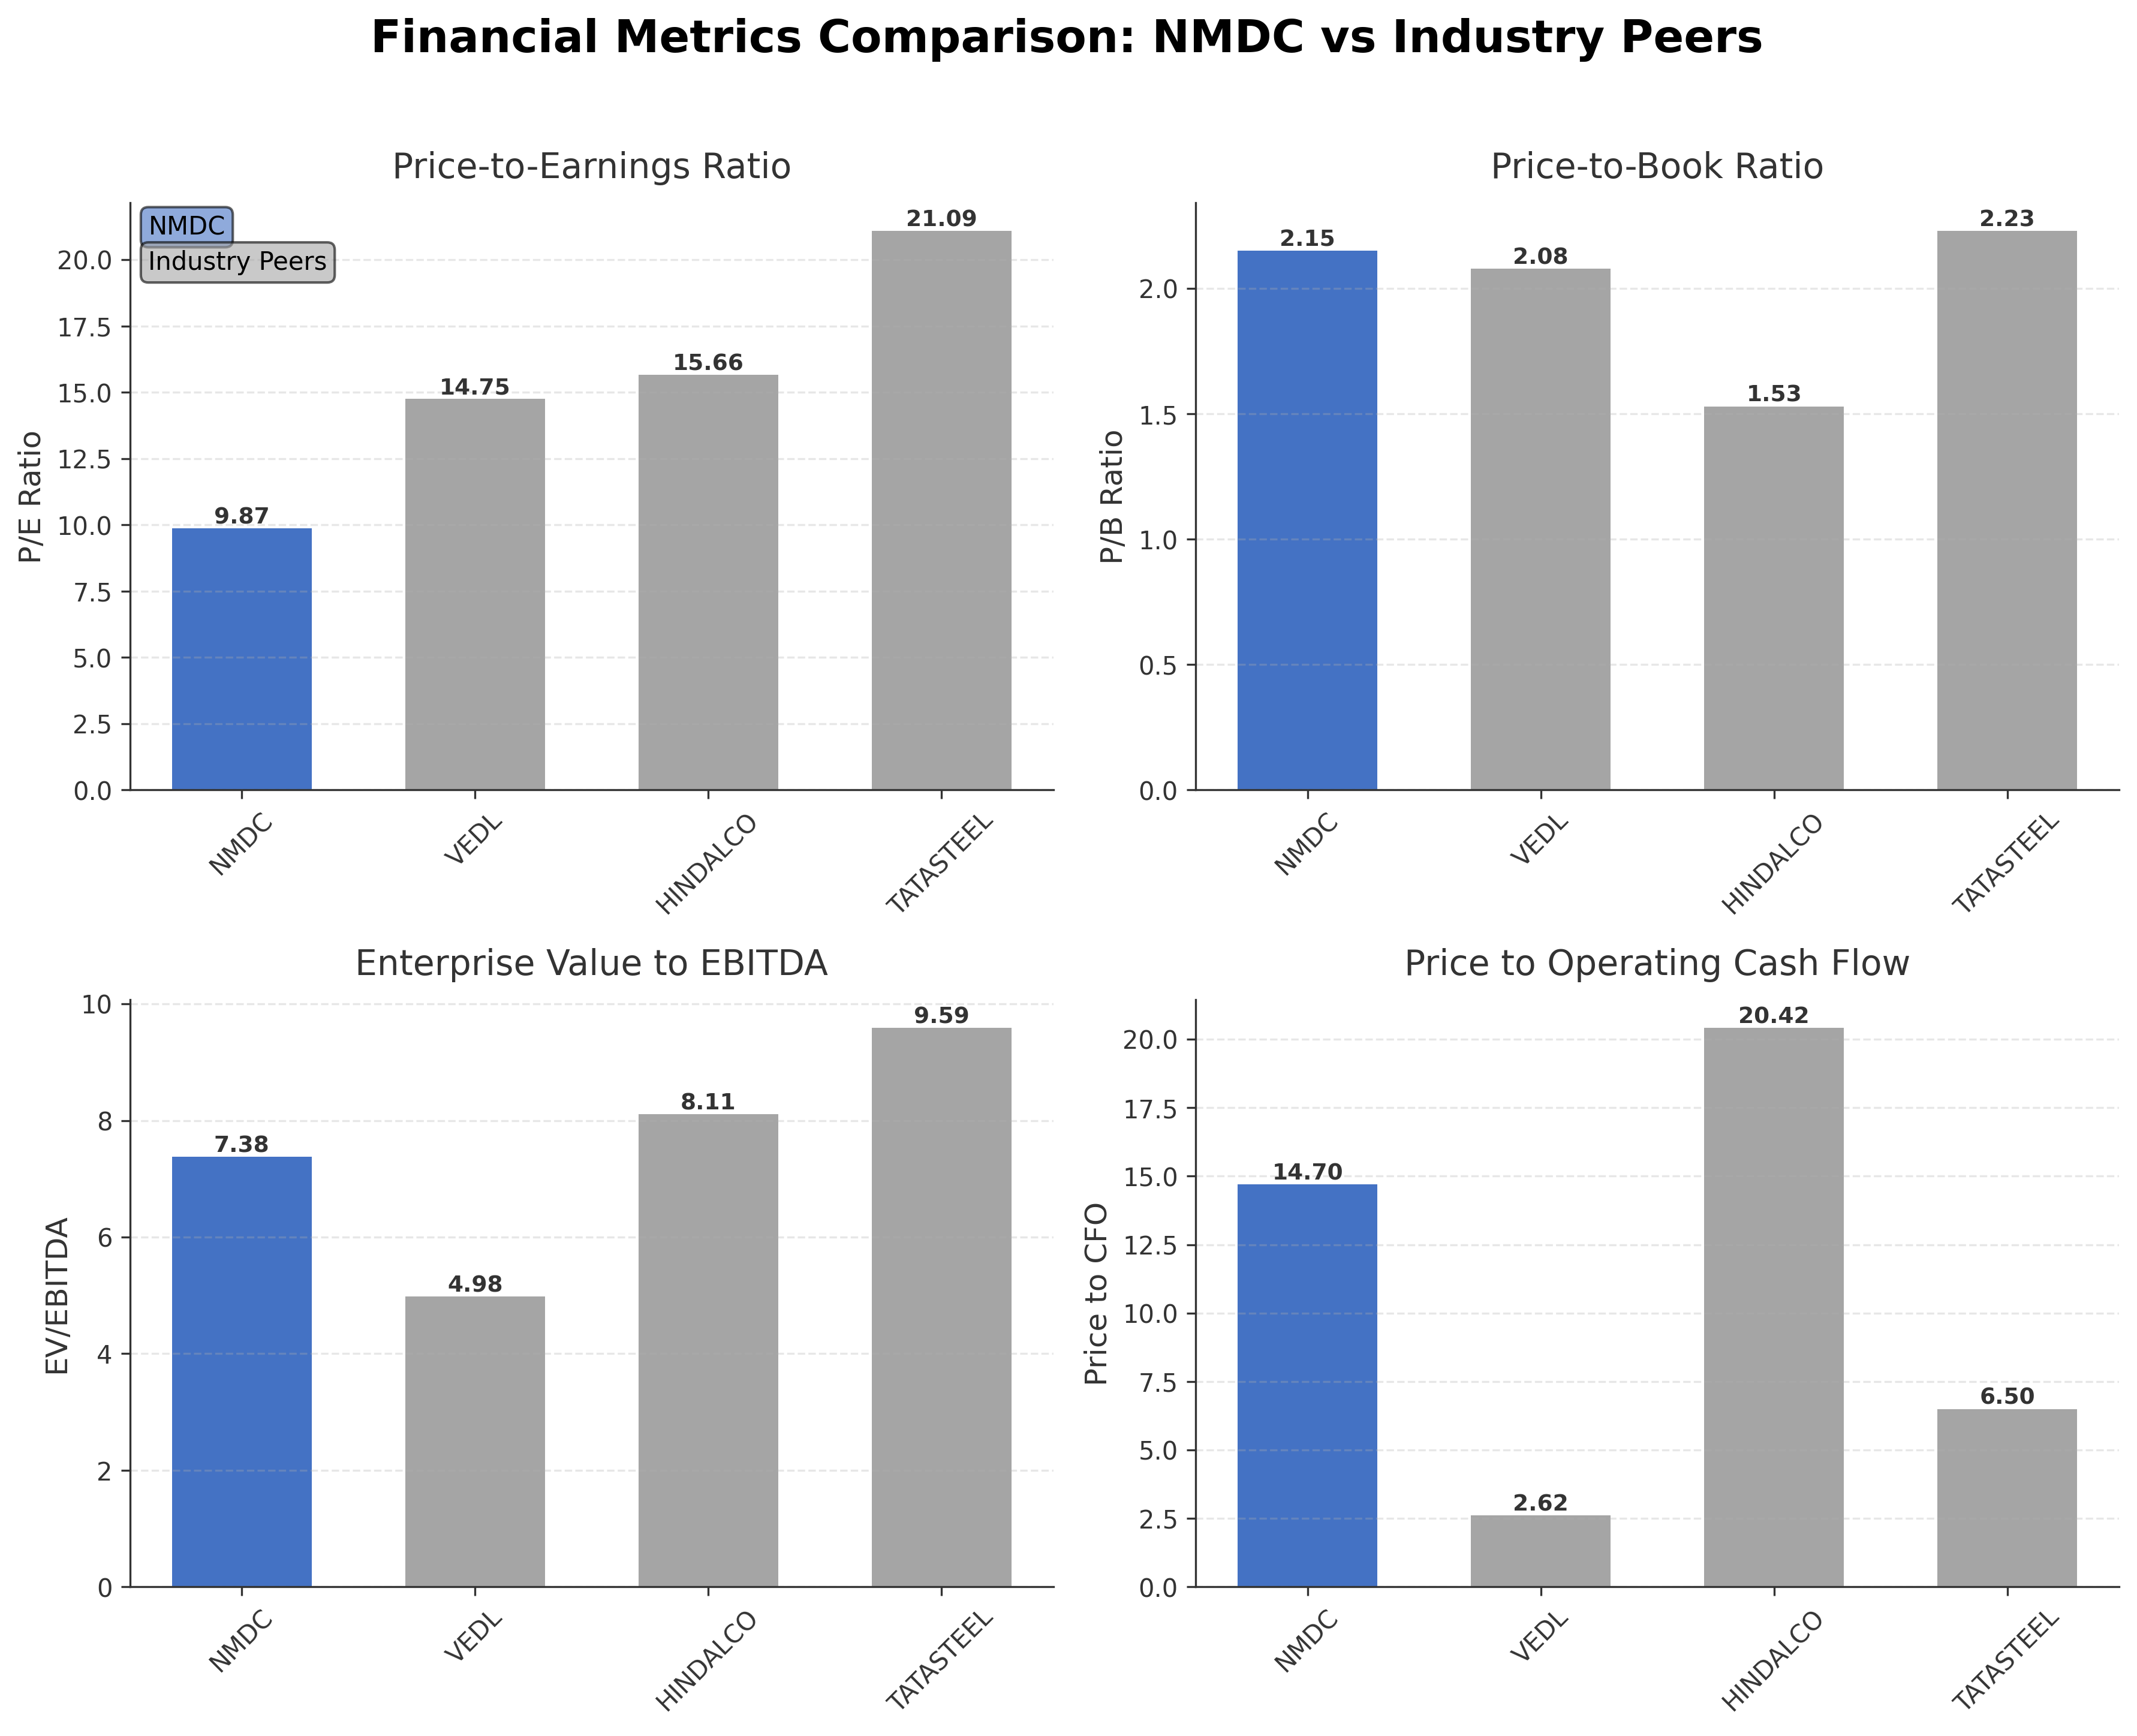
Comparison Analysis: Nmdc Limited exhibits a lower P/E ratio of 9.87 compared to its peers Vedanta (14.75), Hindalco (15.66), and Tata Steel (21.09), indicating relatively more attractive earnings valuation. Its P/B ratio of 2.15 is in line with the sector, slightly higher than Hindalco but comparable to Tata Steel and Vedanta. The EV/EBITDA multiple of 7.38 is moderate, higher than Vedanta's 4.98 but lower than Tata Steel's 9.59, reflecting balanced operational valuation. Nmdc's return on equity at 23.36% is notably higher than peers, demonstrating superior profitability. However, its price to CFO at 14.70 is elevated relative to Vedanta and Tata Steel, suggesting a premium on cash flow. Overall, Nmdc stands out for strong profitability and reasonable valuation within the Indian steel and mining sector.
Financial Metrics Comparison with Peers
Financial Statements
Comprehensive financial data including income, balance sheet, and cash flow metrics
Income Statement
| fiscal_date | 2026-03-31 | 2025-03-31 | 2024-03-31 | 2023-03-31 | 2022-03-31 |
|---|---|---|---|---|---|
| Sales | 320.71B | 239.06B | 213.01B | 176.61B | 259.65B |
| Cost Of Goods | 174.32B | 109.90B | 97.94B | 78.56B | 93.31B |
| Gross Profit | 146.38B | 129.16B | 115.07B | 98.05B | 166.34B |
| Operating Expense Selling General And Administrative | 7.39B | 5.39B | 3.47B | 2.60B | 2.08B |
| Operating Expense Other Operating Expenses | 27.00B | 24.33B | 22.26B | 19.50B | 24.58B |
| Operating Income | 87.82B | 77.28B | 69.41B | 57.21B | 123.40B |
| Non Operating Interest Expense | 1.21B | 1.78B | 782.40M | 752.30M | 390.60M |
| Pretax Income | 101.49B | 91.44B | 79.53B | 76.47B | 130.16B |
| Income Tax | 27.34B | 26.04B | 23.80B | 21.08B | 35.75B |
| Net Income | 74.50B | 65.31B | 55.71B | 56.03B | 94.28B |
| Eps Basic | 8.47 | 7.44 | 6.34 | 19.11 | 32.17 |
| Eps Diluted | 8.47 | 7.44 | 6.34 | 19.11 | 32.17 |
| Basic Shares Outstanding | 8.80B | 8.79B | 8.79B | 2.93B | 2.93B |
| Diluted Shares Outstanding | 8.80B | 8.79B | 8.79B | 2.93B | 2.93B |
| Ebit | 102.71B | 93.22B | 80.31B | 77.22B | 130.55B |
| Ebitda | 107.48B | 97.42B | 86.71B | 68.19B | 133.29B |
| Net Income Continuous Operations | 101.49B | 91.43B | 79.51B | 76.46B | 130.15B |
| Minority Interests | 2.30M | 109.50M | 41.90M | -11.00M | 5.50M |
| Preferred Stock Dividends | 0.00 | 0.00 | 0.00 | 0.00 | 0.00 |
| Non Operating Interest Income | N/A | 11.77B | 10.34B | 5.44B | 4.29B |
| Operating Expense Research And Development | N/A | N/A | N/A | 4.43B | 5.03B |
Data provided by Twelve Data
Balance Sheet
| fiscal_date | 2026-03-31 | 2025-03-31 | 2024-03-31 | 2023-03-31 | 2022-03-31 |
|---|---|---|---|---|---|
| Cash And Cash Equivalents | 1.48B | 848.20M | 1.09B | 930.00M | 1.21B |
| Accounts Receivable | 92.06B | 77.45B | 35.09B | 43.61B | 41.90B |
| Total Assets | 483.20B | 410.07B | 356.61B | 299.53B | 261.48B |
| Total Liabilities | 142.44B | 113.00B | 99.88B | 73.18B | 81.17B |
| Long Term Debt | 264.70M | 19.70M | 17.60M | 50.20M | 58.50M |
| Shareholders Equity | 340.76B | 297.07B | 256.73B | 226.35B | 180.32B |
Data provided by Twelve Data
Cash Flow Statement
| fiscal_date | 2026-03-31 | 2025-03-31 | 2024-03-31 | 2023-03-31 | 2022-03-31 |
|---|---|---|---|---|---|
| Operating Activities Net Income | 101.49B | 91.43B | 79.51B | 76.46B | 130.15B |
| Operating Activities Other Non Cash Items | -7.66B | -10.00B | -9.56B | -4.69B | -2.65B |
| Operating Activities Accounts Receivable | -31.76B | -47.07B | 8.30B | -22.22B | -17.89B |
| Operating Activities Other Assets Liabilities | 1.15B | 1.38B | 8.58B | -15.41B | -9.28B |
| Operating Activities Operating Cash Flow | 49.96B | 18.94B | 86.84B | 34.14B | 100.34B |
| Investing Activities Purchase Of Investments | -15.49B | -385.90M | -52.06B | N/A | -24.38B |
| Investing Activities Investing Cash Flow | -15.49B | 23.46B | -70.52B | -3.34B | -36.64B |
| Financing Activities Short Term Debt Issuance | 21.04B | 4.14B | 12.35B | -9.07B | 3.44B |
| Financing Activities Other Financing Charges | -30.77B | -24.61B | 662.40M | 152.80M | -43.68B |
| Financing Activities Financing Cash Flow | -9.74B | -45.07B | -12.19B | -19.91B | -83.43B |
| End Cash Position | 1.48B | 848.20M | 1.09B | 930.00M | 1.21B |
| Free Cash Flow | 18.25B | -13.36B | 55.48B | 5.90B | 57.43B |
| Investing Activities Sale Of Investments | N/A | 23.85B | 2.20M | 8.91B | N/A |
| Investing Activities Other Investing Activity | N/A | -100.00K | N/A | N/A | 100.00K |
| Financing Activities Common Dividends | N/A | -24.60B | -25.21B | -10.99B | -43.20B |
| Investing Activities Capital Expenditures | N/A | N/A | -18.47B | -12.47B | -11.98B |
| Investing Activities Net Acquisitions | N/A | N/A | N/A | 222.60M | -276.30M |
| Financing Activities Common Stock Repurchase | N/A | N/A | N/A | N/A | 0.00 |
Data provided by Twelve Data
Technical Analysis
Key Insights
- Nmdc Limited is currently exhibiting a stable upward trend with price action consolidating above key moving averages, indicating sustained buying interest.
- Key support levels are identified near ₹82.28 (200-day moving average) and ₹68.19 (52-week low), while resistance is observed around ₹87.63 (50-day moving average) and ₹97.49 (52-week high).
- The stock price is trading above both the 50-day and 200-day moving averages, suggesting medium to long-term bullish momentum.
- Momentum indicators show RSI in a neutral zone, MACD indicating a mild bullish crossover, and stochastic oscillators reflecting moderate upward momentum.
- Multi-timeframe analysis reveals consistent strength on daily and weekly charts, with monthly charts indicating a gradual upward trajectory.
- Current technical setup suggests potential for continued range-bound movement with gradual appreciation, contingent on volume and momentum confirmation.
Trending News
1. Headline: NMDC slashes iron ore prices for second month in a row - The Hindu
Summary: NMDC reduces iron ore prices for the second consecutive month, with Lump ore now at ₹5,250 per tonne.
Sentiment: positive
2. Headline: NMDC cuts iron ore prices; Lump Ore at Rs 5,250, Fines at Rs 4,500 | Asianet Newsable
Summary: The developments come as NMDC continues to expand its operations while also exploring opportunities in strategic minerals. (ANI)(Except for the headline, this story has not been edited by Asianetnews Editorial staff and is published from a syndicated feed.) ... Stay updated with all the latest Business News, including market trends, Share Market News, stock ...
Sentiment: neutral
3. Headline: NMDC Sets Iron Ore Prices Effective August 8 | Whalesbook Corporate News
Summary: NMDC Ltd fixes iron ore prices for Lump Ore at INR 5,250/ton and Fines at INR 4,500/ton from August 8, 2026. Prices exclude taxes and levies.
Sentiment: neutral
4. Headline: NMDC Sets New Iron Ore Prices at ₹5,250 for Lump, ₹4,500 for Fines | Whalesbook
Summary: NMDC sets new iron ore prices for Lump and Fines effective August 8, 2026. Check the latest pricing, production growth, and key investor monitorables.
Sentiment: neutral
5. Headline: Informist Media - Metal Stocks Outlook: Futher upside seen; Nifty Metal breaks out of range
Summary: ; The Nifty Metal index finally broke out of the range-bound movement of the last few weeks, with the index rising above 13000 points for the first ti
Sentiment: positive
Powered by Brave
Recent Updates
News Summary
As of August 8, 2026. NMDC Limited has reduced iron ore prices for the second consecutive month, setting the price of Lump ore at ₹5,250 per tonne, reflecting market demand adjustments. The company’s financial results and investor news remain current, with scheduled board meetings to consider unaudited quarterly results. Recent announcements include changes in management roles, such as the appointment of a new Director (Commercial) and a new Company Secretary and Compliance Officer, indicating ongoing corporate governance updates. Production and sales data for June 2026 have been disclosed, supporting transparency in operational performance. Overall, these developments highlight NMDC's active management of pricing strategies and corporate structure to maintain competitiveness and compliance.
News Sentiment
The overall sentiment from recent updates is neutral to mildly positive, driven by proactive price adjustments in iron ore reflecting responsiveness to market conditions. Leadership changes and regular financial disclosures contribute to a stable governance outlook. There is no indication of adverse events or significant operational disruptions, supporting a balanced view on near-term company developments.
Source List
- https://thehindu.com/business/Industry/nmdc-slashes-iron-ore-prices-for-second-month-in-a-row/article71321491.ece
- https://www.nmdc.co.in/investors/financial-details/financial-results
- https://www.nmdc.co.in/investors/investor-news
- https://nmdc-group.com/en/investor-relations/results-and-reporting/
- https://economictimes.indiatimes.com/nmdc-ltd/stocksupdate/companyid-11633.cms
Analytical Overview
Analysis Summary
Nmdc Limited’s valuation metrics, including a trailing P/E of 9.87 and forward P/E of 8.15, are below the industry average of approximately 15, indicating the stock is trading at a discount relative to peers. The company’s revenue growth rate of 61.9% quarter-over-quarter and positive earnings growth of 37.2% year-over-year reflect a strong growth trajectory supported by expanding operations. Financial health is robust with a low debt-to-equity ratio of 0.19 and a strong current ratio of 2.43, supported by a substantial cash reserve of ₹113.9 billion, although free cash flow is currently negative. Sector-specific challenges include commodity price volatility and regulatory risks in mining, while opportunities arise from infrastructure development and strategic mineral exploration. Considering India’s regulatory environment and economic outlook, Nmdc’s positioning benefits from government support for mining and infrastructure sectors.
Overall Business and Market Assessment
Supporting Factors: No data
Risk Factors: iron ore price fluctuations and the impact of recent price cuts on revenue
SWOT Analysis
Strengths
- Nmdc Limited has a leading position as one of India’s largest iron ore producers.
- The company maintains strong profitability with a net profit margin exceeding 23%.
- Robust balance sheet with a high current ratio of 2.43 and significant cash reserves.
- Consistent return on equity of 23.36% indicates efficient capital utilization.
Weaknesses
- Free cash flow is currently negative, reflecting potential liquidity constraints.
- Price cuts in iron ore may pressure near-term revenue and margins.
- Relatively high price to cash flow from operations ratio compared to peers.
- Dependence on commodity prices exposes earnings to market volatility.
Opportunities
- Expansion into strategic minerals beyond iron ore offers growth potential.
- Infrastructure development in India supports sustained demand for raw materials.
- Technological advancements can improve mining efficiency and reduce costs.
- Increasing institutional investor interest may enhance capital access.
Threats
- Regulatory changes in mining policies could impact operational flexibility.
- Competitive pressures from domestic and international mining companies.
- Global commodity price fluctuations may adversely affect profitability.
- Environmental and sustainability regulations may increase compliance costs.
Company Description
Nmdc Limited is a premier mining company in India, primarily engaged in the exploration and production of a variety of minerals. Its principal focus is on iron ore, which plays a critical role in steel manufacturing and serves as a foundation for numerous industries worldwide. As one of India's largest producers of iron ore, Nmdc Limited ensures a steady supply of this essential raw material to support the nation’s infrastructure development and industrial growth. Additional activities include the exploration of other minerals like copper, limestone, and rock phosphate. Established with the aim of enhancing India's mineral resource capabilities, Nmdc Limited has made significant contributions to the mining sector, leveraging cutting-edge technology and sustainable practices. Headquartered in Hyderabad, the company operates several mines across the country, notably in Chhattisgarh and Karnataka, regions rich in high-grade ore deposits. Its strong logistic network ensures efficient distribution to both domestic and international markets. In the financial market, Nmdc Limited is recognized for its robust production capacity and strategic investments in mining projects, both within and outside India, making it a key player in the global mining landscape.