


NLC India Ltd (NLCINDIA)
Stock Analysis Report
Stock Journey
Key Positives and Key Risks
Pros
- NLC India’s trailing P/E of 13.17 and forward P/E of 12.39 indicate reasonable valuation relative to earnings.
- The company’s return on equity of 15.97% reflects efficient use of shareholder capital.
- Strong operating cash flow of ₹51.7 billion supports operational stability despite negative free cash flow.
Cons
- Negative free cash flow of approximately ₹-51 billion suggests significant capital expenditure or working capital needs.
- Current ratio of 0.803 indicates potential short-term liquidity constraints.
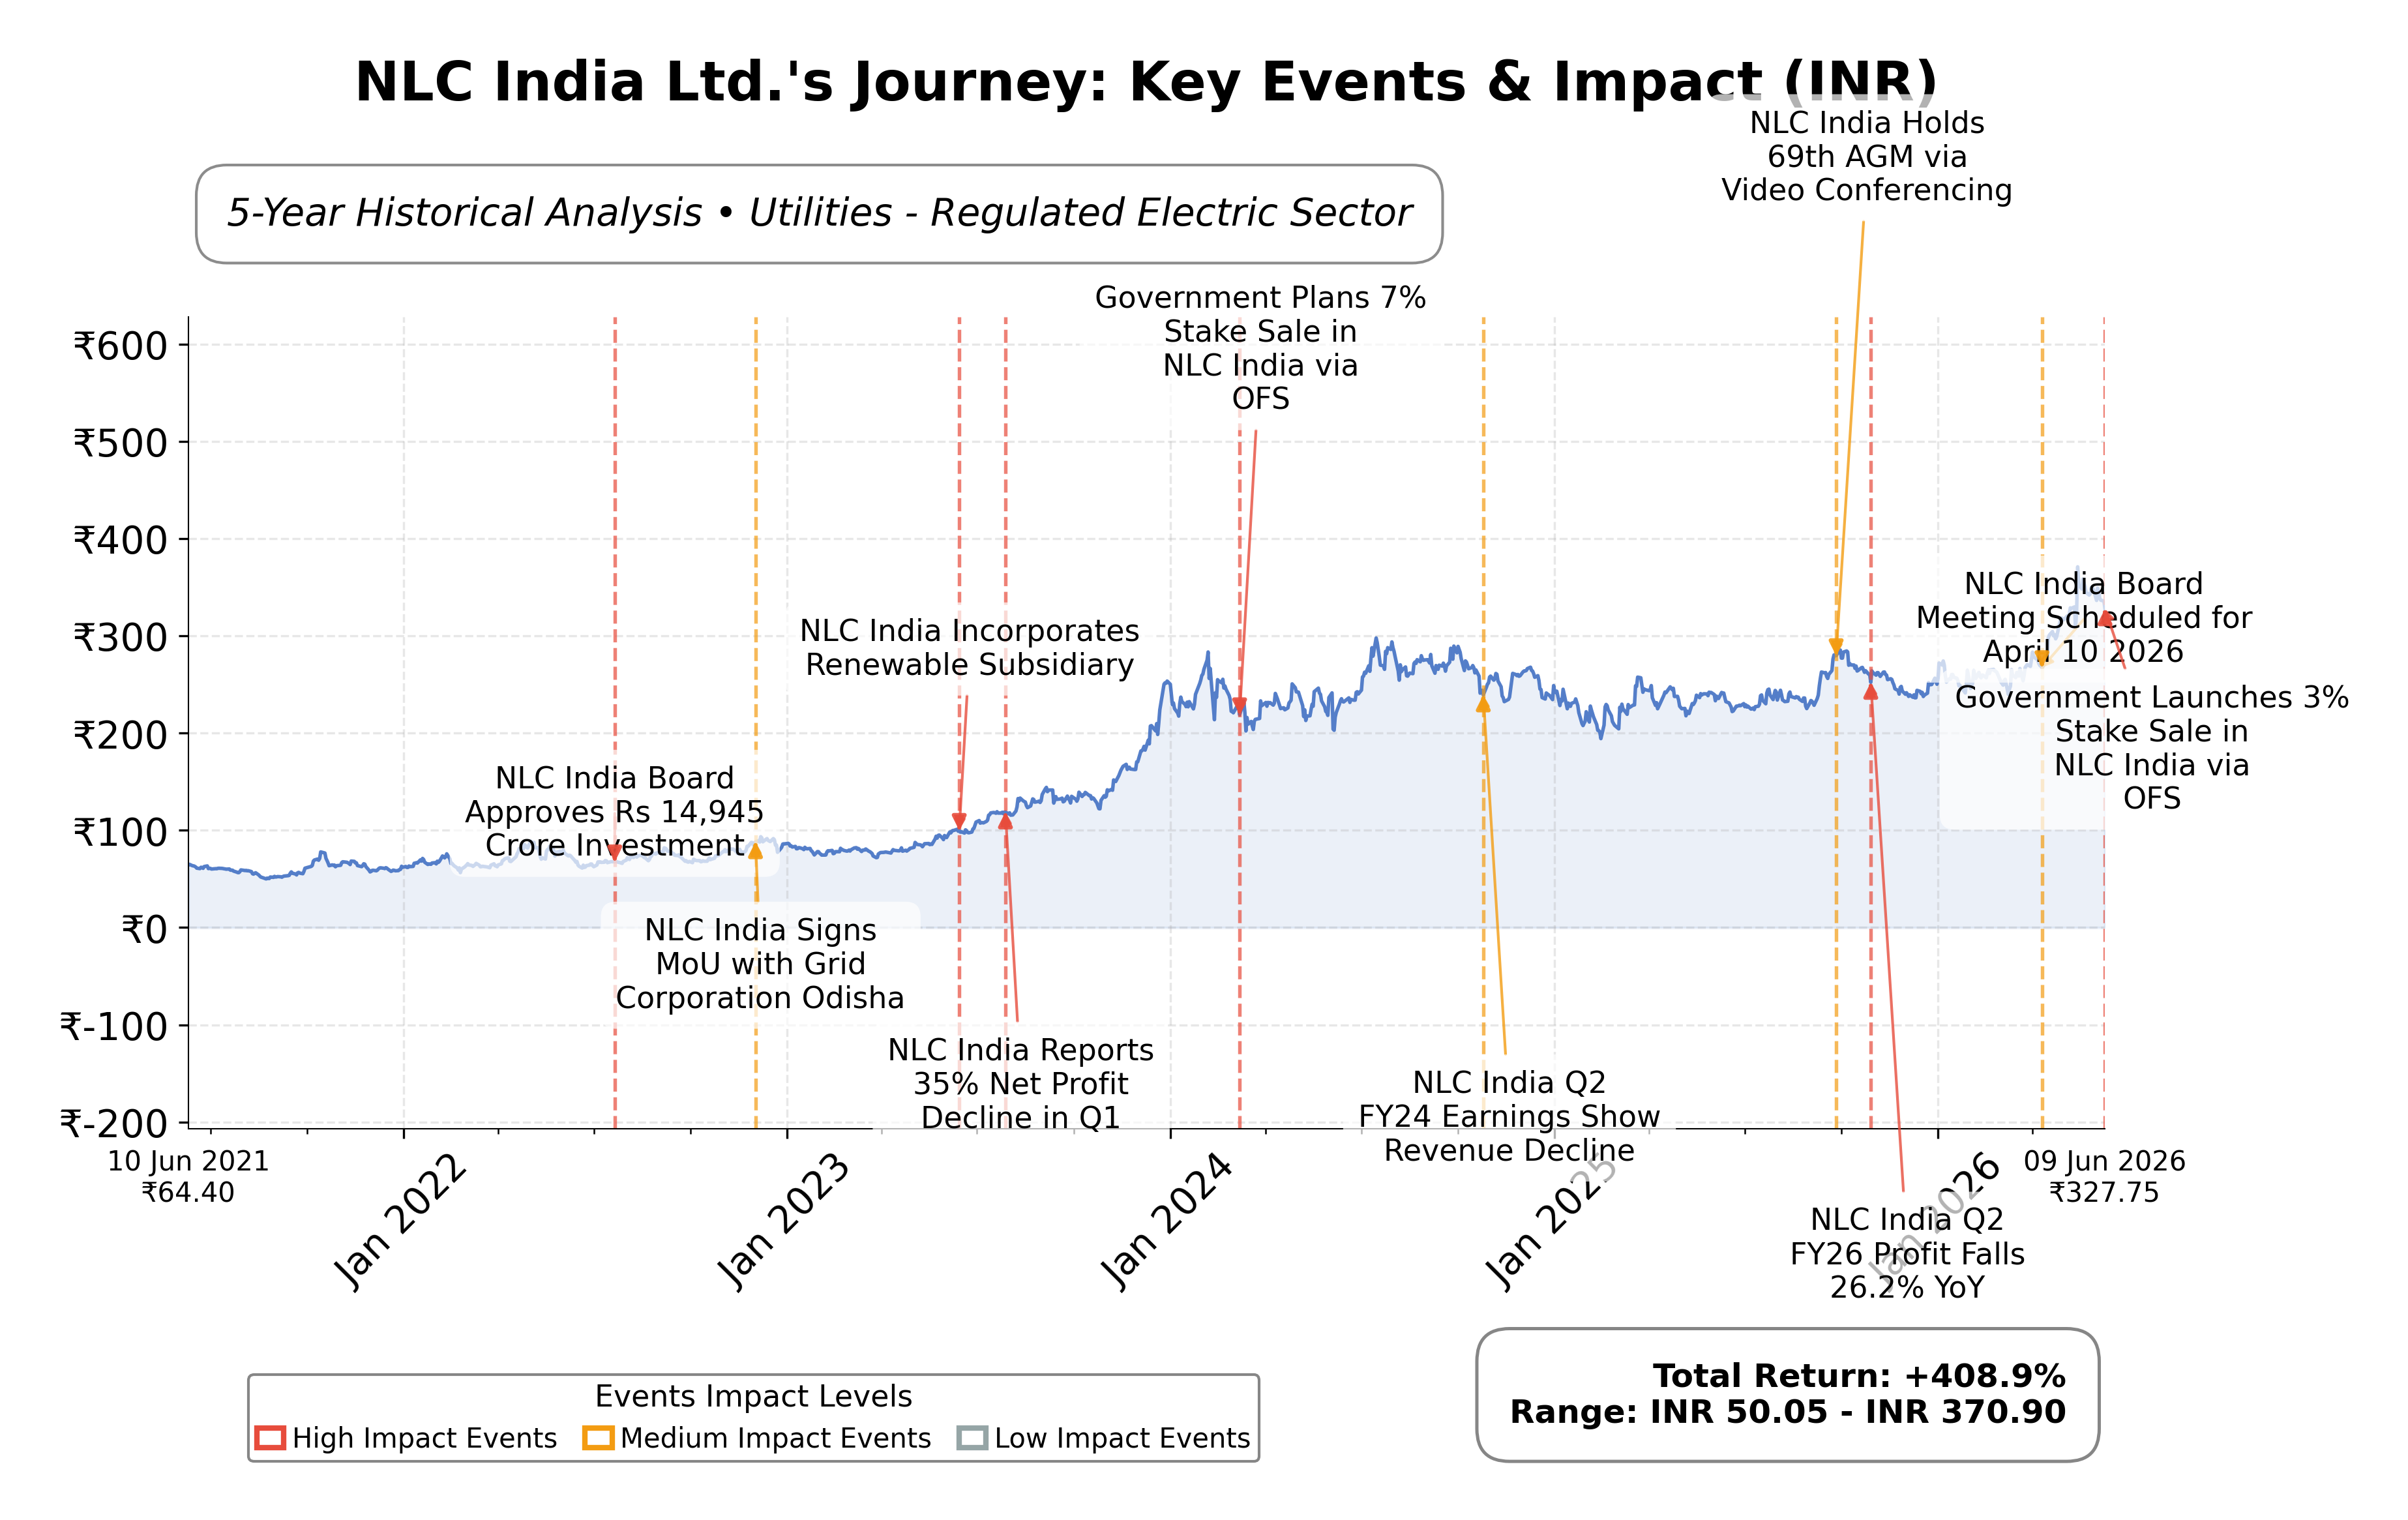
- Government’s ongoing stake sale via OFS programs may exert downward pressure on share price.
Disclosure: This information is for general awareness and does not constitute investment advice
Report Summary
NLC India Ltd. is a Navratna Public Sector Enterprise under the Ministry of Coal, operating primarily in the utilities sector on the NSE exchange. The company specializes in lignite mining and lignite-based thermal power generation, playing a critical role in India's energy infrastructure. It also pursues renewable energy initiatives and recently signed a memorandum of understanding with Nuclear Power Corporation of India Ltd. to expand into nuclear power projects, positioning itself as a diversified energy provider. NLC India holds a significant market position within the regulated electric utilities industry in India.
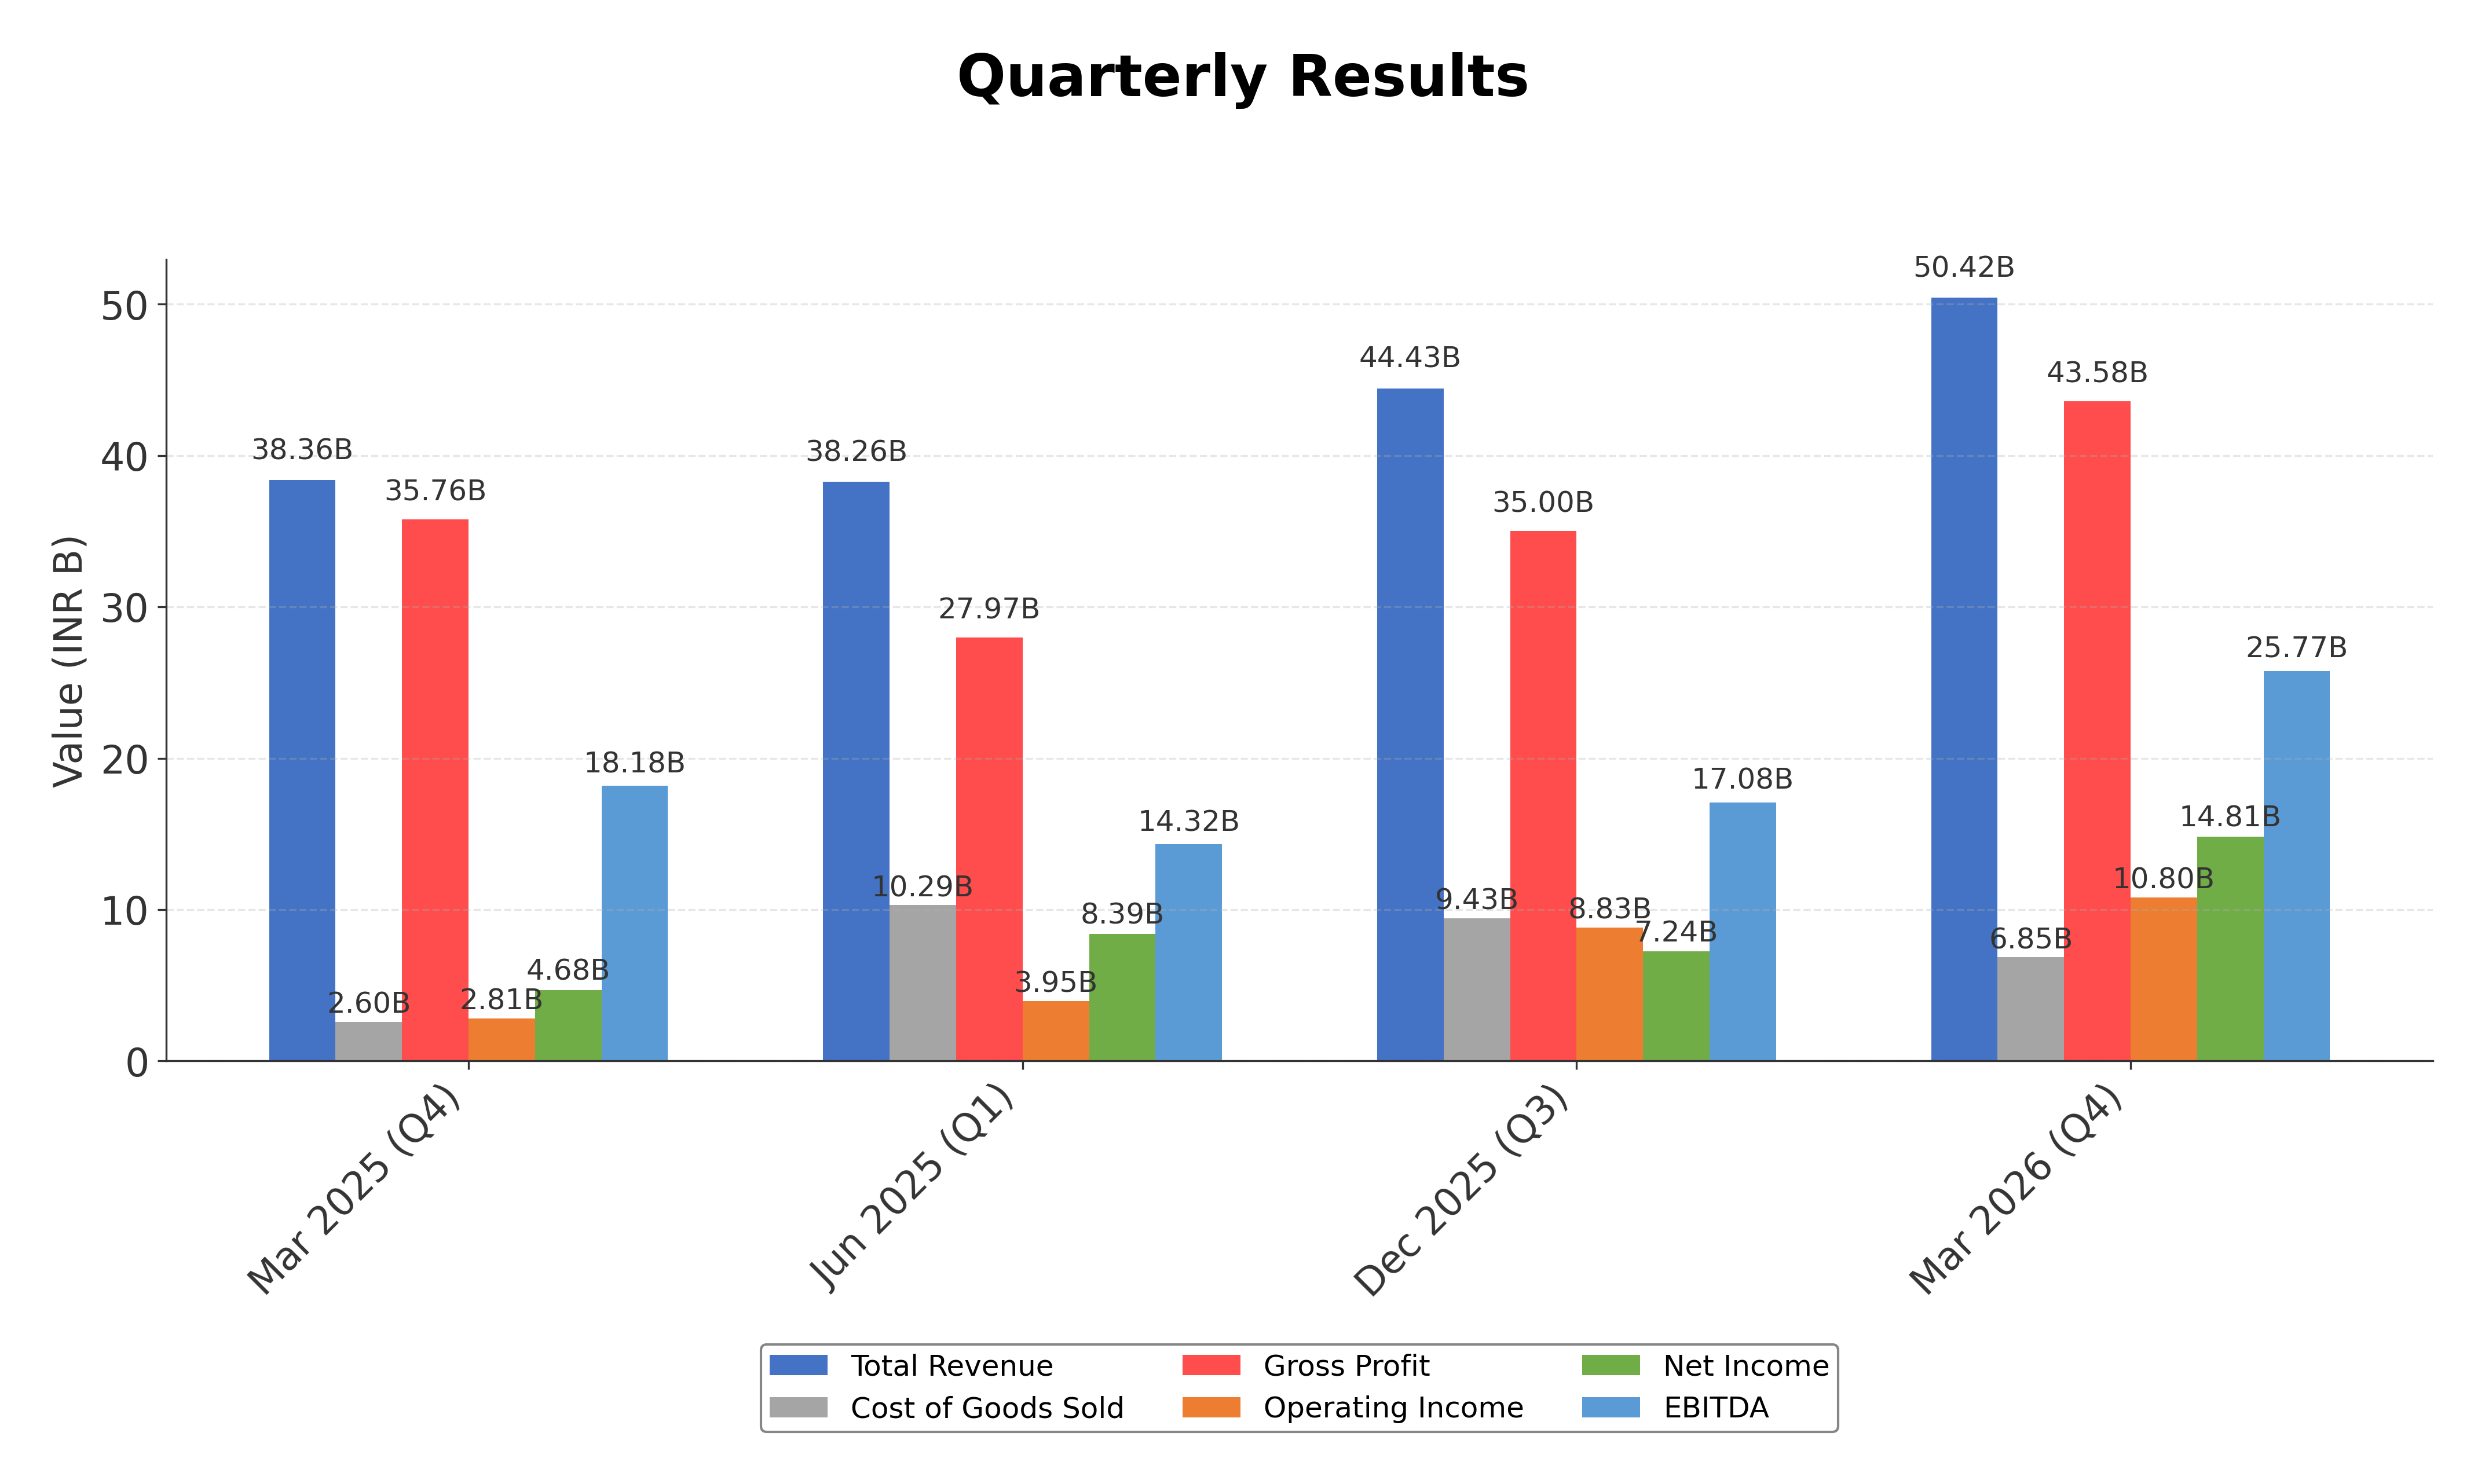
Financially, NLC India reported trailing twelve months (TTM) revenue of approximately ₹174.9 billion with a gross margin of 86.4%, operating margin of 28.3%, and net profit margin of 20.1%, indicating strong profitability. The company’s return on equity (ROE) stands at 15.97%, and return on assets (ROA) at 3.26%, reflecting efficient use of equity capital but moderate asset utilization. Operating cash flow for the TTM period was ₹51.7 billion, though free cash flow was negative at around ₹-51 billion, influenced by capital expenditures and working capital changes.
Valuation metrics show a trailing P/E ratio of 13.17 and a forward P/E of 12.39, with a price-to-book ratio of 2.16 and an EV/EBITDA of 10.51, suggesting the stock is reasonably valued relative to earnings and book value. The market capitalization is approximately ₹466.7 billion, with a 52-week price range from ₹220.71 to ₹387.80. The current price of ₹307.80 sits below the 52-week high, indicating some valuation discount relative to recent peaks.
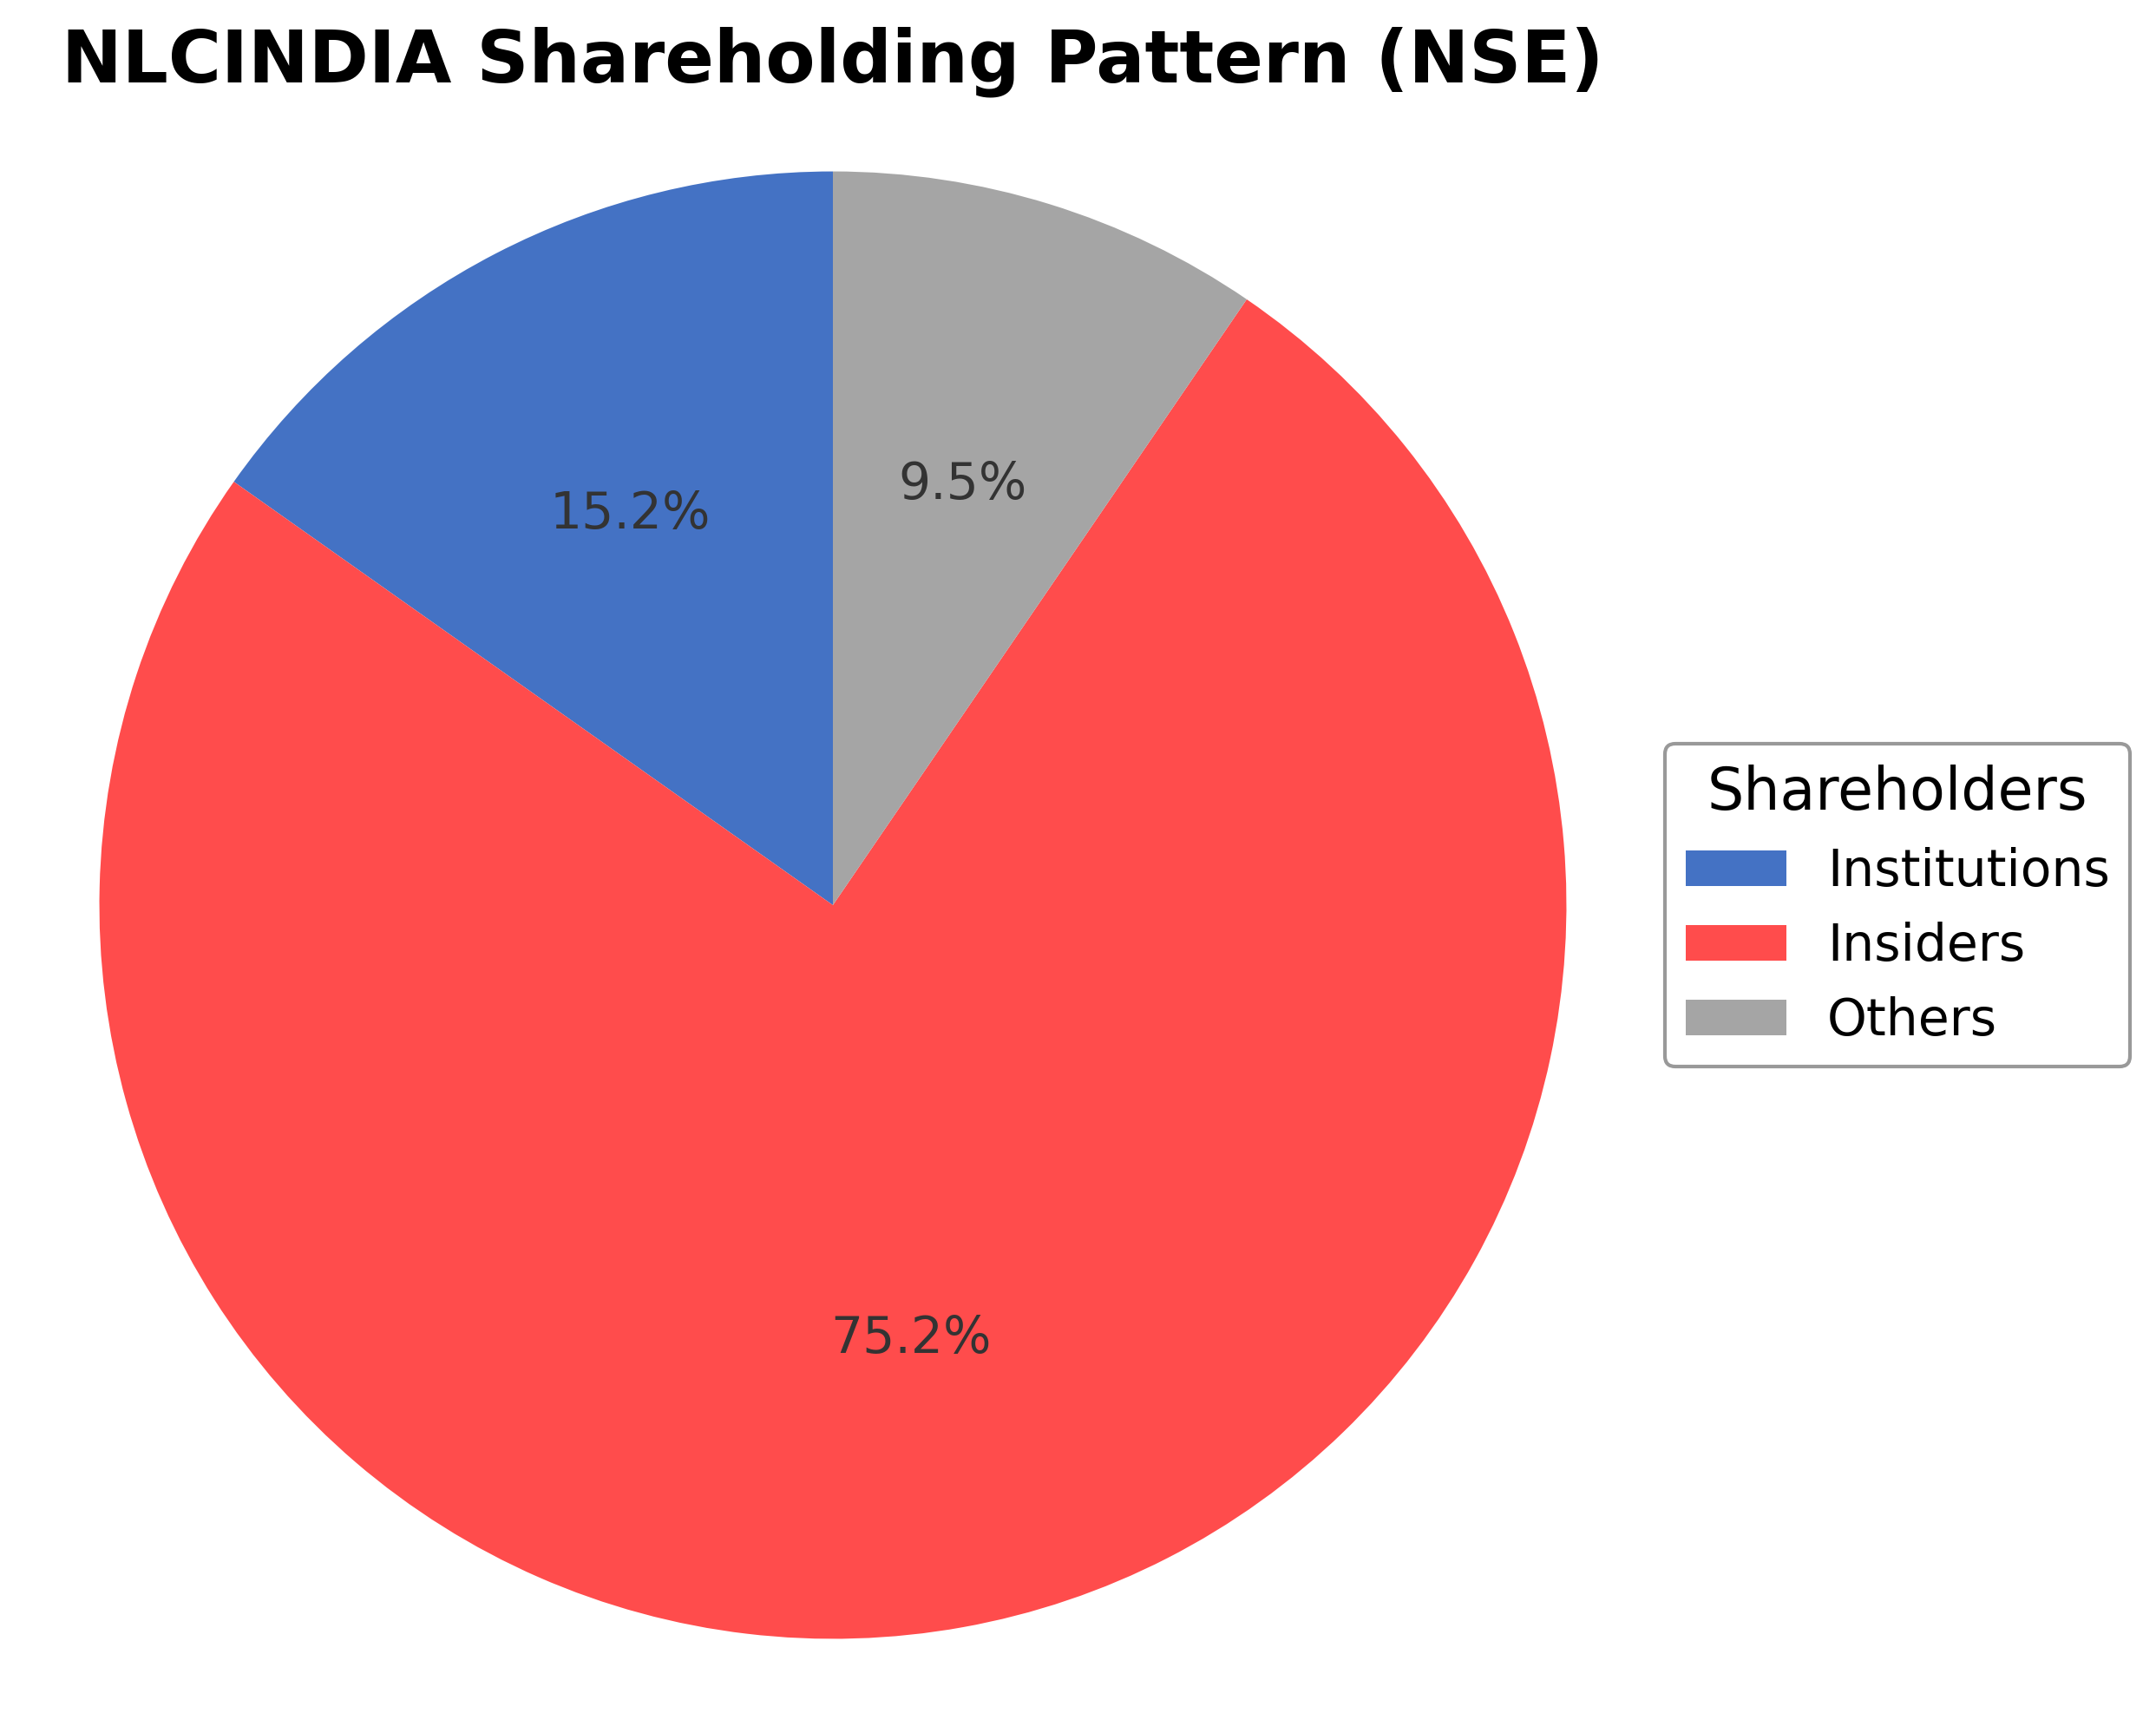
Key strengths include its strong market capitalization, leadership in lignite mining and power generation, and strategic moves into nuclear energy. The company maintains a manageable debt-to-equity ratio of 0.82 and offers a semi-annual dividend with a forward yield of 2.14%. Risks include regulatory changes, competitive pressures in the energy sector, and the impact of government stake sales via Offer for Sale (OFS) programs, which recently saw strong investor interest but also led to share price volatility. The government currently holds 72.2% ownership, with institutional investors holding about 15.2%.
Technically, the stock trades above its 200-day moving average but below its 50-day average, with a beta of 0.485 indicating lower volatility relative to the market. Recent news highlights active government divestment through OFS, strong non-retail subscription, and retail participation opening, reflecting mixed market sentiment. Overall, the data suggests a balanced environment where market participants may be weighing valuation, growth prospects, and strategic developments carefully.
Company and Industry Overview
Company Basics
Price Performance
Company Size
Shareholding Pattern
Sector and Industry Analysis
The Indian power sector is a critical component of the country's infrastructure, with a market size driven by growing electricity demand from industrial, commercial, and residential consumers. The sector is characterized by a mix of coal, renewable, hydro, and nuclear power generation, with coal-based thermal power still dominating the energy mix. Key players include state-owned utilities, private power producers, and integrated companies like NTPC, Tata Power, and NLC India Ltd, which combine fuel supply and power generation.
Within the power generation industry, there is a notable shift towards diversification and cleaner energy sources, driven by environmental concerns and government initiatives. Companies that integrate fuel mining and power generation, such as NLC India Ltd, benefit from tighter control over fuel supply, reducing operational risks. However, barriers to entry remain high due to capital intensity, regulatory approvals, and the need for long-term fuel and power purchase agreements. Competitive dynamics are evolving as renewable energy capacity expands, increasing pressure on traditional coal-based producers to innovate and adapt.
The regulatory environment in India’s power sector is shaped by policies promoting renewable energy adoption, energy efficiency, and grid modernization. The government has implemented measures such as renewable purchase obligations and incentives for solar and wind projects, impacting industry players’ strategic focus. Environmental regulations on emissions and mining practices also influence operational costs and project feasibility. Overall, regulatory frameworks aim to balance energy security, affordability, and sustainability, shaping the sector’s long-term outlook.
Note: Analysis synthesized from industry research, market reports, and regulatory filings. Information is subject to change based on market conditions.
Financial Ratios Dashboard
Illustrative Scenario Analysis
DCF Assumptions:
Method: Two-Stage EPS-Priority Model
Financials
Peer Analysis
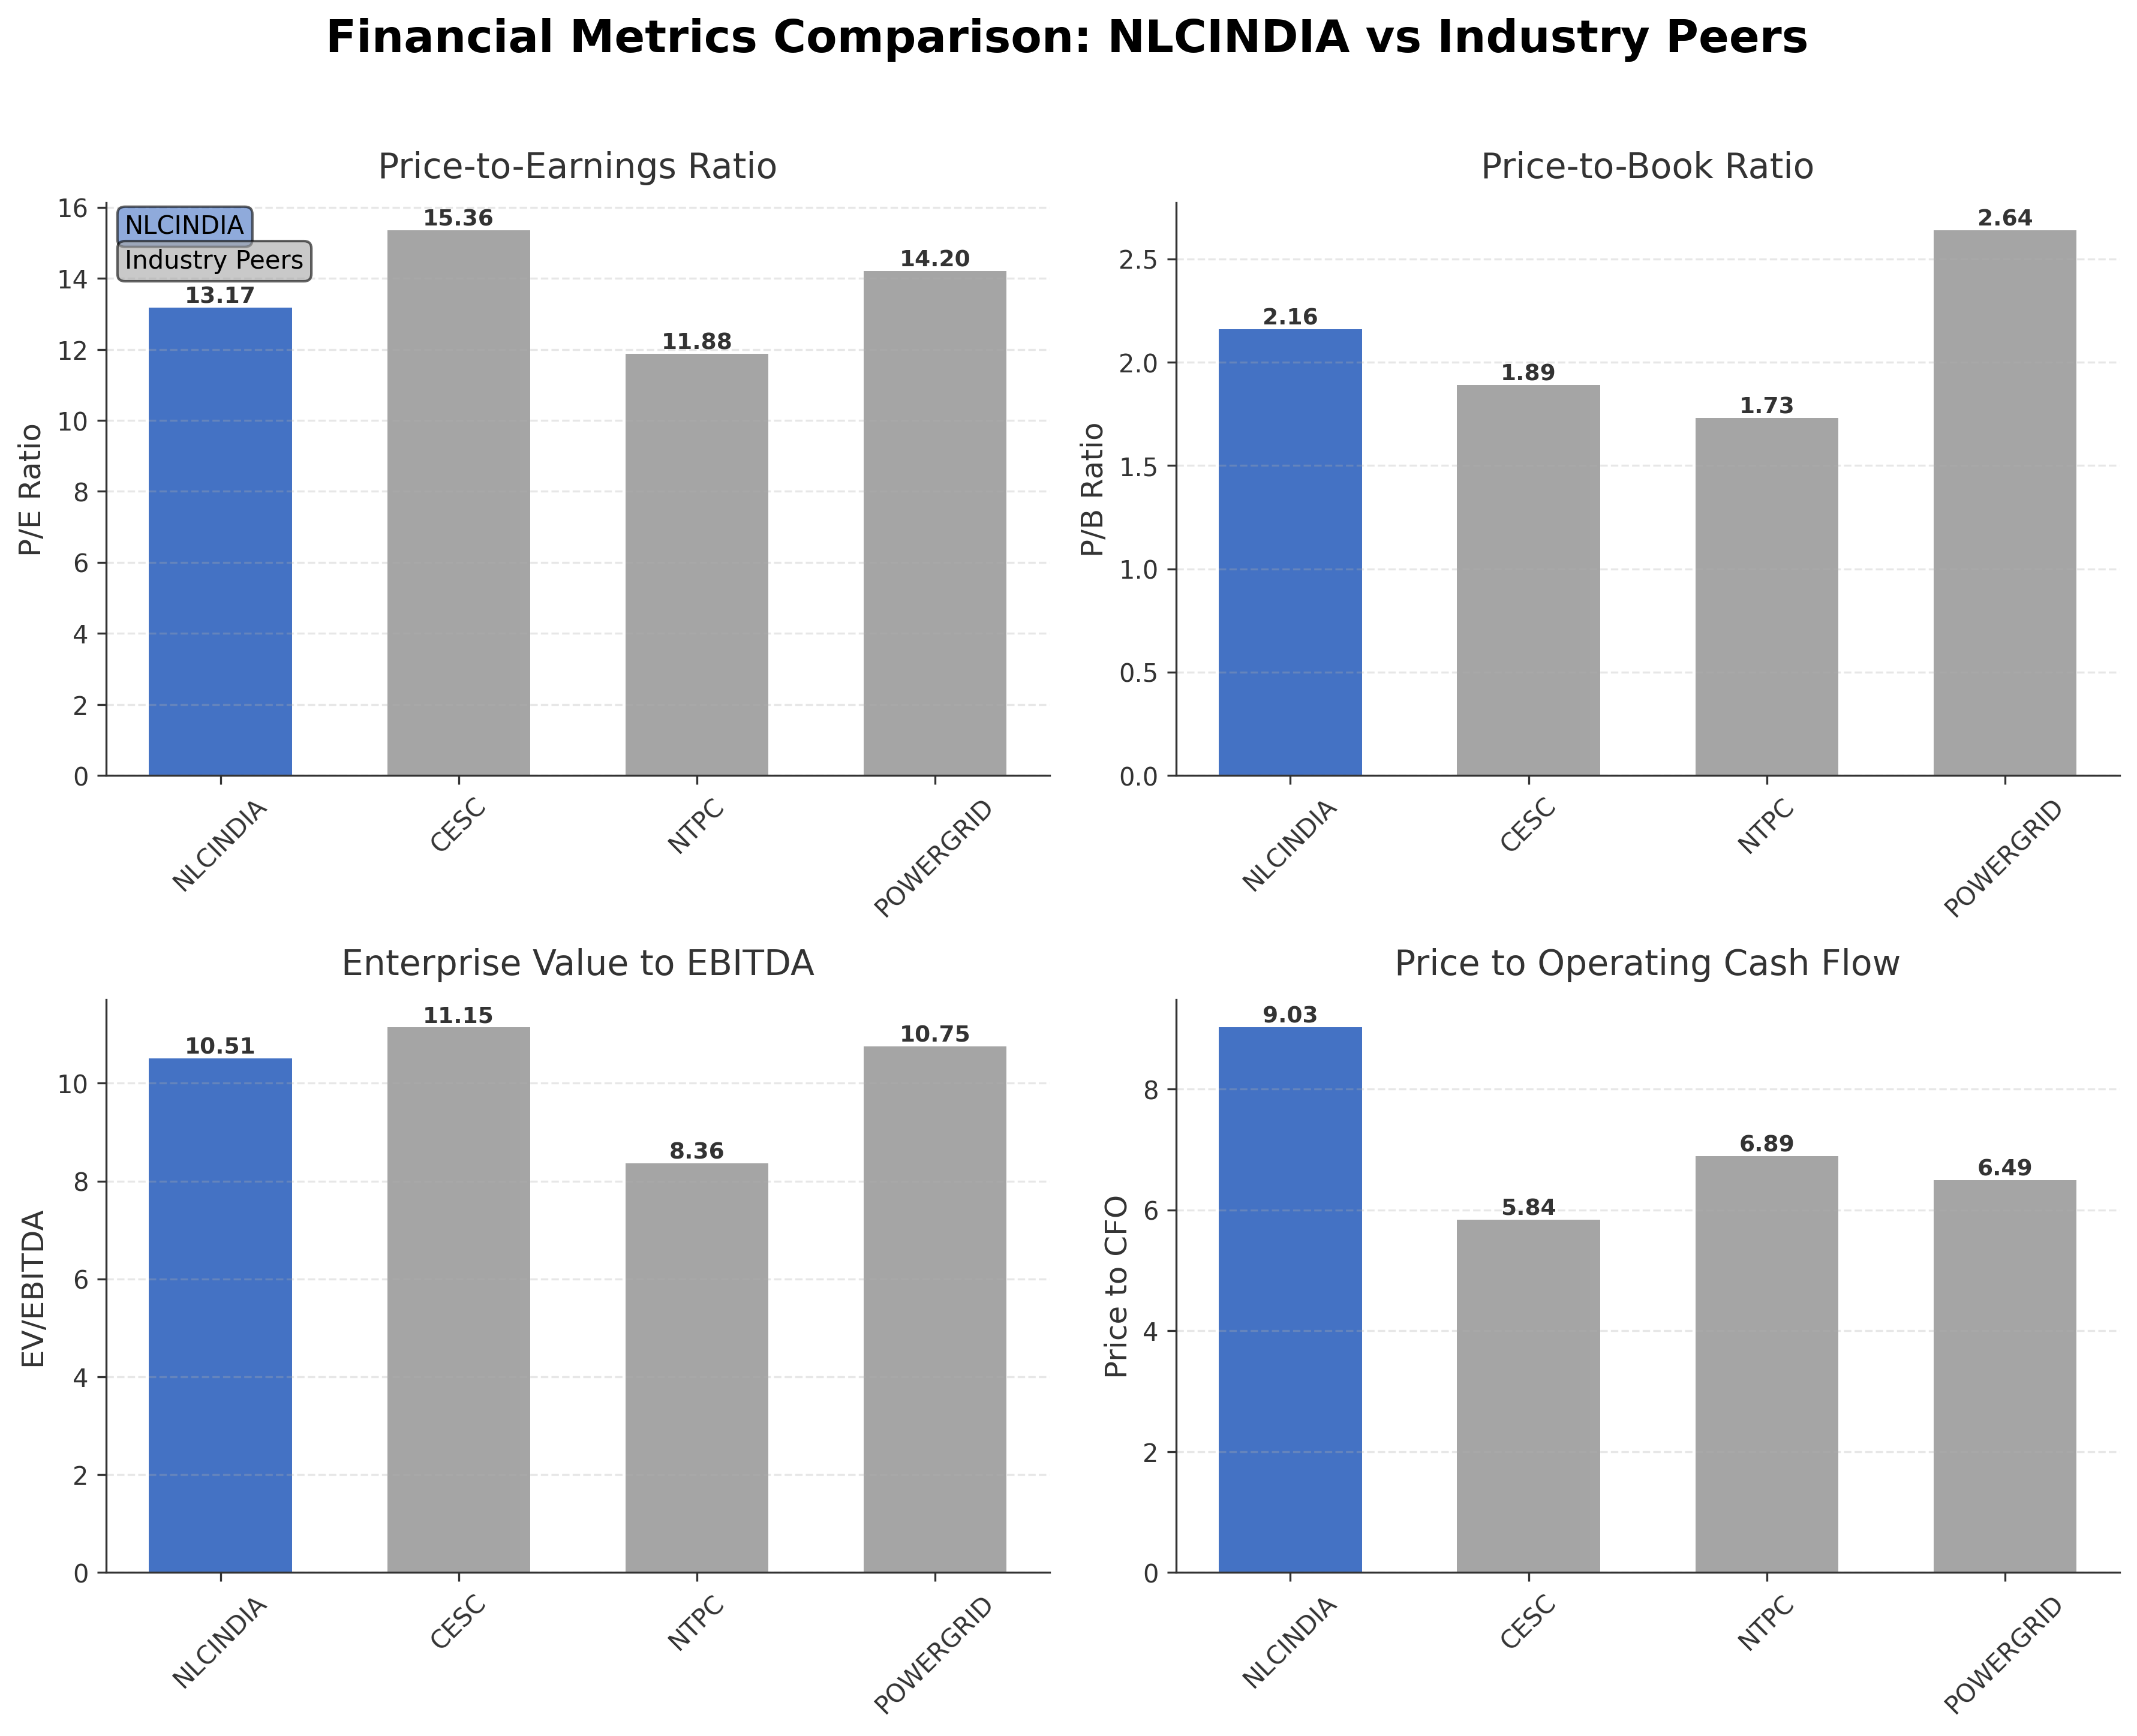
| Company Name | Market Cap | P/E Ratio | P/B Ratio | EV/EBITDA | Price to CFO |
|---|---|---|---|---|---|
| NLC India Ltd. | ₹466.74B | 13.17 | 2.16 | 10.51 | 9.03 |
| CESC Ltd. | ₹236.76B | 15.36 | 1.89 | 11.15 | 5.84 |
| Ntpc Ltd. | ₹3.51T | 11.88 | 1.73 | 8.36 | 6.89 |
| Power Grid Corporation of India Ltd. | ₹2.66T | 14.2 | 2.64 | 10.75 | 6.49 |
Comparison Analysis: NLC India Ltd. exhibits a moderate valuation with a trailing P/E of 13.17, slightly higher than NTPC's 11.88 but below CESC's 15.36 and Power Grid's 14.20. Its price-to-book ratio of 2.16 is higher than NTPC and CESC, indicating a relatively richer book valuation, while EV/EBITDA at 10.51 is comparable to peers. The company’s return on equity of 15.97% is competitive, exceeding CESC and NTPC but slightly below Power Grid. NLC India’s price to cash flow ratio of 9.03 is notably higher than peers, suggesting a premium on operating cash flow. Overall, NLC India holds a solid position within its peer group with balanced profitability and valuation metrics.
Financial Metrics Comparison with Peers
Financial Statements
Comprehensive financial data including income, balance sheet, and cash flow metrics
Income Statement
| fiscal_date | 2026-03-31 | 2025-03-31 | 2024-03-31 | 2023-03-31 | 2022-03-31 |
|---|---|---|---|---|---|
| Sales | 174.90B | 152.83B | 129.99B | 161.65B | 119.45B |
| Cost Of Goods | 33.69B | 20.85B | 46.45B | 53.09B | 38.79B |
| Gross Profit | 141.21B | 131.98B | 83.54B | 108.56B | 80.67B |
| Operating Expense Other Operating Expenses | 59.84B | 52.81B | 24.57B | 7.67B | 8.42B |
| Operating Income | 32.10B | 29.56B | 18.52B | 58.43B | 28.15B |
| Non Operating Interest Expense | 12.22B | 9.32B | 7.78B | 8.35B | 8.49B |
| Pretax Income | 38.75B | 36.97B | 28.82B | 20.56B | 26.03B |
| Income Tax | 1.06B | 9.84B | 10.14B | 6.31B | 14.88B |
| Net Income | 37.69B | 27.14B | 18.68B | 14.26B | 11.16B |
| Ebit | 50.97B | 46.29B | 36.60B | 28.91B | 34.52B |
| Ebitda | 74.75B | 65.13B | 55.17B | 58.95B | 50.13B |
| Net Income Continuous Operations | 38.75B | 36.97B | 28.82B | 20.56B | 26.03B |
| Minority Interests | -2.47B | -922.50M | -134.80M | -304.20M | -230.80M |
| Preferred Stock Dividends | 0.00 | 0.00 | 0.00 | 0.00 | 0.00 |
| Operating Expense Selling General And Administrative | N/A | 1.64B | 1.18B | 1.34B | 1.88B |
| Non Operating Interest Income | N/A | 8.55B | 5.82B | 4.86B | 1.17B |
| Eps Basic | N/A | 18.90 | 13.47 | 10.28 | 7.88 |
| Eps Diluted | N/A | 18.90 | 13.47 | 10.28 | 7.88 |
| Basic Shares Outstanding | N/A | 1.39B | 1.39B | 1.39B | 1.39B |
| Diluted Shares Outstanding | N/A | 1.39B | 1.39B | 1.39B | 1.39B |
Data provided by Twelve Data
Balance Sheet
| fiscal_date | 2026-03-31 | 2025-03-31 | 2024-03-31 | 2023-03-31 | 2022-03-31 |
|---|---|---|---|---|---|
| Cash And Cash Equivalents | 7.11B | 1.87B | 5.65B | 774.80M | 1.39B |
| Accounts Receivable | 33.38B | 31.41B | 37.72B | 42.64B | 37.10B |
| Total Assets | 652.02B | 578.51B | 549.42B | 530.68B | 497.85B |
| Total Liabilities | 399.28B | 359.07B | 355.76B | 354.42B | 334.11B |
| Long Term Debt | 231.18B | 185.25B | 192.59B | 185.23B | 188.73B |
| Shareholders Equity | 252.74B | 219.45B | 193.66B | 176.26B | 163.74B |
Data provided by Twelve Data
Cash Flow Statement
| fiscal_date | 2026-03-31 | 2025-03-31 | 2024-03-31 | 2023-03-31 | 2022-03-31 |
|---|---|---|---|---|---|
| Operating Activities Net Income | 38.75B | 36.97B | 28.82B | 20.56B | 26.03B |
| Operating Activities Other Non Cash Items | 14.39B | 17.07B | 12.39B | 4.08B | 10.99B |
| Operating Activities Accounts Receivable | 8.51B | 9.36B | 3.35B | -8.43B | 37.85B |
| Operating Activities Other Assets Liabilities | -12.96B | 12.20B | 3.88B | -9.47B | -1.61B |
| Operating Activities Operating Cash Flow | 48.69B | 75.59B | 48.44B | 6.73B | 73.27B |
| Investing Activities Capital Expenditures | -76.40B | -72.69B | -32.48B | -25.53B | -9.14B |
| Investing Activities Investing Cash Flow | -76.40B | -72.69B | -31.40B | -24.48B | -9.06B |
| Financing Activities Short Term Debt Issuance | 8.69B | 7.47B | -6.54B | 5.94B | -50.83B |
| Financing Activities Common Stock Issuance | 3.09B | 3.19B | 3.78B | 2.53B | 3.06B |
| Financing Activities Common Dividends | -7.36B | -4.40B | -4.98B | -4.28B | -4.57B |
| Financing Activities Financing Cash Flow | 4.42B | 6.26B | -7.74B | 4.19B | -52.34B |
| End Cash Position | 7.11B | 1.87B | 5.65B | 774.80M | 1.39B |
| Free Cash Flow | -27.79B | 16.37B | 23.64B | 15.68B | 68.29B |
| Investing Activities Other Investing Activity | N/A | N/A | 1.08B | 1.05B | N/A |
| Investing Activities Sale Of Investments | N/A | N/A | N/A | 0.00 | 74.90M |
| Financing Activities Other Financing Charges | N/A | N/A | N/A | -100.00K | 100.00K |
| Investing Activities Purchase Of Investments | N/A | N/A | N/A | N/A | 0.00 |
Data provided by Twelve Data
Technical Analysis
Key Insights
- NLC India is currently in a consolidation phase with price trading between key support near ₹280 and resistance around ₹320, showing sideways price action after recent volatility.
- The stock finds support at the 200-day moving average near ₹270 and faces resistance at the 50-day moving average around ₹312, which it is currently testing.
- The price is above the 200-day moving average indicating a long-term uptrend, but below the 50-day moving average, suggesting short-term weakness.
- Momentum indicators show RSI near 45, indicating neutral momentum; MACD is slightly bearish with the signal line above MACD line; Stochastic oscillator is in mid-range.
- On weekly and monthly timeframes, the stock maintains an overall upward trend but with reduced momentum, reflecting a pause in recent gains.
- Potential scenarios include a breakout above the 50-day MA leading to renewed upward momentum or a breakdown below support triggering further consolidation.
Trending News
1. Headline: NLC India OFS opens for retail today after strong non-retail response - All you need to know - CNBC TV18
Summary: As part of the issue structure, 10% of the offer shares, or about 41.6 lakh shares, have been reserved for retail investors of NLC India. Retail investors can bid for shares worth up to ₹2 lakh across stock exchanges.
Sentiment: positive
2. Headline: NLC India shares in focus as OFS sees strong response; retail bidding opens today - BusinessToday
Summary: NLC India received non-retail bids of 13,03,39,482 shares against the quota size of 2,49,59,458 shares at an indicative price of Rs 319.06 per share. This was much higher than the floor size of Rs 303 per share.
Sentiment: positive
3. Headline: Stocks To Watch Today: Bharti Airtel, NLC India, NTPC Green, Afocns Infra & More
Summary: Here's a look at stocks that are likely to be in focus during the trading session on Wednesday.
Sentiment: neutral
4. Headline: NLC India Shares Slide 2.31% as Govt OFS Opens at ₹303 Floor Price - HDFCSky
Summary: Mumbai, June 9: Shares of NLC (Neyveli Lignite Corporation) India Ltd (NLCINDIA) came under sharp selling pressure on Tuesday, falling 2.31% to an LTP of ₹328.00 against a previous close of ₹335.75. The stock opened at ₹327.20, mirroring the cautious sentiment that gripped the counter ...
Sentiment: negative
5. Headline: NLC India Share Price Cracks Over 4% After Govt Announces Stake Sale Via OFS
Summary: The government currently holds 72.20 per cent in NLC India. So far in the current fiscal, the government has mopped up Rs 12,166 crore by selling minority stakes in PSUs. This include Rs 5,542 crore from Coal India, Rs 4,357 crore from NHPC and Rs 2.266 crore from Central Bank of India. Essential Business Intelligence, Continuous LIVE TV, Sharp Market Insights, Practical Personal Finance Advice and Latest Stories — On NDTV Profit. ... Stock Market Crash News ...
Sentiment: positive
Powered by Brave
Recent Updates
News Summary
As of June 10, 2026. The government of India has exercised the full greenshoe option in the Offer for Sale (OFS) of NLC India Ltd., increasing the total stake offered to 3% of the company's equity capital from the initially planned 2%. The non-retail portion was oversubscribed by over five times, with bids totaling more than 13 crore shares against a quota of approximately 2.5 crore shares at an indicative price of ₹319.06 per share, above the floor price of ₹303. Retail investors were allowed to participate with a 10% reservation of the offer shares, and eligible employees could apply for shares with a discount. Concurrently, NLC India signed a memorandum of understanding with Nuclear Power Corporation of India Ltd. to establish a joint venture for nuclear power projects, marking a strategic diversification into nuclear energy. The government currently holds a 72.2% stake in NLC India, which will reduce by up to 3 percentage points following the OFS completion.
News Sentiment
The overall sentiment from recent updates is mixed to neutral with positive undertones. Strong oversubscription of the OFS and active retail participation reflect investor confidence and demand for the stock. However, the government’s stake sale introduces dilution concerns, causing short-term price pressure and cautious market reactions. The strategic MoU with NPCIL adds a positive dimension by signaling growth and diversification prospects. The balance of these factors suggests a stable outlook with attention to government divestment impacts.
Source List
Analytical Overview
Analysis Summary
NLC India’s valuation metrics, including a trailing P/E of 13.17 and forward P/E of 12.39, are broadly in line with industry averages, suggesting fair pricing relative to earnings. The company’s PEG ratio of 0.13 indicates undervaluation relative to growth prospects. Revenue growth is slightly negative at -0.3% quarterly, but operating cash flow remains strong at ₹51.7 billion, highlighting solid cash generation despite recent earnings softness. The debt-to-equity ratio of 0.82 reflects moderate leverage, balanced by a current ratio below 1.0, indicating some liquidity constraints. Sector-specific challenges include regulatory oversight and government divestment activities, while opportunities arise from diversification into nuclear and renewable energy aligned with India’s energy transition policies.
Overall Business and Market Assessment
Supporting Factors: No data
Risk Factors: government stake sales that may pressure share price and liquidity concerns due to a sub-1 current ratio
SWOT Analysis
Strengths
- NLC India has a strong market position in lignite mining and thermal power generation.
- The company maintains robust profitability with a net profit margin of 20.1%.
- Strategic partnerships, including a joint venture with NPCIL, enhance diversification.
- Stable government ownership provides governance stability.
Weaknesses
- Negative free cash flow of approximately ₹-51 billion indicates capital expenditure pressures.
- Current ratio below 1.0 suggests potential short-term liquidity constraints.
- Revenue growth is slightly negative, reflecting recent operational challenges.
- High debt levels with a debt-to-equity ratio of 0.82 increase financial risk.
Opportunities
- Expansion into nuclear power through MoU with NPCIL offers growth potential.
- Renewable energy initiatives align with global and national clean energy trends.
- Government divestment may increase public float and improve liquidity.
- Rising energy demand in India supports long-term sector growth.
Threats
- Government stake sales may create downward pressure on share price.
- Regulatory changes in the energy sector could impact operations.
- Competition from other power producers and renewable energy providers.
- Macroeconomic factors such as fuel price volatility and policy shifts.
Company Description
NLC India Ltd., a Navratna Public Sector Enterprise under the Ministry of Coal, is a prominent player in India's energy sector. Established in 1956, the company is primarily engaged in mining lignite and generating electricity from lignite-based thermal power plants. NLC India is instrumental in harnessing brown coal reserves and converting them into substantial power outputs, contributing significantly to the nation’s energy grid. The company is a key player in both lignite mining and power generation, with its efforts focused on enhancing efficiency and sustainability. NLC India's operations predominantly affect industries concerned with energy production, infrastructure development, and environmental management. It also explores renewable energy ventures to diversify its energy generation portfolio, aligning with global shifts towards cleaner energy solutions. As a public enterprise, NLC India Ltd. plays a pivotal role in promoting self-reliance in energy resources, advancing India's energy security and reducing the reliance on coal imports. The company's strategic initiatives and expansion plans are crucial for meeting the growing energy demands of urban and rural India.