
Nippon India ETF Nifty BeES (NIFTYBEES)
Stock Analysis Report
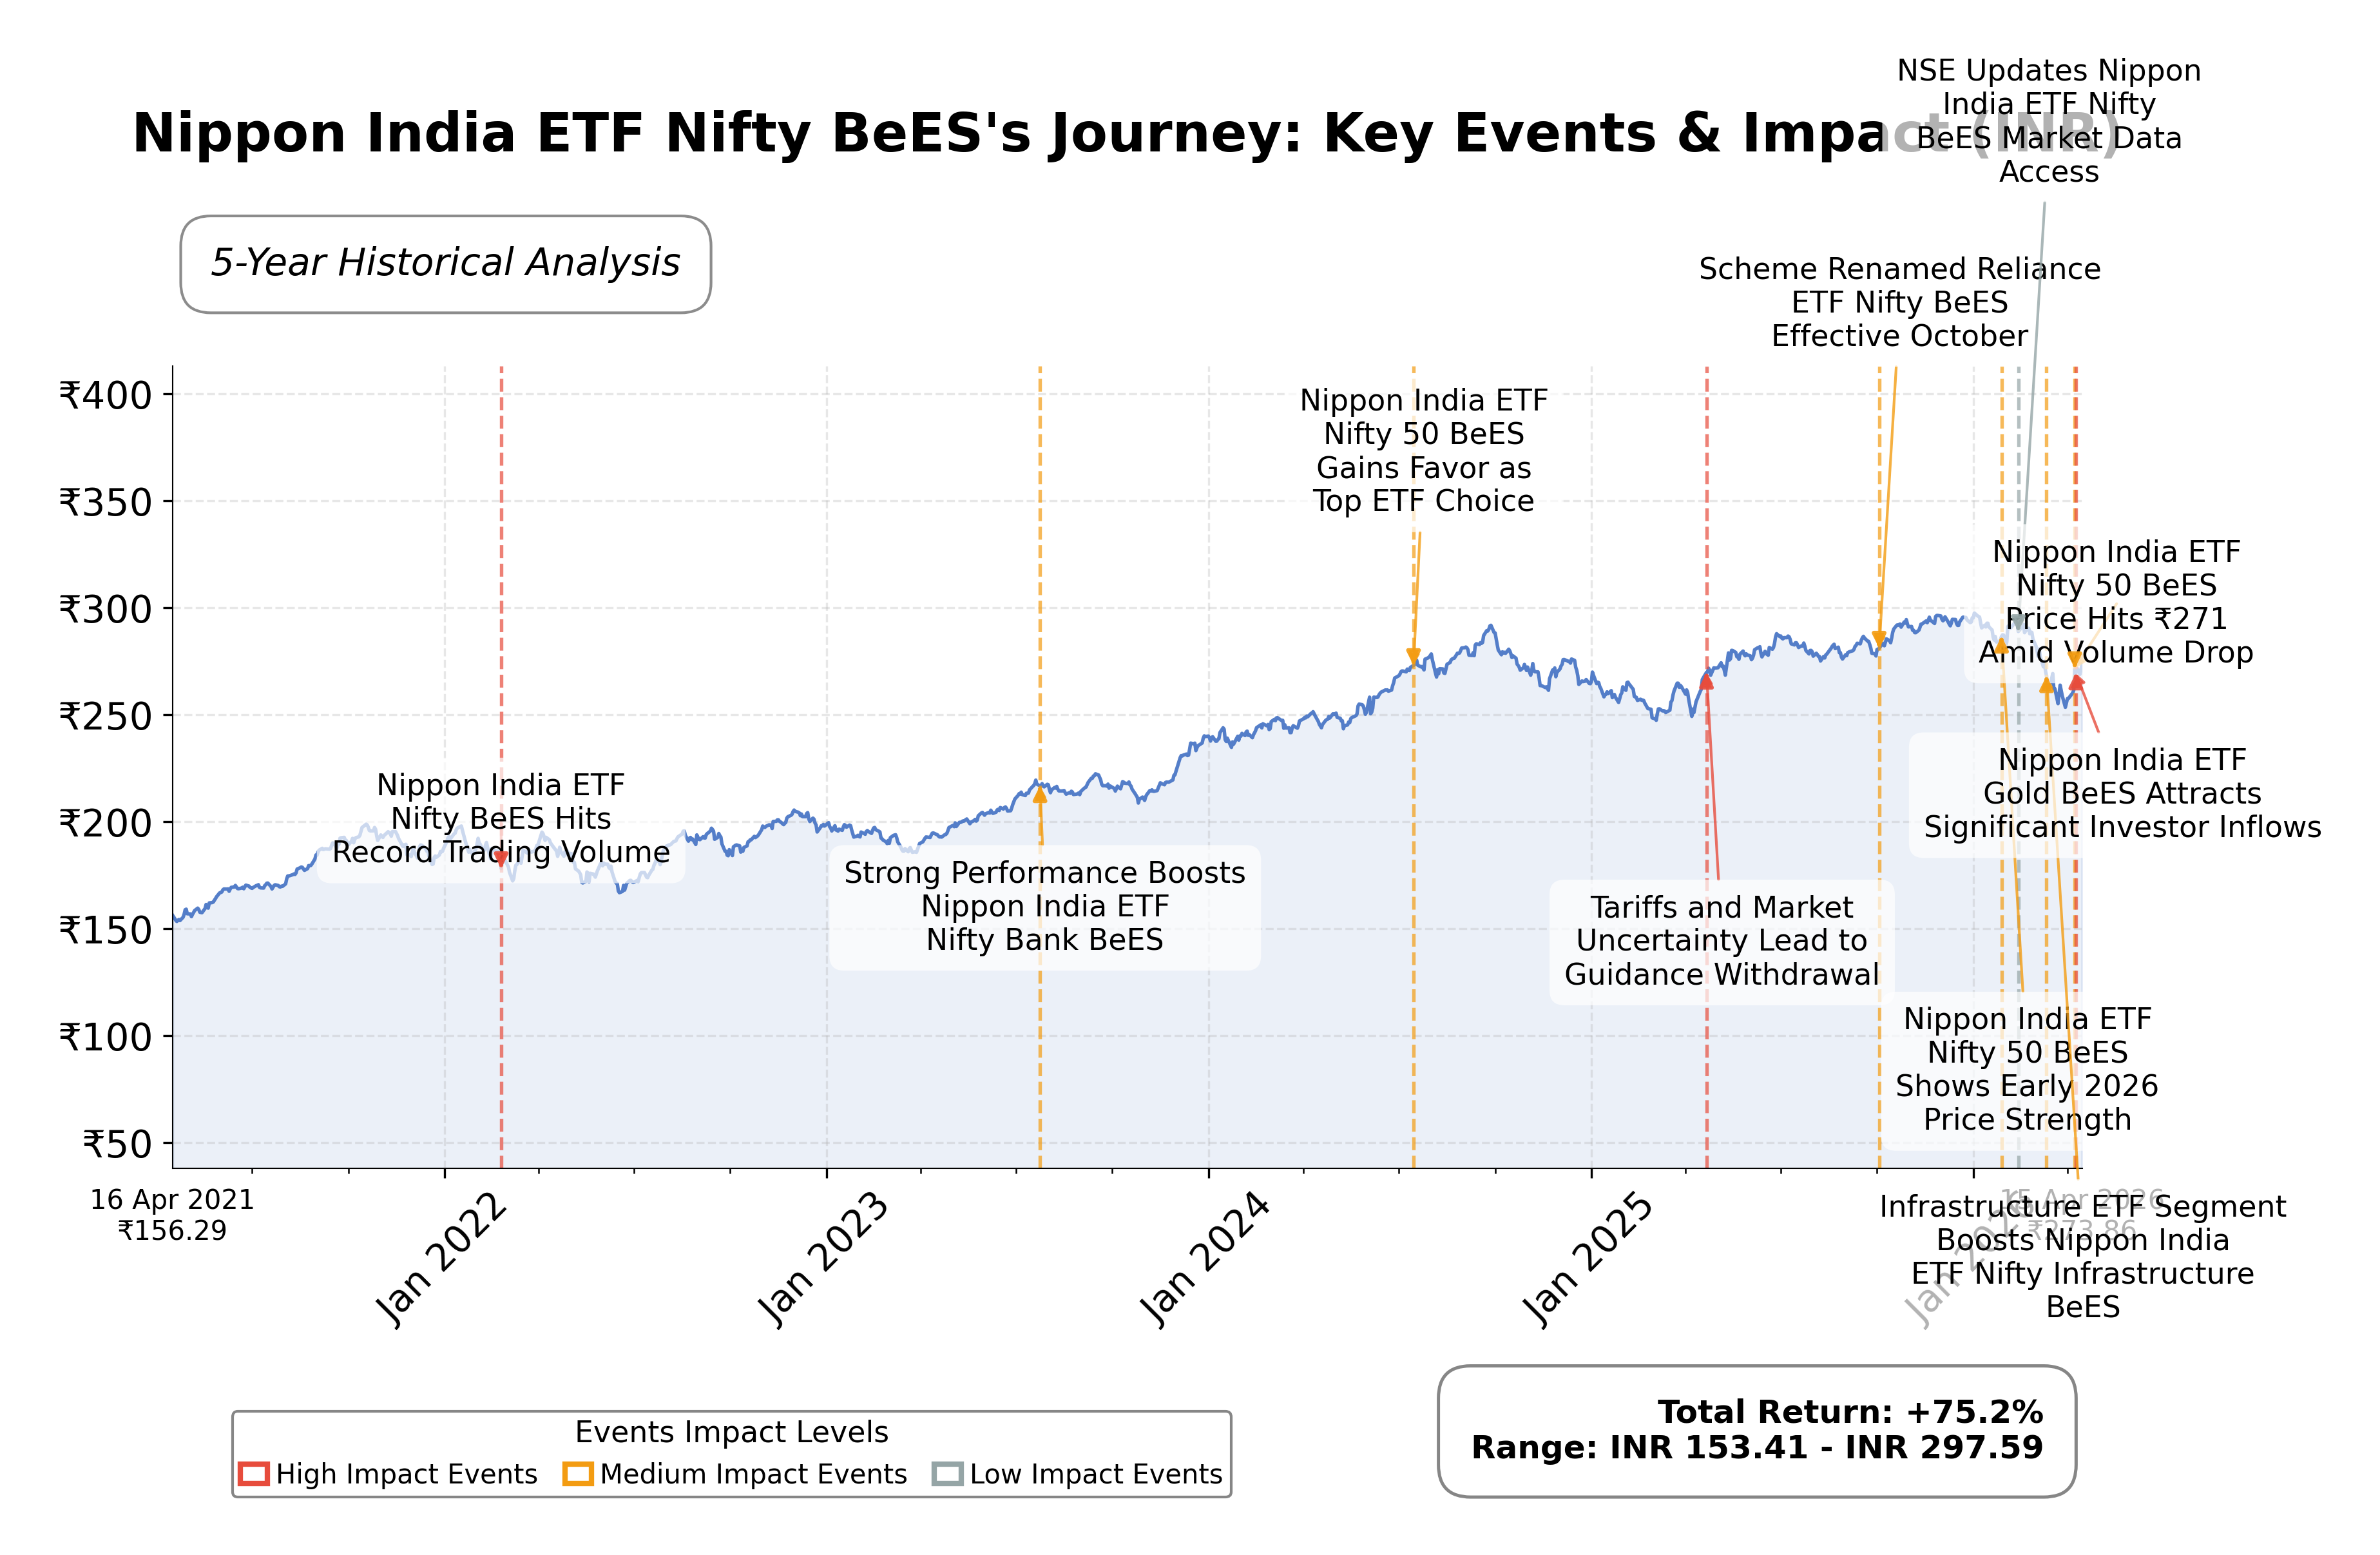
Stock Journey
Key Positives and Key Risks
Pros
- Provides diversified exposure to 50 large-cap Indian stocks, reducing single-stock risk.
- Trades at INR 274.04, within a 52-week range of INR 251.16 to INR 298.77, indicating moderate price stability.
- The ETF price is above both the 50-day (₹153.98) and 200-day (₹128.52) moving averages, signaling positive momentum.
Cons
- Lacks traditional financial metrics such as P/E, ROE, and cash flow, limiting fundamental valuation analysis.
- Downside risk of approximately 8.37% from current price to 52-week high suggests potential price volatility.
- Dependent entirely on the underlying Nifty 50 index performance, exposing investors to market-wide risks.
Disclosure: This information is for general awareness and does not constitute investment advice
Report Summary
Nippon India ETF Nifty BeES is an exchange-traded fund listed on the Bombay Stock Exchange (BSE) that tracks the Nifty 50 Index, representing the 50 largest and most liquid Indian stocks. The fund offers investors diversified exposure across key sectors such as finance, information technology, energy, consumer goods, and healthcare. As a passively managed ETF, it aims to replicate the performance of the Nifty 50, providing a cost-effective and liquid investment vehicle for broad participation in the Indian equity market. The ETF is a significant product within the Indian asset management industry, facilitating easy access to the country’s premier stock index.
Financial metrics for Nippon India ETF Nifty BeES are limited due to its nature as an ETF rather than an operating company. The fund does not report traditional profitability measures such as revenue, profit margins, or returns on equity/assets. Market capitalization and enterprise value data are not applicable, and cash flow metrics are zero, reflecting the fund’s role as a pass-through investment vehicle. This absence of operating financials is typical for ETFs, which focus on tracking an index rather than generating earnings.
Valuation ratios such as price-to-earnings, price-to-book, and EV/EBITDA are not available for this ETF, consistent with its structure. The current price stands at INR 274.04, within a 52-week range of INR 251.16 to INR 298.77, indicating a moderate price variation of approximately 18.8% between the low and high. The ETF’s price reflects the underlying Nifty 50 index levels, and its trading volumes suggest reasonable liquidity with average 10-day volume around 847,279 shares.
Key strengths include the ETF’s broad market exposure, low cost, and ease of trading on the BSE, making it accessible to retail and institutional investors. Risks primarily relate to market volatility, sector concentration within the Nifty 50, and macroeconomic factors impacting the Indian equity market. No recent strategic changes or corporate events are reported, consistent with the ETF’s passive management approach.
Technical indicators show the ETF trading above its 50-day and 200-day moving averages, suggesting a positive trend in price action. Recent market news highlights bullish sentiment in the Indian equity markets, supported by easing oil prices and geopolitical developments. Overall, the data suggests a stable and liquid investment reflecting the broader Indian market, suitable for investors seeking index exposure without active management.
Company and Industry Overview
Company Basics
Price Performance
Company Size
Shareholding Pattern
Nippon India ETF Nifty BeES operates as a passively managed exchange-traded fund tracking the Nifty 50 Index, providing investors with diversified exposure to India's largest and most liquid stocks. As an ETF, it does not have traditional insiders or promoters; ownership is distributed among retail and institutional investors who hold units of the fund. Detailed shareholding percentages for insiders, institutions, and public investors are not disclosed, reflecting the structure of ETFs where units are freely traded on exchanges. There have been no significant changes reported in ownership patterns over the past 12-24 months. Institutional accumulation trends typically mirror broader market flows into index funds, with no specific major fund movements publicly noted. This ownership structure supports transparent governance aligned with index replication objectives and facilitates broad market participation without concentrated control.
Sector and Industry Analysis
The ETF sector in India has witnessed significant growth, driven by increasing investor interest in passive investment vehicles. The market size has expanded as ETFs offer cost-effective and diversified exposure to benchmark indices like the Nifty 50. Key players include Nippon India Mutual Fund, SBI Mutual Fund, and ICICI Prudential, with Nippon India ETF Nifty BeES being one of the prominent offerings tracking the Nifty 50 index.
Industry trends highlight a shift towards greater adoption of ETFs due to their liquidity, transparency, and lower expense ratios compared to actively managed funds. Competitive dynamics are shaped by product innovation, with providers launching thematic and sector-specific ETFs to capture niche investor demand. Barriers to entry include the need for regulatory approval, robust fund management infrastructure, and strong distribution networks to gain market share.
The regulatory landscape is overseen by the Securities and Exchange Board of India (SEBI), which has implemented guidelines to enhance transparency, investor protection, and operational efficiency in the ETF space. Recent regulations focus on improving disclosure norms and facilitating easier access to ETFs for retail investors. The outlook remains positive as regulatory support continues to foster growth and innovation within the sector.
Note: Analysis synthesized from industry research, market reports, and regulatory filings. Information is subject to change based on market conditions.
Peer Analysis
| Company Name | Market Cap | P/E Ratio | P/B Ratio | EV/EBITDA | Price to CFO |
|---|---|---|---|---|---|
| Nippon India ETF Nifty BeES | ₹ 0.00 | N/A | N/A | N/A | N/A |
Comparison Analysis: Nippon India ETF Nifty BeES lacks direct comparable peers in this data set, as no other ETFs or similar index funds are listed for comparison. The absence of valuation metrics and financial ratios is typical for ETFs, which do not generate earnings but track underlying indices. This ETF’s current price and liquidity metrics position it as a prominent vehicle for Nifty 50 exposure on the BSE. Without peer data, relative strengths or weaknesses cannot be assessed, but the fund’s role as a market proxy remains its defining characteristic.
Financial Metrics Comparison with Peers
Financial Statements
Comprehensive financial data including income, balance sheet, and cash flow metrics
Income Statement
Data not available
Balance Sheet
Data not available
Cash Flow Statement
Data not available
Technical Analysis
Key Insights
- The current trend direction is upward, with the ETF price trading above both the 50-day moving average (₹153.98) and the 200-day moving average (₹128.52), indicating bullish momentum.
- Key support levels are near the 52-week low of ₹251.16, while resistance is observed near the 52-week high of ₹298.77.
- The ETF’s price is comfortably above major moving averages, suggesting sustained positive price action over short and long-term periods.
- Momentum indicators such as RSI and MACD data are unavailable, but the price positioning above moving averages implies positive momentum.
- Across daily, weekly, and monthly timeframes, the ETF exhibits a consistent upward trend aligned with the broader Nifty 50 index movement.
- Potential market scenarios include continued price appreciation if support levels hold, or consolidation near current levels given the proximity to recent highs.
Trending News
Summary: Investors' wealth surged by Rs 9.41 lakh crore as benchmark indices rebounded sharply.
Sentiment: positive
Summary: India Business News: Benchmark indices surged sharply on Wednesday, with investors turning bullish as easing oil prices and hopes of renewed US-Iran talks lifted sentiment.
Sentiment: positive
Summary: Vodafone Idea, Ola Electric Mobility, Reliance Power, Suzlon Energy, Tata Silver Exchange Traded Fund, Billionbrains Garage Ventures (Groww), and Jaiprakash Power Ventures (JP Power) were among the most traded stocks, or the most active stocks in terms of volume, on the NSE.
Sentiment: neutral
4. Headline: Nifty Capital Markets index up 10% in 2026; what’s next for BSE, MCX and others?
Summary: The Nifty Capital Markets index has outperformed the NIFTY50 index, rising around 10% so far in 2026, as investors focus their attention towards equity markets' recovery and domestic investors' support amid global uncertainties.
Sentiment: positive
Summary: Sensex Today | Nifty 50 | Stock Market Live Updates: Indian stock markets rallied sharply on Wednesday, with the Sensex and Nifty rising over 1.6% each, as easing oil prices, renewed hopes of US-Iran peace talks and other factors boosted market sentiment.
Sentiment: positive
Powered by Brave
Recent Updates
News Summary
Recent updates highlight the Nippon India ETF Nifty BeES as a key vehicle for accessing the Nifty 50 Index, representing India's top 50 large-cap companies. Educational content from HDFC Sky explains the ETF's features and advantages, emphasizing its role in providing diversified market exposure. Other Nippon India ETFs such as PHARMABEES and INFRABEES have been noted for their real-time pricing and market presence, reflecting the broader ETF ecosystem's growth. Industry analyses identify Nippon India as a leader in ETF impact cost efficiency, underscoring competitive strengths in passive fund management. Broader market commentary points to favorable conditions for ETFs in India for 2026 and beyond, driven by investor interest in diversified, low-cost investment options.
News Sentiment
The overall sentiment from recent news is moderately positive, with educational and industry-focused articles emphasizing the benefits and growing popularity of Nippon India ETFs. Neutral sentiments appear in coverage of specific sector ETFs and impact cost discussions, while positive outlooks dominate narratives on market positioning and investment trends. This sentiment mix suggests steady investor confidence in the ETF product suite and the Indian passive investment market.
Analytical Overview
Analysis Summary
Nippon India ETF Nifty BeES does not report traditional valuation metrics such as P/E or forward P/E ratios, which is typical for ETFs that track indices rather than generate earnings. The absence of these metrics limits direct valuation comparisons with industry averages. Growth trajectory is inherently linked to the performance of the Nifty 50 Index, which has shown resilience and moderate appreciation in recent periods, reflecting stable market conditions. Financial health metrics such as debt-to-cash ratios and cash flow are not applicable for this ETF structure, as it holds a basket of equities rather than operating assets or liabilities. Sector-specific opportunities include India's expanding equity markets and increasing investor participation in passive funds, while challenges involve market volatility and macroeconomic uncertainties. Considering India-specific factors, the regulatory environment supports ETF growth with favorable policies, and consumer trends show rising demand for diversified, low-cost investment products.
Overall Business and Market Assessment
Supporting Factors: broad market exposure to the Nifty 50, cost-effective access to large-cap Indian equities, and liquidity on the BSE
Risk Factors: No data
SWOT Analysis
Strengths
- Provides diversified exposure to 50 large-cap Indian stocks.
- Offers cost-effective and liquid access to the Nifty 50 index.
- Passively managed with transparent index replication.
- Listed on BSE enabling real-time trading like stocks.
Weaknesses
- Lacks traditional financial metrics such as earnings and cash flow.
- No dividend yield or income generation reported.
- Dependent entirely on the performance of the underlying index.
- Limited ability to outperform the market due to passive strategy.
Opportunities
- Growing investor interest in passive investment products in India.
- Favorable regulatory environment supporting ETF expansion.
- Increasing participation from retail and institutional investors.
- Potential to capture broad market growth amid economic recovery.
Threats
- Market volatility and geopolitical risks affecting index performance.
- Sector concentration risks within the Nifty 50 constituents.
- Competition from other ETFs and mutual fund products.
- Macroeconomic uncertainties impacting Indian equity markets.
Company Description
The Nippon India ETF Nifty BeES is an exchange-traded fund that provides investors with a liquid opportunity to access the performance of the Indian equity markets through the Nifty 50 Index, one of the country's premier stock market indices. This ETF replicates the index, which consists of 50 of the largest and most liquid Indian stocks, spanning various key sectors such as finance, information technology, energy, consumer goods, and healthcare. As a passively managed fund, its primary purpose is to mirror the movements of the Nifty 50, allowing investors broad exposure to leading companies like Reliance Industries, TCS, and HDFC Bank. With its inception in 2001, Nippon India ETF Nifty BeES plays a critical role in democratizing investments in the Indian stock market, offering a cost-effective solution for diversification. The fund is listed on the National Stock Exchange of India, providing real-time trading akin to that of individual stocks, thus combining the diversification of a mutual fund with the ease of trading of a stock.