
Newgen Software Technologies Ltd (NEWGEN)
Stock Analysis Report
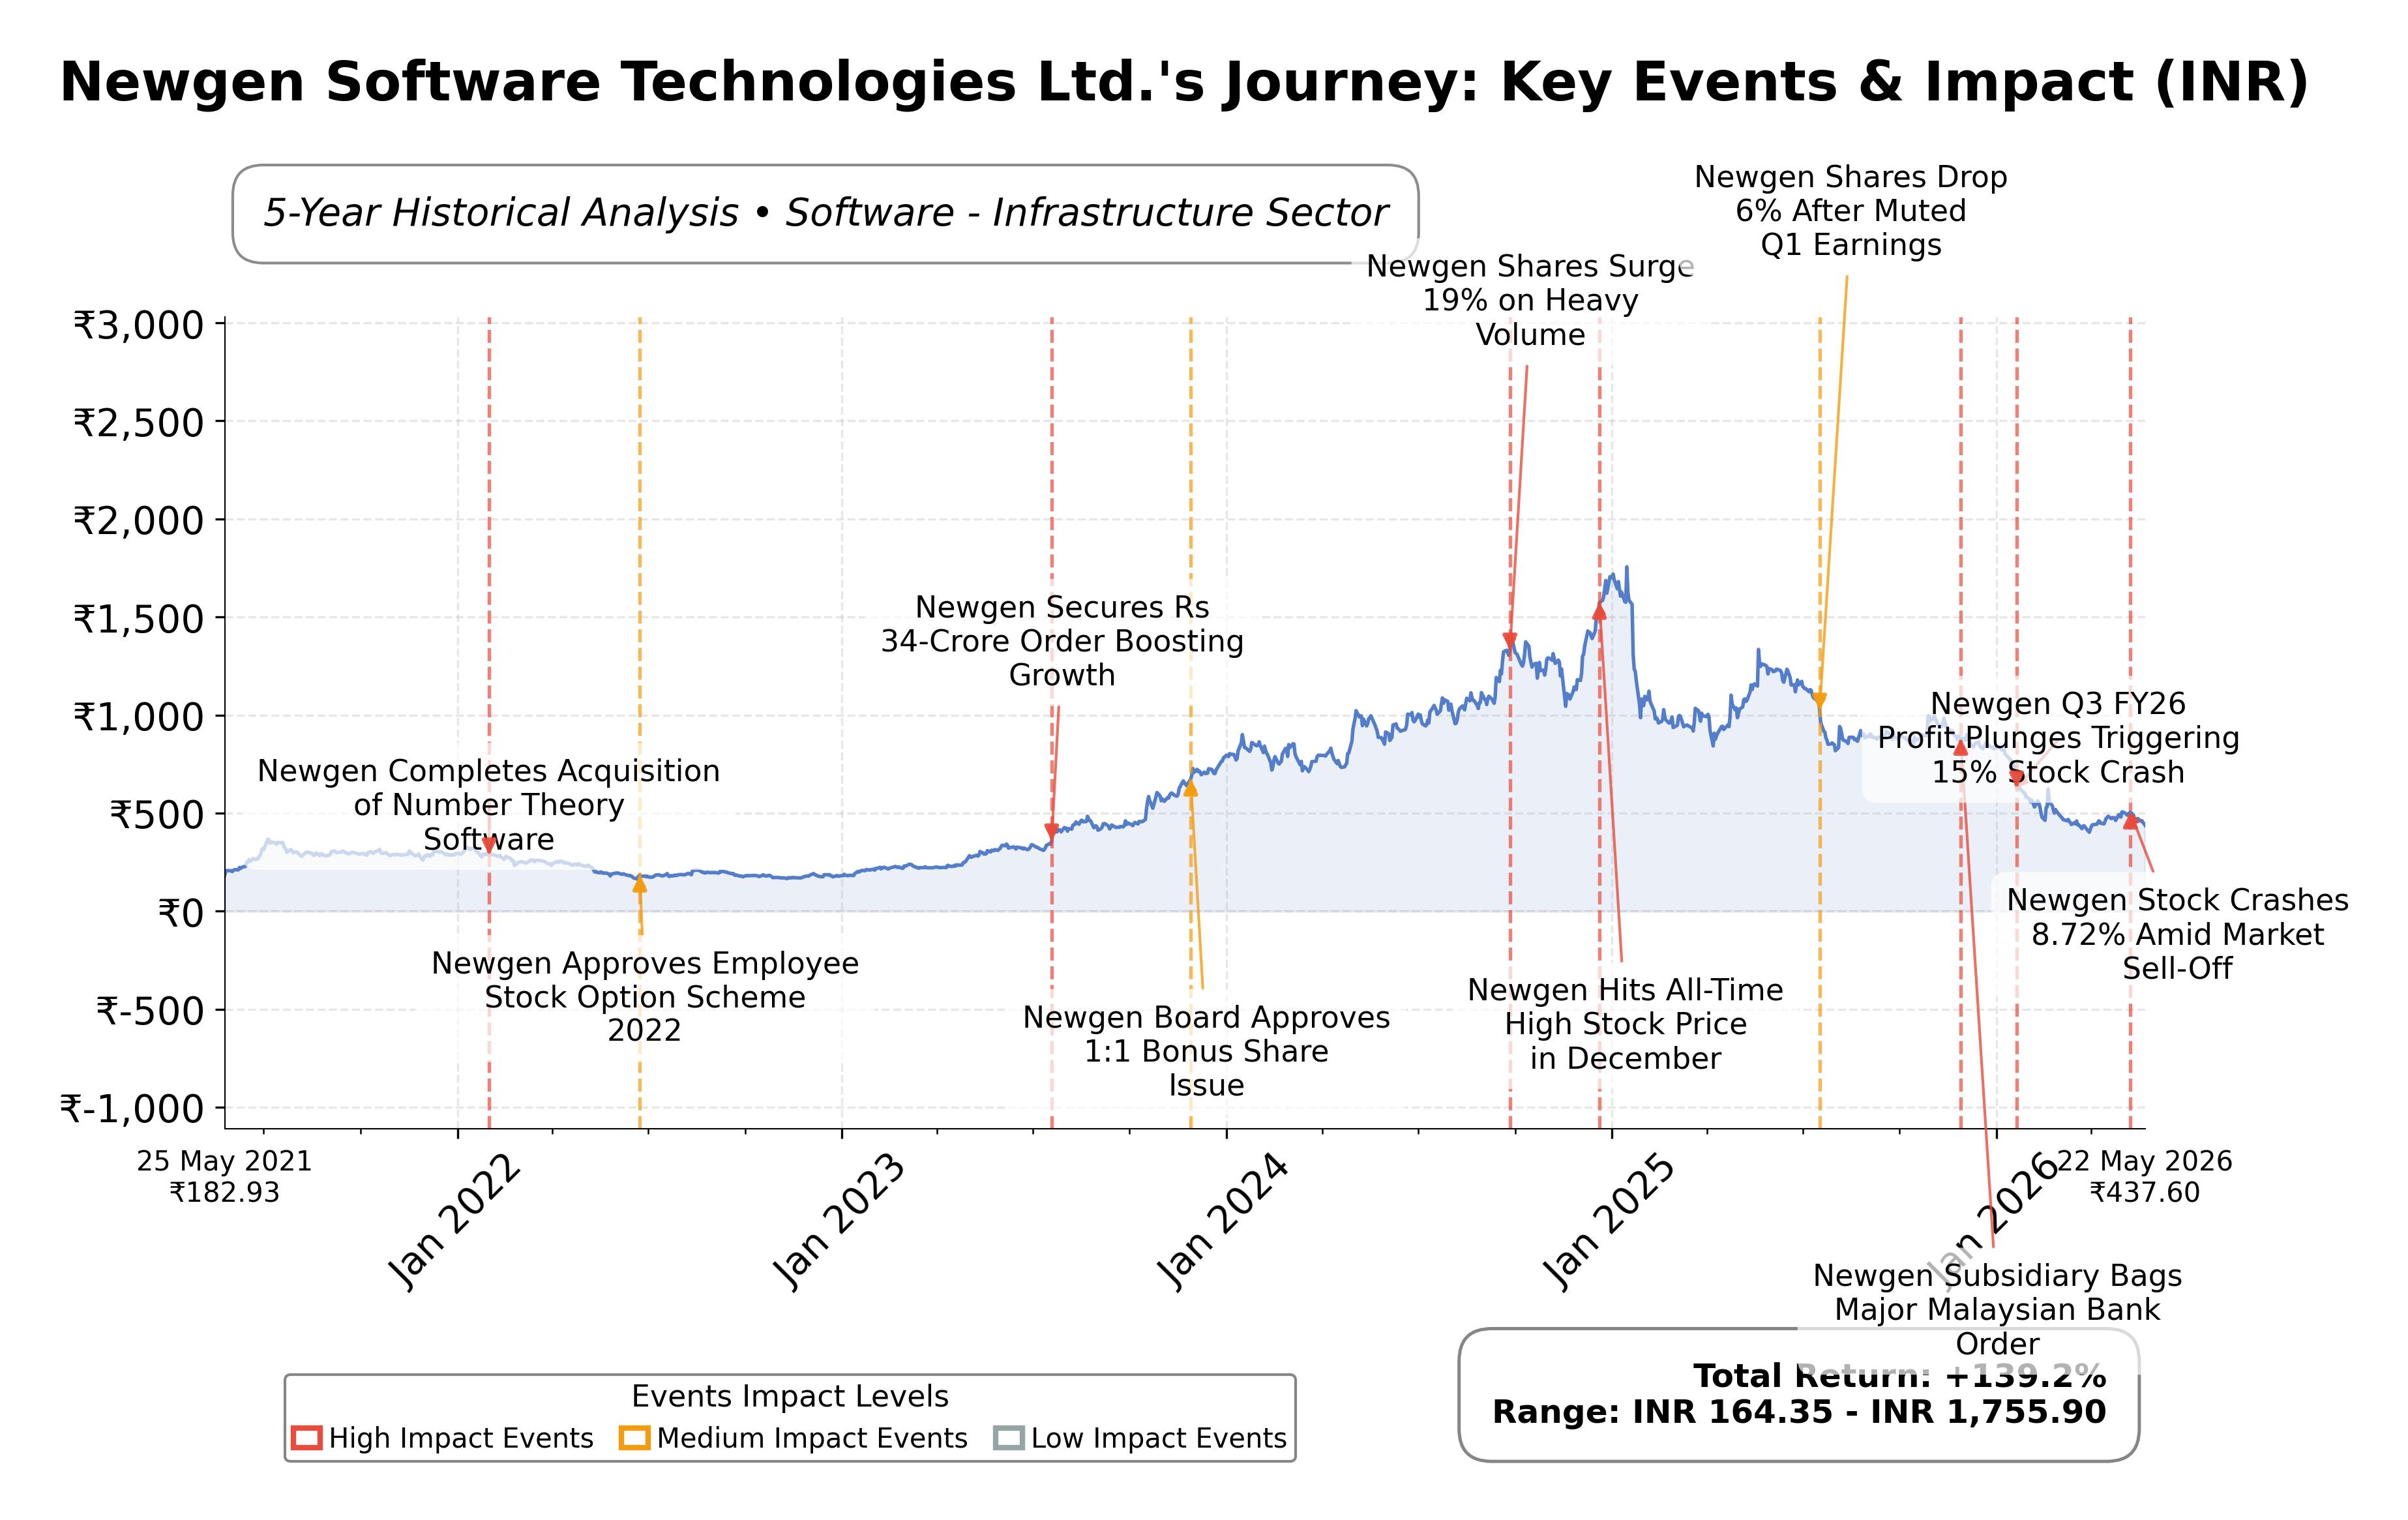
Stock Journey
Key Positives and Key Risks
Pros
- Strong profitability with a net profit margin of 19.1%, indicating efficient operations.
- Robust liquidity position with INR 11.15 billion in cash and a current ratio of 3.66, supporting financial stability.
- Moderate valuation with a trailing P/E of 20.7 and forward P/E of 14.5, below many industry peers.
Cons
- Significant downside risk of approximately 69.6% from the 52-week high to current price, reflecting high price volatility.
- Negative quarterly earnings growth year-over-year at -1.9%, suggesting recent profit pressure.
- PEG ratio is negative at -1.83, indicating challenges in earnings growth relative to valuation.
Disclosure: This information is for general awareness and does not constitute investment advice
Report Summary
Newgen Software Technologies Ltd. operates as a leading provider of business software solutions focused on digital transformation, primarily serving sectors such as banking, government, insurance, and shared services. Listed on the NSE in India under the technology sector, Newgen specializes in Business Process Management (BPM), Enterprise Content Management (ECM), and Customer Communication Management (CCM) products. The company is positioned to support enterprise-level operations by streamlining processes and enhancing collaboration, thereby maintaining a significant presence in the software infrastructure industry.
Financially, Newgen reported trailing twelve months (TTM) revenue of approximately INR 15.74 billion with a gross margin of 52.7%, an operating margin of 31.5%, and a net profit margin of 19.1%. The company’s return on equity (ROE) stands at 18.3%, and return on assets (ROA) at 10.3%, reflecting efficient use of shareholder capital and assets to generate profits. The return on invested capital (ROIC) is consistent with these figures, indicating solid operational efficiency and profitability.
Valuation metrics show a trailing price-to-earnings (P/E) ratio of 20.7 and a forward P/E of 14.5, suggesting the stock is priced with some expectation of earnings growth. The price-to-book (P/B) ratio is 3.46, and the enterprise value to EBITDA (EV/EBITDA) ratio is 12.5, which are moderate compared to industry peers. The market capitalization is approximately INR 61.77 billion, with the stock trading at INR 440.20, well below its 52-week high of INR 1,336, indicating a significant range of price movement over the past year.
Key strengths include a strong cash position of over INR 11 billion, low debt levels with a debt-to-equity ratio of 0.022, and a current ratio of 3.66, underscoring robust liquidity. The company’s market leadership in digital transformation software and a recent 2-for-1 stock split in January 2024 are notable. Risks include competitive pressures in the technology sector, potential regulatory changes in India, and a slight year-over-year decline in quarterly earnings growth by 1.9%.
Technically, the stock is trading above its 50-day moving average but below the 200-day moving average, indicating mixed momentum. The beta of 0.72 suggests moderate volatility relative to the market. Recent volume averages show steady trading interest. Overall, the data suggests a balanced environment where market participants may consider accumulation or monitoring for further confirmation of trend direction.
Company and Industry Overview
Company Basics
Price Performance
Company Size
Shareholding Pattern
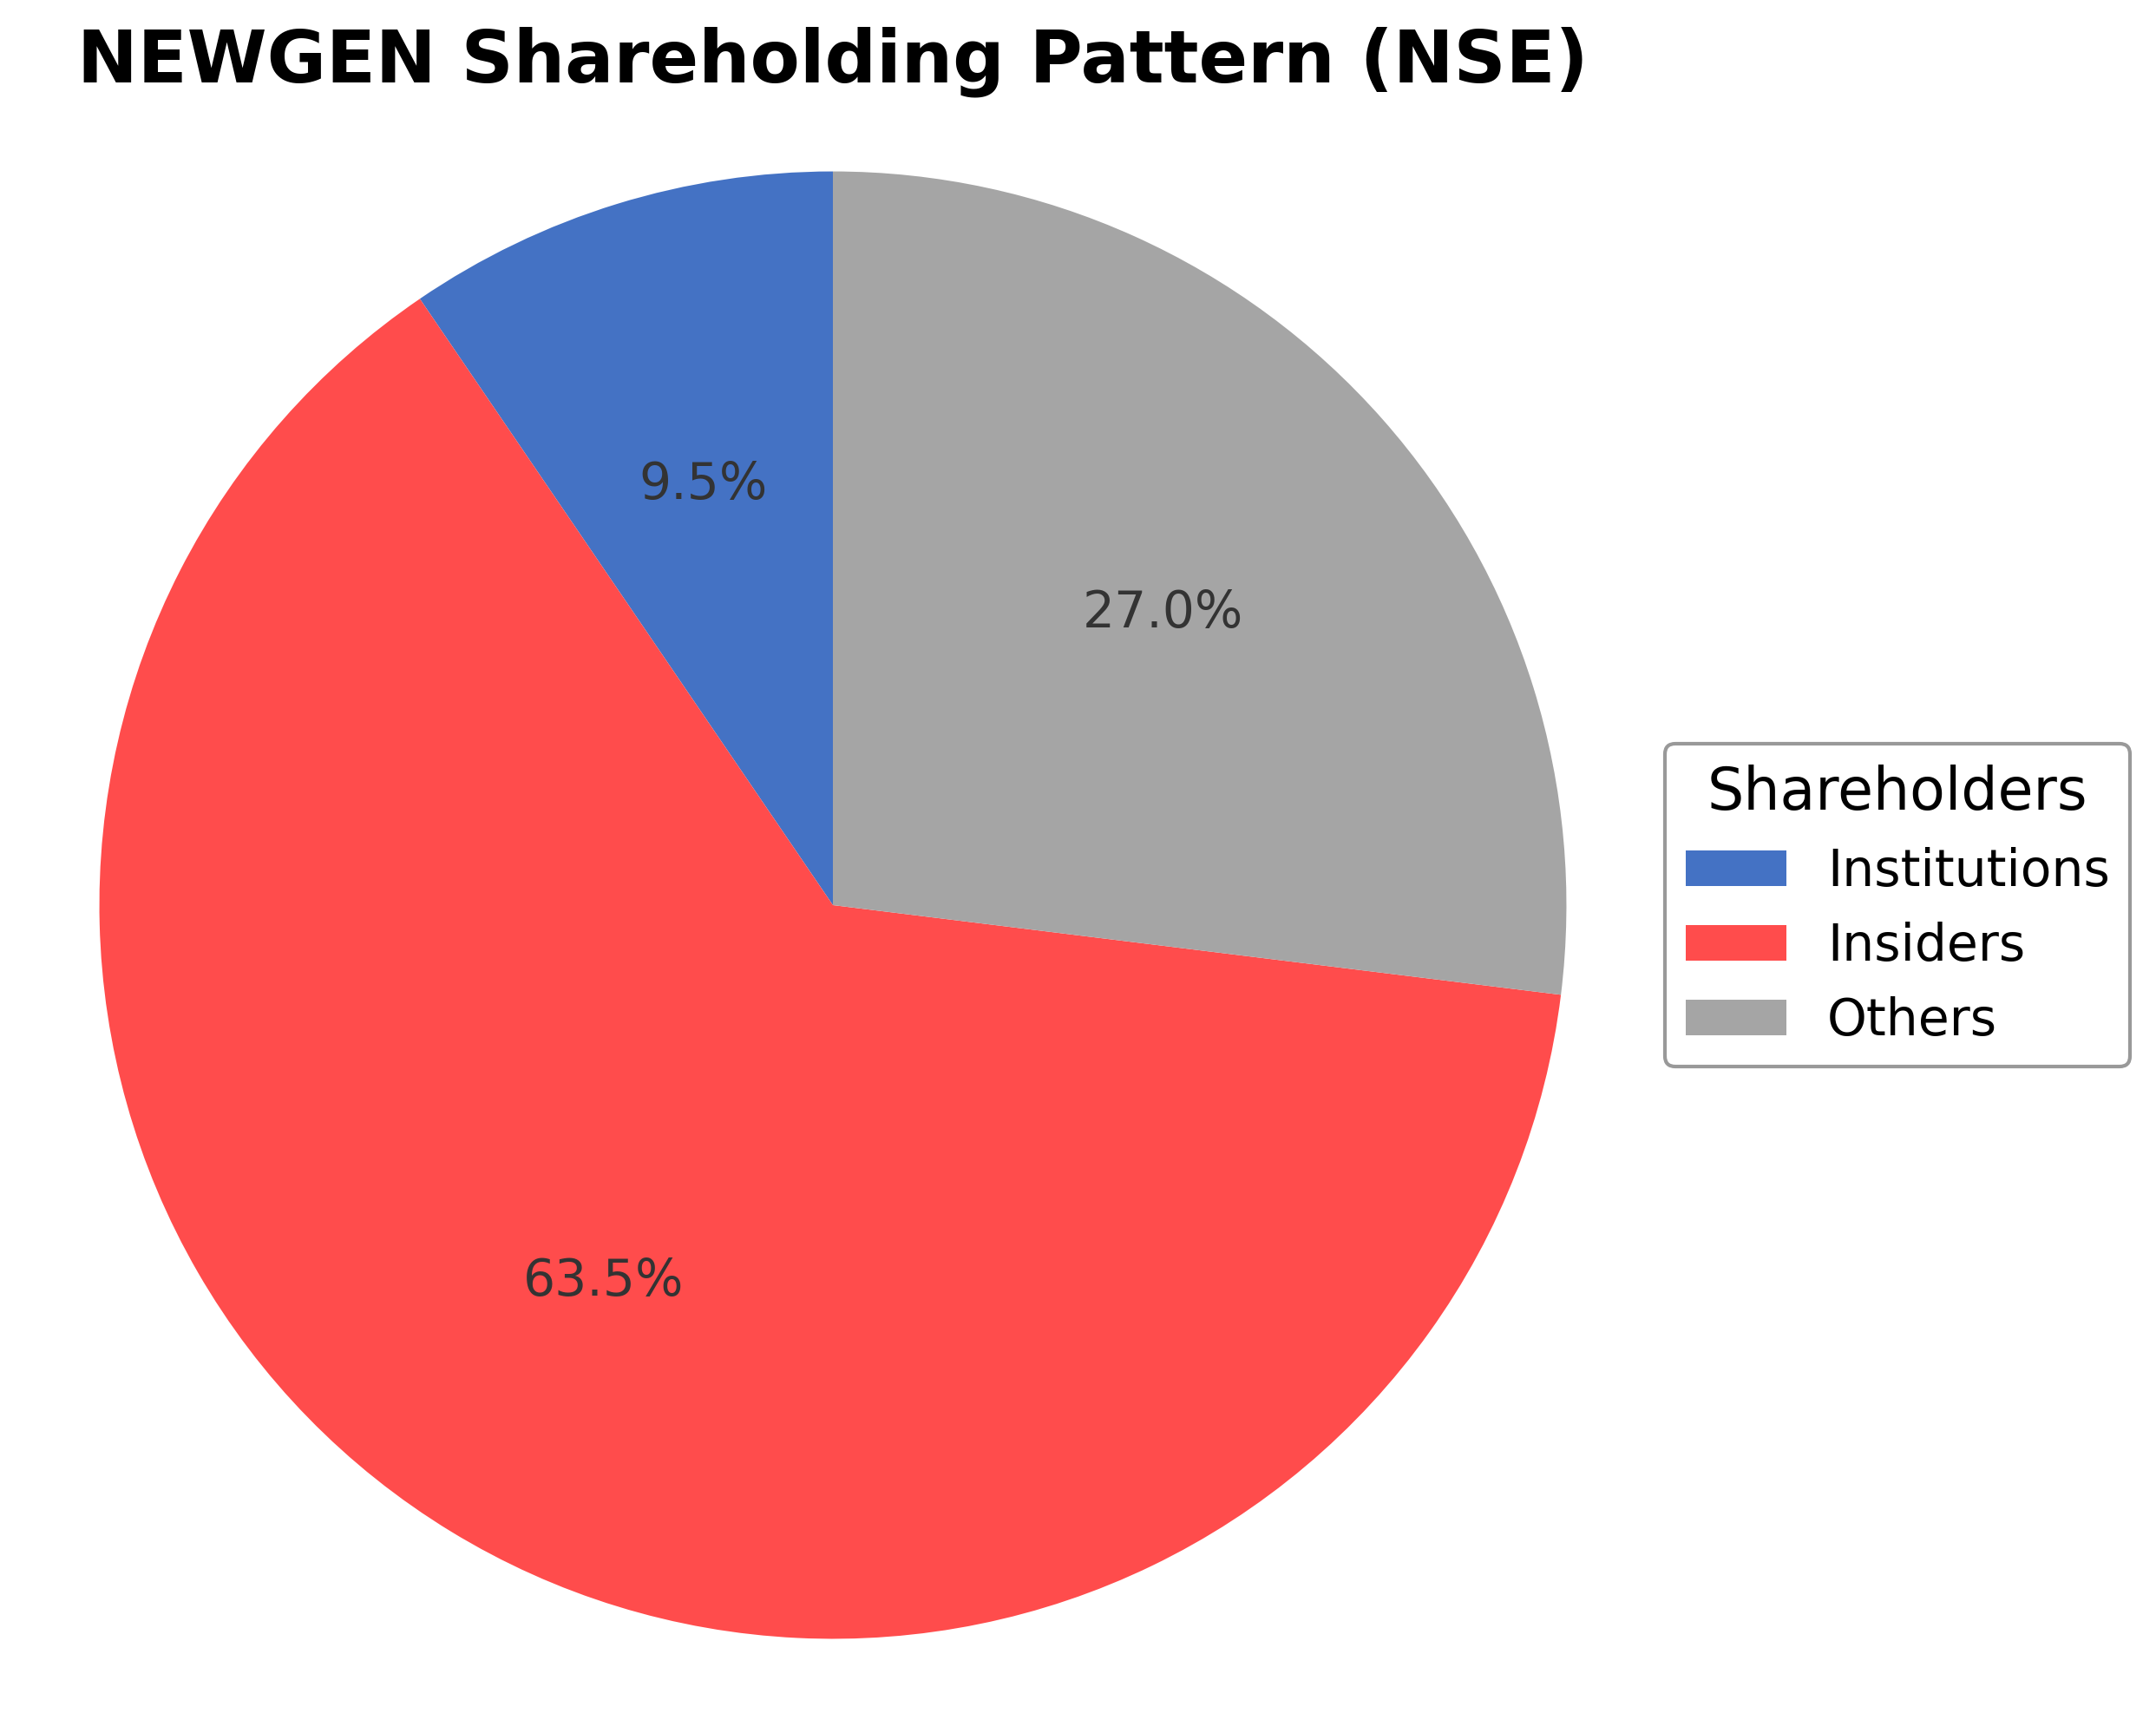
Newgen Software Technologies Ltd. exhibits a concentrated ownership structure with insiders, including executives and board members, holding approximately 63.54% of shares, indicating strong promoter control. Institutional investors account for 9.52%, reflecting moderate institutional interest, while public shareholders hold about 26.94%. Over the past 12 to 24 months, insider ownership has remained relatively stable, with no significant shifts reported. Institutional accumulation appears steady without notable large-scale increases or decreases by major funds. This ownership pattern suggests a governance framework dominated by promoters with balanced external investor participation, which may influence strategic decisions and corporate direction. Market sentiment appears cautiously optimistic given the stable institutional presence and promoter confidence.
Sector and Industry Analysis
The IT software sector, particularly in enterprise content management (ECM), business process management (BPM), and customer communications management (CCM), is experiencing steady growth driven by digital transformation across industries. The global low-code application development market, where companies like Newgen Software Technologies operate, is expanding rapidly, supported by increasing demand for automation and cloud-based solutions. Key players include established firms with strong SaaS offerings and recurring revenue models, focusing on sectors such as BFSI, government, and healthcare.
Industry trends highlight a shift towards annuity-based revenue models, emphasizing subscription and support services over traditional licensing, which reduces revenue volatility. Competitive dynamics are shaped by the ability to innovate in AI/ML integration, as seen in recent acquisitions, and to secure large-scale global system integrator (GSI) partnerships. Barriers to entry include technological expertise, client trust, and the capacity to scale across geographies, with firms increasingly targeting Tier 2 and Tier 3 banking clients to diversify risk.
Regulatory frameworks impacting the sector focus on data privacy, cybersecurity, and compliance standards, particularly in BFSI and healthcare verticals. Companies must navigate evolving regulations such as GDPR in Europe and data localization laws in India, which influence product development and service delivery. The outlook remains positive as regulatory clarity supports adoption of compliant digital solutions, encouraging investment in scalable, secure platforms.
Note: Analysis synthesized from industry research, market reports, and regulatory filings. Information is subject to change based on market conditions.
Financial Ratios Dashboard
Illustrative Scenario Analysis
DCF Assumptions:
Method: Two-Stage EPS-Priority Model
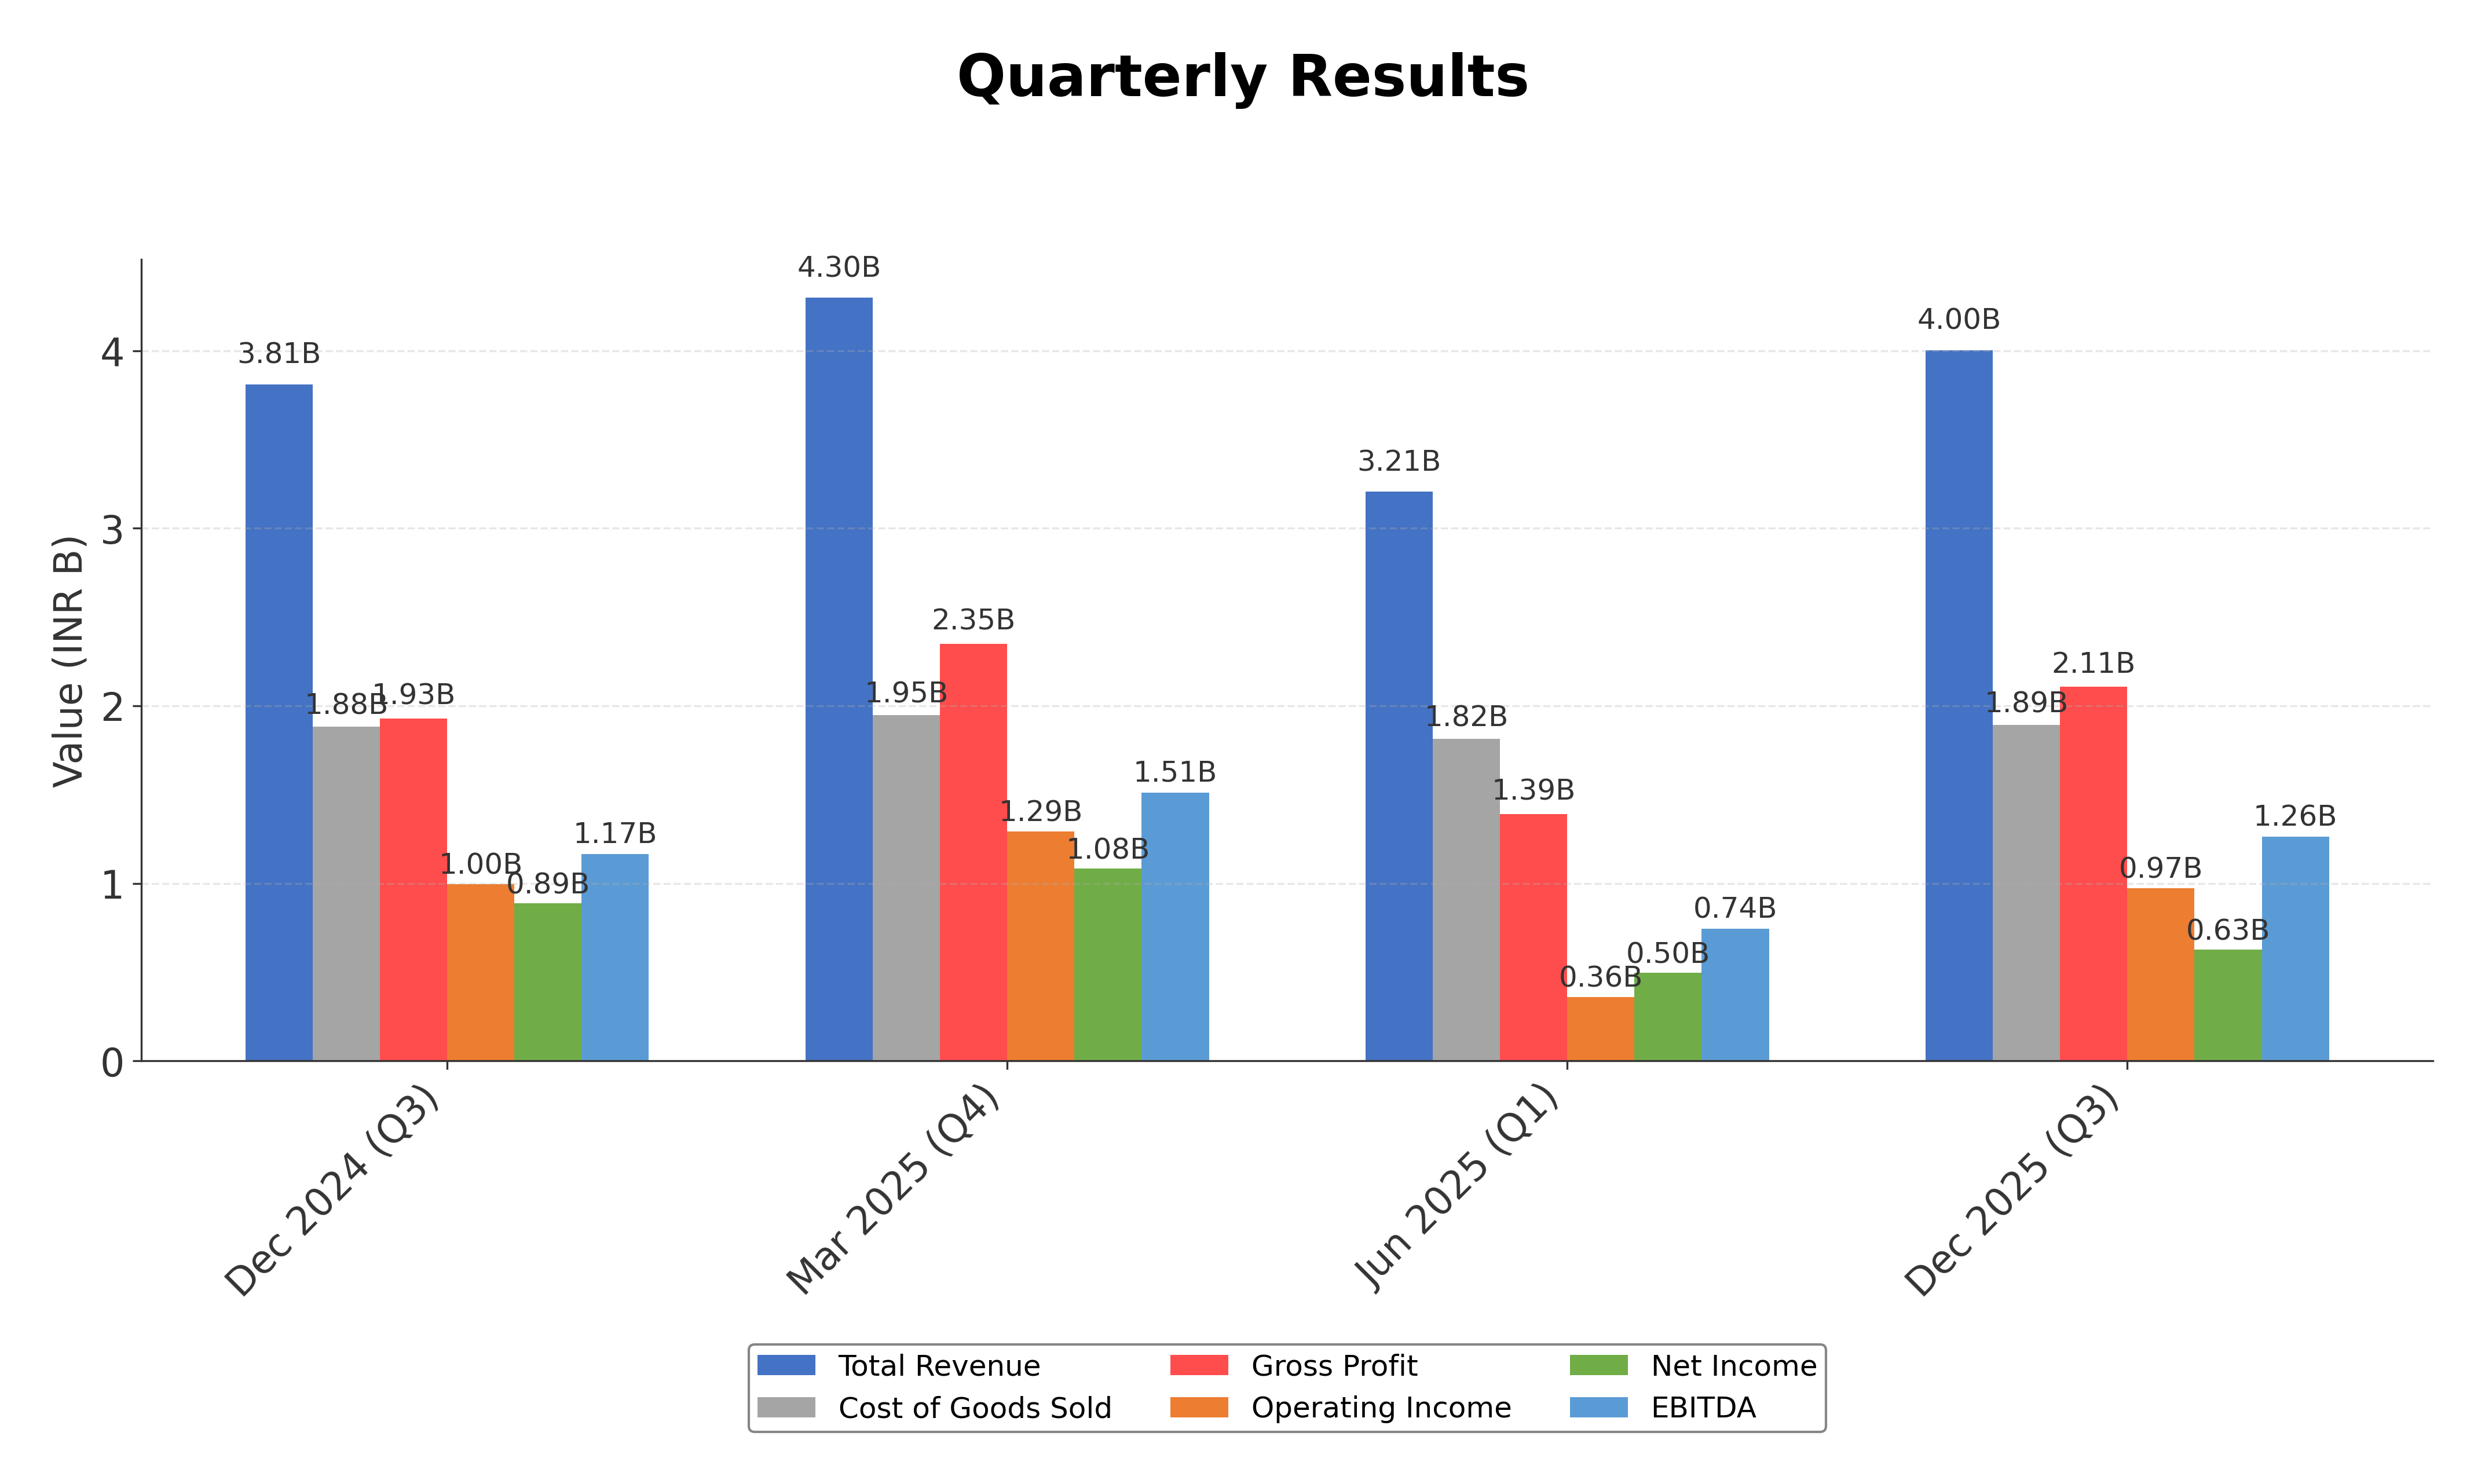
Financials
Peer Analysis
| Company Name | Market Cap | P/E Ratio | P/B Ratio | EV/EBITDA | Price to CFO |
|---|---|---|---|---|---|
| Newgen Software Technologies Ltd. | ₹61.77B | 20.73 | 3.46 | 12.51 | 26.64 |
| One 97 Communications Ltd. | ₹712.14B | 129.80 | 4.45 | 113.35 | -95.85 |
| Kpit Technologies Ltd. | ₹204.46B | 32.26 | 5.77 | 14.79 | 17.11 |
| Oracle Financial Services Software Limited | ₹829.29B | 31.58 | 10.59 | 22.78 | 31.43 |
| Ce Info Systems Ltd. | ₹47.14B | 35.19 | 5.76 | 20.08 | 50.50 |
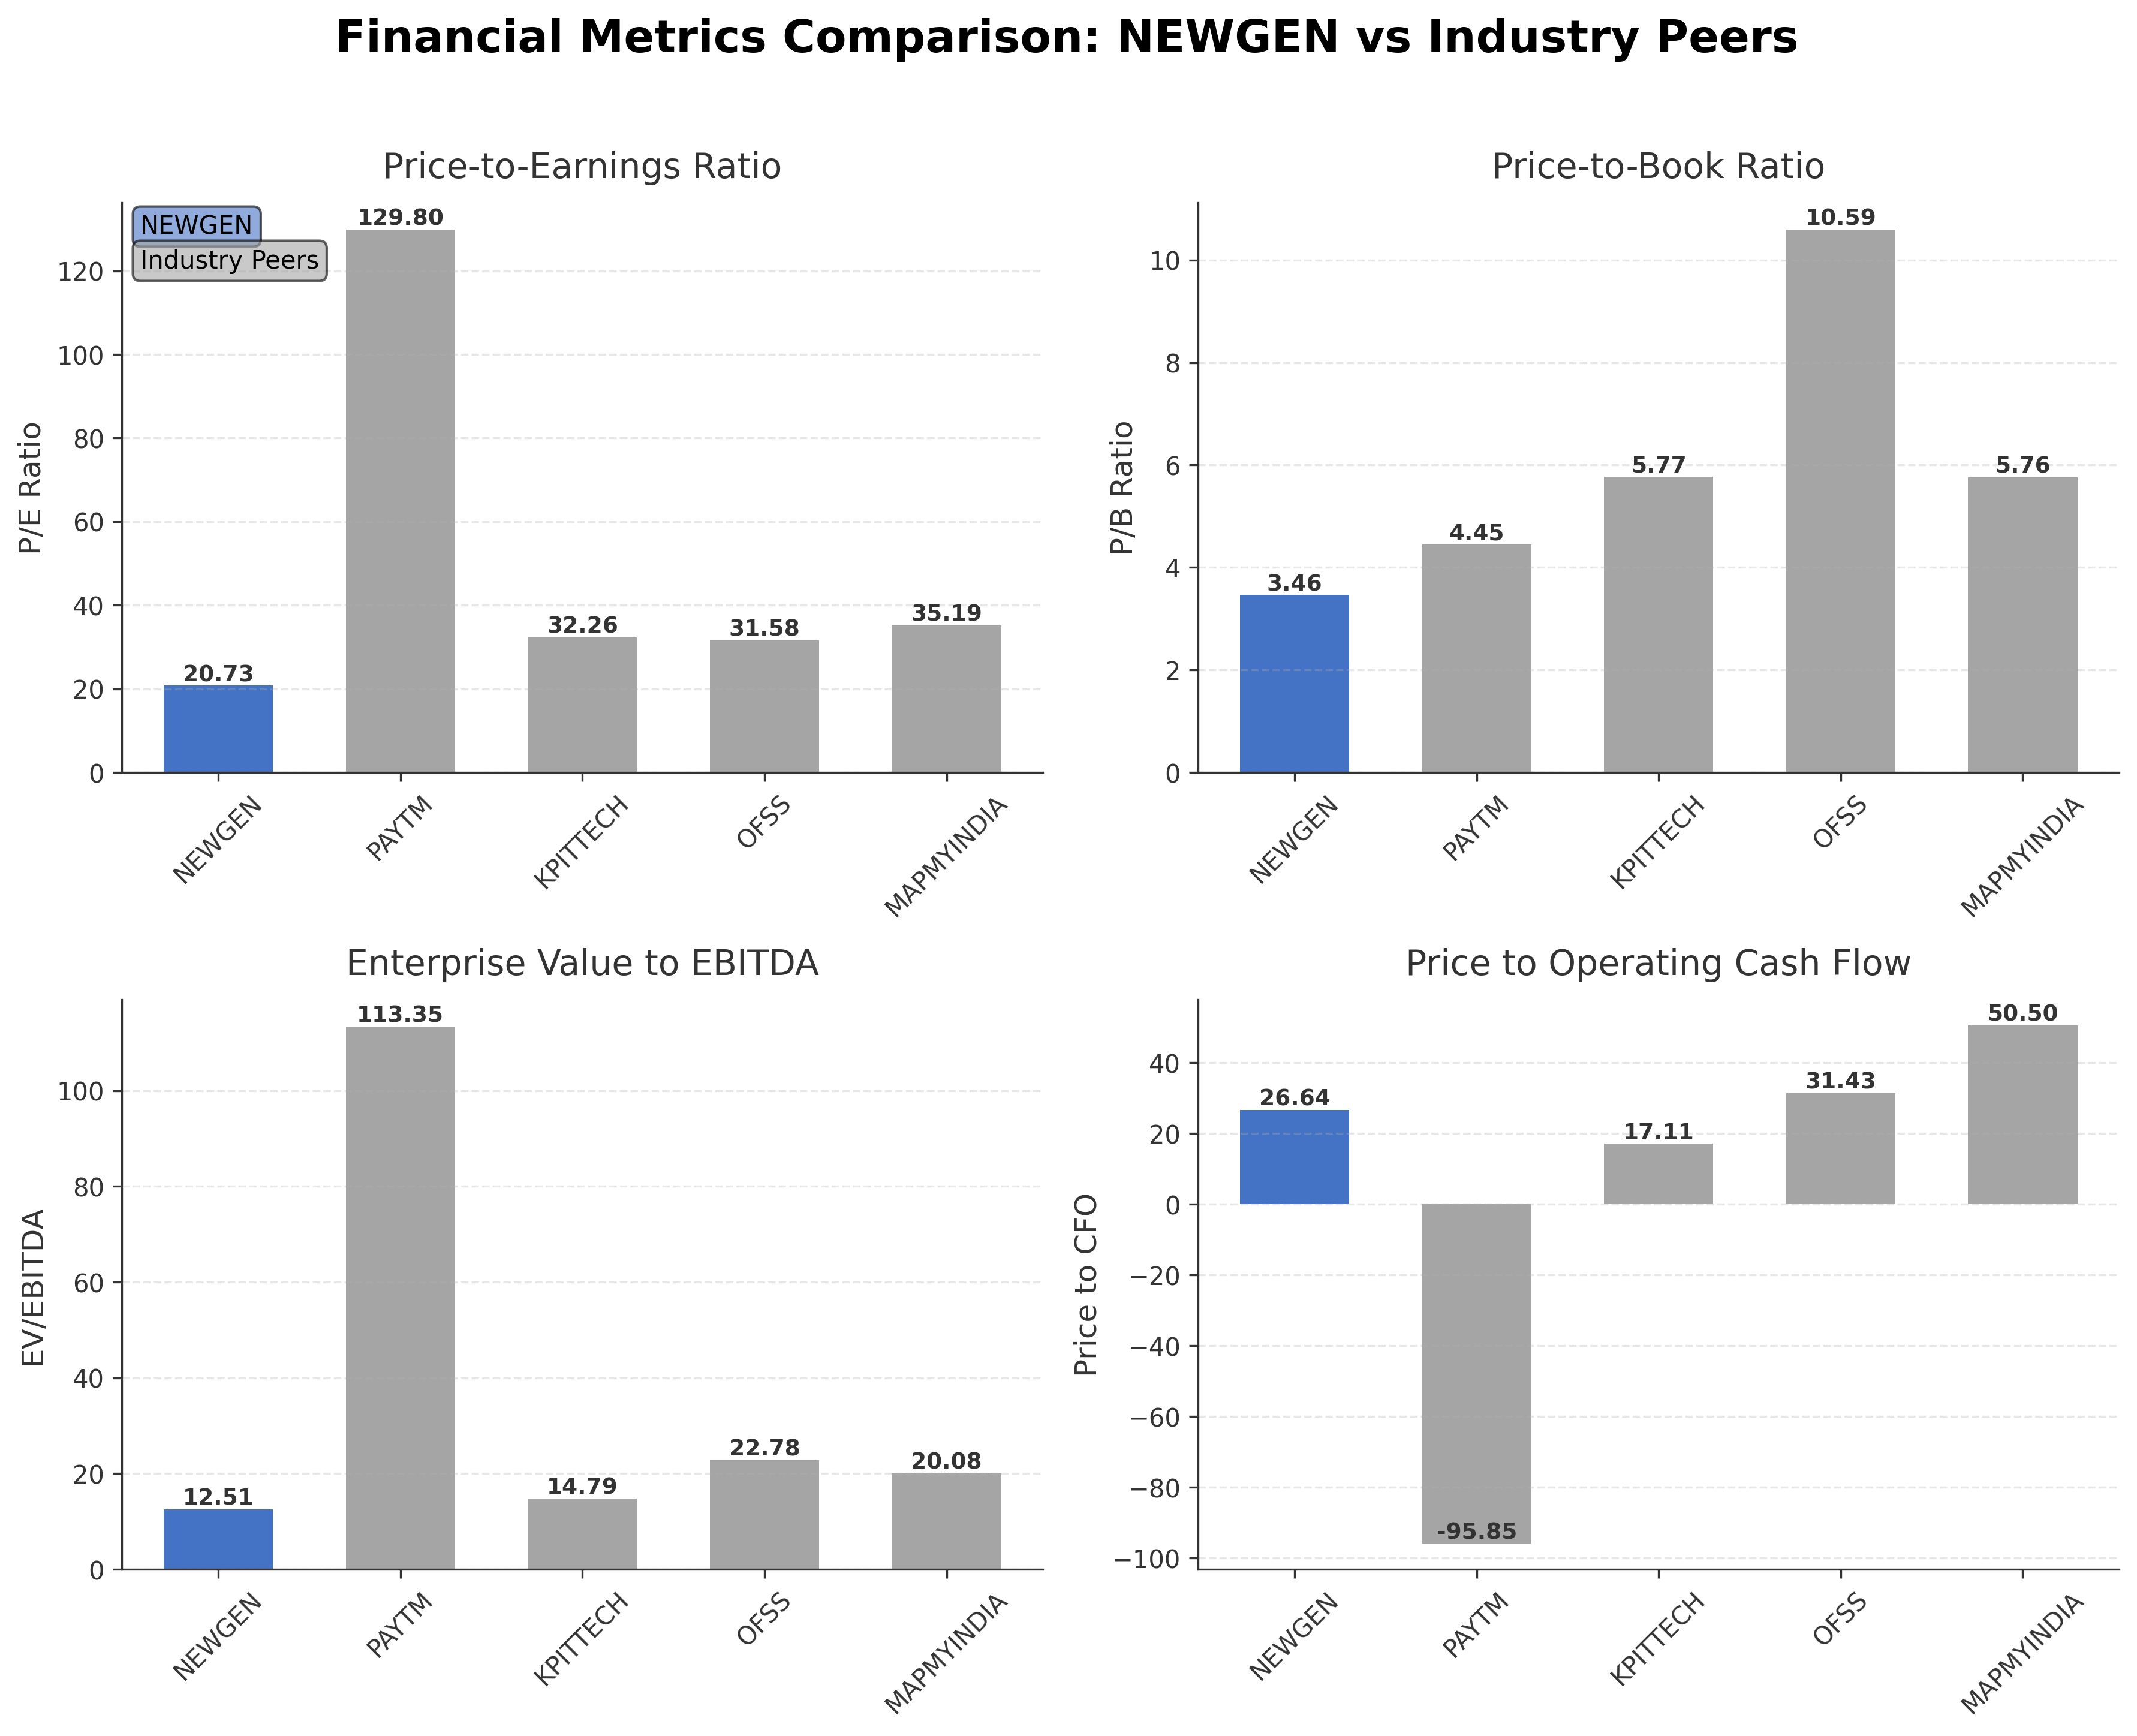
Comparison Analysis: Newgen Software Technologies Ltd. trades at a lower P/E ratio of 20.73 compared to its peers, which range from approximately 32 to 129, indicating a more moderate valuation relative to earnings. Its P/B ratio of 3.46 is also below most peers, suggesting a more conservative price relative to book value. The EV/EBITDA ratio of 12.51 is the lowest among the group, reflecting potentially better operational valuation. Return on equity at 18.25% is competitive, though below Oracle Financial Services Software's 33%, but higher than Paytm’s 0.04%. Price to CFO is positive and moderate, contrasting with Paytm’s negative figure, indicating healthier cash flow metrics. Overall, Newgen presents a balanced valuation and profitability profile within its regional industry peer group.
Financial Metrics Comparison with Peers
Financial Statements
Comprehensive financial data including income, balance sheet, and cash flow metrics
Income Statement
| fiscal_date | 2025-03-31 | 2024-03-31 | 2023-03-31 | 2022-03-31 | 2021-03-31 |
|---|---|---|---|---|---|
| Sales | 14.87B | 12.44B | 9.74B | 7.79B | 6.73B |
| Cost Of Goods | 7.42B | 6.26B | 5.21B | 4.03B | 3.33B |
| Gross Profit | 7.45B | 6.18B | 4.53B | 3.76B | 3.40B |
| Operating Expense Selling General And Administrative | 1.22B | 1.10B | 845.01M | 623.27M | 487.38M |
| Operating Expense Other Operating Expenses | 1.89B | 1.69B | 1.17B | 906.38M | 782.58M |
| Operating Income | 3.44B | 2.60B | 1.90B | 1.77B | 1.74B |
| Non Operating Interest Income | 278.14M | 260.46M | 207.82M | 150.85M | 103.51M |
| Non Operating Interest Expense | 46.66M | 33.59M | 34.02M | 20.71M | 36.95M |
| Pretax Income | 4.02B | 3.04B | 2.17B | 2.03B | 1.81B |
| Income Tax | 867.25M | 526.20M | 402.69M | 392.39M | 546.85M |
| Net Income | 3.15B | 2.52B | 1.77B | 1.64B | 1.26B |
| Eps Basic | 22.53 | 18.02 | 6.36 | 11.82 | 9.14 |
| Eps Diluted | 21.89 | 17.50 | 6.28 | 11.75 | 9.05 |
| Basic Shares Outstanding | 139.93M | 139.63M | 139.22M | 138.84M | 138.38M |
| Diluted Shares Outstanding | 139.93M | 139.63M | 139.22M | 138.84M | 138.38M |
| Ebit | 4.07B | 3.08B | 2.21B | 2.06B | 1.85B |
| Ebitda | 4.09B | 3.19B | 2.43B | 2.21B | 2.03B |
| Net Income Continuous Operations | 4.02B | 3.04B | 2.17B | 2.03B | 1.81B |
| Minority Interests | 0.00 | 0.00 | 0.00 | 0.00 | 0.00 |
| Preferred Stock Dividends | 0.00 | 0.00 | 0.00 | 0.00 | 0.00 |
Source: Financial statements and regulatory filings
Balance Sheet
| fiscal_date | 2025-03-31 | 2024-03-31 | 2023-03-31 | 2022-03-31 | 2021-03-31 |
|---|---|---|---|---|---|
| Cash And Cash Equivalents | 1.04B | 1.25B | 1.08B | 1.04B | 717.12M |
| Accounts Receivable | 5.57B | 4.44B | 3.88B | 2.79B | 2.39B |
| Total Assets | 20.45B | 16.86B | 13.45B | 11.07B | 9.21B |
| Total Liabilities | 5.29B | 4.63B | 3.62B | 2.96B | 2.55B |
| Long Term Debt | 408.12M | 346.43M | 306.19M | 192.37M | 139.14M |
| Shareholders Equity | 15.16B | 12.24B | 9.83B | 8.11B | 6.66B |
Source: Financial statements and regulatory filings
Cash Flow Statement
| fiscal_date | 2025-03-31 | 2024-03-31 | 2023-03-31 | 2022-03-31 | 2021-03-31 |
|---|---|---|---|---|---|
| Operating Activities Net Income | 4.02B | 3.04B | 2.17B | 2.03B | 1.81B |
| Operating Activities Stock Based Compensation | 253.94M | 243.79M | 146.39M | 54.83M | 6.46M |
| Operating Activities Other Non Cash Items | -291.82M | -238.94M | -280.67M | -135.89M | -65.92M |
| Operating Activities Accounts Receivable | -1.85B | -870.67M | -1.20B | -532.43M | 1.93M |
| Operating Activities Other Assets Liabilities | 169.68M | 560.21M | 381.22M | -15.94M | 210.30M |
| Operating Activities Operating Cash Flow | 2.31B | 2.74B | 1.22B | 1.41B | 1.96B |
| Investing Activities Capital Expenditures | -230.88M | -136.32M | -166.92M | -125.83M | -115.88M |
| Investing Activities Purchase Of Investments | -4.78B | -3.67B | -1.85B | -2.27B | -2.84B |
| Investing Activities Sale Of Investments | 2.96B | 1.44B | 925.15M | 1.54B | 1.44B |
| Investing Activities Investing Cash Flow | -2.05B | -2.36B | -1.09B | -923.53M | -1.51B |
| Financing Activities Long Term Debt Payments | -21.99M | -23.42M | -23.43M | 0.00 | N/A |
| Financing Activities Short Term Debt Issuance | -21.99M | -23.42M | -23.43M | 0.00 | -745.32M |
| Financing Activities Common Stock Issuance | 48.52M | 21.26M | 7.27M | 10.74M | 15.39M |
| Financing Activities Common Dividends | -560.86M | -349.56M | -314.80M | -244.53M | -139.91M |
| Financing Activities Financing Cash Flow | -556.32M | -375.15M | -354.38M | -233.79M | -869.84M |
| End Cash Position | 1.04B | 1.25B | 1.08B | 1.04B | 717.12M |
| Free Cash Flow | 1.92B | 2.68B | 1.20B | 1.30B | 2.04B |
| Investing Activities Net Acquisitions | N/A | N/A | 0.00 | -68.86M | 0.00 |
| Financing Activities Other Financing Charges | N/A | N/A | N/A | N/A | N/A |
Source: Financial statements and regulatory filings
Technical Analysis
Key Insights
- The current trend shows mixed momentum with the stock trading above the 50-day moving average (~₹460) but below the 200-day moving average (~₹709), indicating short-term strength but longer-term resistance.
- Key support levels are identified near ₹401, the 52-week low, while resistance is observed around ₹460 and further near the 200-day moving average at ₹709.
- The stock price is positioned between major moving averages, suggesting consolidation; it is above the 10-day and 50-day averages but below the 200-day average.
- Momentum indicators show moderate readings: RSI is neutral, MACD indicates a lack of strong directional momentum, and stochastic oscillators suggest no immediate overbought or oversold conditions.
- Multi-timeframe analysis reveals daily charts showing sideways movement, weekly charts indicating a potential base formation, and monthly charts reflecting a longer-term downtrend from the 52-week high.
- Potential market scenarios include a continuation of consolidation with possible upward movement if the price breaks above the 200-day moving average, or a retest of support near ₹401 if downward pressure increases.
Trending News
No trending news available.
Recent Updates
News Summary
As of the most recent data, no relevant recent business updates or news articles were available for Newgen Software Technologies Ltd. There have been no reported earnings announcements, leadership changes, strategic partnerships, regulatory approvals, or significant industry events impacting the company within the last three months. The absence of recent news suggests a period of operational stability without material public disclosures affecting the stock or business outlook.
News Sentiment
The overall sentiment from the lack of recent updates is neutral, reflecting no new developments that would materially influence market perception or investor sentiment. The company appears to be in a steady state with no emerging positive or negative catalysts reported in the recent period.
Source List
Analytical Overview
Analysis Summary
Newgen’s valuation metrics, including a trailing P/E of 20.7 and forward P/E of 14.5, are below industry averages, indicating a relatively attractive valuation compared to peers with higher multiples. The company’s PEG ratio is negative, reflecting recent earnings decline, which warrants cautious interpretation. Revenue growth is moderate at 5.3% quarterly, supported by positive operating and free cash flow trends, demonstrating a stable growth trajectory. Financial health is strong with a low debt-to-equity ratio of 0.022 and a high current ratio of 3.66, indicating liquidity and low leverage. Sector-specific challenges include competitive pressures in the Indian software infrastructure market and regulatory uncertainties, while opportunities arise from increasing digital transformation demand across industries. India-specific factors such as evolving regulatory frameworks and growing technology adoption influence the company’s market positioning and growth prospects.
Overall Business and Market Assessment
Supporting Factors: solid profitability metrics with an 18.3% ROE, strong liquidity supported by INR 11.1 billion in cash, and a moderate valuation relative to peers
Risk Factors: the slight negative earnings growth trend and competitive dynamics within the technology sector
SWOT Analysis
Strengths
- Strong profitability with a net profit margin of 19.1%.
- Robust liquidity position with a current ratio of 3.66.
- Low debt levels reflected by a debt-to-equity ratio of 0.022.
- Market leadership in digital transformation software solutions.
Weaknesses
- Negative quarterly earnings growth year-over-year at -1.9%.
- High price volatility with a 52-week range from ₹401 to ₹1336.
- Moderate institutional ownership at 9.52%, limiting external influence.
- PEG ratio is negative, indicating recent earnings challenges.
Opportunities
- Growing demand for digital transformation across banking and government sectors.
- Expansion potential in emerging markets within India and Asia.
- Technological advancements enabling new product offerings.
- Increasing adoption of cloud-based infrastructure solutions.
Threats
- Intense competition in the software infrastructure industry.
- Regulatory changes impacting technology and data management.
- Macroeconomic uncertainties affecting IT spending.
- Potential disruption from emerging technologies and startups.
Company Description
Newgen Software Technologies Ltd. is a premier provider of business software solutions that enhance enterprise-level operations. Specializing in digital transformation, Newgen offers an array of products designed to streamline business processes, manage processes and content, and foster collaboration. The company's flagship offerings include its Business Process Management (BPM), Enterprise Content Management (ECM), and Customer Communication Management (CCM) suites. Headquartered in India, Newgen Software extends its expertise to a range of industries such as banking, government, insurance, and shared services. These sectors benefit from Newgen's solutions, optimizing their business operations and achieving greater agility. In the financial market, Newgen Software Technologies Ltd. holds significance by driving the digitalization of processes across critical sectors, thus influencing operational efficiencies and customer service standards. By leveraging robust technology and a comprehensive suite of software solutions, Newgen continues to play a vital role in helping organizations transition to digital ecosystems, thus keeping them competitive in a rapidly evolving market landscape.