

Newgen Software Technologies Ltd (NEWGEN)
Stock Analysis Report
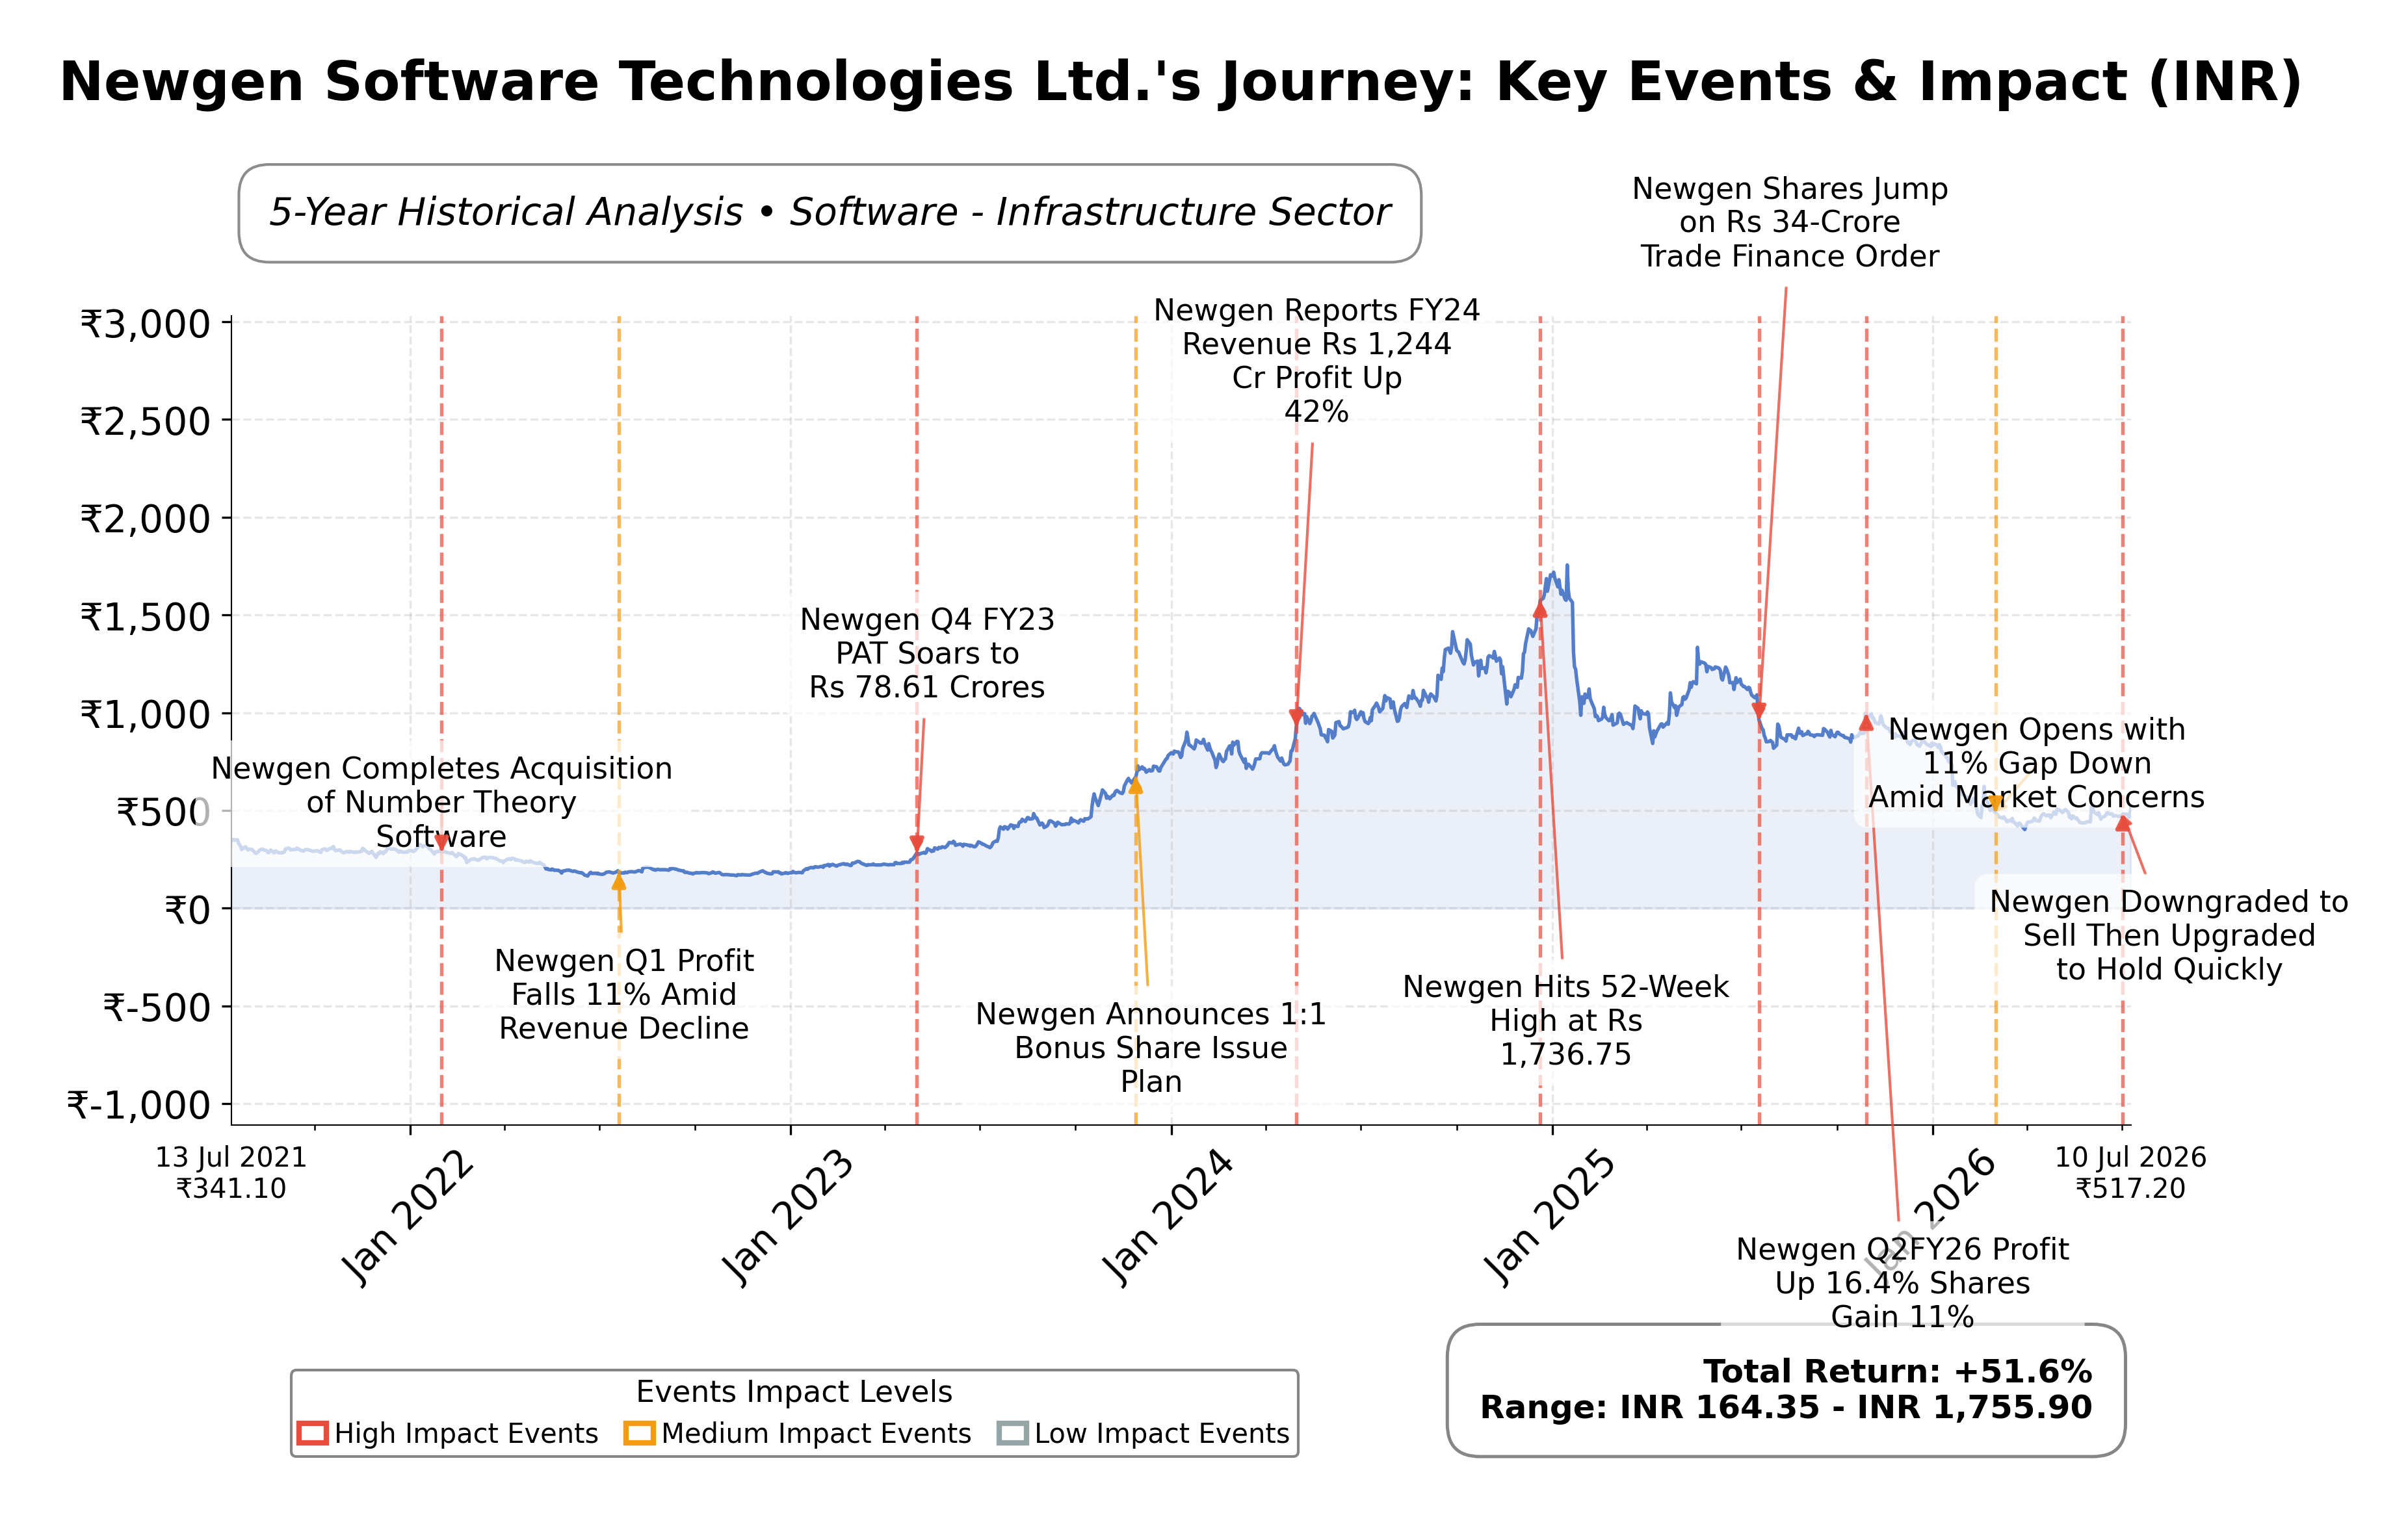
Stock Journey
Key Positives and Key Risks
Pros
- Strong profitability with a net profit margin of 19.1% and ROE of 18.25%, indicating efficient capital use.
- Robust liquidity position with total cash exceeding INR 11.14 billion and a current ratio of 3.66.
- Reasonable valuation with a forward P/E of 16.23, below the industry average P/E of 22.29.
Cons
- Significant downside risk of 46.9% from the 52-week high price of ₹1109.90 to the current price of ₹590.50.
- Decline in institutional ownership during the March 2026 quarter, suggesting moderated professional investor interest.
- Quarterly earnings growth declined by 1.9% year-over-year, indicating potential near-term profitability pressure.
Disclosure: This information is for general awareness and does not constitute investment advice
Report Summary
Newgen Software Technologies Ltd. operates as a leading provider of business software solutions focused on digital transformation within the technology sector. Listed on the National Stock Exchange of India (NSE), the company specializes in Business Process Management (BPM), Enterprise Content Management (ECM), and Customer Communication Management (CCM) products. It serves diverse industries including banking, government, insurance, and shared services, positioning itself as a key enabler of enterprise-level operational efficiency and digitalization in India and beyond.
Financially, Newgen reported trailing twelve months (TTM) revenue of approximately INR 15.74 billion, with a gross margin near 49.7%, an operating margin of 33.6%, and a net profit margin of 19.1%. The company’s return on equity (ROE) stands at 18.25%, while return on assets (ROA) is 10.54%, reflecting solid profitability and efficient asset utilization. The return on invested capital (ROIC) aligns with these metrics, underscoring effective capital deployment. Quarterly revenue growth was 5.3%, though quarterly earnings declined slightly by 1.9% year-over-year.
Valuation metrics indicate a trailing price-to-earnings (P/E) ratio of 22.29 and a forward P/E of 16.23, with a price-to-book (P/B) ratio of 3.76 and an enterprise value to EBITDA (EV/EBITDA) multiple of 14.17. The market capitalization is approximately INR 73.01 billion. The stock currently trades at INR 590.50, well below its 52-week high of INR 1109.90 and above the low of INR 401.05, suggesting a significant downside risk of 46.9% from the high. These valuation figures position the stock moderately relative to its fundamentals and industry peers.
Key strengths include strong cash reserves of over INR 11.14 billion, low total debt of approximately INR 393.6 million, and a robust current ratio of 3.66, indicating strong liquidity. The company’s market leadership in digital transformation software and recent strategic leadership appointments, including a new CEO and Chief Growth Officer, highlight proactive management actions. Risks involve moderate institutional ownership dilution, sector competition, and macroeconomic factors affecting IT spending. Recent share price rallies and volume spikes reflect renewed market interest amid these developments.
Technically, the stock shows mixed signals with a recent shift toward bearish momentum despite some bullish monthly indicators. It trades above several key moving averages, indicating constructive medium-term trends, but caution is warranted given volatility and price action patterns. Overall, the data suggests a watchful stance with potential for accumulation in favorable conditions, balanced against near-term risks and valuation considerations.
Company and Industry Overview
Company Basics
Price Performance
Company Size
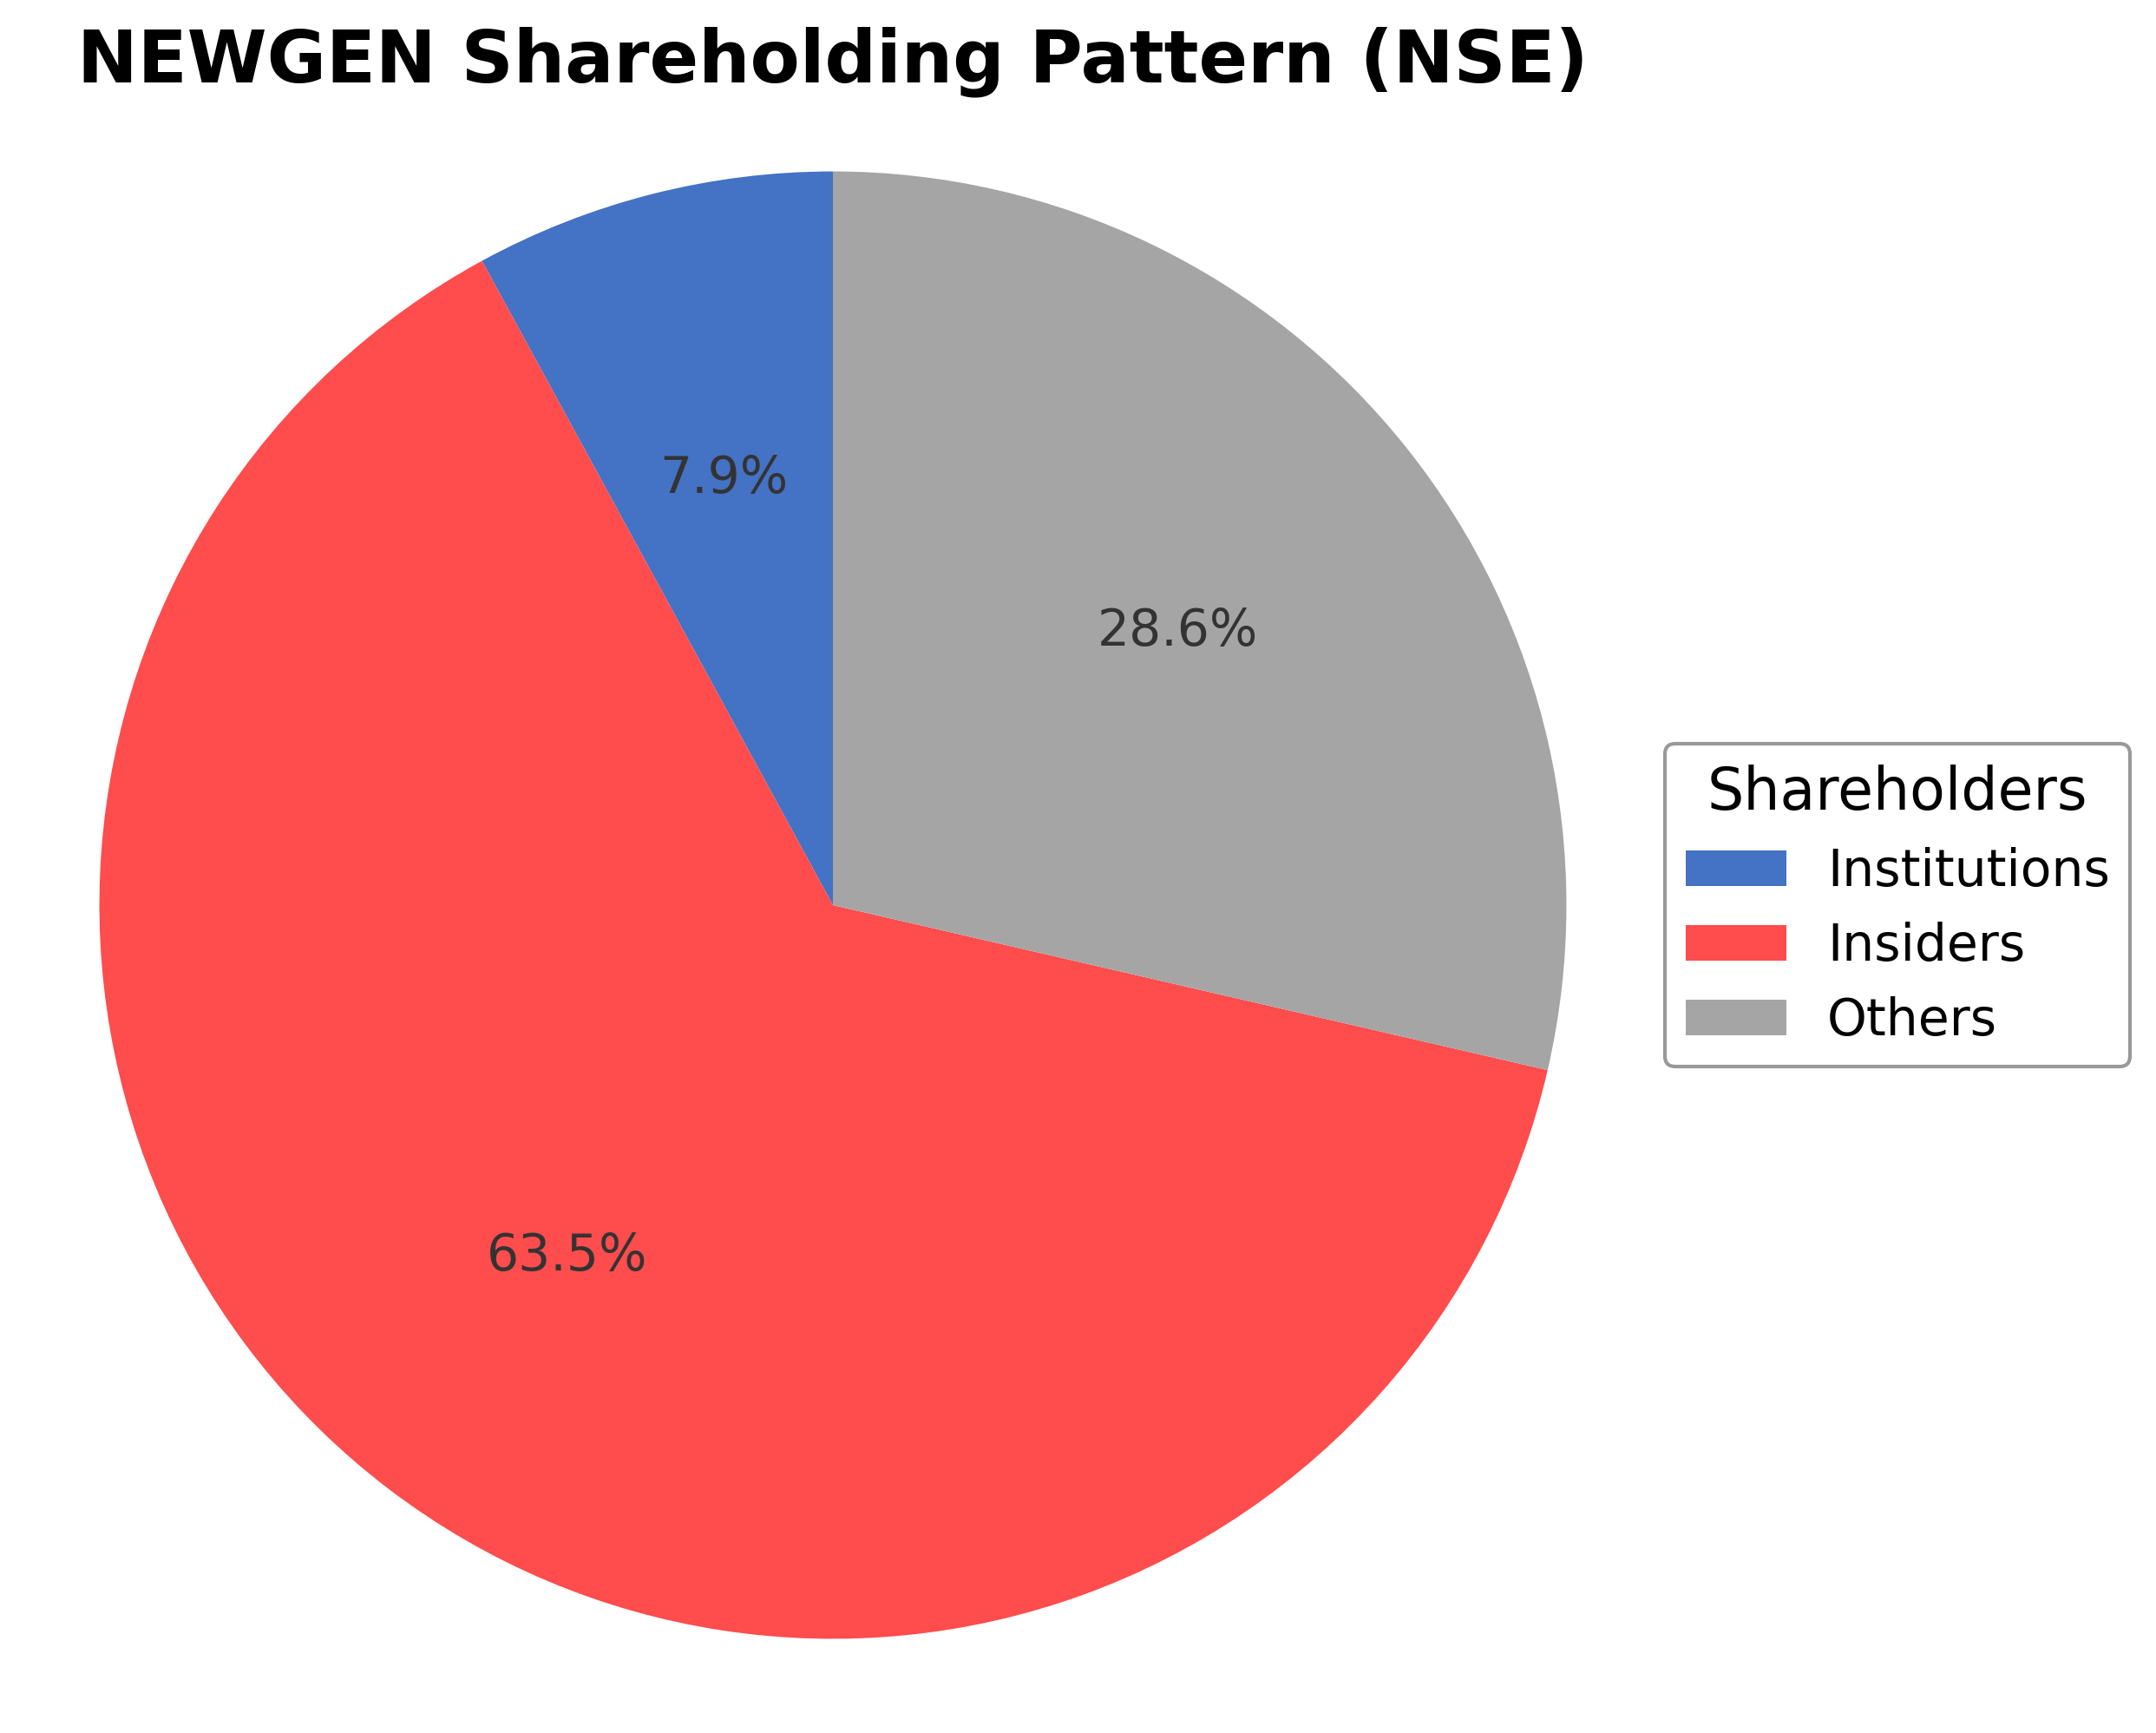
Shareholding Pattern
Sector and Industry Analysis
The software sector, particularly the digital transformation and enterprise software market, has experienced robust growth driven by increasing demand for automation, cloud adoption, and AI integration. Market size has expanded significantly as businesses across banking, healthcare, government, and telecom sectors seek to optimize workflows and customer engagement. Key players include established firms offering business process management, enterprise content management, and customer communication solutions, with Newgen Software Technologies positioned as a notable provider in this space.
Industry trends highlight a shift towards AI-enabled platforms and low-code application development to accelerate deployment and customization of business solutions. Competitive dynamics are shaped by innovation in intelligent process automation and omnichannel customer engagement, creating barriers to entry due to the need for advanced technology and domain expertise. Companies differentiate themselves through integrated platforms that combine content, process, and customer management, targeting diverse industries with tailored digital transformation offerings.
The regulatory landscape involves data privacy, cybersecurity, and industry-specific compliance requirements that influence software development and deployment strategies. Regulations such as GDPR in Europe and various data protection laws globally necessitate robust security and governance features in enterprise software. Ongoing regulatory scrutiny and evolving standards are expected to drive continuous innovation and adaptation within the sector, impacting product design and market expansion strategies.
Note: Analysis synthesized from industry research, market reports, and regulatory filings. Information is subject to change based on market conditions.
Financial Ratios Dashboard
Illustrative Scenario Analysis
DCF Assumptions:
Method: Two-Stage EPS-Priority Model
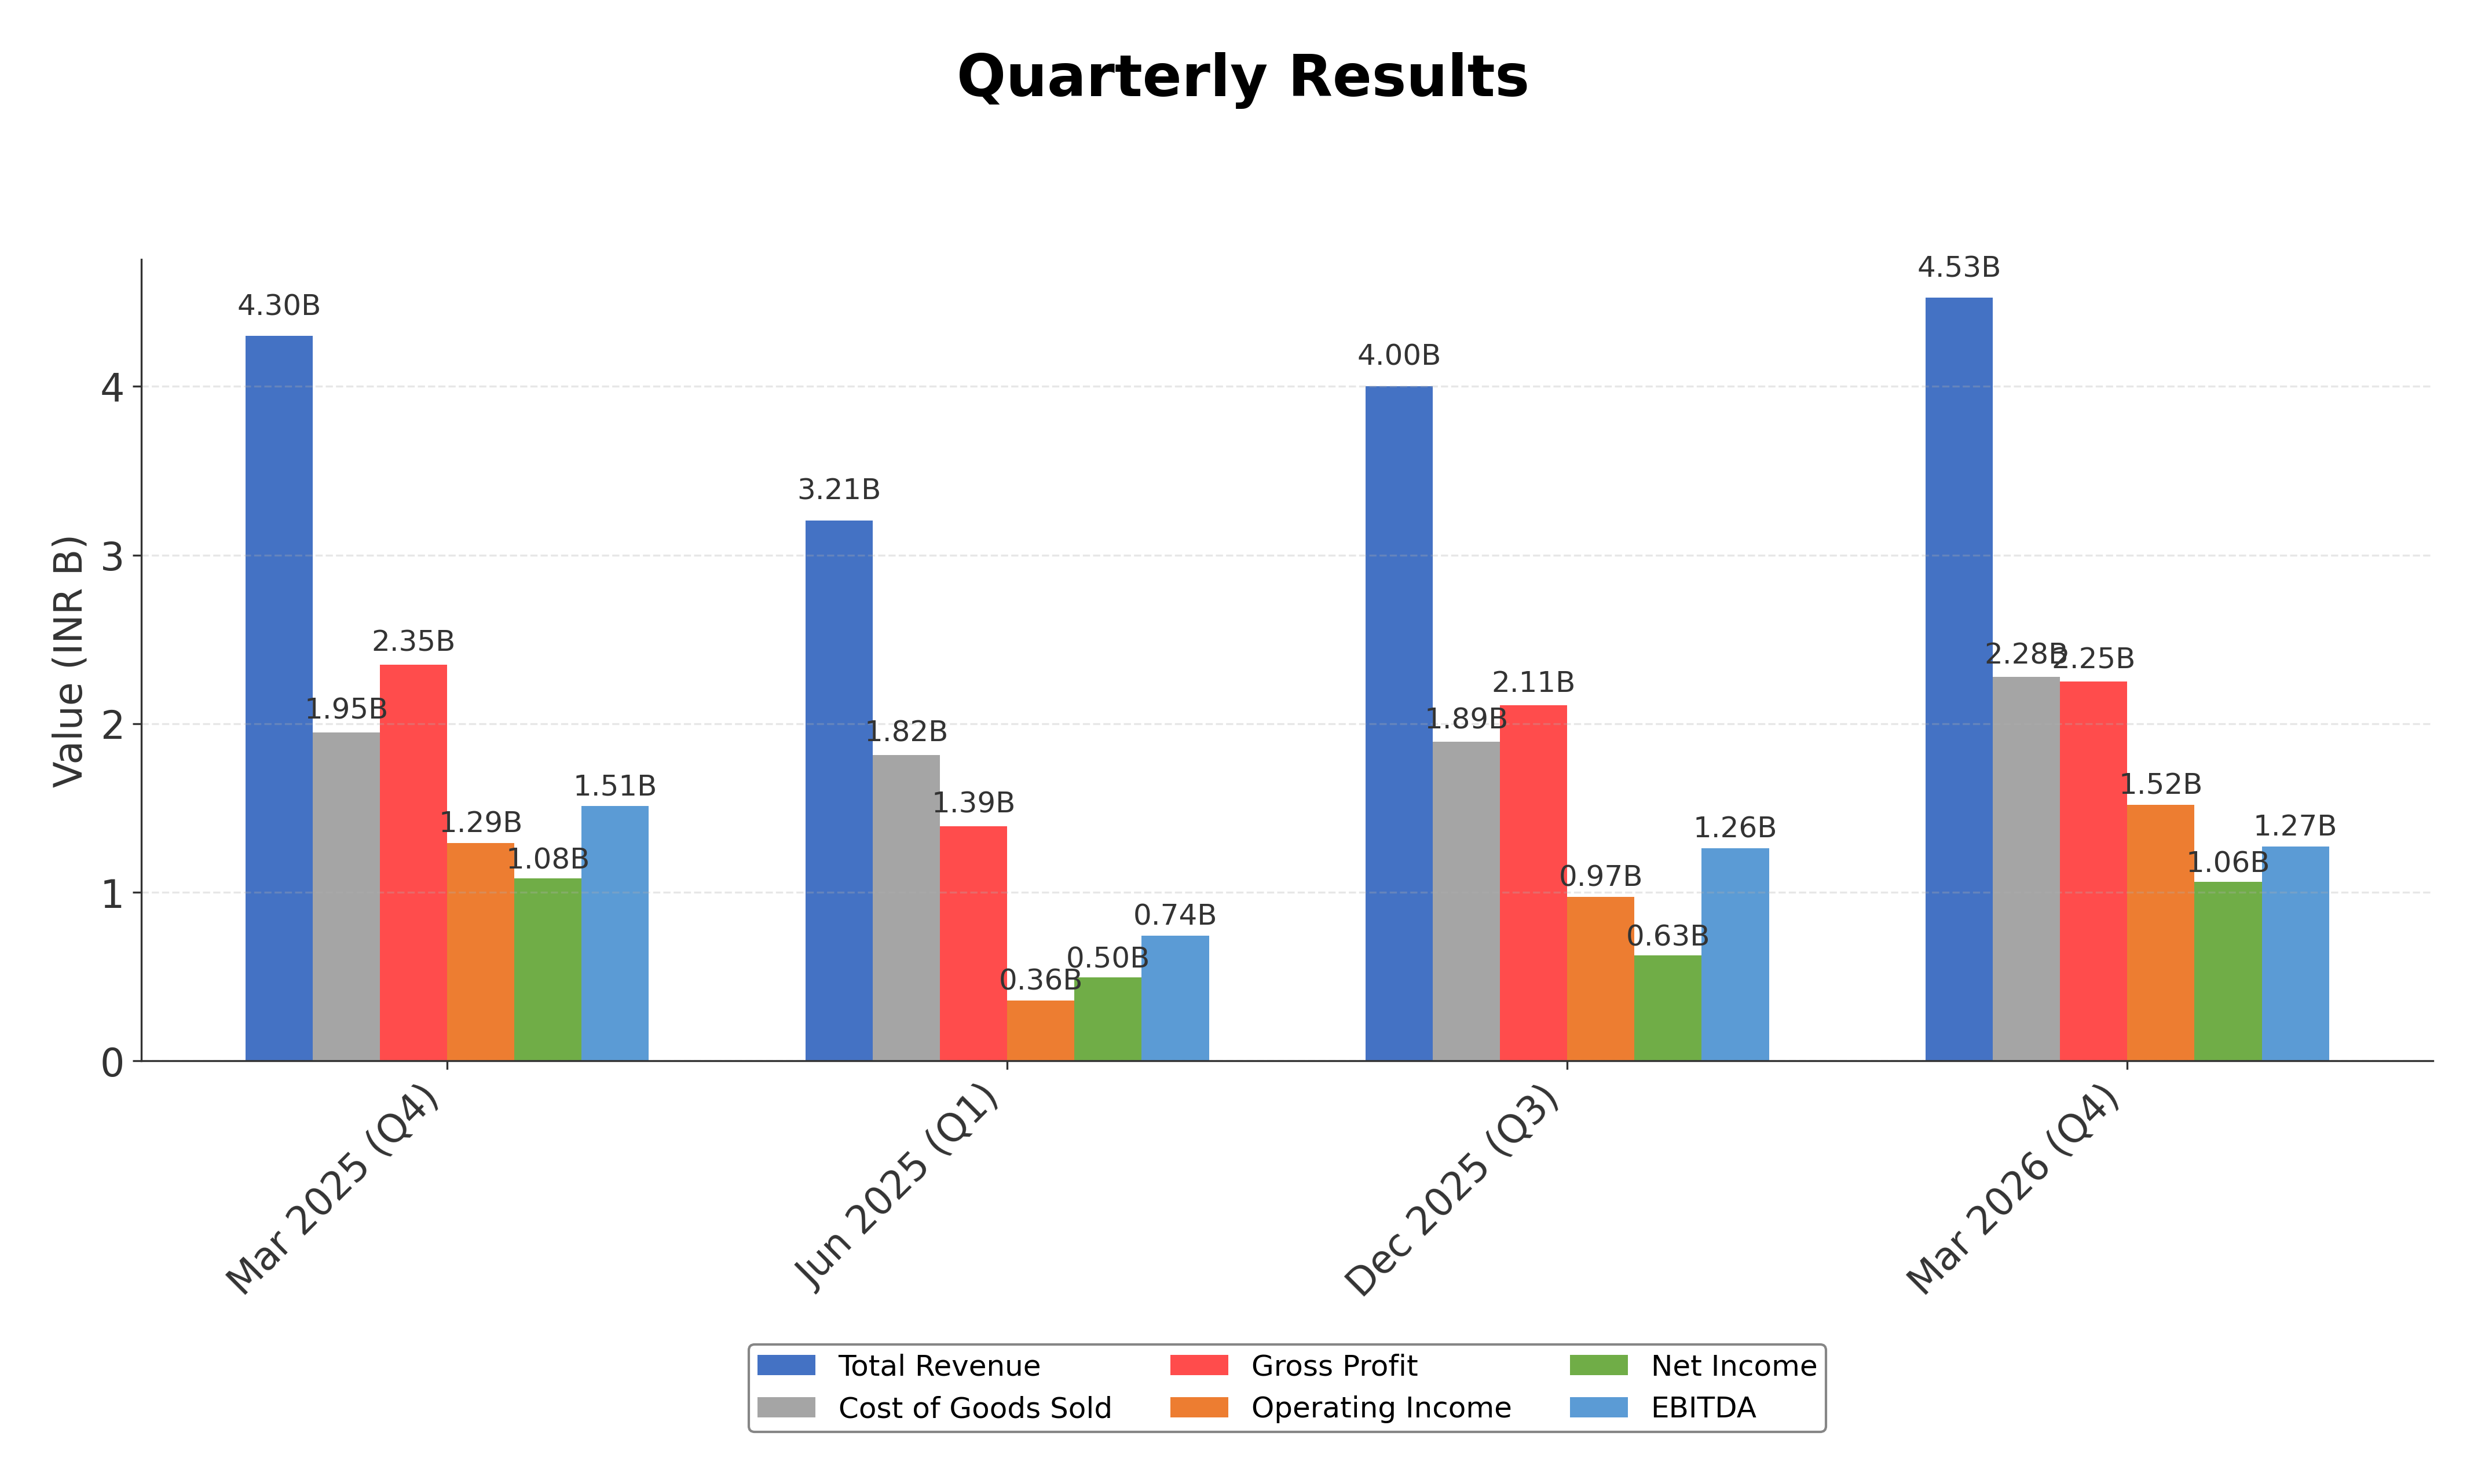
Financials
Peer Analysis
| Company Name | Market Cap | P/E Ratio | P/B Ratio | EV/EBITDA | Price to CFO |
|---|---|---|---|---|---|
| Newgen Software Technologies Ltd. | ₹73.01B | 22.29 | 3.76 | 14.17 | 31.49 |
| Kpit Technologies Ltd. | ₹152.92B | 23.54 | 4.21 | 10.69 | 12.80 |
| One 97 Communications Ltd. | ₹859.67B | 147.54 | 5.05 | 132.57 | -115.70 |
| Oracle Financial Services Software Limited | ₹1.01T | 38.61 | 12.96 | 27.76 | 38.45 |
| Ce Info Systems Ltd. | ₹59.33B | 44.25 | 6.55 | 31.92 | 63.57 |
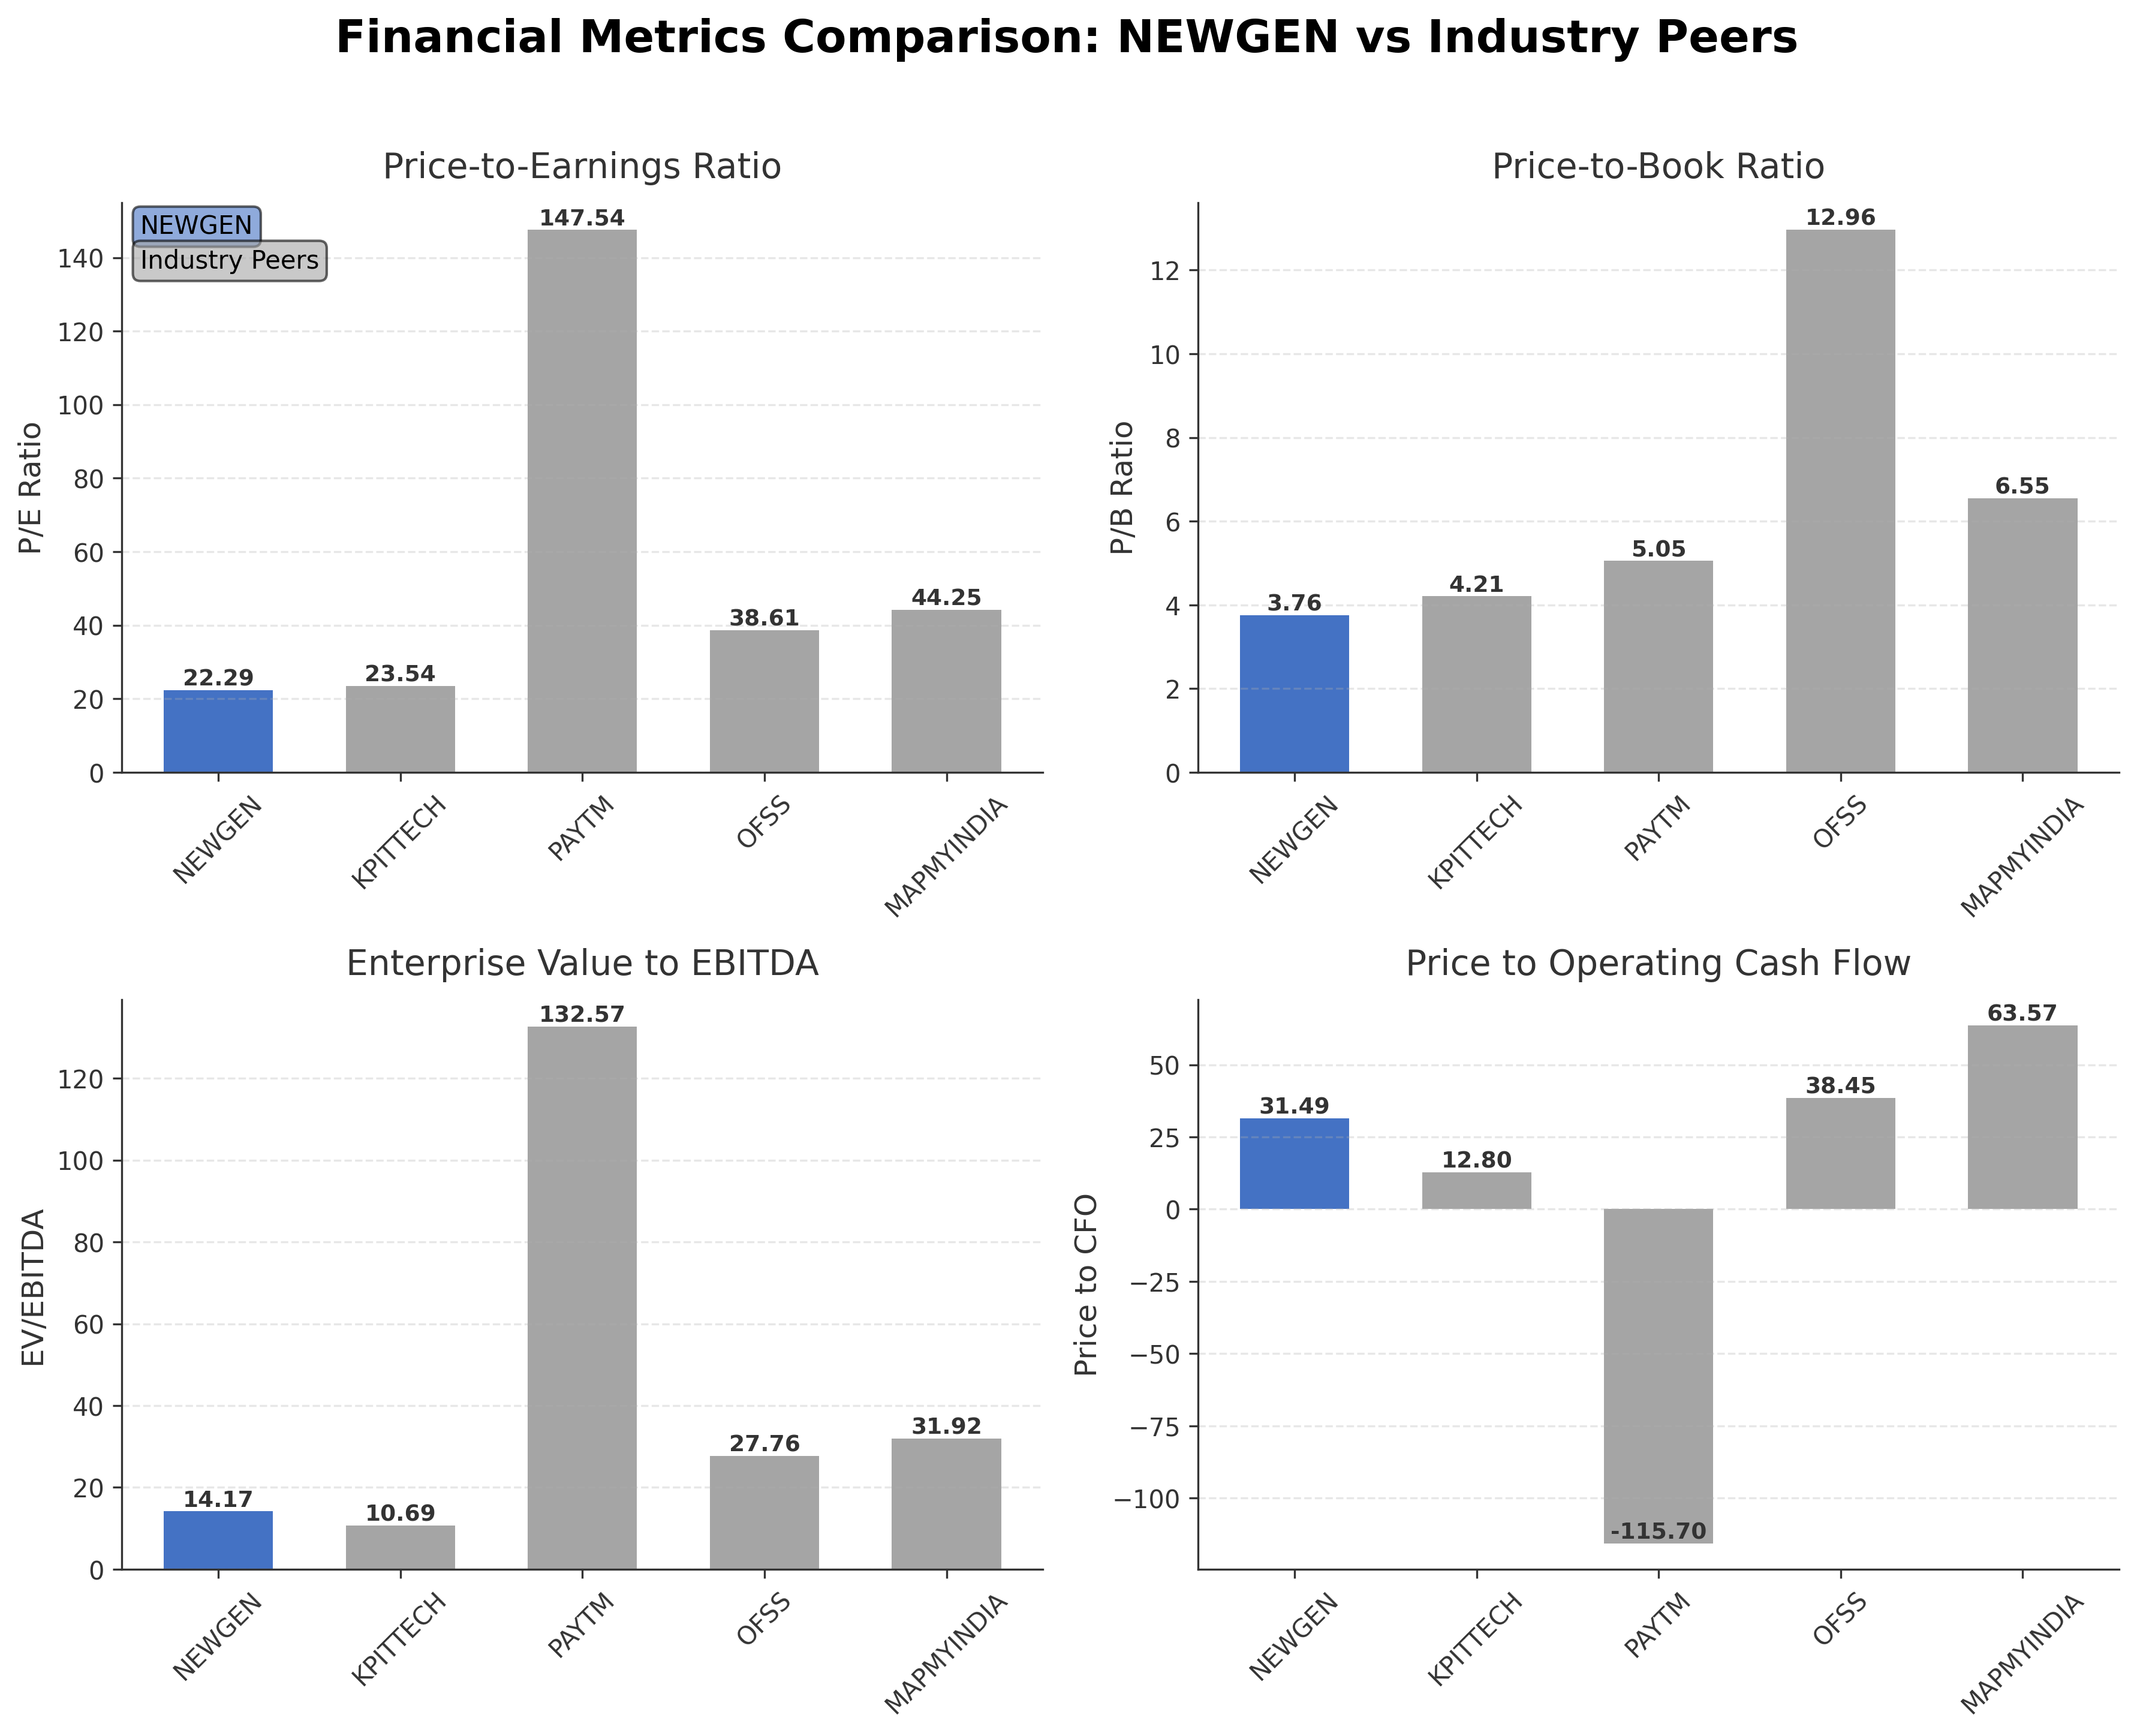
Comparison Analysis: Newgen Software Technologies Ltd. trades at a moderate valuation relative to its peers, with a P/E ratio of 22.29 which is lower than several larger competitors such as Oracle Financial Services Software Limited (38.61) and Ce Info Systems Ltd. (44.25), but higher than Kpit Technologies Ltd. (23.54). Its P/B ratio of 3.76 is comparatively lower than OFSS's 12.96 and MAPMYINDIA's 6.55, indicating a more reasonable book value pricing. The EV/EBITDA multiple of 14.17 places Newgen in the mid-range among peers, reflecting balanced operational profitability. Return on equity at 18.25% is solid but below OFSS’s 32.61%, suggesting room for efficiency improvements. Price to CFO at 31.49 is higher than Kpit Technologies’ 12.80, indicating relatively higher cash flow valuation. Overall, Newgen presents a competitive profile with moderate valuation and profitability metrics within its industry peer group.
Financial Metrics Comparison with Peers
Financial Statements
Comprehensive financial data including income, balance sheet, and cash flow metrics
Income Statement
| fiscal_date | 2026-03-31 | 2025-03-31 | 2024-03-31 | 2023-03-31 | 2022-03-31 |
|---|---|---|---|---|---|
| Sales | 15.74B | 14.87B | 12.44B | 9.74B | 7.79B |
| Cost Of Goods | 7.87B | 7.42B | 6.26B | 5.21B | 4.03B |
| Gross Profit | 7.87B | 7.45B | 6.18B | 4.53B | 3.76B |
| Operating Expense Selling General And Administrative | 1.21B | 1.22B | 1.10B | 845.01M | 623.27M |
| Operating Expense Other Operating Expenses | 2.20B | 1.89B | 1.69B | 1.17B | 906.38M |
| Operating Income | 3.78B | 3.44B | 2.60B | 1.90B | 1.77B |
| Non Operating Interest Income | 297.00M | 278.14M | 260.46M | 207.82M | 150.85M |
| Non Operating Interest Expense | 44.66M | 46.66M | 33.59M | 34.02M | 20.71M |
| Pretax Income | 3.87B | 4.02B | 3.04B | 2.17B | 2.03B |
| Income Tax | 867.14M | 867.25M | 526.20M | 402.69M | 392.39M |
| Net Income | 3.01B | 3.15B | 2.52B | 1.77B | 1.64B |
| Eps Basic | 21.38 | 22.53 | 18.02 | 6.36 | 11.82 |
| Eps Diluted | 21.24 | 21.89 | 17.50 | 6.28 | 11.75 |
| Basic Shares Outstanding | 140.61M | 139.93M | 139.63M | 139.22M | 138.84M |
| Diluted Shares Outstanding | 140.61M | 139.93M | 139.63M | 139.22M | 138.84M |
| Ebit | 3.92B | 4.07B | 3.08B | 2.21B | 2.06B |
| Ebitda | 4.44B | 4.09B | 3.19B | 2.43B | 2.21B |
| Net Income Continuous Operations | 3.87B | 4.02B | 3.04B | 2.17B | 2.03B |
| Preferred Stock Dividends | 0.00 | 0.00 | 0.00 | 0.00 | 0.00 |
| Minority Interests | N/A | 0.00 | 0.00 | 0.00 | 0.00 |
Data provided by Twelve Data
Balance Sheet
| fiscal_date | 2026-03-31 | 2025-03-31 | 2024-03-31 | 2023-03-31 | 2022-03-31 |
|---|---|---|---|---|---|
| Cash And Cash Equivalents | 1.04B | 1.04B | 1.25B | 1.08B | 1.04B |
| Accounts Receivable | 7.08B | 5.57B | 4.44B | 3.88B | 2.79B |
| Total Assets | 24.42B | 20.45B | 16.86B | 13.45B | 11.07B |
| Total Liabilities | 6.65B | 5.29B | 4.63B | 3.62B | 2.96B |
| Long Term Debt | 263.76M | 408.12M | 346.43M | 306.19M | 192.37M |
| Shareholders Equity | 17.77B | 15.16B | 12.24B | 9.83B | 8.11B |
Data provided by Twelve Data
Cash Flow Statement
| fiscal_date | 2026-03-31 | 2025-03-31 | 2024-03-31 | 2023-03-31 | 2022-03-31 |
|---|---|---|---|---|---|
| Operating Activities Net Income | 3.87B | 4.02B | 3.04B | 2.17B | 2.03B |
| Operating Activities Stock Based Compensation | -45.31M | 253.94M | 243.79M | 146.39M | 54.83M |
| Operating Activities Other Non Cash Items | -297.56M | -291.82M | -238.94M | -280.67M | -135.89M |
| Operating Activities Accounts Receivable | -1.74B | -1.85B | -870.67M | -1.20B | -532.43M |
| Operating Activities Other Assets Liabilities | 581.93M | 169.68M | 560.21M | 381.22M | -15.94M |
| Operating Activities Operating Cash Flow | 2.37B | 2.31B | 2.74B | 1.22B | 1.41B |
| Investing Activities Capital Expenditures | -86.91M | -230.88M | -136.32M | -166.92M | -125.83M |
| Investing Activities Purchase Of Investments | -5.38B | -4.78B | -3.67B | -1.85B | -2.27B |
| Investing Activities Sale Of Investments | 3.54B | 2.96B | 1.44B | 925.15M | 1.54B |
| Investing Activities Investing Cash Flow | -1.93B | -2.05B | -2.36B | -1.09B | -923.53M |
| Financing Activities Long Term Debt Payments | 0.00 | -21.99M | -23.42M | -23.43M | 0.00 |
| Financing Activities Short Term Debt Issuance | 0.00 | -21.99M | -23.42M | -23.43M | 0.00 |
| Financing Activities Common Stock Issuance | 82.61M | 48.52M | 21.26M | 7.27M | 10.74M |
| Financing Activities Common Dividends | -708.24M | -560.86M | -349.56M | -314.80M | -244.53M |
| Financing Activities Financing Cash Flow | -625.63M | -556.32M | -375.15M | -354.38M | -233.79M |
| End Cash Position | 1.04B | 1.04B | 1.25B | 1.08B | 1.04B |
| Free Cash Flow | 2.22B | 1.92B | 2.68B | 1.20B | 1.30B |
| Investing Activities Net Acquisitions | N/A | N/A | N/A | 0.00 | -68.86M |
Data provided by Twelve Data
Technical Analysis
Key Insights
- The current trend shows a recent shift from sideways to mildly bearish momentum, with price action exhibiting volatility but maintaining some upward support.
- Key support levels are identified near ₹470 and ₹400, while resistance is observed around ₹600 and the 52-week high of ₹1109.90.
- The stock trades above the 10-day and 50-day moving averages but remains below the 200-day moving average, indicating mixed medium-term momentum.
- Momentum indicators such as RSI are neutral, MACD shows weakening bullish momentum, and stochastic oscillators suggest potential near-term consolidation.
- Daily and weekly timeframes reflect cautious price action with some bullish signals on monthly charts, indicating possible stabilization after recent declines.
- Market scenarios include potential consolidation around current levels with a possibility of recovery if support holds, or further downside if bearish momentum intensifies.
Trending News
1. Headline: Q1 Results This Week: Reliance, HCLTech, Wipro, Tech Mahindra, BHEL Among 140+ Companies Reporting
Summary: Investors will closely track management commentary on demand trends, margin outlook, deal wins, capital expenditure, and sector-specific headwinds for clues on corporate earnings and the broader market outlook.
Sentiment: neutral
2. Headline: Newgen strengthens leadership to accelerate global growth and its intelligent enterprise strategy -
Summary: Newgen Software Technologies Limited has announced two strategic leadership appointments. The first is a new CEO, and the second is a new position, the
Sentiment: positive
3. Headline: Newgen Software share rally a dead cat bounce? Views on Kalyan Jewellers, Senco Gold, NLC India - BusinessToday
Summary: Market expert Pradip Halder on ... sell the stock on rise. In an exclusive interview to Business Today Television (BTTV), the founder and CEO at PHD Capital, suggested staying put on NLC India Ltd and Senco Gold Ltd. He sees further upside on Kalyan Jewellers India Ltd. ... Replying to a query by a viewer Jatin Dave, who held 1,000 Newgen Software Technologies Ltd shares ...
Sentiment: positive
Summary: Zensar Technologies jumped 15.53 per cent to hit a day high of Rs 516.30, while Newgen Software rallied 14.91 per cent to Rs 542.95.
Sentiment: positive
5. Headline: Volumes jump at Newgen Software Technologies Ltd counter | Capital Market News - Business Standard
Summary: Strait of HormuzWest Asia CrisisIPL ... 50Latest News ... Newgen Software Technologies Ltd saw volume of 234.04 lakh shares by 14:14 IST on NSE, a 38.04 fold spurt over two-week average daily volume of 6.15 lakh shares · Elecon Engineering Company Ltd, Mangalore Refinery And Petrochemicals Ltd, Central Depository Services (India) Ltd, Bata India Ltd are among the other stocks to see a surge ...
Sentiment: positive
Powered by Brave
Recent Updates
News Summary
As of 2026-07-10. Newgen Software Technologies Ltd. has recently undergone significant leadership restructuring with the appointment of Tarun Nandwani as CEO and the creation of a Chief Growth Officer role, aimed at accelerating global expansion and advancing its intelligent enterprise strategy. This leadership transition follows the resignation of the previous CEO effective August 31, 2026. Concurrently, the company’s shares surged 15% amid a broad rally in the IT sector, reflecting positive market response to these strategic changes. Despite the rally, institutional ownership declined in the March 2026 quarter, with foreign institutional investors and mutual funds reducing their stakes. Investors are awaiting the Q1 FY27 earnings report scheduled for July 16, which is expected to provide further clarity on business outlook and growth prospects.
News Sentiment
The overall sentiment from recent updates is predominantly positive, driven by leadership changes that signal strategic intent to enhance growth and competitiveness. The significant share price rally and volume surge underscore renewed investor interest and confidence. However, the reduction in institutional ownership introduces a note of caution, reflecting some moderation in professional investor participation. This mixed dynamic suggests optimism tempered by prudent market evaluation ahead of upcoming quarterly results. The balanced sentiment highlights both the potential for growth and the need for careful monitoring of operational execution and market conditions.
Source List
- https://www.enterprisetimes.co.uk/2026/07/10/newgen-strengthens-leadership-to-accelerate-global-growth-and-its-intelligent-enterprise-strategy/
- https://economictimes.indiatimes.com/markets/stocks/news/newgen-software-shares-surge-15-as-broad-based-it-stocks-rally/articleshow/132306697.cms
Analytical Overview
Analysis Summary
Newgen Software Technologies Ltd. trades at a trailing P/E of 22.29 and a forward P/E of 16.23, which are below some industry peers but aligned with the software infrastructure sector average of 22.29, indicating a reasonable valuation relative to growth prospects. The company demonstrates a positive revenue growth rate of 5.3% and maintains strong operating and free cash flow generation, supporting a stable growth trajectory. Financial health appears robust with a low total debt to equity ratio of 2.21% and a strong current ratio of 3.66, reflecting ample liquidity and low leverage. Sector-specific opportunities include increasing digital transformation demand across banking, government, and insurance sectors in India, while challenges include competitive pressures and macroeconomic uncertainties impacting IT budgets. The regulatory environment in India favors technology adoption, and consumer trends toward automation support Newgen’s market positioning.
Overall Business and Market Assessment
Supporting Factors: Key supporting factors include strong profitability metrics with an 18.25% ROE, robust cash reserves exceeding INR 11 billion, and strategic leadership enhancements aimed at global growth acceleration. Risks to monitor include the recent decline in institutional ownership and sector competition that could pressure margins. The appropriate investment horizon is medium to long-term, contingent on execution of growth strategies and market conditions. Overall, Newgen presents a stable business model with moderate valuation, warranting careful observation of upcoming earnings and market developments.
Risk Factors: No data
SWOT Analysis
Strengths
- Strong profitability with a net profit margin of 19.1%.
- Robust cash reserves of over INR 11 billion ensuring liquidity.
- Low debt levels with a total debt to equity ratio of 2.21%.
- Leadership restructuring aimed at accelerating global growth.
Weaknesses
- Moderate institutional ownership at 7.94% indicating limited external investor participation.
- Quarterly earnings growth declined slightly by 1.9% year-over-year.
- Price currently trades significantly below 52-week high, reflecting volatility.
- High price to cash flow ratio of 31.49 compared to peers.
Opportunities
- Growing demand for digital transformation in banking and government sectors.
- Expansion potential through new leadership and strategic initiatives.
- Favorable regulatory environment supporting technology adoption in India.
- Increasing enterprise adoption of BPM, ECM, and CCM solutions.
Threats
- Intense competition within the software infrastructure industry.
- Potential macroeconomic headwinds affecting IT spending.
- Reduction in institutional ownership may impact stock liquidity.
- Volatile market conditions reflected in recent price momentum shifts.
Company Description
Newgen Software Technologies Ltd. is a premier provider of business software solutions that enhance enterprise-level operations. Specializing in digital transformation, Newgen offers an array of products designed to streamline business processes, manage processes and content, and foster collaboration. The company's flagship offerings include its Business Process Management (BPM), Enterprise Content Management (ECM), and Customer Communication Management (CCM) suites. Headquartered in India, Newgen Software extends its expertise to a range of industries such as banking, government, insurance, and shared services. These sectors benefit from Newgen's solutions, optimizing their business operations and achieving greater agility. In the financial market, Newgen Software Technologies Ltd. holds significance by driving the digitalization of processes across critical sectors, thus influencing operational efficiencies and customer service standards. By leveraging robust technology and a comprehensive suite of software solutions, Newgen continues to play a vital role in helping organizations transition to digital ecosystems, thus keeping them competitive in a rapidly evolving market landscape.