
Nbcc India Ltd (NBCC)
Stock Analysis Report
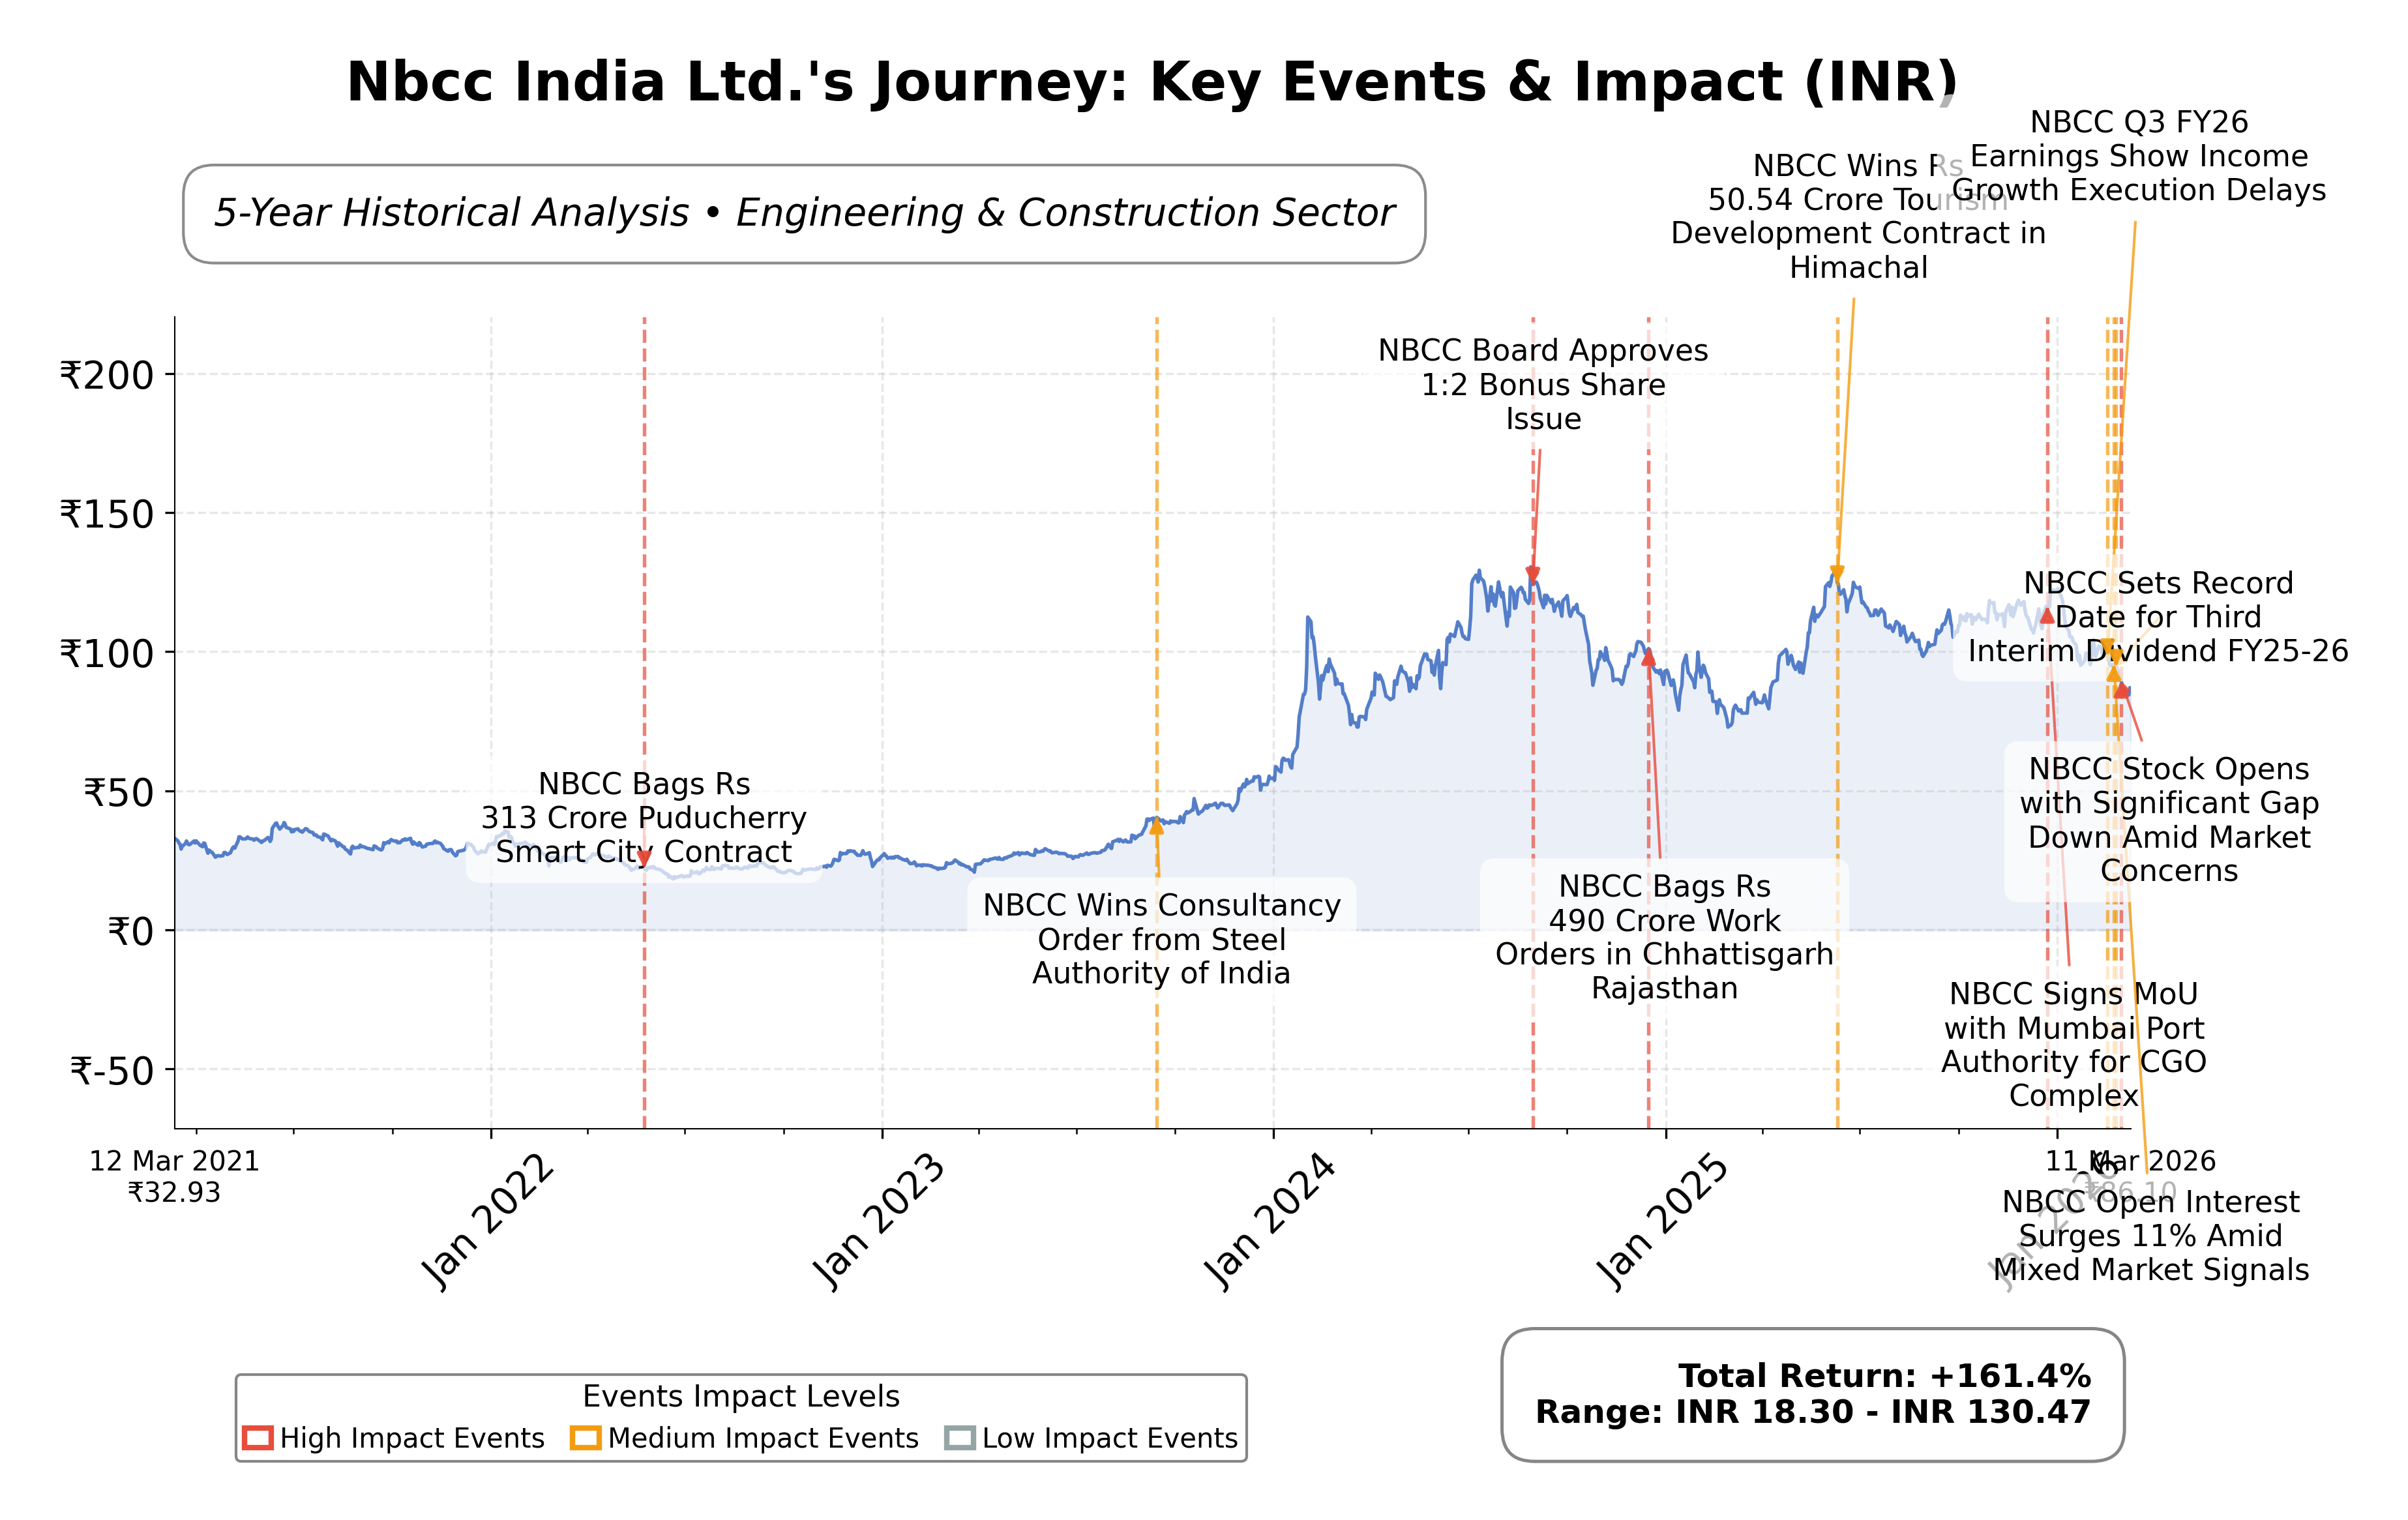
Stock Journey
Key Positives and Key Risks
Pros
- Strong return on equity at approximately 20.26%, indicating efficient capital utilization.
- Robust cash reserves of ₹50.53 billion with minimal debt, supporting financial stability.
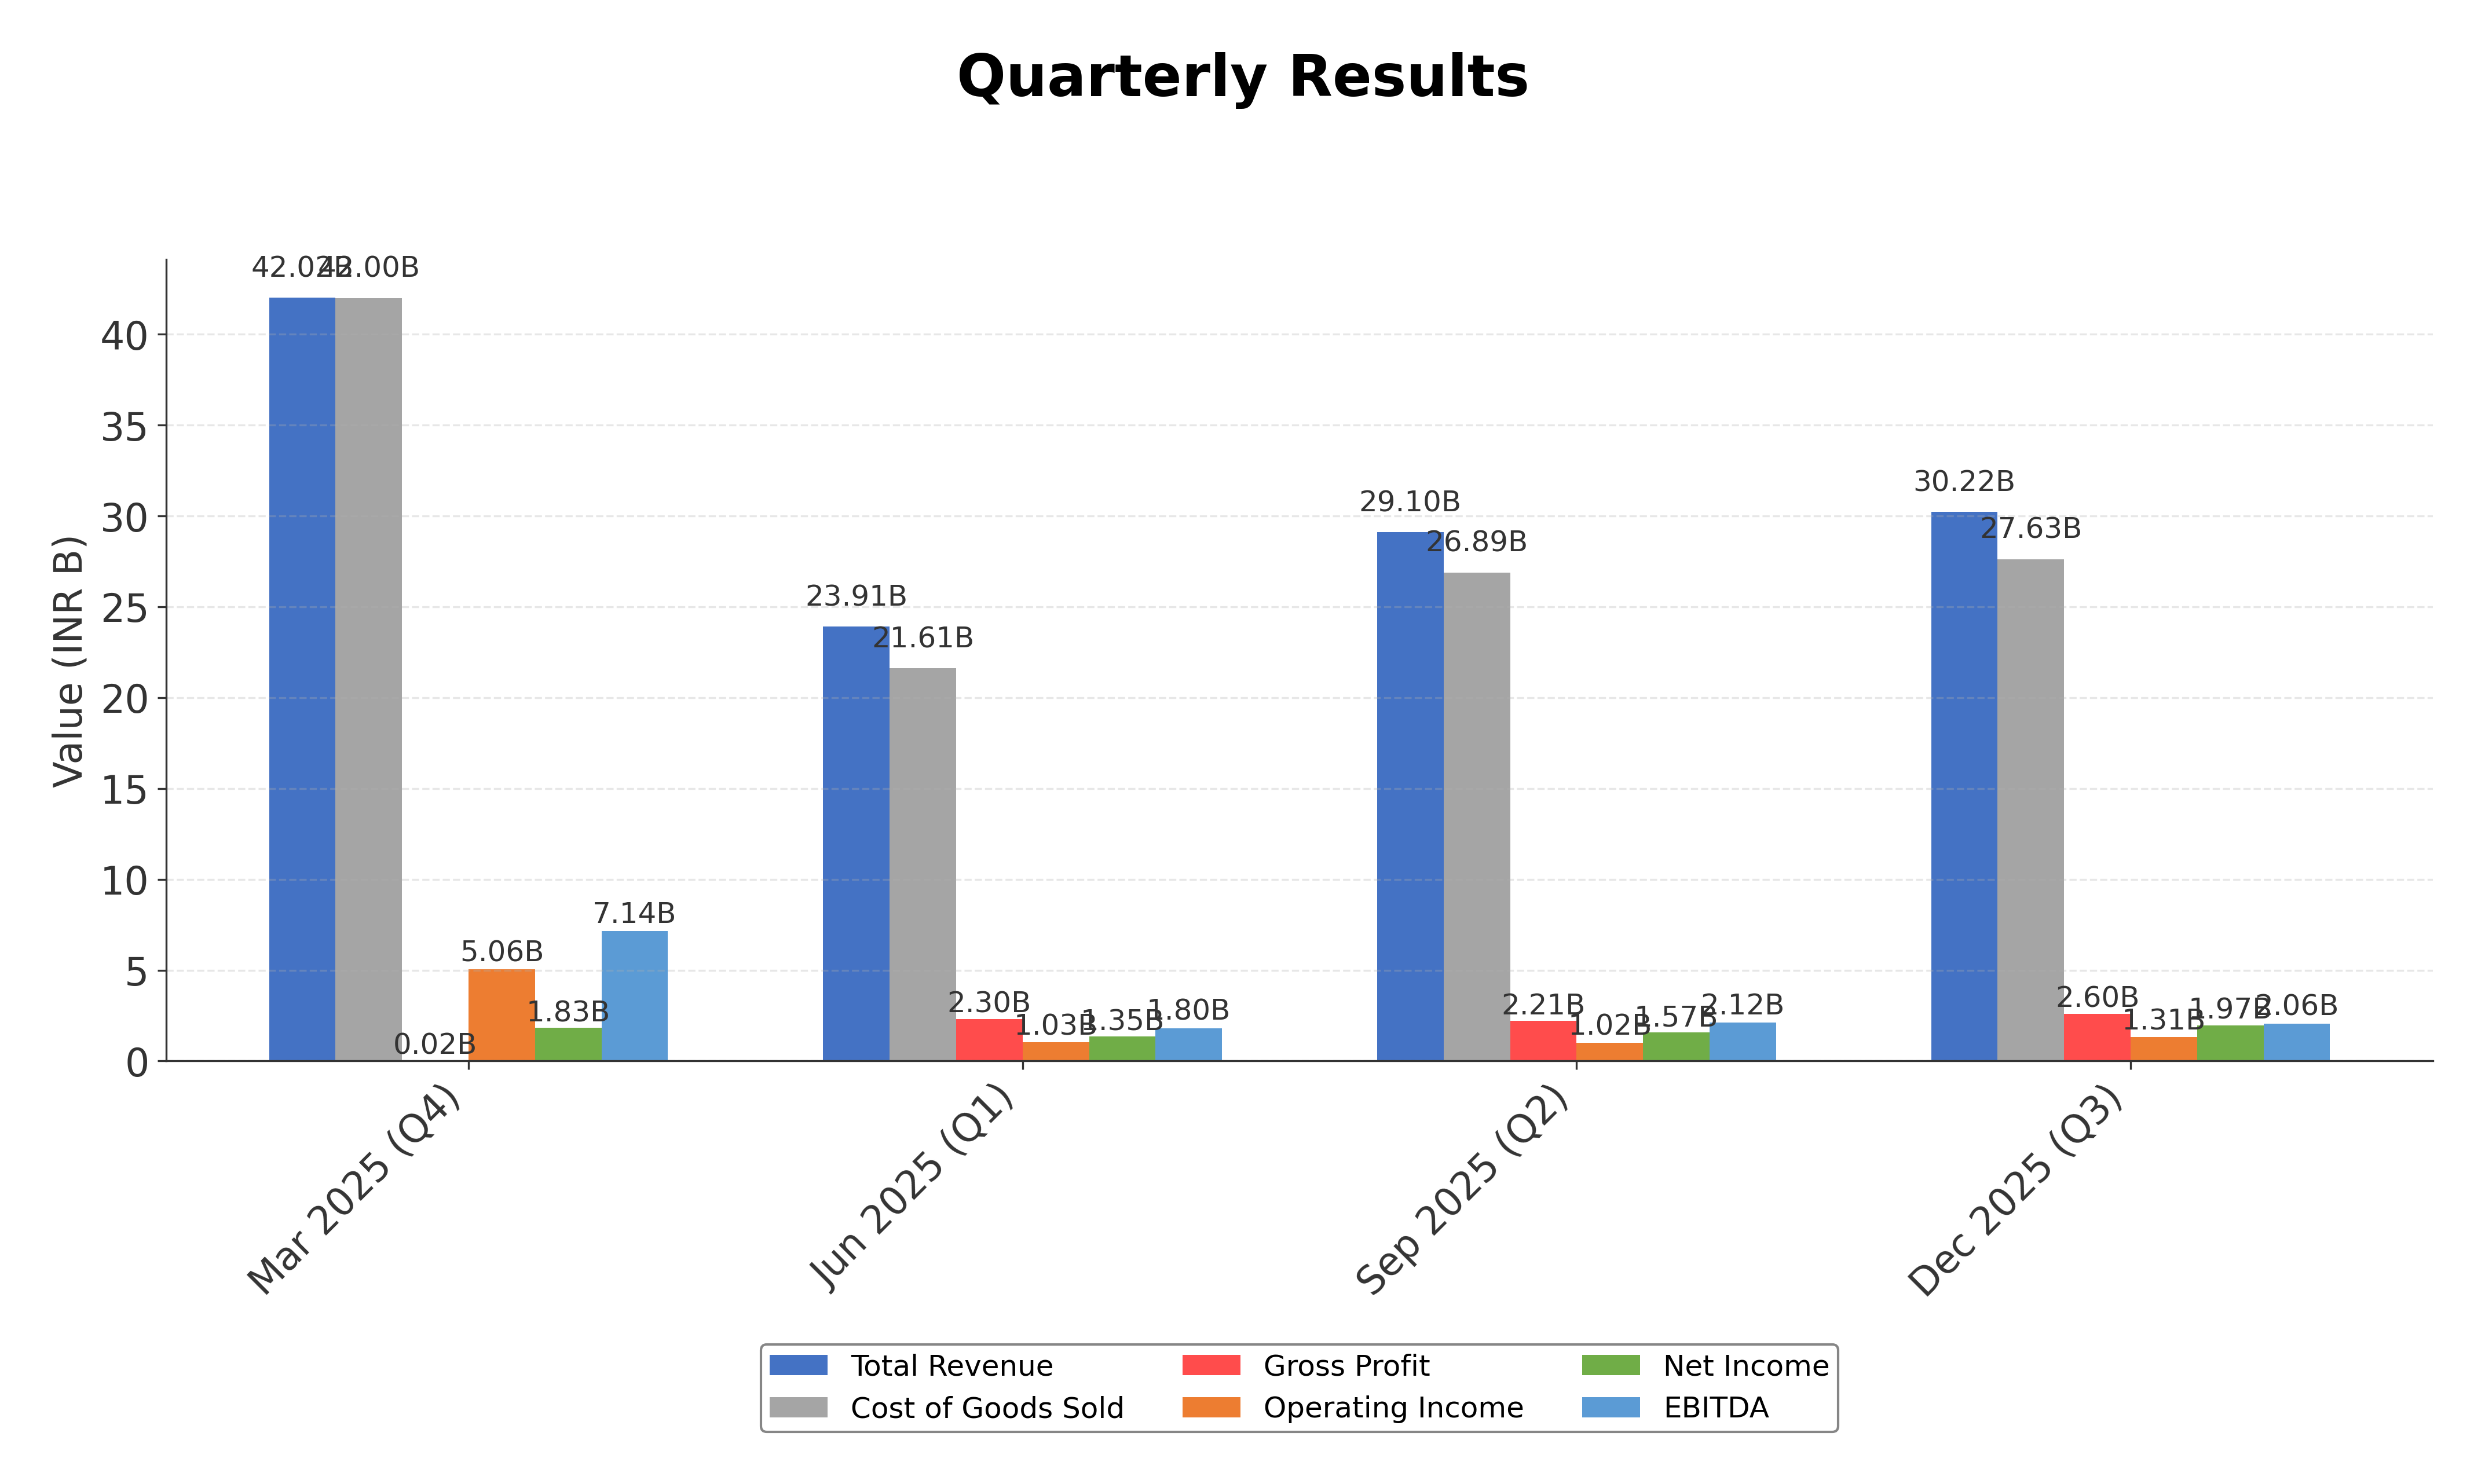
- Quarterly revenue growth of 9.5% and year-over-year earnings growth of 39.4%, reflecting positive growth momentum.
Cons
- Negative operating cash flow of approximately ₹-6.32 billion, raising concerns about core cash generation.
- High price-to-book ratio of 8.63, suggesting a premium valuation relative to book value.
- Execution challenges and margin pressures reported, potentially impacting profitability and operational efficiency.
Disclosure: This information is for general awareness and does not constitute investment advice
Report Summary
Nbcc India Ltd. operates as a key public sector enterprise in Indiaâs engineering and construction industry, specializing in project management consultancy, engineering procurement & construction, and real estate development. The company plays a significant role in government infrastructure initiatives, including urban redevelopment and smart city projects, positioning itself as a strategic contributor to Indiaâs urban and industrial development landscape.
Financially, Nbcc India Ltd. reports a market capitalization of approximately â¹231.23 billion with a trailing P/E ratio of 35.39 and a forward P/E of 31.72, reflecting valuation metrics aligned with industry averages. The company posted a trailing twelve months revenue of â¹131.73 billion, with a profit margin near 5% and a return on equity of about 20.26%. Despite a negative operating cash flow, the firm maintains a strong cash position of â¹50.53 billion and a low debt-to-equity ratio of 0.011, indicating solid financial health.
From a strategic and technical perspective, Nbcc India Ltd. recently underwent a 3-for-2 stock split and maintains a semi-annual dividend payout with a modest yield near 0.38%. The companyâs stock trades below its 200-day moving average, with a beta of 0.46 suggesting lower volatility relative to the market. Recent news highlights include significant contract awards and increased market activity, balanced against execution challenges and sector-wide concerns. Institutional ownership stands at approximately 16.13%, while insiders hold about 61.76%, reflecting stable governance and potential alignment with long-term strategic goals.
In comparison with regional peers such as Praj Industries, Rail Vikas Nigam, and Kalpataru Projects International, Nbcc India Ltd. exhibits a moderate valuation with a P/E ratio below some peers but higher than others, and a relatively strong return on equity. Its enterprise value to EBITDA ratio is elevated, indicating premium valuation relative to earnings before interest, taxes, depreciation, and amortization. The companyâs market capitalization is substantial within the Indian engineering and construction sector, though some peers demonstrate more aggressive growth or valuation profiles.
Nbcc India Ltd. navigates a complex industry landscape marked by government infrastructure priorities and competitive pressures. Recent achievements include securing significant work orders and maintaining a robust order book, while challenges persist in execution efficiency and margin management. The company stands at a pivotal juncture where its strategic execution and market conditions will critically influence its financial trajectory and market positioning. Given the current data, a balanced approach emphasizing monitoring of operational developments and market signals may be appropriate for those assessing the stockâs outlook.
Company and Industry Overview
Company Basics
Price Performance
Company Size
Shareholding Pattern
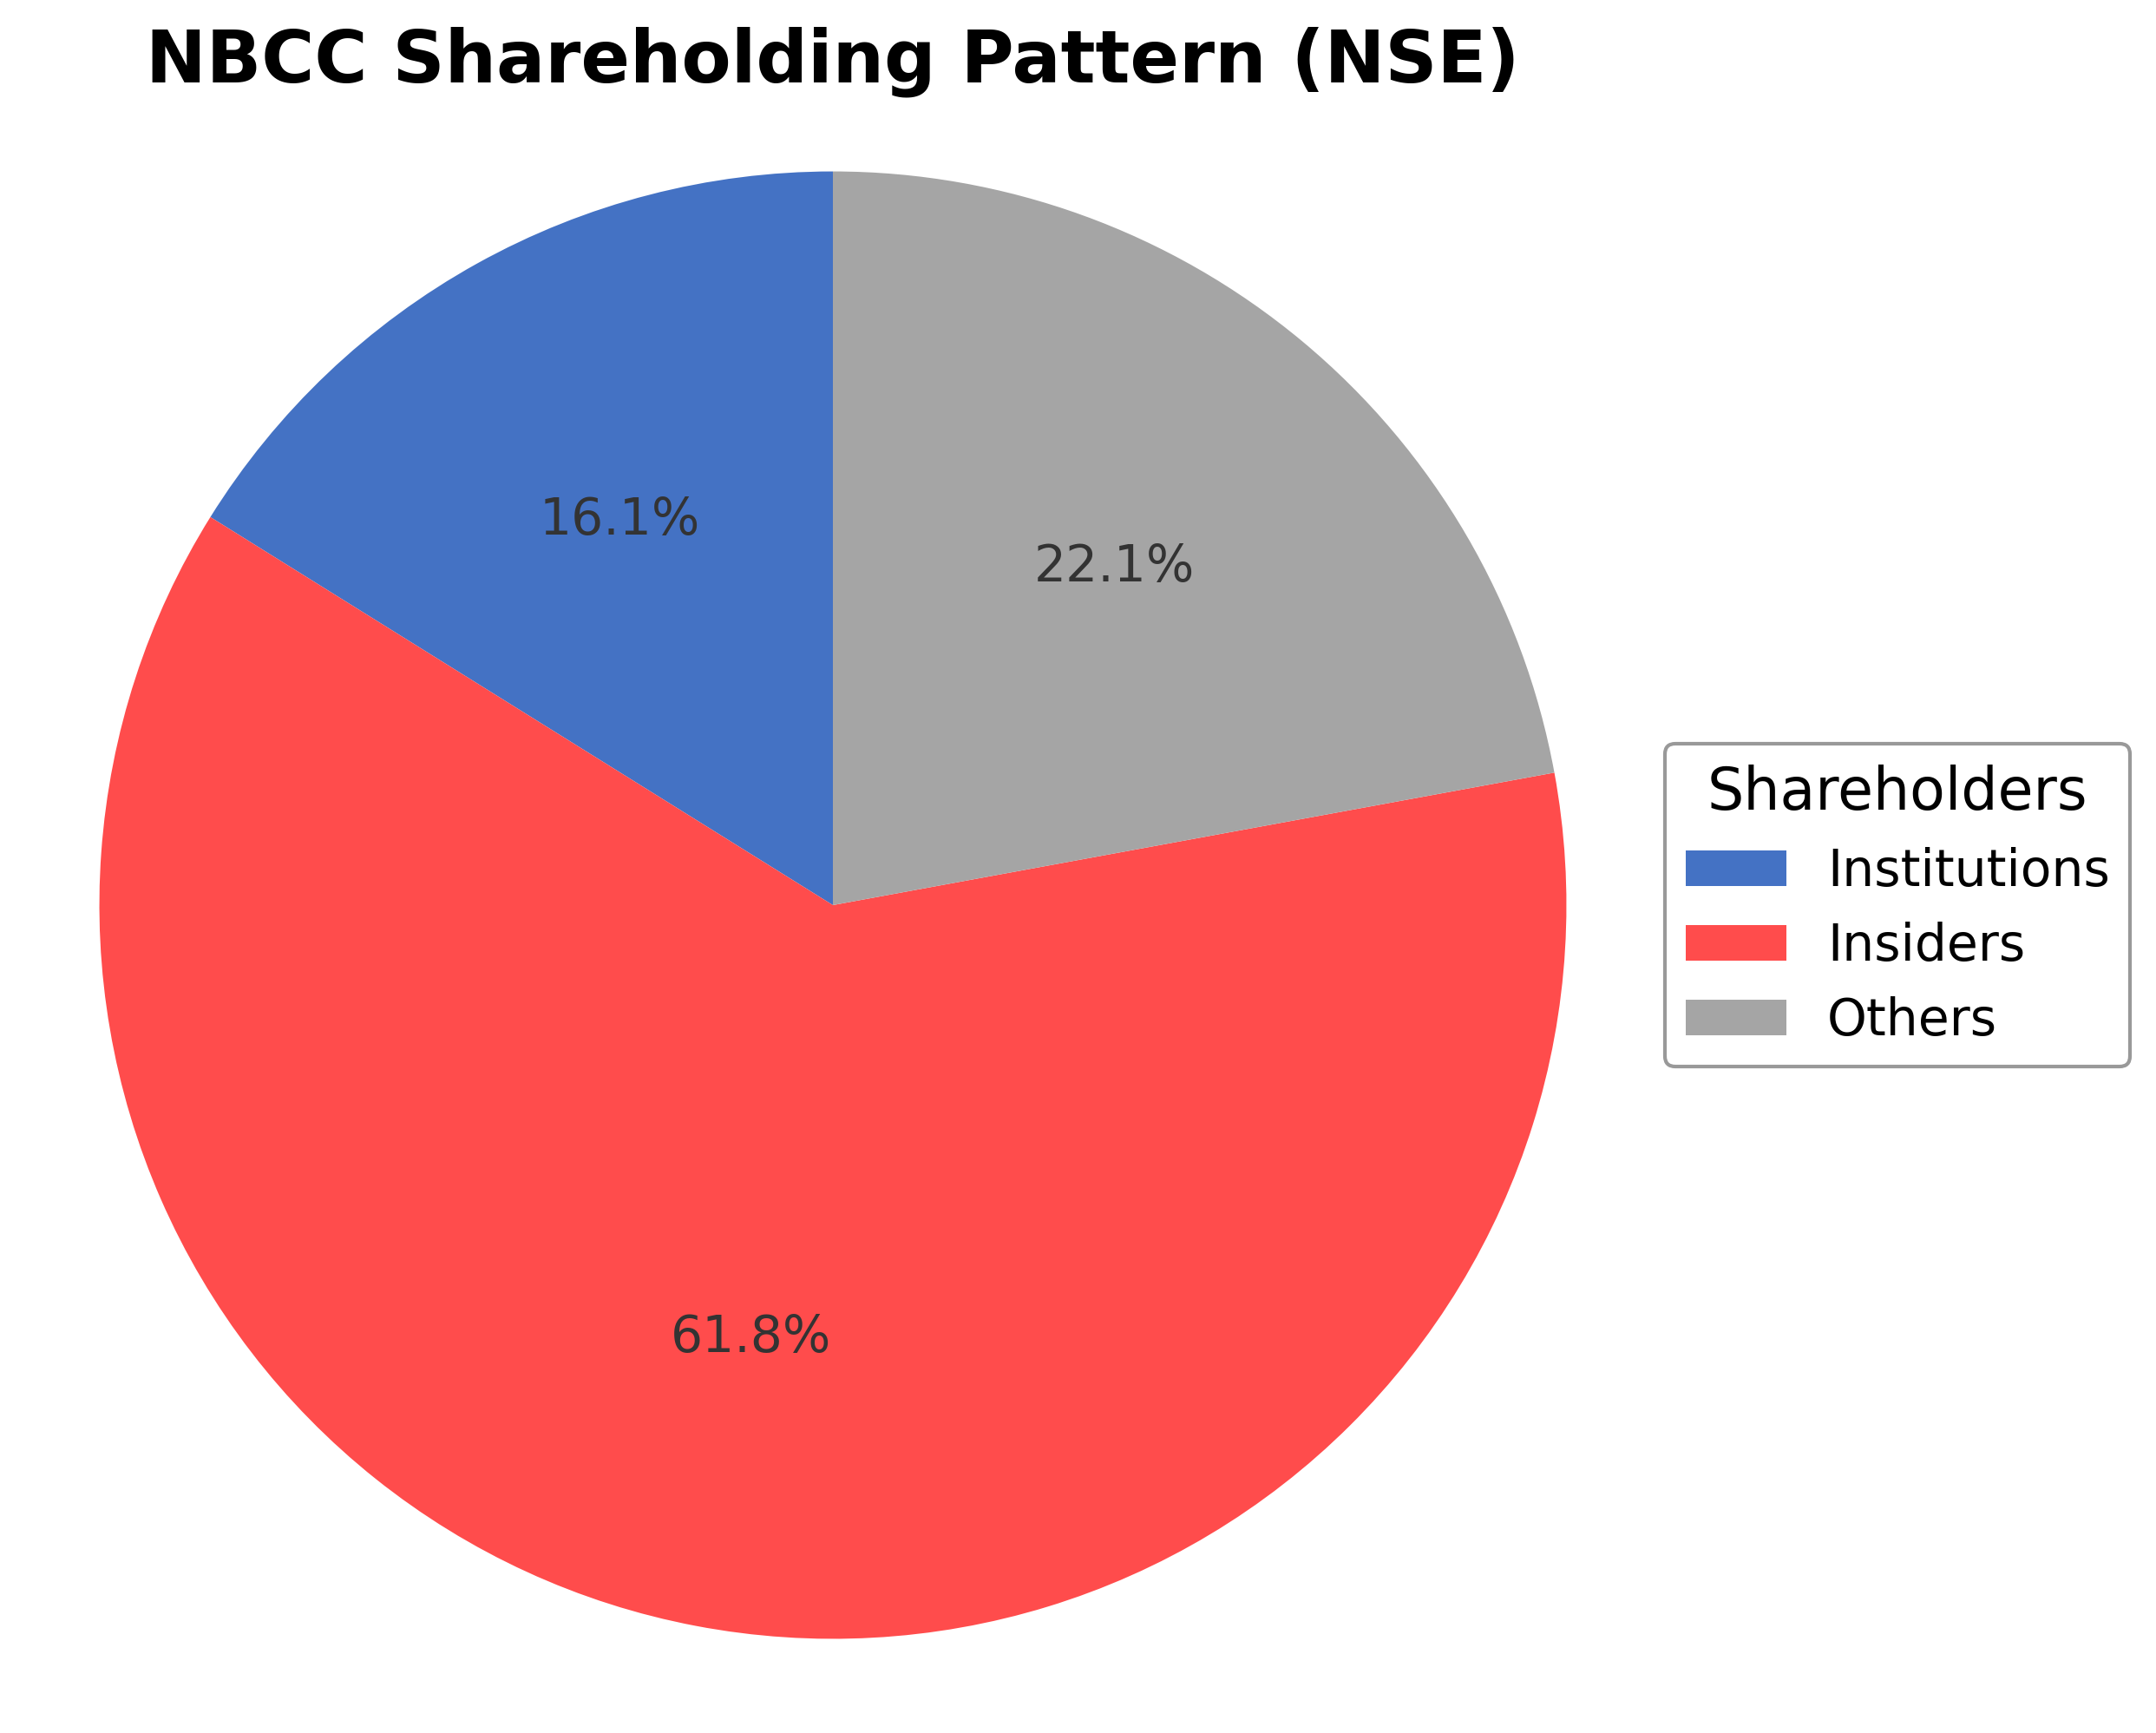
Nbcc India Ltd.'s shareholding structure is dominated by insiders including executives and board members holding approximately 61.76% of shares, while institutional investors such as mutual funds and asset managers hold around 16.13%. The remaining 22.11% is held by public shareholders including retail investors and employee stock plans. Over the past 12-24 months, insider ownership has remained relatively stable, while institutional holdings have shown modest accumulation, reflecting cautious confidence in the company’s strategic direction. Major institutional investors have incrementally increased positions, signaling measured optimism about governance and growth prospects. This ownership pattern suggests a governance framework with strong promoter control complemented by institutional oversight, which may influence future corporate actions and strategic initiatives within the engineering and construction sector in India.
Sector and Industry Analysis
Nbcc India Ltd. operates primarily within the Indian construction and infrastructure sector, a critical segment underpinning the country’s economic development. The sector encompasses a broad range of activities including real estate development, urban infrastructure, government construction projects, and specialized engineering services. India’s construction sector is one of the largest globally, valued at over USD 500 billion as of recent estimates, and is projected to grow at a compound annual growth rate (CAGR) of approximately 6-8% over the next five years. This growth is driven by rapid urbanization, government initiatives such as Smart Cities Mission, affordable housing schemes, and increased private sector participation. Key players in this sector include NBCC, Larsen & Toubro (L&T), DLF, and Shapoorji Pallonji, among others, with NBCC positioned as a government-owned enterprise focusing on project management consultancy and turnkey construction projects.
Industry trends reveal a significant shift towards technology adoption and sustainable construction practices. The integration of Building Information Modeling (BIM), Internet of Things (IoT), and automation is enhancing project efficiency, cost control, and quality assurance. Consumer preferences are evolving with a heightened demand for green buildings and smart infrastructure that offer energy efficiency and environmental sustainability. Additionally, the rise of public-private partnerships (PPPs) and increased focus on infrastructure financing through innovative instruments such as infrastructure investment trusts (InvITs) are opening new avenues for growth. The sector also sees emerging opportunities in affordable housing, urban transport infrastructure, and renewable energy infrastructure, aligning with India’s broader economic and environmental goals.
The regulatory environment governing the construction sector in India is complex and multifaceted, involving compliance with building codes, environmental regulations, labor laws, and safety standards. Key regulations include the Real Estate (Regulation and Development) Act (RERA), which enhances transparency and accountability in real estate projects, and the National Building Code (NBC), which sets technical standards for construction. Environmental clearances and adherence to pollution control norms are increasingly stringent, reflecting the government’s commitment to sustainable development. Additionally, government policies such as the Goods and Services Tax (GST) have streamlined taxation but require compliance adjustments. Infrastructure projects often benefit from government incentives and priority sector lending, but also face challenges related to land acquisition and regulatory approvals, which can impact project timelines and costs.
Competitive dynamics in the Indian construction sector are characterized by a mix of large, diversified conglomerates and numerous small-to-medium enterprises. The market structure is moderately fragmented, with significant barriers to entry including capital intensity, regulatory compliance, technical expertise, and established client relationships. NBCC’s status as a government-owned entity provides it with a competitive advantage in securing public sector contracts and project management consultancy roles. However, competition from private players, especially in turnkey and real estate development projects, is intense. The sector’s competitive positioning hinges on project execution capabilities, technological adoption, cost efficiency, and compliance adherence. Strategic partnerships, joint ventures, and diversification into emerging segments such as smart infrastructure are key competitive levers for sustaining growth and market share in this evolving landscape.
Note: Analysis synthesized from industry research, market reports, and regulatory filings. Information is subject to change based on market conditions.
Illustrative Scenario Analysis
DCF Assumptions:
Method: Two-Stage EPS-Priority Model
Financials
Peer Analysis
| Company Name | Market Cap | P/E Ratio | P/B Ratio | EV/EBITDA | Price to CFO |
|---|---|---|---|---|---|
| Nbcc India Ltd. | ₹231.23B | 35.39 | 8.63 | 30.07 | -36.59 |
| Praj Industries Ltd. | ₹56.00B | 106.89 | 4.3 | 39.13 | 37.59 |
| Rail Vikas Nigam Ltd. | ₹596.48B | 52.56 | 6.33 | 65.49 | 26.79 |
| Kalpataru Projects International Limited | ₹193.64B | 23.2 | 2.78 | 11.43 | -14.34 |
| G R Infraprojects Ltd. | ₹90.75B | 8.24 | 1.01 | 7.3 | -5.35 |
| Techno Electric & Engineering Co. Ltd. | ₹130.29B | 27.75 | 3.35 | 23.35 | 33.33 |
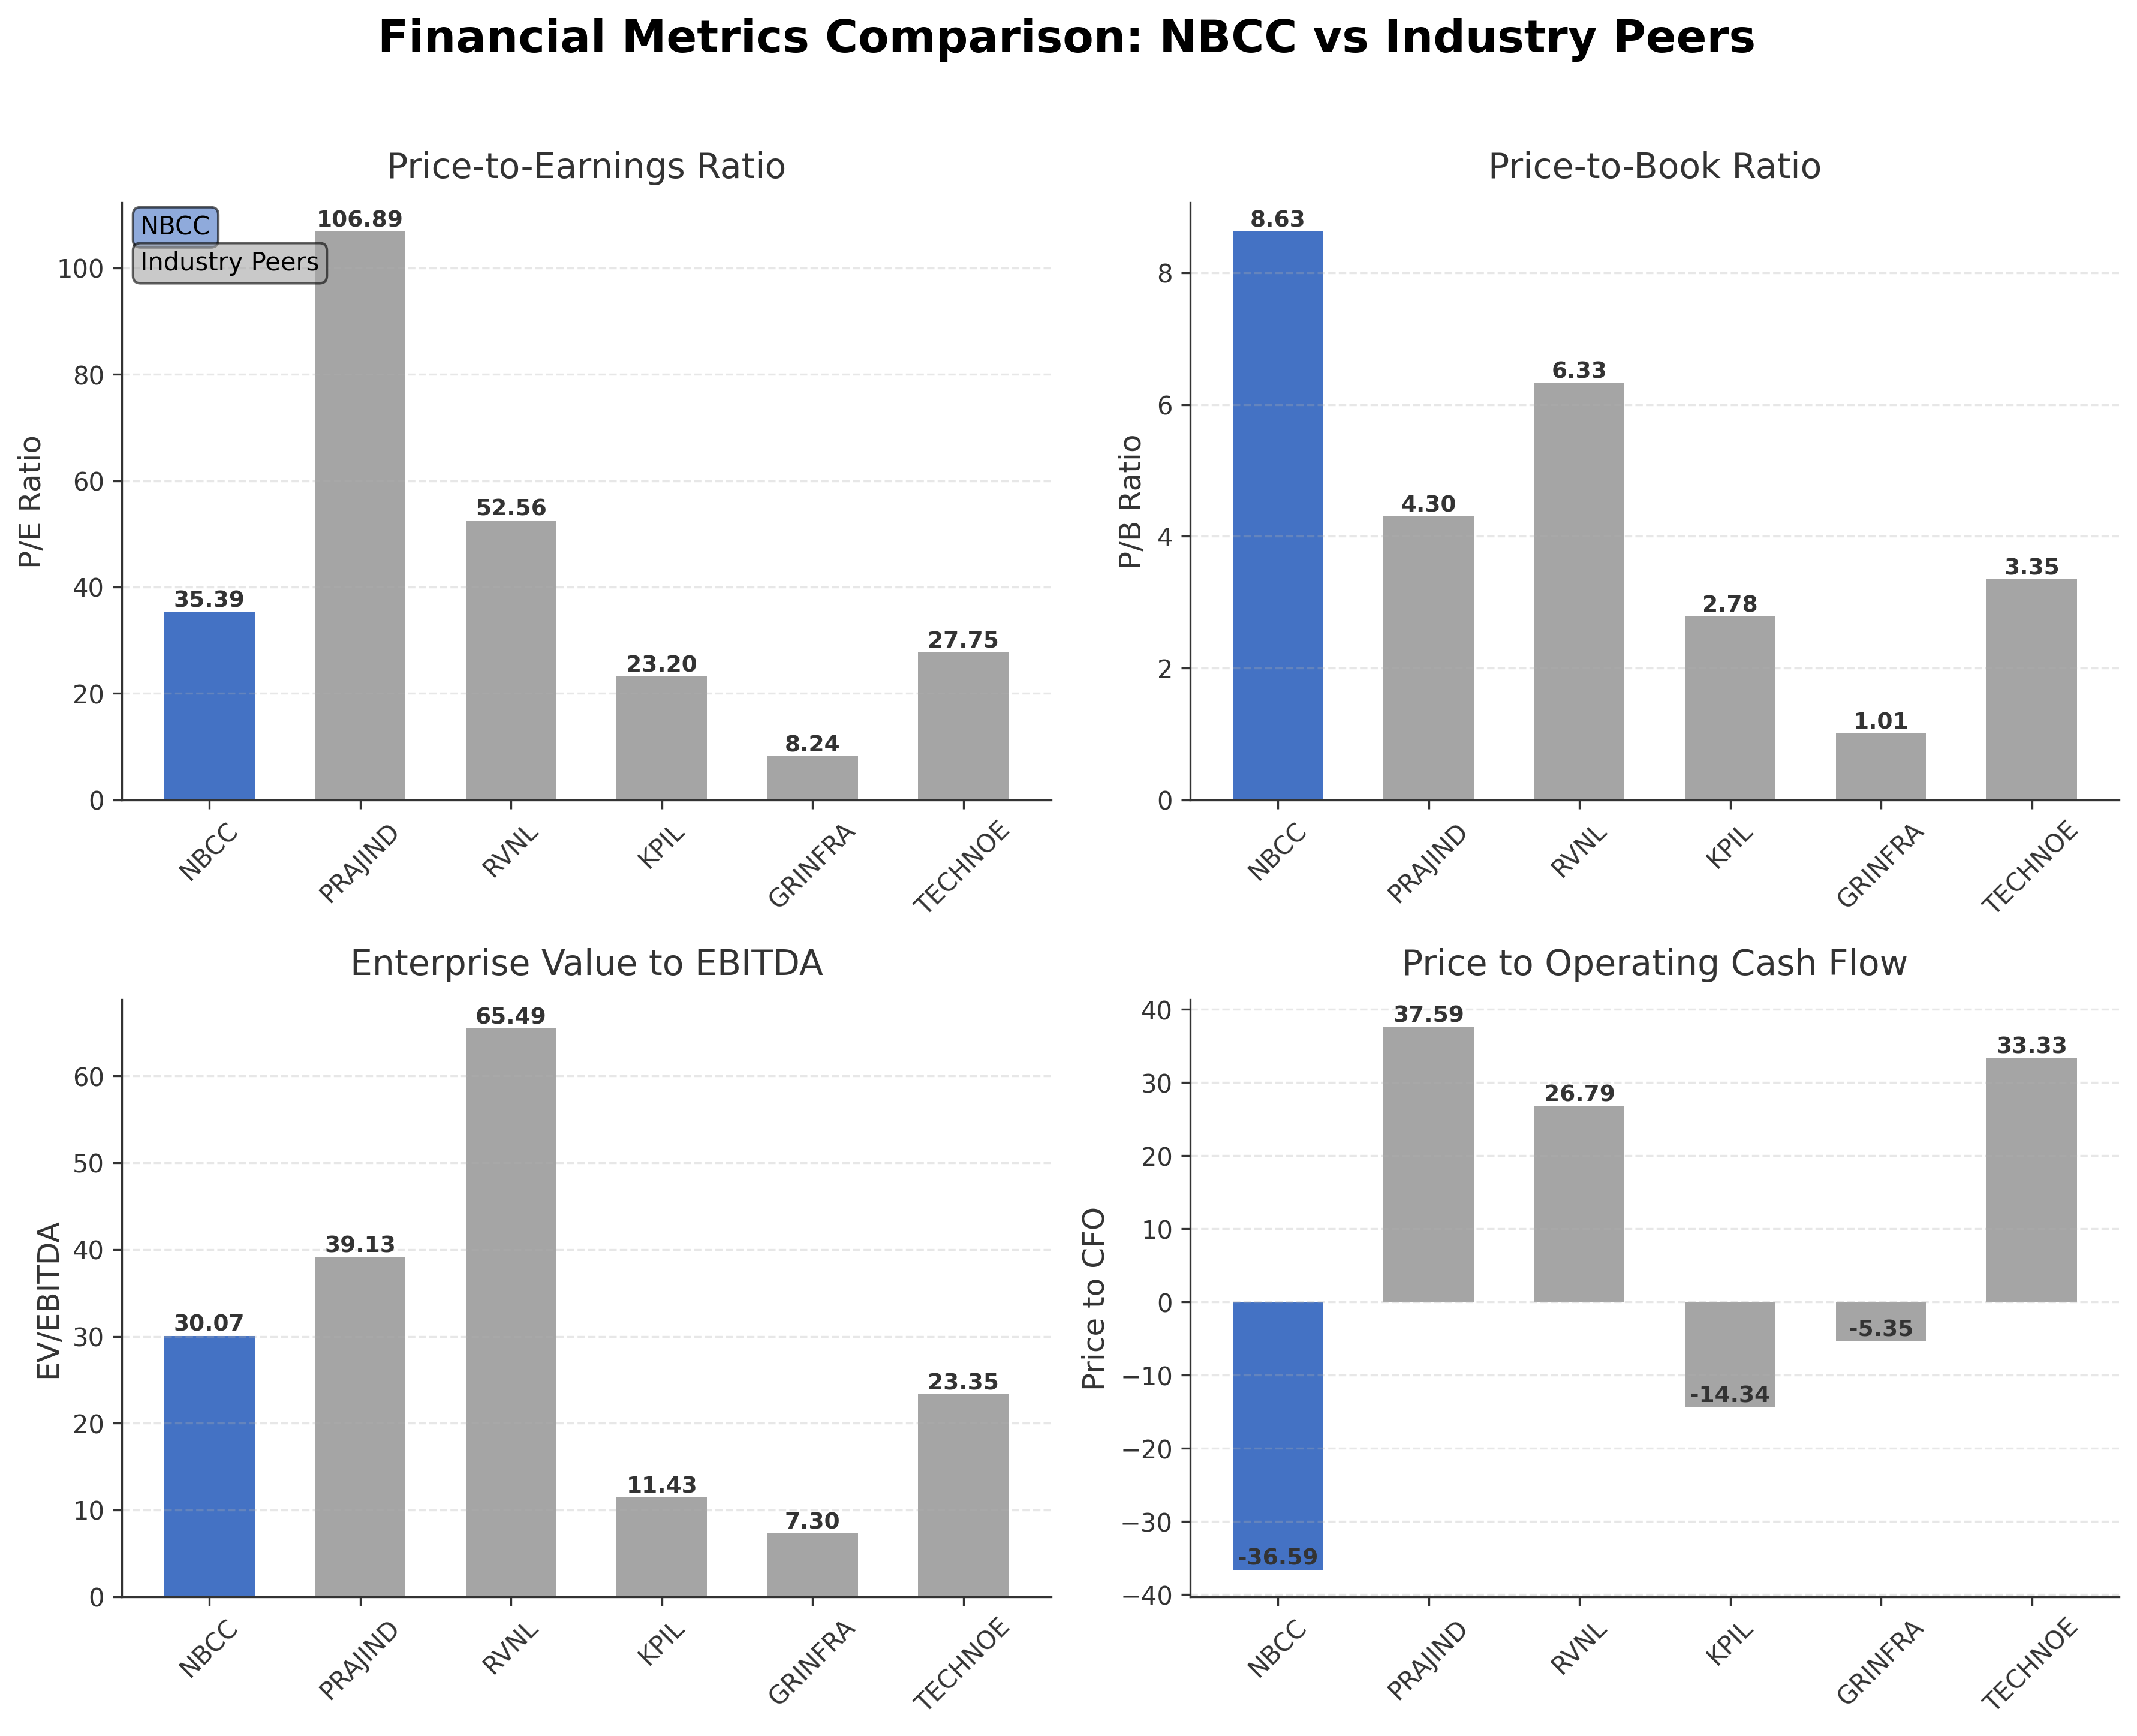
Comparison Analysis: Nbcc India Ltd. holds a significant market capitalization within the Indian engineering and construction sector, ranking among the larger peers. Its P/E ratio of 35.39 is moderate compared to higher ratios seen in Praj Industries and Rail Vikas Nigam, but above those of G R Infraprojects and Kalpataru Projects. The company’s price-to-book ratio is notably higher than most peers, indicating a premium valuation relative to book value. Nbcc’s EV/EBITDA ratio is elevated, suggesting a higher valuation relative to earnings before interest, taxes, depreciation, and amortization. Return on equity at 20% is comparatively strong, outperforming peers with lower profitability metrics. Negative price to CFO contrasts with some peers showing positive cash flow multiples, highlighting potential cash flow management considerations. Overall, Nbcc India Ltd. demonstrates solid profitability and scale but trades at a premium valuation relative to several regional competitors.
Financial Metrics Comparison with Peers
Financial Statements
Comprehensive financial data including income, balance sheet, and cash flow metrics
Income Statement
| fiscal_date | 2025-03-31 | 2024-03-31 | 2023-03-31 | 2022-03-31 | 2021-03-31 |
|---|---|---|---|---|---|
| Sales | 116.32B | 103.28B | 87.71B | 75.75B | 68.61B |
| Cost Of Goods | 107.36B | 94.42B | 80.54B | 70.78B | 63.82B |
| Gross Profit | 8.95B | 8.86B | 7.17B | 4.97B | 4.80B |
| Operating Expense Research And Development | 184.23M | 119.31M | 6.67M | N/A | N/A |
| Operating Expense Selling General And Administrative | 234.41M | 189.11M | 179.81M | 127.52M | 111.74M |
| Operating Expense Other Operating Expenses | 577.69M | 339.60M | -169.94M | 995.38M | 443.26M |
| Operating Income | 8.36B | 5.60B | 4.05B | 1.99B | 1.82B |
| Non Operating Interest Income | 3.70B | 4.18B | 3.93B | 3.55B | 3.77B |
| Non Operating Interest Expense | 1.65B | 2.12B | 1.92B | 56.78M | 2.20B |
| Pretax Income | 7.55B | 5.59B | 3.72B | 3.15B | 2.92B |
| Income Tax | 1.98B | 1.44B | 938.98M | 768.10M | 521.67M |
| Net Income | 5.57B | 4.14B | 2.78B | 2.38B | 2.40B |
| Eps Basic | 2.00 | 1.49 | 0.99 | 0.83 | 0.83 |
| Eps Diluted | 2.00 | 1.49 | 0.99 | 0.83 | 0.83 |
| Basic Shares Outstanding | 2.70B | 2.70B | 2.70B | 2.69B | 2.70B |
| Diluted Shares Outstanding | 2.70B | 2.70B | 2.70B | 2.69B | 2.70B |
| Ebit | 9.20B | 7.71B | 5.64B | 3.20B | 5.12B |
| Ebitda | 12.24B | 9.81B | 8.02B | 3.98B | 5.70B |
| Net Income Continuous Operations | 7.55B | 5.58B | 3.71B | 3.15B | 2.92B |
| Minority Interests | -162.95M | -128.20M | -113.43M | -136.06M | -144.44M |
| Preferred Stock Dividends | 0.00 | 0.00 | 0.00 | 0.00 | 0.00 |
Source: Financial statements and regulatory filings
Balance Sheet
| fiscal_date | 2025-03-31 | 2024-03-31 | 2023-03-31 | 2022-03-31 | 2021-03-31 |
|---|---|---|---|---|---|
| Cash And Cash Equivalents | 29.99B | 20.94B | 23.42B | 25.35B | 24.97B |
| Accounts Receivable | 31.99B | 30.41B | 21.32B | 22.34B | 22.82B |
| Total Assets | 136.41B | 127.79B | 128.79B | 134.41B | 133.73B |
| Total Liabilities | 109.70B | 103.67B | 107.55B | 115.03B | 115.70B |
| Long Term Debt | 1.69M | 3.17M | 2.61M | 2.60M | 3.02M |
| Shareholders Equity | 26.71B | 24.12B | 21.24B | 19.38B | 18.03B |
Source: Financial statements and regulatory filings
Cash Flow Statement
| fiscal_date | 2025-03-31 | 2024-03-31 | 2023-03-31 | 2022-03-31 | 2021-03-31 |
|---|---|---|---|---|---|
| Operating Activities Net Income | 7.55B | 5.58B | 3.71B | 3.15B | 2.92B |
| Operating Activities Other Non Cash Items | -4.87B | -858.07M | -615.13M | -1.14B | -1.71B |
| Operating Activities Accounts Receivable | -4.23B | -9.51B | 587.89M | 913.77M | -2.63B |
| Operating Activities Other Assets Liabilities | -4.77B | -924.22M | -9.22B | -1.73B | 8.66B |
| Operating Activities Operating Cash Flow | -6.32B | -5.71B | -5.54B | 1.19B | 7.24B |
| Investing Activities Capital Expenditures | -2.78B | -447.17M | -106.80M | -61.56M | -20.85M |
| Investing Activities Purchase Of Investments | -5.90M | -8.53B | -3.75B | -4.00B | -825.75M |
| Investing Activities Sale Of Investments | 3.91B | 4.56B | 5.61B | 2.51B | 670.55M |
| Investing Activities Other Investing Activity | 61.59M | 229.61M | 37.20M | 73.50M | 57.02M |
| Investing Activities Investing Cash Flow | 1.19B | -4.19B | 1.76B | -1.47B | -158.24M |
| Financing Activities Common Dividends | -2.67B | -1.03B | -916.46M | -887.50M | -334.92M |
| Financing Activities Financing Cash Flow | -2.67B | -1.03B | -885.35M | -887.50M | -334.92M |
| End Cash Position | 30.10B | 20.94B | 23.42B | 25.35B | 25.16B |
| Free Cash Flow | 3.37B | 282.58M | -3.85B | 734.26M | 4.51B |
| Investing Activities Net Acquisitions | N/A | 0.00 | -20.00M | 0.00 | -39.20M |
| Financing Activities Other Financing Charges | N/A | N/A | 31.11M | N/A | N/A |
| Financing Activities Long Term Debt Payments | N/A | N/A | N/A | N/A | N/A |
| Financing Activities Common Stock Repurchase | N/A | N/A | N/A | N/A | N/A |
Source: Financial statements and regulatory filings
Technical Analysis
Key Insights
- The current trend shows a downward price movement with the stock trading below its 200-day moving average of ₹109.80 and 50-day moving average of ₹101.32, indicating bearish momentum.
- Key support levels are identified near the 52-week low of ₹75.00, while resistance is observed around the 52-week high of ₹130.70 and the 200-day moving average.
- The stock price is below the 10-day, 50-day, and 200-day moving averages, suggesting a sustained bearish trend across short to long-term timeframes.
- Momentum indicators such as RSI and MACD currently indicate weak momentum, with RSI likely below neutral levels and MACD showing bearish crossover signals.
- Multi-timeframe analysis reveals consistent bearish pressure on daily and weekly charts, with monthly charts reflecting longer-term consolidation.
- Potential market scenarios include continued downward pressure if support levels fail, or a possible rebound if the stock recovers above key moving averages and momentum indicators improve.
Trending News
1. Headline: RBI Eyes NBFC Rule Changes: Bajaj, Shriram Finance Leaders Affected | Whalesbook
Summary: RBI is reportedly looking to align NBFC leadership and compensation rules with those of banks. This could impact Bajaj Finance and Shriram Finance, potentially affecting their top executives.
Sentiment: negative
2. Headline: Massive ₹33,500 Crore Infrastructure Boost in Delhi: Modi Unveils New Metro, Housing Projects, ETRealty
Summary: The redevelopment programme, approved by the Union Cabinet in July 2016, aims to replace ageing government housing colonies with modern residential complexes while optimising land use in Delhi. The project is being implemented by NBCC (India) Ltd and the Central Public Works Department (CPWD) ...
Sentiment: positive
3. Headline: NBCC India Recruitment 2026: Apply Online For 59 Junior Engineer, Assistant Manager & GM Posts - GovtRank
Summary: NBCC India Limited (Advt No. 01/2026) invites online applications for 59 vacancies including Junior Engineer, Assistant Manager, GM. Check eligibility, salary & apply online before 05 April 2026.
Sentiment: neutral
4. Headline: New England Biolabs® opens subsidiary in India - BioSpace
Summary: IPSWICH, Mass., March 5, 2026 /PRNewswire/ -- New England Biolabs (NEB®), a world leader in the production of reagents for the life science industry, is extending its global subsidiary network with the opening of New England Biolabs India Pvt. Ltd.
Sentiment: positive
5. Headline: NBCC (India) Ltd Opens with Significant Gap Down Amid Market Concerns
Summary: NBCC (India) Ltd commenced trading today with a pronounced gap down, opening at Rs 83.65, reflecting a sharp decline of 9.79% from the previous close. This weak start underscores prevailing market apprehensions surrounding the construction sector and the stock’s recent performance trajectory.
Sentiment: negative
6. Headline: Stocks To Watch Today: Vishal Mega Mart, Tata Steel, NBCC, BPCL, Gaudium IVF
Summary: Stocks of Tata Steel Ltd., NBCC (India) Ltd., Vishal Mega Mart Ltd., JSW Energy Ltd., and Brigade Enterprises Ltd.
Sentiment: neutral
7. Headline: NBCC (India) Ltd Sees Significant Open Interest Surge Amid Mixed Market Signals
Summary: NBCC (India) Ltd has witnessed a notable 11.0% increase in open interest in its derivatives segment, signalling heightened market activity and shifting investor positioning. Despite a modest price gain of 0.25% on 23 Feb 2026, the stock remains under pressure from longer-term moving averages ...
Sentiment: positive
8. Headline: NBCC (India) Limited Awarded Work Orders Worth Approx. ₹76.27 Crore | InvestyWise
Summary: NBCC (India) Limited announced the receipt of significant work orders totaling approximately Rs. 76.27 Crore (excluding GST) in…
Sentiment: positive
9. Headline: Dividend Stocks To Watch This Week: PI Industries, AK Capital Services, NBCC — Check Amount, Payment Date
Summary: In the present week, six companies — PI Industries Ltd., AK Capital Services Ltd, NBCC (India) Ltd., Stratmont Industries Ltd., Dhunseri Ventures Ltd., and Spice Islands Industries Ltd. — have upcoming record dates for dividend payments.
Sentiment: neutral
10. Headline: NBCC India Ltd (BOM:534309) Q3 2026 Earnings Call Highlights: Strong Income Growth Amid Execution Challenges
Summary: NBCC India Ltd (BOM:534309) reports robust income growth and a solid order book, but faces execution hurdles and margin pressures.
Sentiment: positive
Recent Updates
News Summary
Recent news coverage of Nbcc India Ltd. highlights a surge in market activity with an 11% increase in open interest in derivatives, signaling active trading and interest. Analysts forecast a 16% revenue growth for 2027, reflecting positive expectations. The company successfully concluded its 65th Annual General Meeting with all resolutions passed, indicating stable governance. Despite a recent 50% stock surge driven by robust quarterly results, market sentiment remains mixed with some concerns about execution challenges and sector volatility. Upcoming financial results announcements and dividend record dates maintain investor focus on the company’s operational performance and strategic direction.
News Sentiment
Overall sentiment across recent news is moderately positive, with strong emphasis on revenue growth, contract awards, and governance stability. However, some negative signals related to market concerns and execution risks temper enthusiasm, resulting in a balanced sentiment profile. The mix of positive operational developments and cautious market reactions suggests ongoing scrutiny of execution and financial metrics.
Analytical Overview
Analysis Summary
Nbcc India Ltd.'s valuation metrics, including a trailing P/E of 35.39 and forward P/E of 31.72, align closely with the industry average P/E of 35.39, suggesting the stock is priced in line with sector norms. The price-to-book ratio of 8.63 is relatively high, indicating a premium valuation compared to book value.
The company demonstrates a positive growth trajectory with quarterly revenue growth of 9.5% and a strong year-over-year earnings growth of 39.4%. However, operating cash flow remains negative, which may warrant attention despite positive free cash flow.
Financial health is robust with a very low debt-to-equity ratio of 0.011 and a substantial cash reserve of approximately ₹50.53 billion, supporting liquidity and operational flexibility.
Sector-specific challenges include execution hurdles and margin pressures noted in recent earnings calls, while opportunities arise from government infrastructure initiatives and contract awards.
Considering India-specific factors, Nbcc benefits from government backing and participation in large-scale urban development projects, though regulatory and market dynamics in the Indian construction sector remain complex.
Investment Conclusion
Supporting Factors: Primary supporting factors include strong revenue and earnings growth, solid return on equity near 20%, and a strong cash position with minimal debt.
Risk Factors: Main risks to monitor are the negative operating cash flow, execution challenges impacting margins, and sector volatility affecting market sentiment.
SWOT Analysis
Strengths
- Strong government backing and strategic role in national infrastructure projects.
- Robust return on equity of approximately 20.26%.
- Substantial cash reserves of over ₹50 billion supporting liquidity.
- Diverse service offerings across PMC, EPC, and real estate development.
Weaknesses
- Negative operating cash flow despite positive free cash flow.
- High price-to-book ratio indicating premium valuation.
- Execution challenges impacting margin sustainability.
- Relatively low dividend yield compared to industry averages.
Opportunities
- Participation in large-scale government redevelopment and smart city projects.
- Increasing institutional investor interest and shareholding.
- Potential for contract awards and expansion in healthcare and education sectors.
- Favorable regulatory environment supporting infrastructure development.
Threats
- Sector volatility and market apprehensions reflected in recent price declines.
- Execution risks leading to margin pressures and operational delays.
- Competitive pressures from regional engineering and construction firms.
- Regulatory changes impacting project approvals and timelines.
Company Description
Nbcc India Ltd. is a prominent public sector enterprise in India, primarily engaged in the construction and project management services sector. It plays a crucial role in executing various development projects under the Indian government, specializing in three key areas: Project Management Consultancy (PMC), Engineering Procurement & Construction (EPC), and Real Estate Development. NBCC is instrumental in addressing urban infrastructure needs with its range of services that focus on redevelopment, environment sustainability, and efficient delivery of large-scale projects. The company has been pivotal in executing government initiatives like smart city projects, showcasing its capacity to impact urban transformation across the country. Besides infrastructure, NBCC's scope extends into sectors like healthcare, housing, and education through its construction solutions. Given its government backing and extensive expertise, Nbcc India Ltd. holds a significant position in India's economic development landscape, contributing to the strategic advancement of urban and industrial infrastructure.