


Motilal Oswal Financial Services Ltd (MOTILALOFS)
Stock Analysis Report
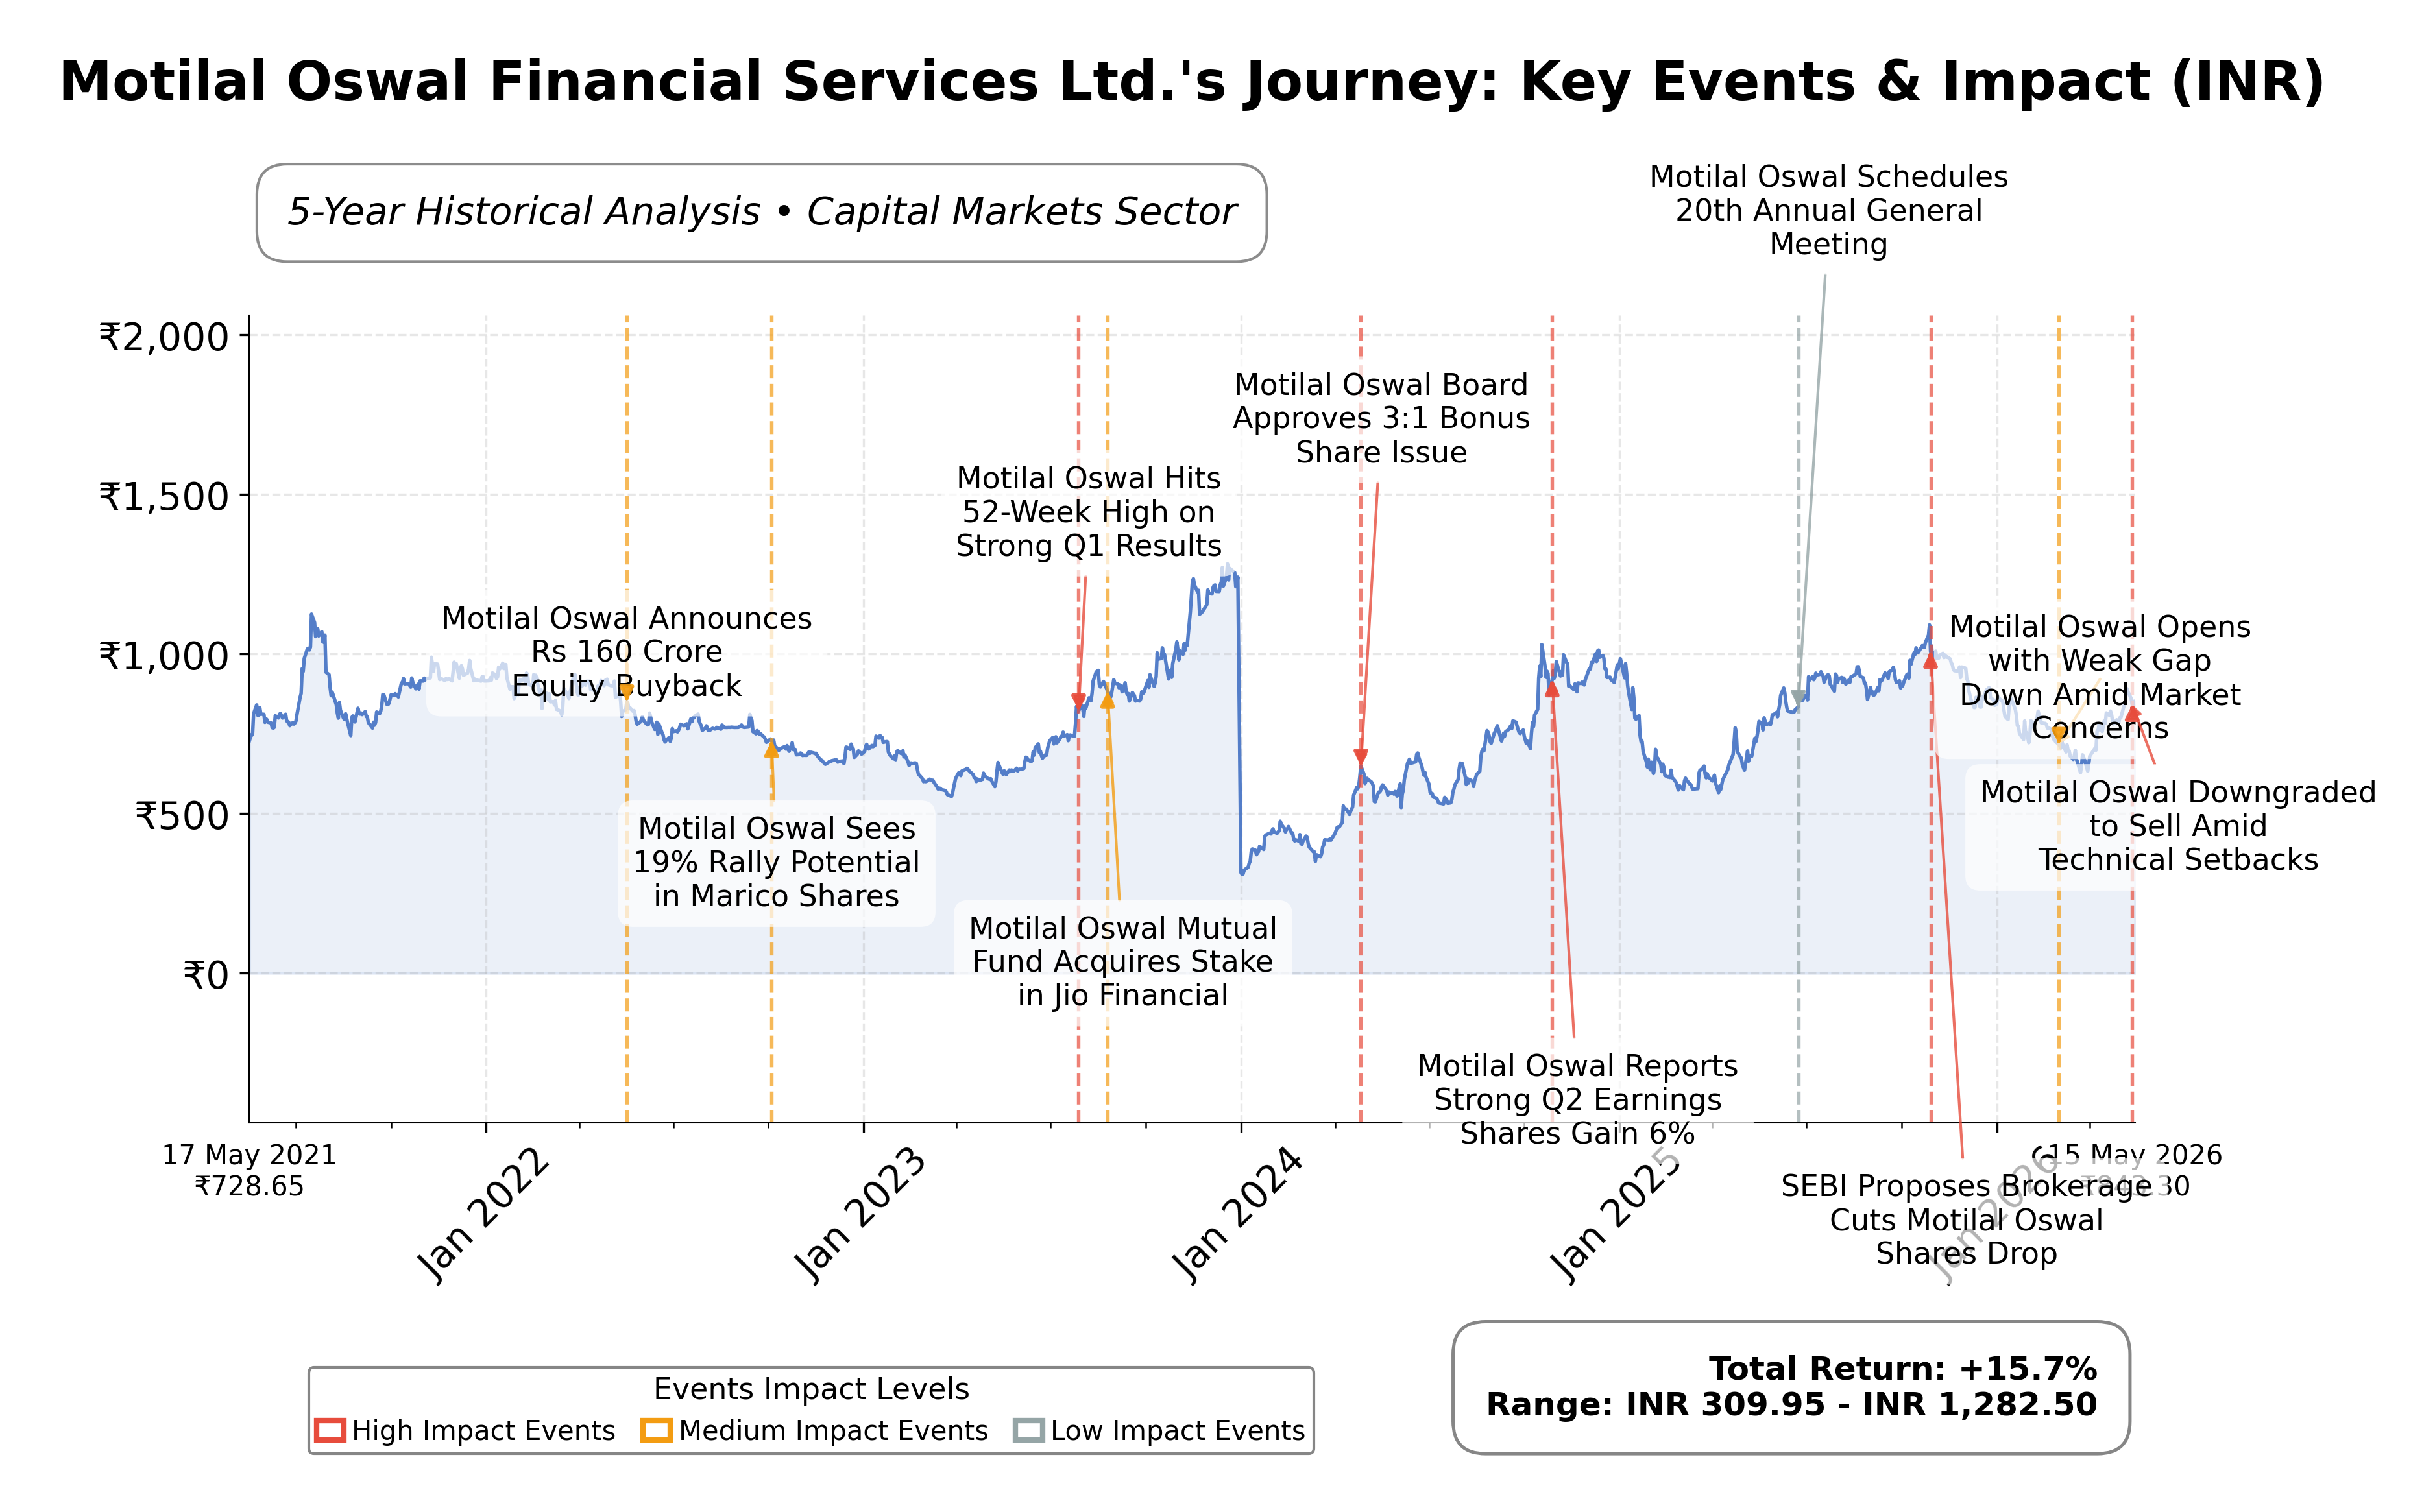
Stock Journey
Key Positives and Key Risks
Pros
- Market capitalization of ₹507.7 billion reflects strong market presence and investor confidence.
- Return on equity of 15.55% indicates efficient use of shareholder capital and profitability.
- Forward P/E ratio of 14.43 suggests anticipated earnings growth and improved valuation.
Cons
- High debt-to-equity ratio of 164.4% raises concerns about financial leverage and risk.
- Negative operating cash flow of INR -60.7 billion indicates potential liquidity challenges.
- Price to CFO ratio is negative at -8.36, signaling cash flow management issues.
Disclosure: This information is for general awareness and does not constitute investment advice
Report Summary
Motilal Oswal Financial Services Ltd. operates as a diversified financial services company headquartered in India, primarily listed on the National Stock Exchange (NSE). The company offers a wide range of financial solutions including investment banking, asset management, wealth management, and brokerage services. Positioned within the Financial Services sector and the Capital Markets industry, Motilal Oswal serves individual investors, corporate clients, and financial institutions through an extensive network across India. Its research-driven approach and comprehensive product offerings have established it as a significant player in the Indian financial ecosystem.
Financially, Motilal Oswal reported trailing twelve months (TTM) revenue of approximately INR 79.7 billion with a gross margin of 57.06%, indicating efficient cost management at the production level. The net profit margin stands at 23.45%, reflecting solid bottom-line profitability despite a negative operating margin of -9.2%, which may be influenced by non-operating expenses or investments. The company’s return on equity (ROE) is 15.55%, and return on assets (ROA) is 4.83%, demonstrating effective utilization of shareholder equity and assets. The return on invested capital (ROIC) is not explicitly provided but can be inferred as moderate given the other profitability metrics.
Valuation metrics show a trailing price-to-earnings (P/E) ratio of 25.64 and a forward P/E of 14.43, suggesting the market anticipates improved earnings in the near term. The price-to-book (P/B) ratio is 3.92, and the enterprise value to EBITDA (EV/EBITDA) ratio is 17.75, indicating the stock is priced at a premium relative to book value and earnings before interest, taxes, depreciation, and amortization. The market capitalization is approximately INR 507.7 billion. The stock’s 52-week range spans from INR 614.9 to INR 1097.1, with the current price near INR 843.3, placing it closer to the mid-range of its annual trading band.
Motilal Oswal’s strengths include robust cash reserves totaling INR 135.8 billion, a strong current ratio of 5.63 reflecting liquidity, and a diversified revenue model across multiple financial services. However, the company carries a significant debt load with total debt at INR 213 billion and a high debt-to-equity ratio of 164.4%, which could pose financial risk. Key risks involve regulatory changes in the financial sector, competitive pressures from other brokerage and asset management firms, and macroeconomic volatility impacting capital markets. Recent strategic activities include participation in international investor events and maintaining a strong presence in advisory and brokerage services.
Technically, the stock is trading above its 50-day moving average but below the 200-day moving average, indicating mixed momentum. Momentum indicators such as RSI and MACD suggest neutral to slightly bullish conditions, while recent news reflects a blend of cautious market outlooks and positive analyst recommendations. Overall, the data suggests a balanced stance with conditions favoring careful monitoring of market developments and company fundamentals.
Company and Industry Overview
Company Basics
Price Performance
Company Size
Shareholding Pattern
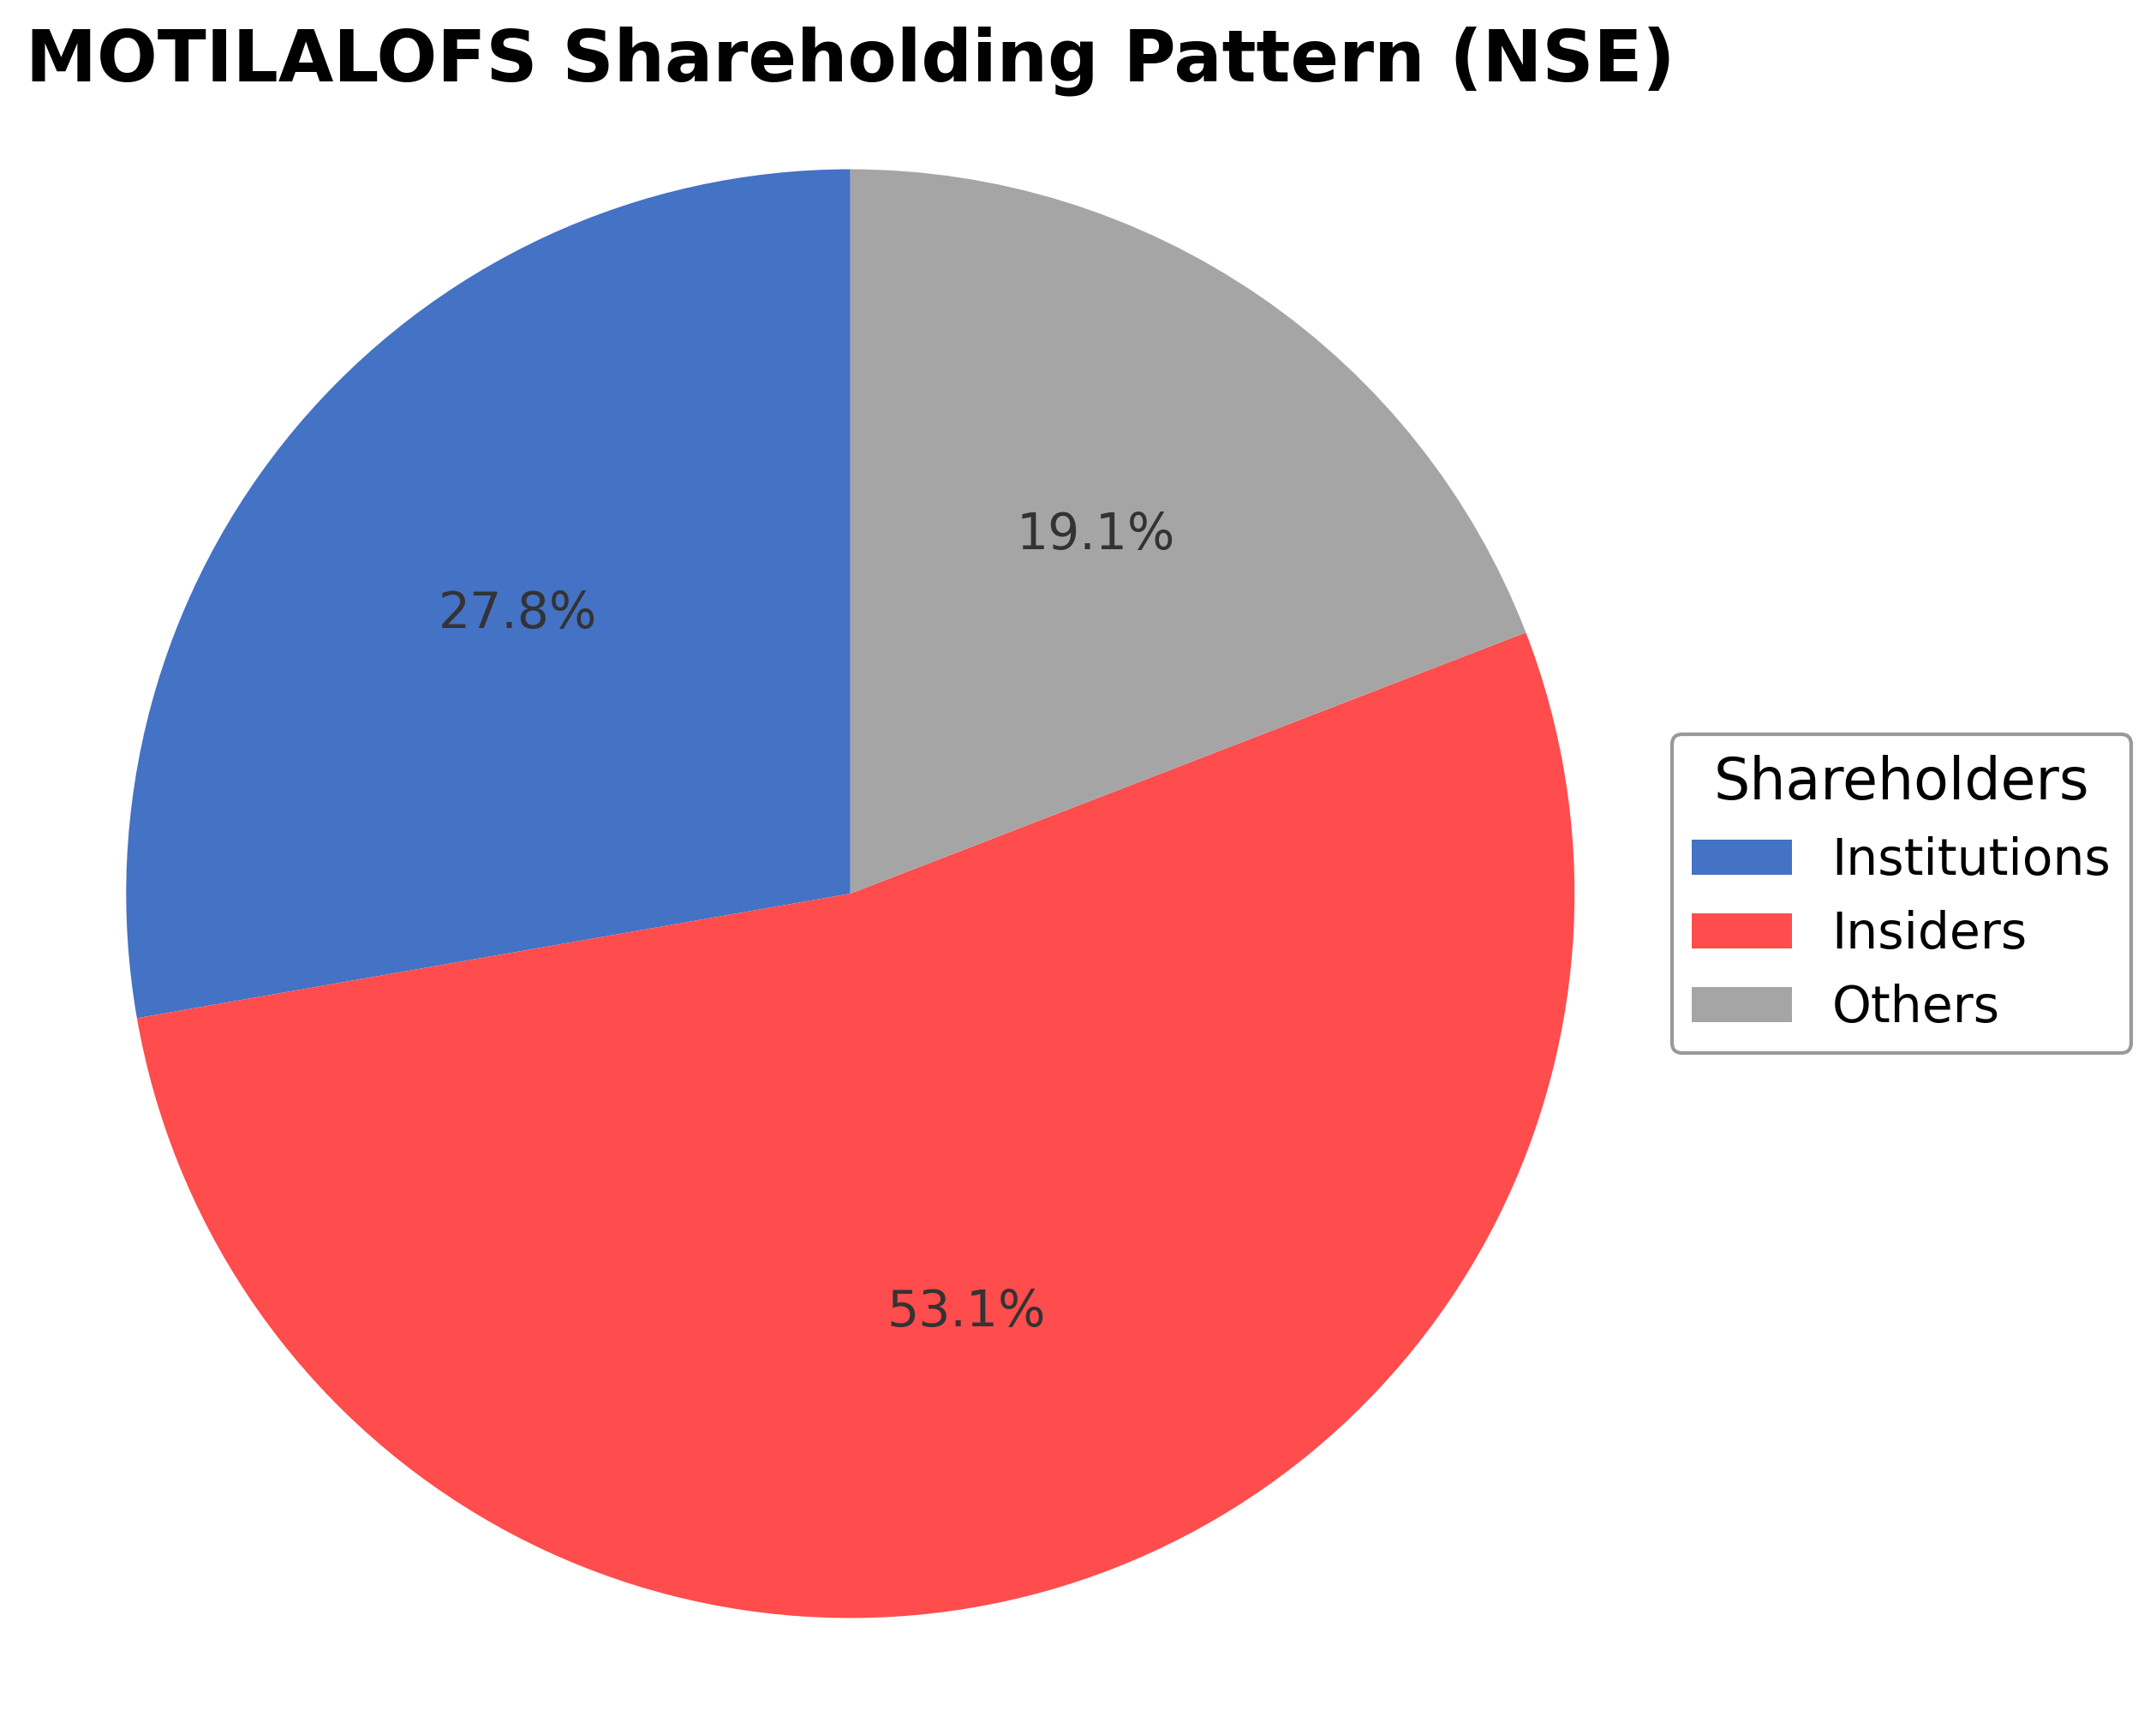
Motilal Oswal Financial Services Ltd. exhibits a shareholding structure dominated by insiders, including executives and board members, holding approximately 53.12% of shares. Institutional investors, comprising mutual funds, pension funds, and asset managers, hold a significant 27.75%, while the public and other shareholders account for around 19.13%. Over the past 12 to 24 months, institutional ownership has shown moderate accumulation, reflecting growing confidence from large investment entities. Major funds have incrementally increased their stakes, suggesting positive market sentiment. This ownership distribution supports stable governance and strategic continuity, positioning the company favorably for future corporate initiatives within the competitive Capital Markets industry.
Sector and Industry Analysis
The stock and commodity brokerage sector in India has witnessed robust growth driven by increasing retail participation and technological advancements in trading platforms. The market size has expanded significantly, supported by rising financial literacy and digital penetration. Key players include Motilal Oswal Financial Services, Zerodha, and ICICI Securities, which dominate through diversified service offerings and extensive distribution networks.
Industry trends highlight a shift towards digital brokerage services, algorithmic trading, and integrated wealth management solutions. Competitive dynamics are shaped by intense price competition, innovation in customer engagement, and the need for scale to maintain profitability. Barriers to entry remain moderate due to regulatory compliance costs and the importance of brand trust and technological infrastructure.
The regulatory environment is governed by the Securities and Exchange Board of India (SEBI), which enforces stringent norms on transparency, client protection, and capital adequacy. Recent regulations emphasize investor protection, data security, and fair trade practices, impacting operational frameworks. The outlook suggests continued regulatory vigilance aimed at fostering market integrity and investor confidence.
Note: Analysis synthesized from industry research, market reports, and regulatory filings. Information is subject to change based on market conditions.
Financial Ratios Dashboard
Illustrative Scenario Analysis
DCF Assumptions:
Method: Two-Stage EPS-Priority Model
Financials
Peer Analysis
| Company Name | Market Cap | P/E Ratio | P/B Ratio | EV/EBITDA | Price to CFO |
|---|---|---|---|---|---|
| Motilal Oswal Financial Services Ltd. | ₹507.70B | 25.64 | 3.92 | 17.75 | -8.36 |
| Angel One Ltd. | ₹279.85B | 31.18 | 4.56 | 10.65 | -6.76 |
| Tata Investment Corporation Limited | ₹342.00B | 78.60 | 1.07 | 3.75 | 122.41 |
| JM Financial Ltd. | ₹127.98B | 10.44 | 1.24 | N/A | 2.31 |
| Icici Securities Ltd. | ₹ 0.00 | N/A | N/A | N/A | N/A |
| Indian Energy Exchange Ltd. | ₹111.40B | 22.61 | 8.22 | 14.46 | 25.74 |
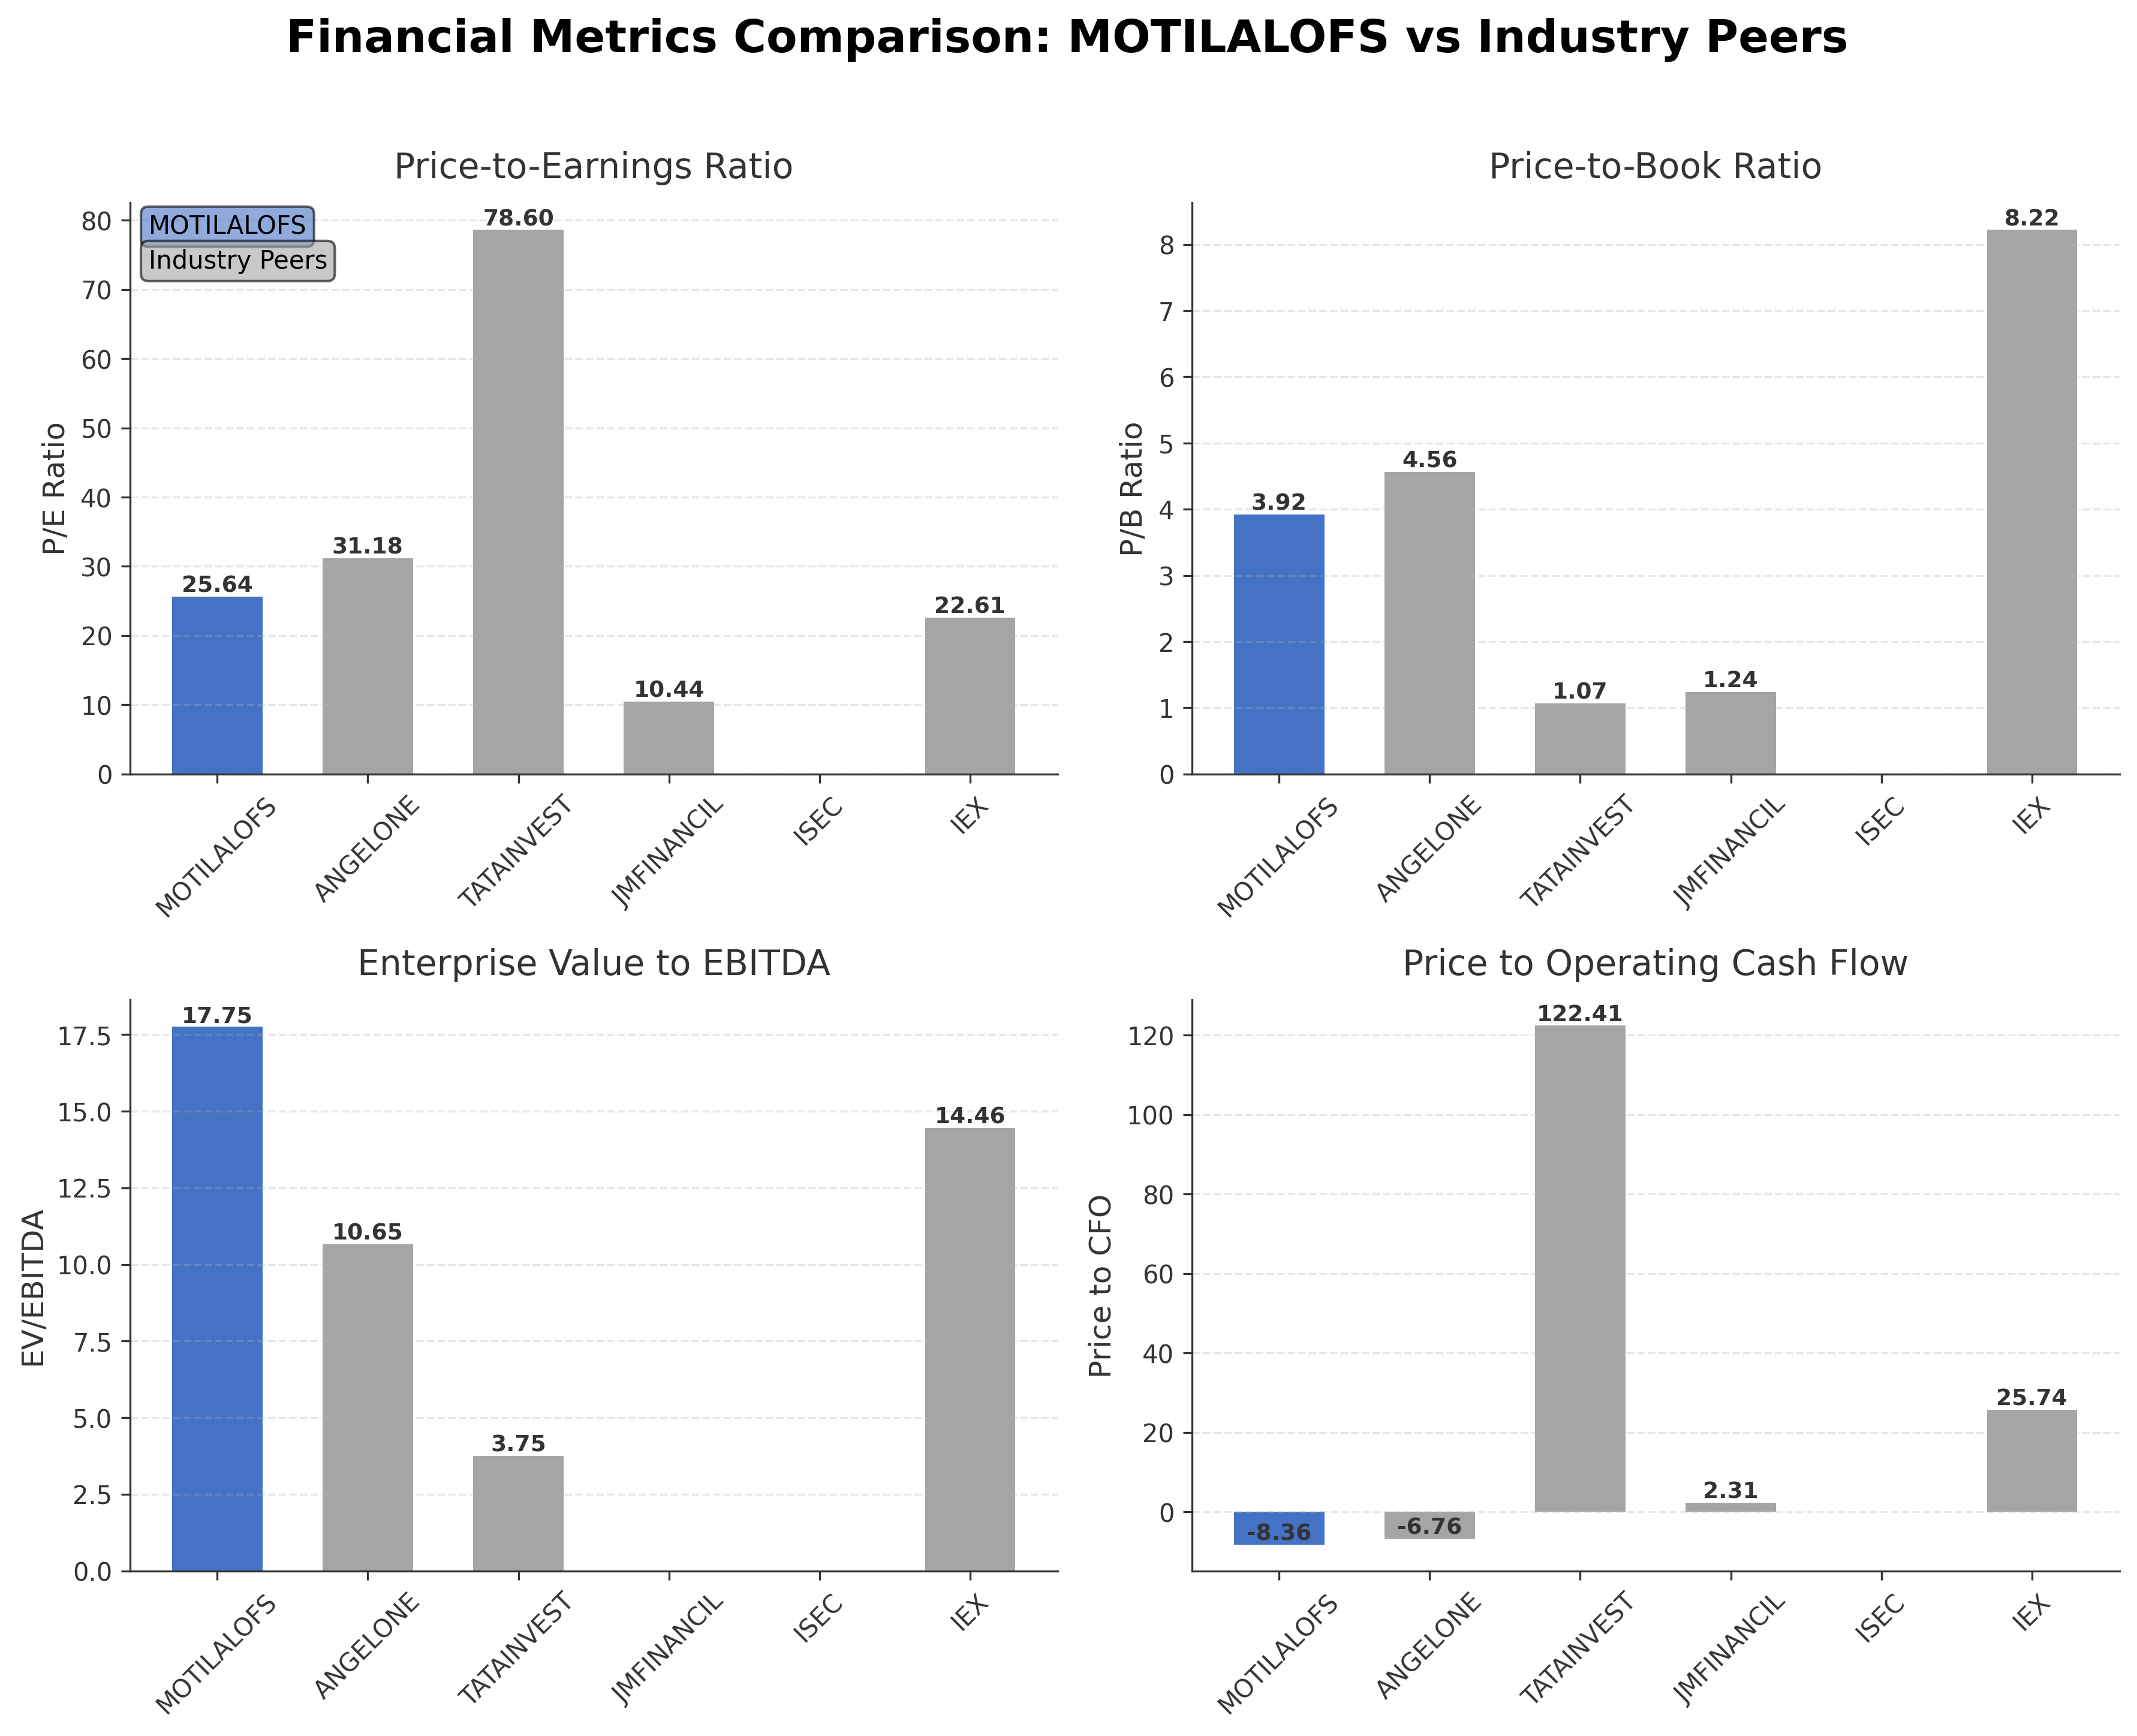
Comparison Analysis: Motilal Oswal Financial Services Ltd. holds the largest market capitalization among its peers at ₹507.70 billion. Its P/E ratio of 25.64 is moderate compared to Angel One Ltd.'s higher 31.18 and significantly lower than Tata Investment Corporation's 78.60, indicating relatively balanced valuation. The company’s P/B ratio of 3.92 is higher than JM Financial Ltd. and Tata Investment but lower than Indian Energy Exchange Ltd., which has a notably high P/B of 8.22. Motilal Oswal’s EV/EBITDA ratio at 17.75 is on the higher side, suggesting premium valuation relative to earnings. Return on equity at 15.55% aligns with Angel One Ltd., reflecting solid profitability. Price to CFO is negative, indicating cash flow challenges compared to some peers with positive values. Overall, Motilal Oswal demonstrates competitive strengths in market cap and profitability, with valuation metrics suggesting a premium positioning within the Indian financial services sector.
Financial Metrics Comparison with Peers
Financial Statements
Comprehensive financial data including income, balance sheet, and cash flow metrics
Income Statement
| fiscal_date | 2025-03-31 | 2024-03-31 | 2023-03-31 | 2022-03-31 | 2021-03-31 |
|---|---|---|---|---|---|
| Sales | 64.42B | 51.37B | 38.19B | 36.68B | 27.02B |
| Cost Of Goods | 29.15B | 23.65B | 17.86B | 17.14B | 12.45B |
| Gross Profit | 35.26B | 27.72B | 20.33B | 19.53B | 14.57B |
| Operating Expense Selling General And Administrative | 4.14B | 2.82B | 2.22B | 1.85B | 1.30B |
| Operating Expense Other Operating Expenses | 2.43B | 2.12B | 1.68B | 1.92B | 1.79B |
| Operating Income | 25.50B | 20.53B | 14.59B | 14.40B | 10.45B |
| Non Operating Interest Income | 6.07B | 4.66B | 2.20B | 1.34B | 641.10M |
| Non Operating Interest Expense | 12.53B | 9.76B | 5.62B | 4.52B | 4.10B |
| Pretax Income | 32.26B | 30.32B | 12.42B | 16.16B | 14.58B |
| Income Tax | 7.18B | 5.86B | 3.09B | 3.05B | 2.55B |
| Net Income | 25.08B | 24.46B | 9.35B | 13.12B | 12.65B |
| Eps Basic | 41.83 | 41.16 | 15.72 | 22.29 | 22.29 |
| Eps Diluted | 41.00 | 40.73 | 15.66 | 22.09 | 22.09 |
| Basic Shares Outstanding | 598.10M | 593.09M | 592.54M | 587.75M | 588.53M |
| Diluted Shares Outstanding | 598.10M | 593.09M | 592.54M | 587.75M | 588.53M |
| Ebit | 44.79B | 40.08B | 18.04B | 20.68B | 18.68B |
| Ebitda | 32.88B | 26.26B | 17.24B | 16.20B | 11.40B |
| Net Income Continuous Operations | 32.26B | 30.32B | 12.42B | 16.16B | 14.58B |
| Minority Interests | -65.40M | -45.50M | -30.90M | -26.70M | -42.80M |
| Preferred Stock Dividends | 0.00 | 0.00 | 0.00 | 0.00 | 0.00 |
Source: Financial statements and regulatory filings
Balance Sheet
| fiscal_date | 2025-03-31 | 2024-03-31 | 2023-03-31 | 2022-03-31 | 2021-03-31 |
|---|---|---|---|---|---|
| Cash And Cash Equivalents | 65.93B | 52.86B | 25.76B | 21.38B | 12.92B |
| Accounts Receivable | 20.84B | 16.03B | 7.45B | 7.25B | 6.57B |
| Total Assets | 339.87B | 318.29B | 230.10B | 169.23B | 141.17B |
| Total Liabilities | 228.56B | 230.60B | 167.27B | 112.23B | 96.23B |
| Long Term Debt | 45.29B | 32.48B | 32.22B | 24.02B | 19.73B |
| Shareholders Equity | 111.31B | 87.69B | 62.83B | 57.01B | 44.94B |
Source: Financial statements and regulatory filings
Cash Flow Statement
| fiscal_date | 2025-03-31 | 2024-03-31 | 2023-03-31 | 2022-03-31 | 2021-03-31 |
|---|---|---|---|---|---|
| Operating Activities Net Income | 32.26B | 30.32B | 12.42B | 16.16B | 14.58B |
| Operating Activities Stock Based Compensation | 587.60M | 249.30M | 290.40M | 240.40M | 198.60M |
| Operating Activities Other Non Cash Items | 112.80M | -12.56B | 1.61B | -4.93B | -8.56B |
| Operating Activities Accounts Receivable | -8.97B | -37.72B | -23.82B | -5.70B | -7.03B |
| Operating Activities Other Assets Liabilities | -20.75B | 764.60M | -13.79B | -1.35B | -13.97B |
| Operating Activities Operating Cash Flow | 3.24B | -18.95B | -23.29B | 4.41B | -14.78B |
| Investing Activities Capital Expenditures | -2.81B | -1.51B | -1.54B | -545.40M | -607.80M |
| Investing Activities Net Intangibles | -32.20M | 54.20M | 0.00 | N/A | N/A |
| Investing Activities Purchase Of Investments | -18.78B | -5.41B | -4.83B | -11.13B | -5.88B |
| Investing Activities Sale Of Investments | 10.74B | 4.29B | 3.53B | 6.16B | 3.73B |
| Investing Activities Investing Cash Flow | -10.85B | -2.62B | -2.83B | -5.51B | -2.76B |
| Financing Activities Long Term Debt Issuance | 4.32B | 29.14B | 22.27B | 3.78B | 19.43B |
| Financing Activities Long Term Debt Payments | -7.60B | -4.14B | -7.86B | -7.16B | -14.14B |
| Financing Activities Short Term Debt Issuance | 13.15B | 9.70B | 26.84B | 7.97B | 5.37B |
| Financing Activities Common Stock Issuance | 717.10M | 772.80M | 103.40M | 339.80M | 151.40M |
| Financing Activities Common Dividends | -3.00B | -2.52B | -1.48B | -867.30M | -289.40M |
| Financing Activities Other Financing Charges | 291.00M | 447.30M | 3.30M | -1.20B | -385.60M |
| Financing Activities Financing Cash Flow | 7.87B | 33.39B | 37.88B | 2.86B | 8.65B |
| End Cash Position | 66.00B | 52.86B | 25.76B | 21.38B | 12.92B |
| Free Cash Flow | 9.30B | -5.00B | -32.12B | 9.56B | -2.03B |
| Financing Activities Common Stock Repurchase | N/A | 0.00 | -1.98B | 0.00 | -1.49B |
Source: Financial statements and regulatory filings
Technical Analysis
Key Insights
- Current trend shows mixed momentum with the stock trading above its 50-day moving average at ₹753.09 but below the 200-day moving average at ₹853.05, indicating short-term strength but longer-term resistance.
- Key support levels are identified near ₹615 (52-week low) and ₹750, while resistance is observed around ₹850 and ₹1097 (52-week high).
- The stock is positioned above the 10-day moving average, suggesting recent upward price movement, but remains below the 200-day moving average, indicating potential medium-term consolidation.
- Momentum indicators show RSI near neutral levels, MACD exhibits mixed signals with no strong divergence, and stochastic oscillators indicate moderate buying pressure.
- Multi-timeframe analysis reveals daily charts showing short-term bullishness, weekly charts indicating sideways consolidation, and monthly charts reflecting a longer-term uptrend.
- Potential market scenarios include a breakout above the 200-day moving average leading to renewed upward momentum or a pullback to support levels if resistance holds.
Trending News
1. Headline: Tata Steel, RBL Bank, Motilal Oswal: Stocks to trade— Check target price, stop loss & more - BusinessToday
Summary: Select buzzing including Tata Steel, RBL Bank Ltd and Motilal Oswal Financial Services Ltd are likely to remain under the spotlight of traders for the session today.
Sentiment: neutral
Summary: According to Siddhartha Khemka - Head of Research, Wealth Management, Motilal Oswal Financial Services Ltd, the near-term outlook remains cautious despite Indian markets witnessing a strong rebound in the past two sessions.
Sentiment: negative
3. Headline: 3 'Buy' recommendations by Motilal Oswal, with 17% to 44% upside potential - Market News | The Financial Express
Summary: Motilal Oswal Financial Services Ltd. maintained its ‘Buy’ rating on Tata Power Company Ltd.
Sentiment: positive
4. Headline: Tata Motors shares decline over 3% after Q4 results. What are Motilal Oswal and Nuvama saying? - The Economic Times
Summary: Tata Motors (Commercial Vehicles) reported strong quarterly earnings with a sharp rise in net profit and revenue, but its stock fell by over 3% amid cautious sentiment on the commercial vehicle sector outlook. Brokerages remain split, with neutral to bullish views on future growth driven by ...
Sentiment: negative
Summary: The new logo addition, cross-selling, and synergy from Broadpath will drive Sagility's revenue/Ebitda/net profit CAGR of 19%/20%/24% over FY25-28, believes Motilal Oswal.
Sentiment: positive
Recent Updates
News Summary
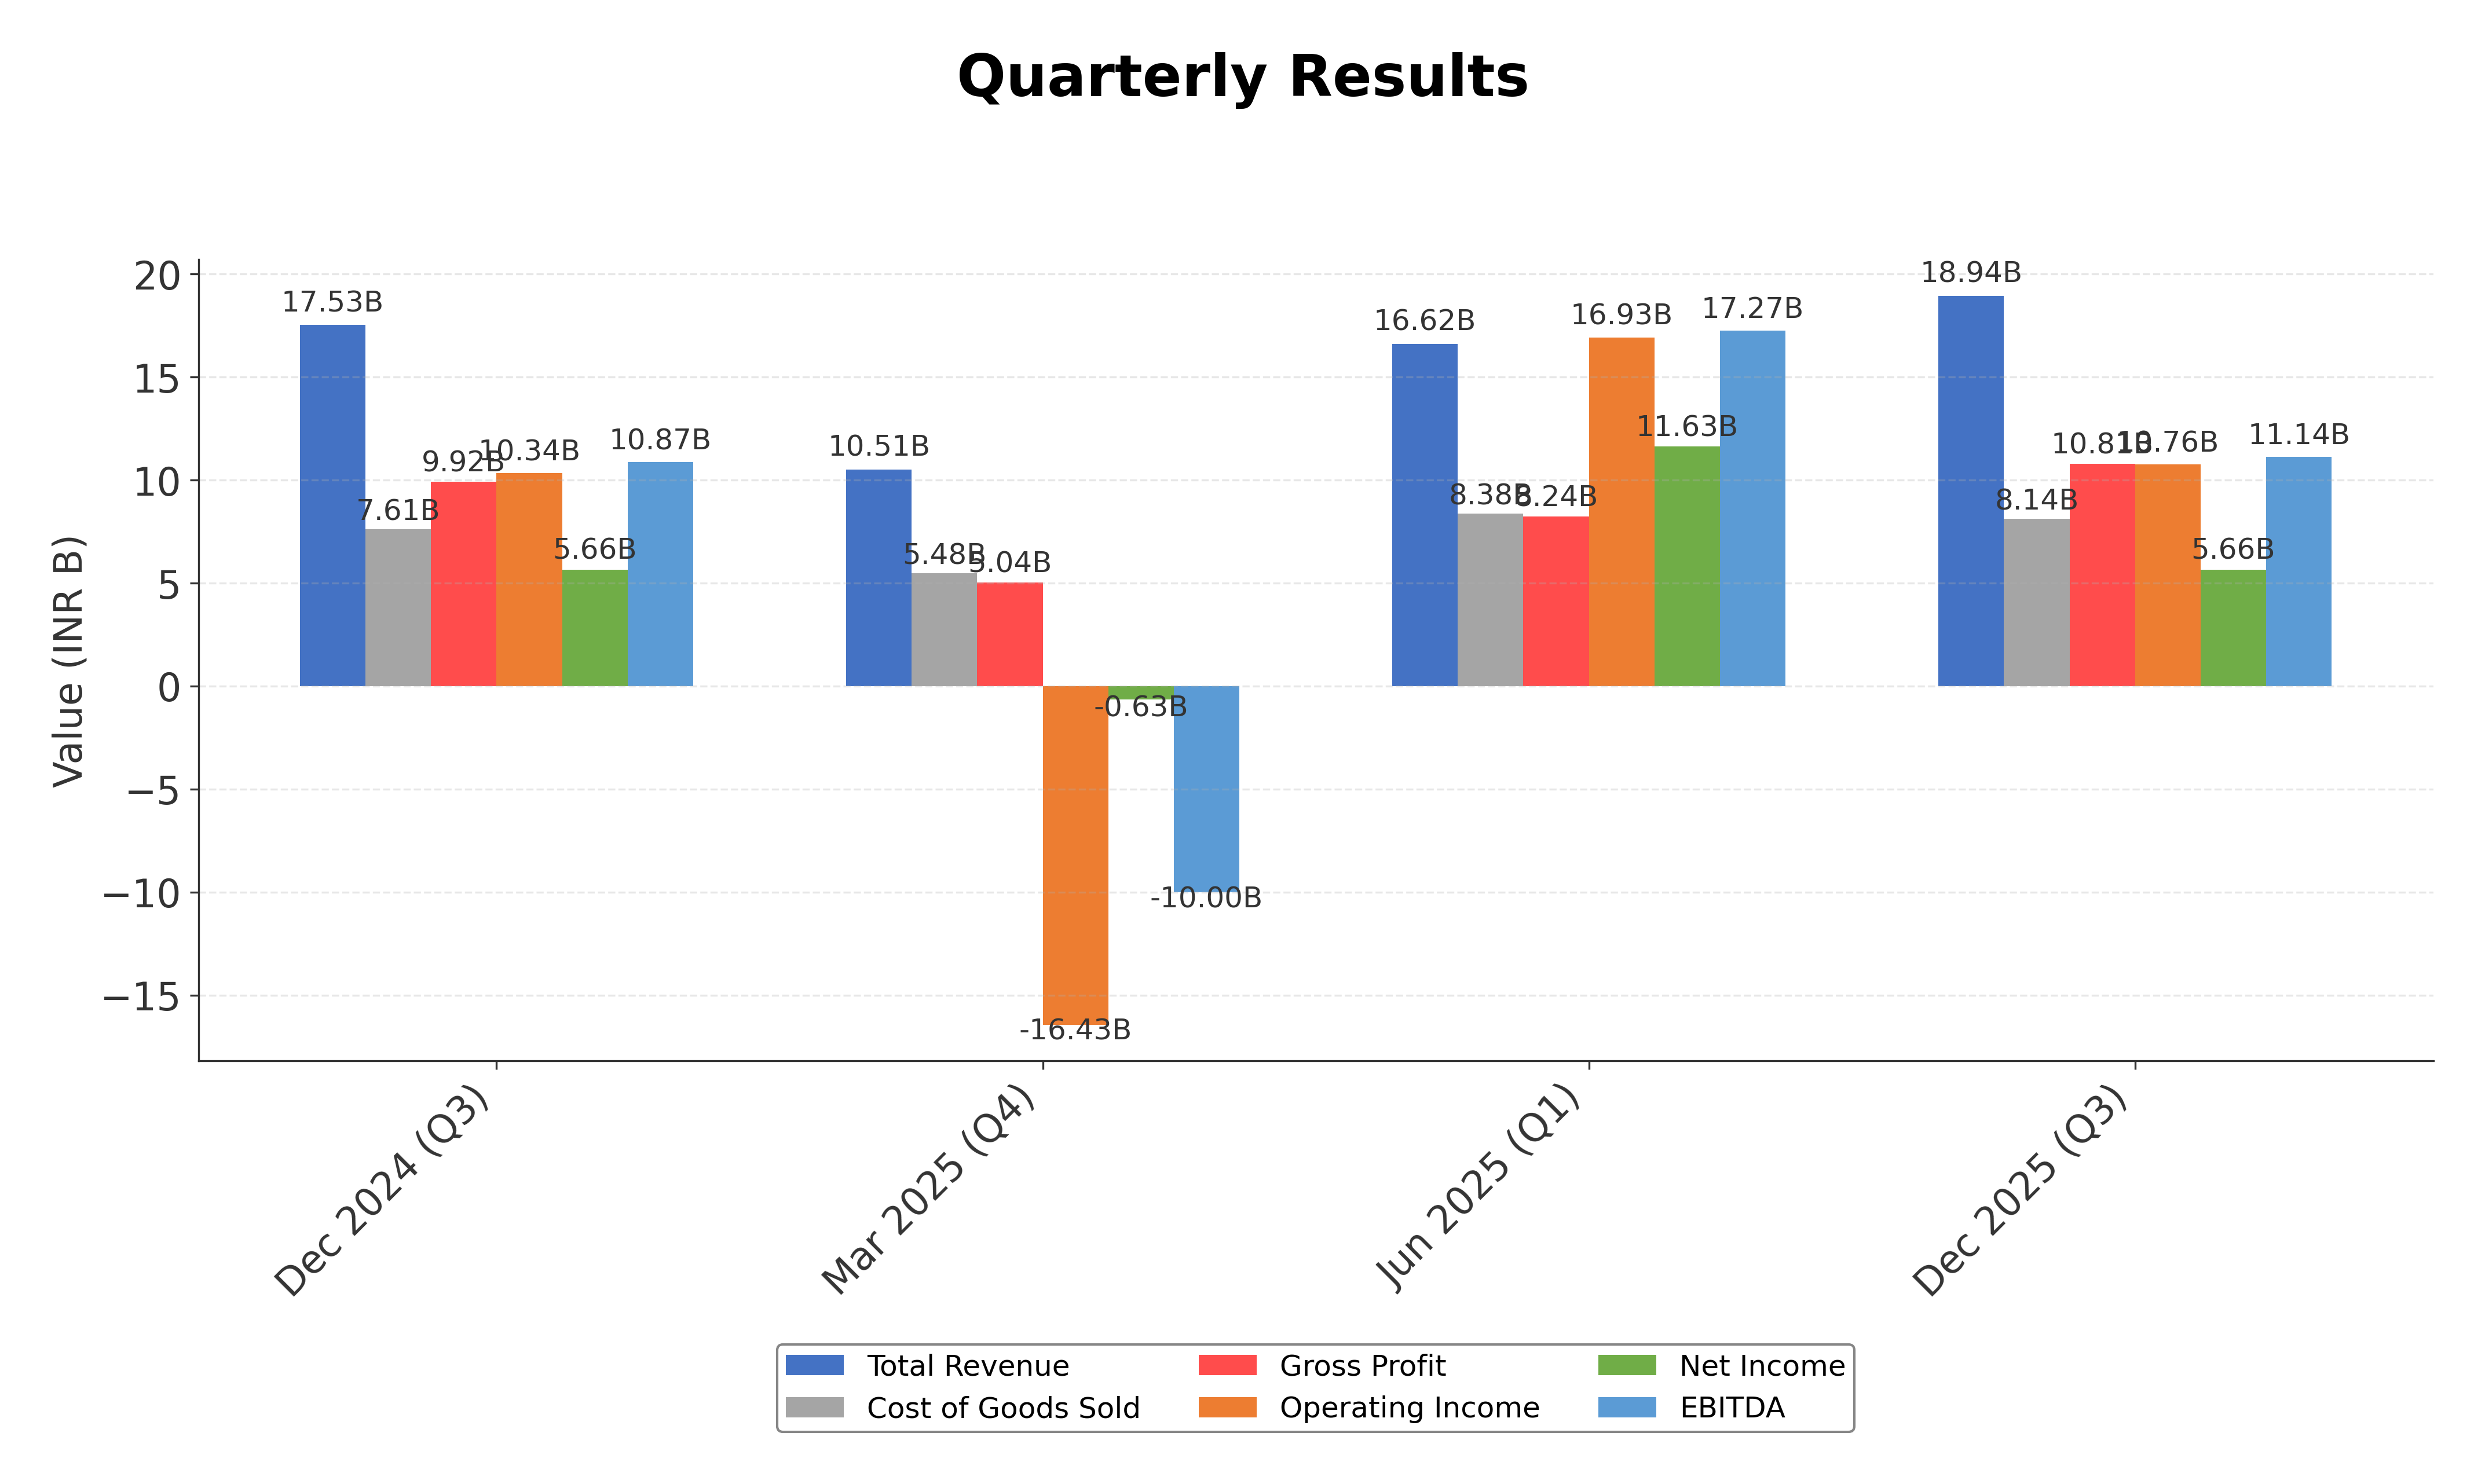
As of May 15, 2026. Motilal Oswal Financial Services Ltd. continues to engage with institutional investors through events such as the Singapore Corporate Day 2026, enhancing its visibility among global investors. The company’s investor relations materials highlight its diversified financial services model, including brokerage, wealth management, and asset management, contributing to multiple revenue streams. Recent quarterly results indicate a 127.06% jump in revenue over the last three months, signaling strong operational momentum. The firm maintains a robust market capitalization exceeding ₹500 billion and a strong liquidity position with a current ratio of 5.63. These developments underscore Motilal Oswal’s strategic focus on growth and investor engagement in a competitive financial services landscape.
News Sentiment
The overall sentiment from recent updates is cautiously positive, driven by strong revenue growth and active investor engagement initiatives. Positive news includes the significant quarterly revenue increase and participation in high-profile investor events, which may enhance market confidence. Neutral tones arise from routine investor relations communications and regulatory disclosures. Negative sentiment is limited and primarily reflects broader market volatility rather than company-specific issues. The balanced sentiment suggests steady operational progress tempered by macroeconomic uncertainties.
Source List
- https://scanx.trade/stock-market-news/companies/jio-financial-services-to-participate-in-motilal-oswal-s-singapore-corporate-day-2026/40144888
- https://www.alphaspread.com/security/nse/motilalofs/investor-relations
- https://trendlyne.com/fundamentals/financials/879/MOTILALOFS/motilal-oswal-financial-services-ltd/
- https://www.indmoney.com/stocks/motilal-oswal-financial-services-ltd-share-price/results
Analytical Overview
Analysis Summary
Motilal Oswal’s valuation metrics show a trailing P/E of 25.64 and a forward P/E of 14.43, which are broadly in line with the industry average P/E of 25.64, indicating the stock is fairly valued relative to its sector peers. The company’s revenue growth rate of 1.52% quarterly and a significant 127.06% jump in recent quarterly revenue demonstrate a positive growth trajectory, although operating cash flow remains negative. Financial health is mixed, with a strong current ratio of 5.63 and substantial cash reserves of INR 135.8 billion, but a high debt-to-equity ratio of 164.4% signals leverage risk. Sector-specific challenges include regulatory oversight in financial services and competitive pressures, while opportunities arise from expanding wealth management and capital market activities in India’s growing economy. Market positioning benefits from diversified revenue streams and a research-driven approach.
Overall Business and Market Assessment
Supporting Factors: the company’s robust revenue growth, diversified business model, and strong liquidity position
Risk Factors: the elevated debt levels and negative operating cash flow, which could impact financial flexibility
SWOT Analysis
Strengths
- Robust revenue growth with diversified financial services offerings.
- Strong liquidity position with a current ratio of 5.63 and substantial cash reserves.
- Established market presence and research-driven advisory services.
- Solid return on equity at 15.55% indicating effective capital utilization.
Weaknesses
- High debt-to-equity ratio of 164.4% indicating significant leverage.
- Negative operating cash flow despite positive net income.
- Price to CFO ratio is negative, suggesting cash flow challenges.
- Operating margin is negative at -9.2%, reflecting operational inefficiencies.
Opportunities
- Expanding wealth management and asset management sectors in India.
- Increasing institutional investor interest and participation.
- Potential for growth through strategic partnerships and international investor events.
- Rising capital market activities supporting brokerage and advisory services.
Threats
- Regulatory changes impacting financial services operations.
- Intense competition from other brokerage and financial advisory firms.
- Macroeconomic volatility affecting capital markets and investor sentiment.
- Rising interest rates potentially increasing borrowing costs.
Company Description
Motilal Oswal Financial Services Ltd. is a diversified financial services company based in India, renowned for providing a broad spectrum of financial solutions and investment products. Established in 1987, the firm's primary function is to offer investment banking, asset management, wealth management, and brokerage services. It caters to individual investors, corporate clients, and financial institutions, leveraging a robust network of branches and franchisees across India. One of the notable features of Motilal Oswal is its research-driven approach, offering market-leading insights and advisory services to clients. The company's significant role in the financial market is evidenced by its consistent contribution to capital market activities and investment advisory, making it a pivotal player in facilitating informed investment decisions. Through strategic innovations and comprehensive offerings, Motilal Oswal Financial Services Ltd. continues to be instrumental in shaping the financial fortunes of its diverse clientele.