


Motilal Oswal Financial Services Ltd (MOTILALOFS)
Stock Analysis Report
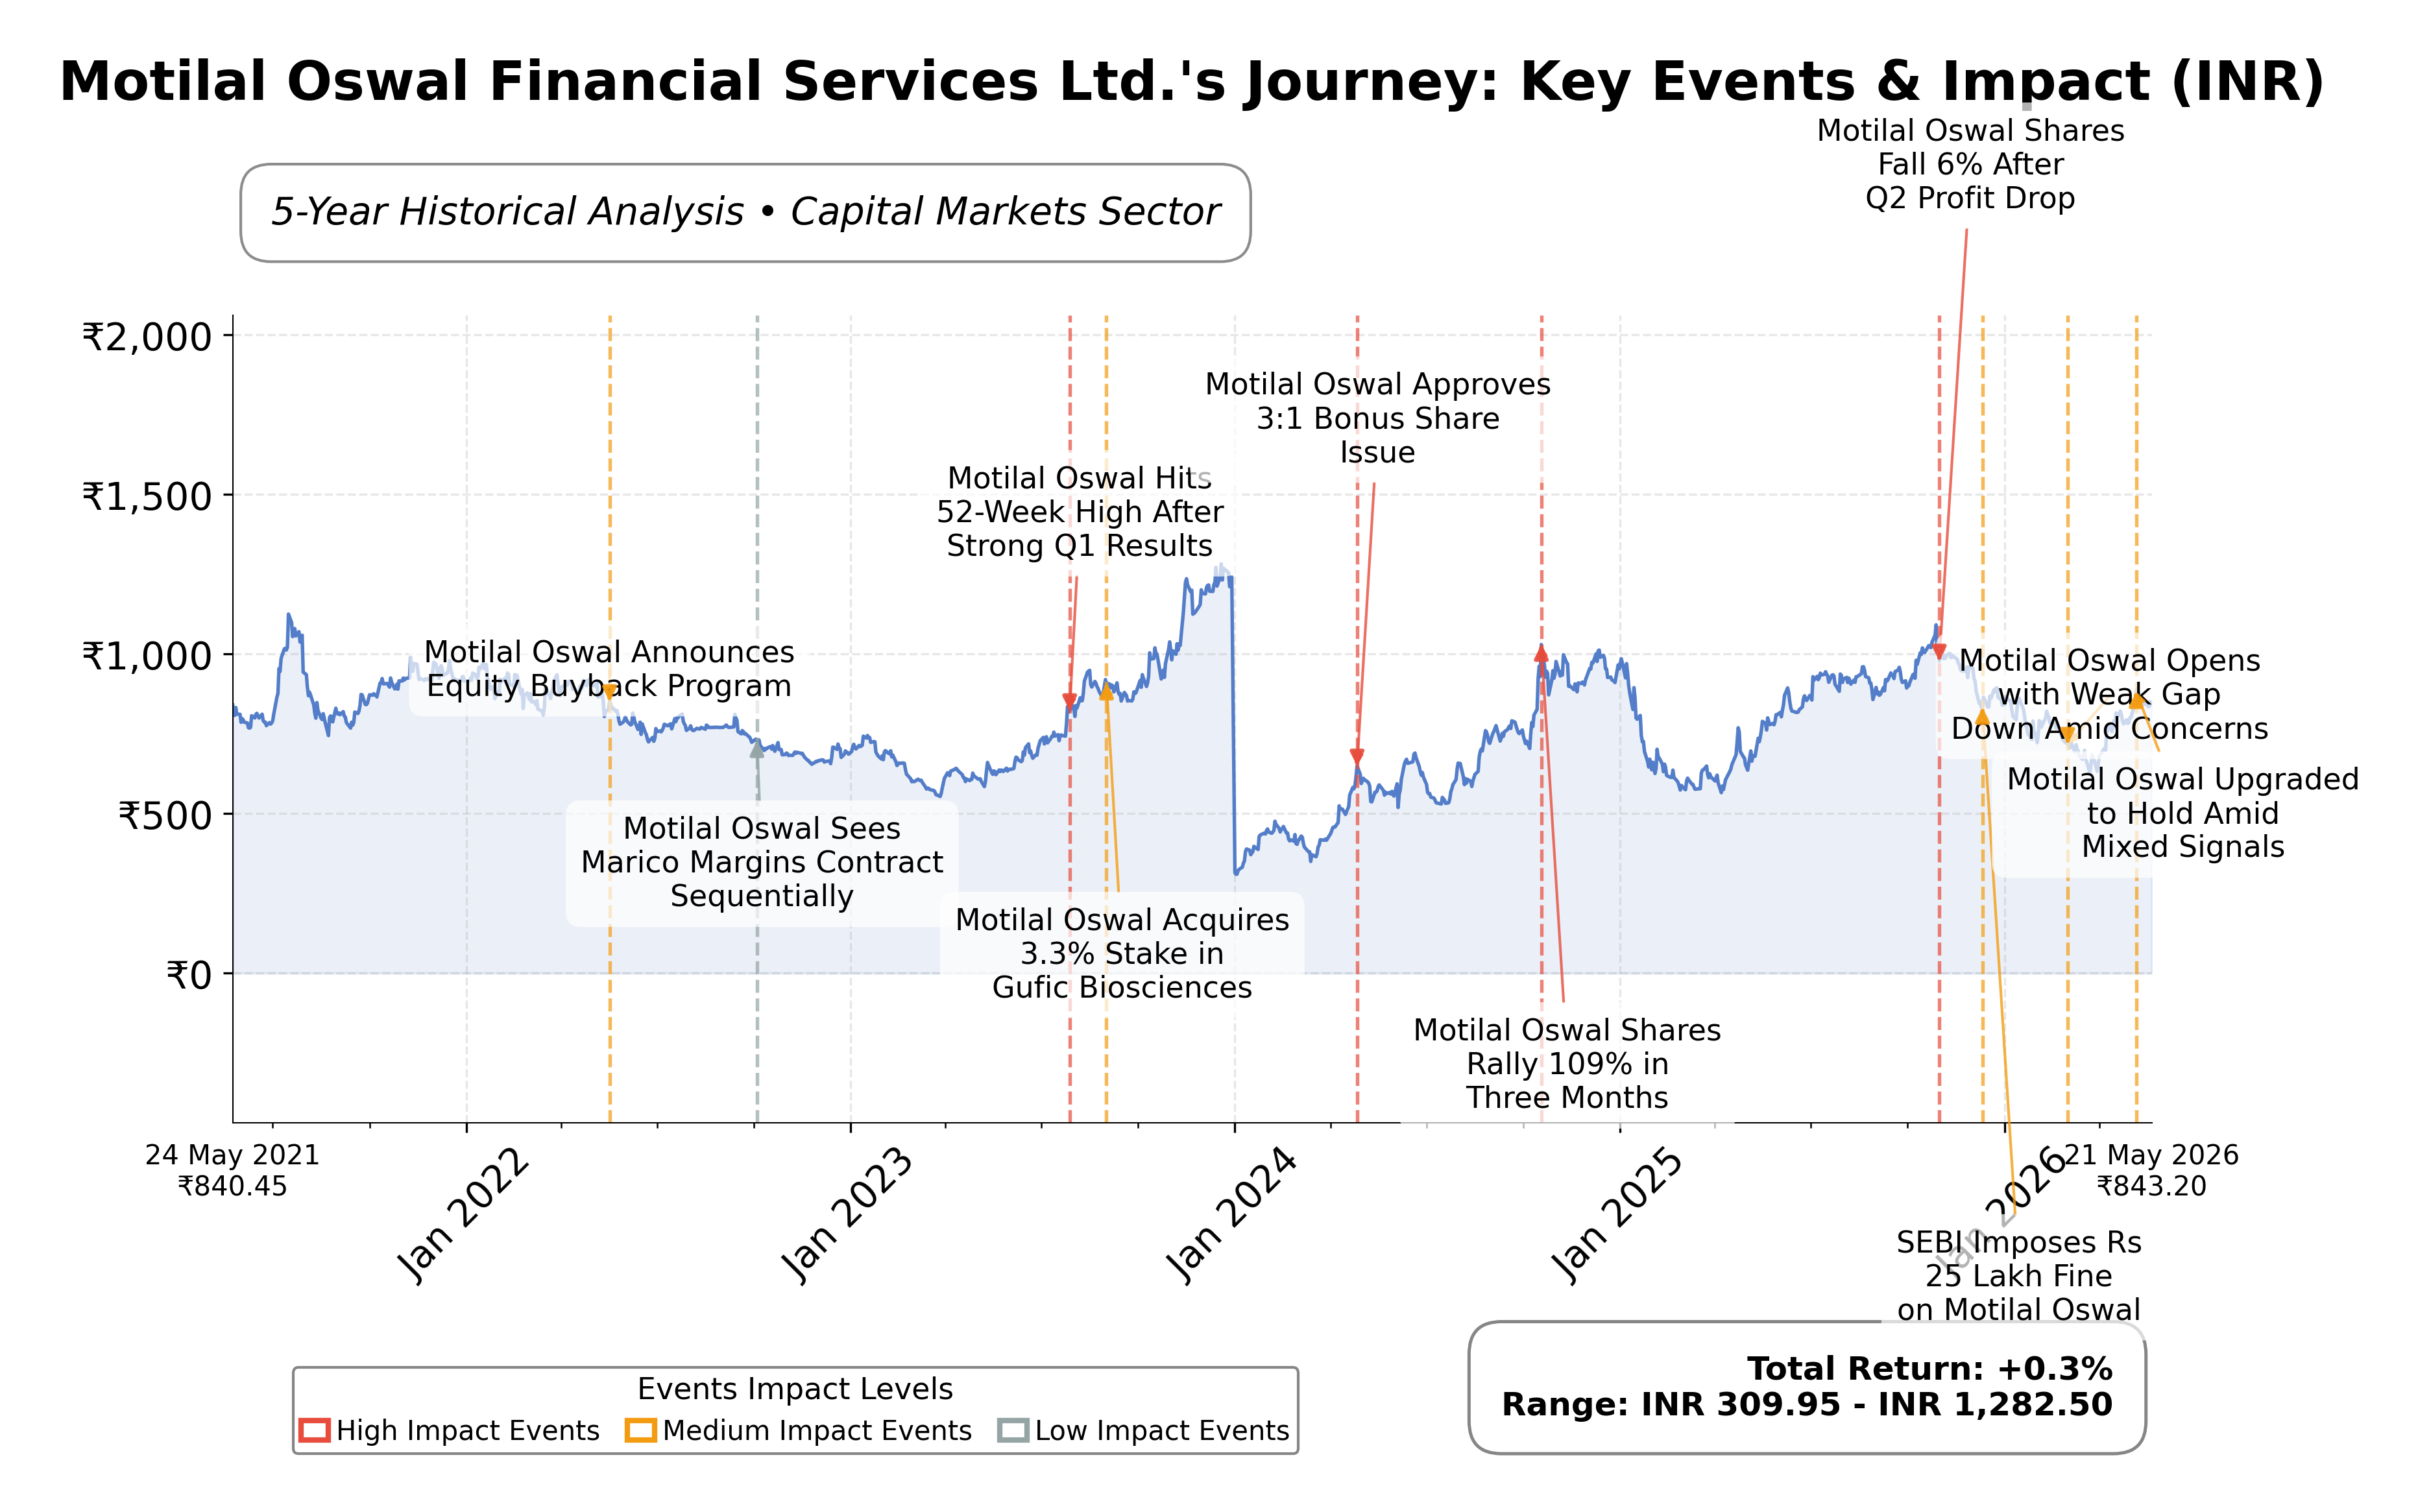
Stock Journey
Key Positives and Key Risks
Pros
- Market capitalization of ₹507.7 billion reflects substantial scale and market presence.
- Return on equity of 15.55% indicates efficient use of shareholder capital to generate profits.
- Forward P/E of 14.43 suggests valuation discount relative to trailing P/E, implying expected earnings growth.
Cons
- High debt-to-equity ratio of 164.4% raises concerns about financial leverage and risk.
- Negative operating margin of -9.2% points to operational inefficiencies impacting profitability.
- Negative price to cash flow ratio (-8.36) signals challenges in converting earnings to cash flow.
Disclosure: This information is for general awareness and does not constitute investment advice
Report Summary
Motilal Oswal Financial Services Ltd. is a prominent Indian financial services company listed on the NSE, operating primarily in the financial services sector with a focus on capital markets. The company offers a diversified range of services including investment banking, asset management, wealth management, and brokerage services. It serves a broad client base comprising individual investors, corporate clients, and financial institutions, leveraging an extensive network across India. Its market positioning is reinforced by a research-driven approach that supports its advisory and investment activities, making it a key player in India’s financial services industry.
Financially, Motilal Oswal reported a trailing twelve months (TTM) revenue of approximately INR 79.7 billion with a gross margin of 57.06%. The company’s net profit margin stands at 23.45%, indicating strong profitability, although the operating margin is negative at -9.2%, suggesting some operational challenges. Return on equity (ROE) is 15.55%, and return on assets (ROA) is 4.84%, reflecting efficient use of equity and assets to generate earnings. The return on invested capital (ROIC) is not explicitly stated but can be inferred as moderate given the other profitability metrics.
Valuation metrics show a trailing price-to-earnings (P/E) ratio of 25.64 and a forward P/E of 14.43, indicating the stock is priced with some expectation of earnings growth. The price-to-book (P/B) ratio is 3.92, and the enterprise value to EBITDA (EV/EBITDA) ratio is 17.75, suggesting a premium valuation relative to earnings and book value. The market capitalization is approximately INR 507.7 billion. The stock trades within a 52-week range of INR 614.9 to INR 1097.1, with the current price around INR 850.80, positioning it below its recent high but well above the low.
Motilal Oswal’s strengths include a strong cash position of INR 135.8 billion against total debt of INR 213.0 billion, a high current ratio of 5.63 indicating liquidity, and a diversified business model with multiple revenue streams. Key risks involve the negative operating margin, high debt-to-equity ratio of 164.4%, and exposure to regulatory and competitive pressures in the financial services sector. Recent strategic actions include a 4-for-1 stock split executed in June 2024 and ongoing efforts to expand wealth and asset management services.
Technically, the stock is trading above its 50-day moving average but below the 200-day moving average, indicating mixed momentum. Momentum indicators such as RSI and MACD suggest moderate strength without clear directional bias. Recent news highlights mixed market sentiment with some positive outlooks on sector growth balanced by macroeconomic uncertainties. Overall, the data suggests a cautious stance with potential for accumulation under favorable conditions, while monitoring operational and market risks.
Company and Industry Overview
Company Basics
Price Performance
Company Size
Shareholding Pattern
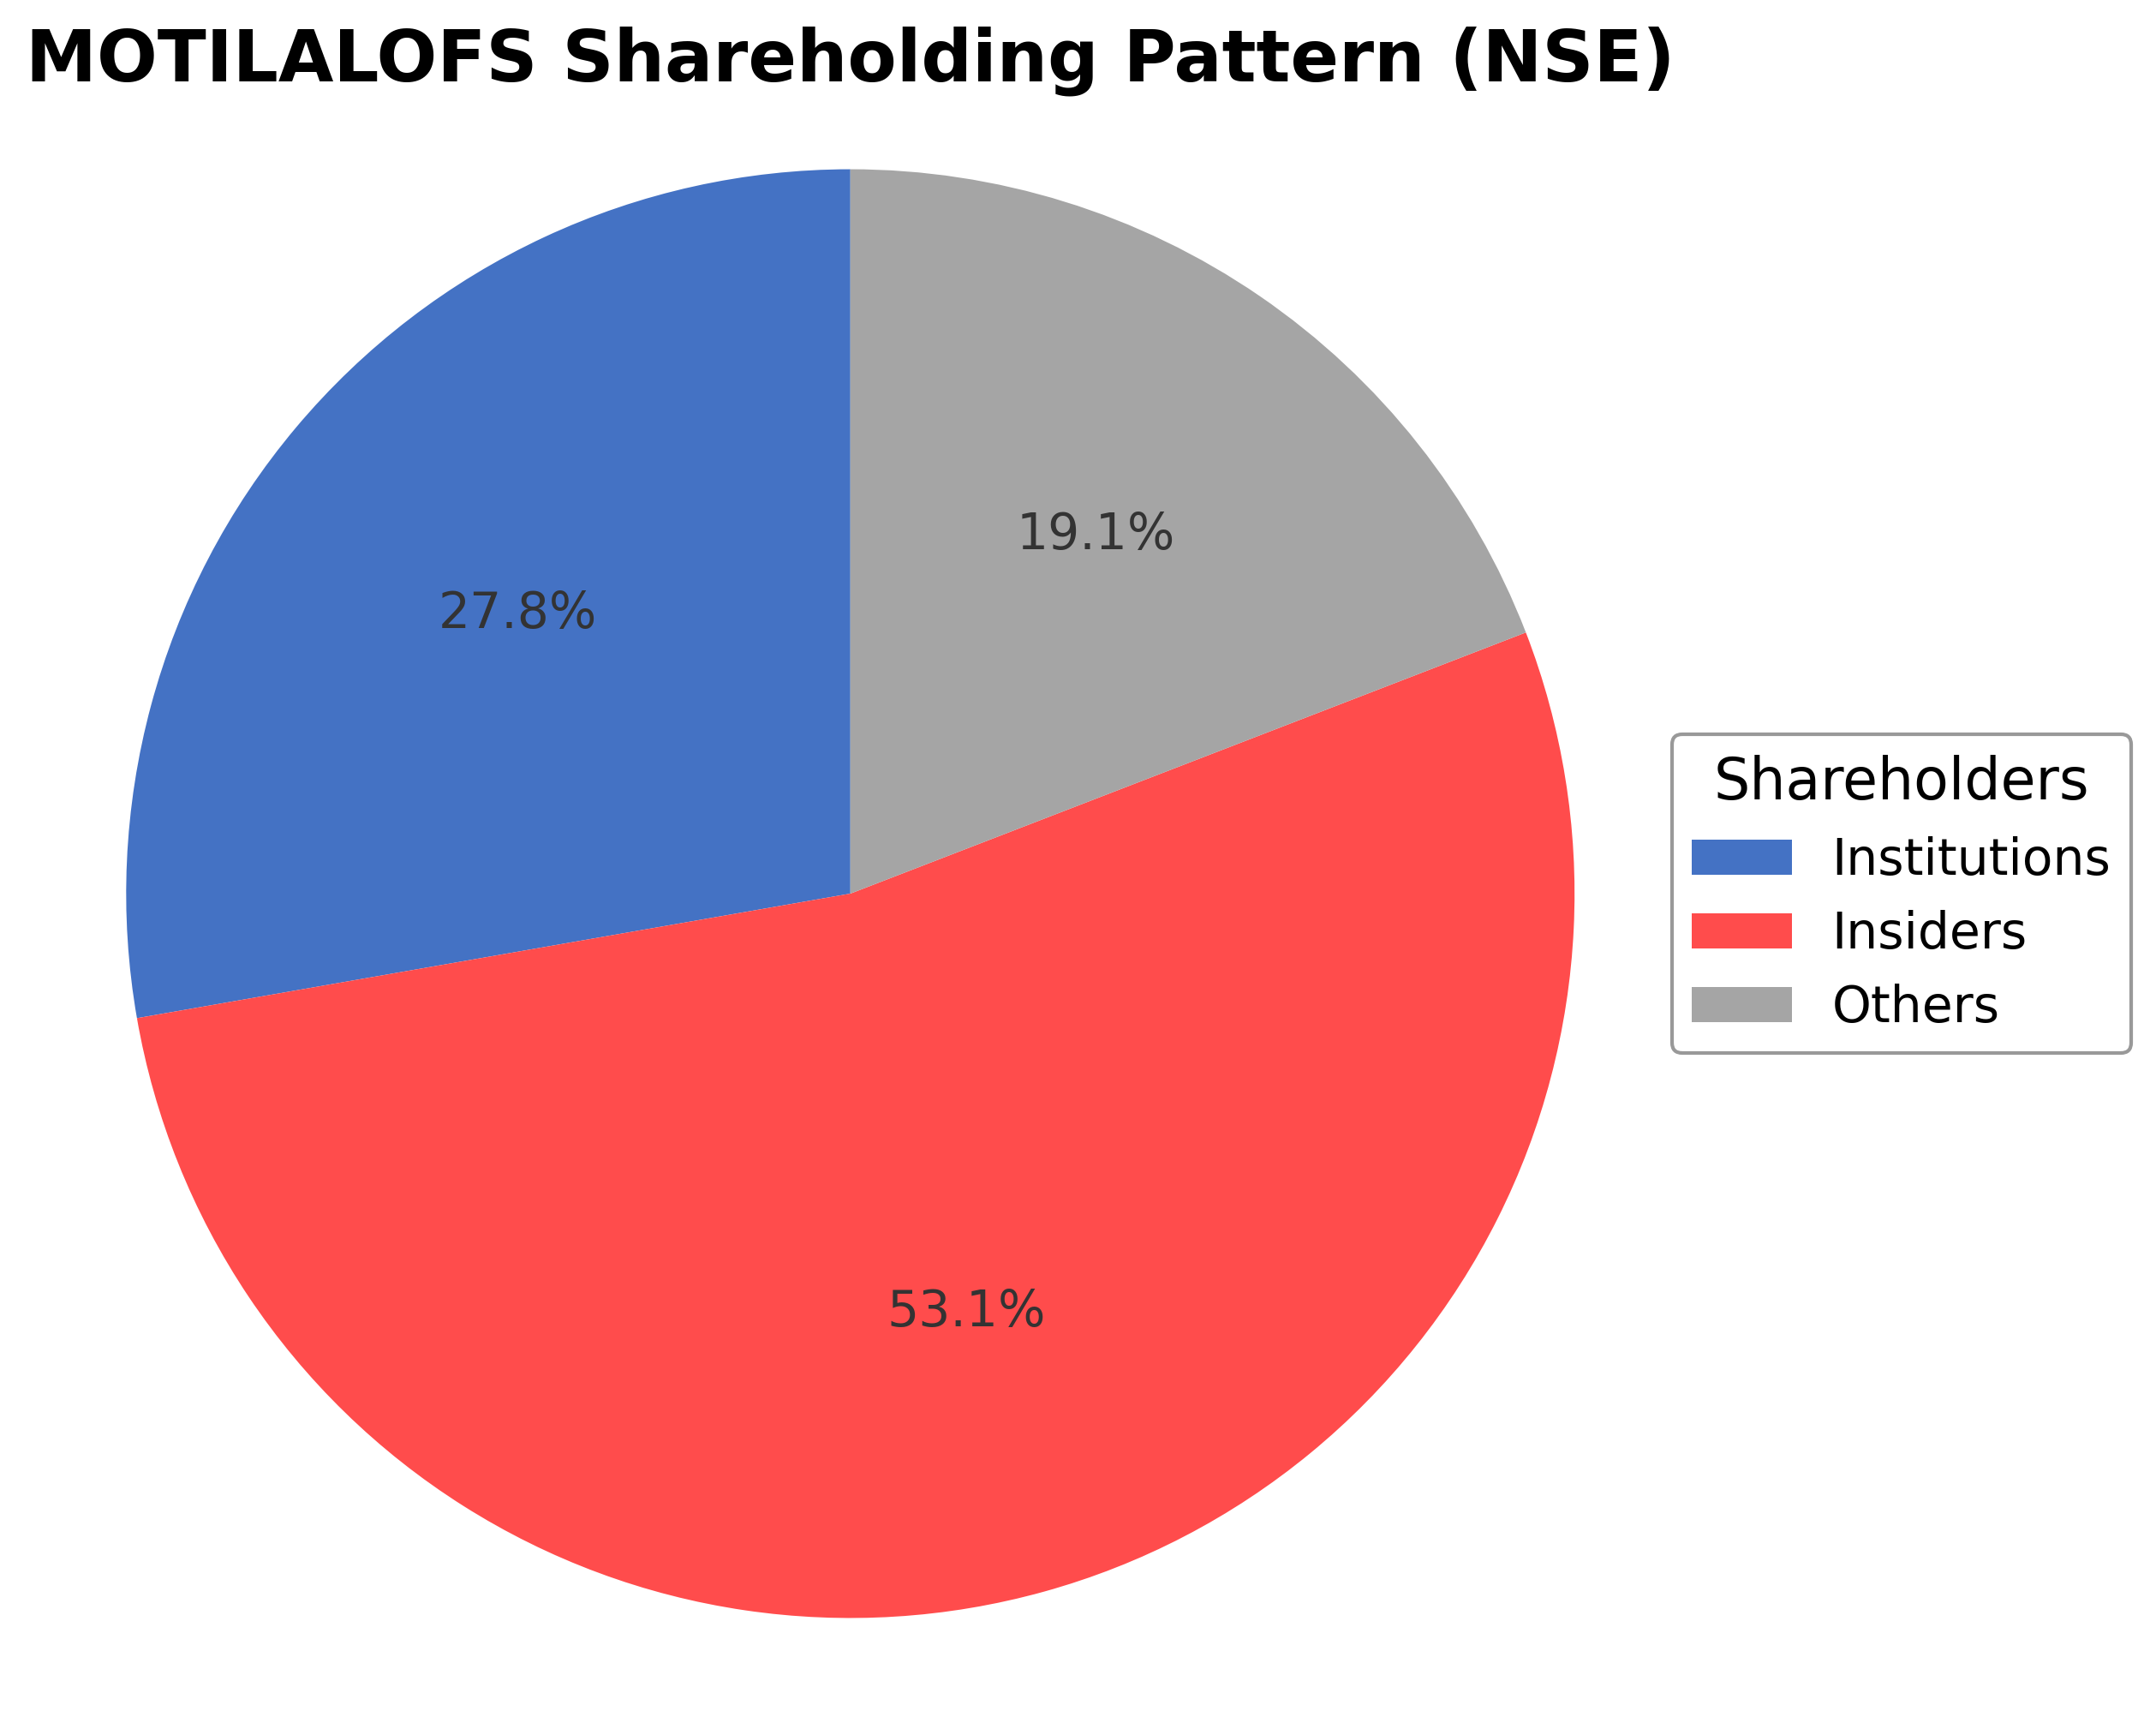
Motilal Oswal Financial Services Ltd. exhibits a shareholding structure dominated by insiders holding 53.12%, institutional investors controlling 27.75%, and public shareholders comprising 19.13%. Over the past 12 to 24 months, insider ownership has remained relatively stable, while institutional investors have shown moderate accumulation, reflecting confidence from mutual funds and asset managers. Major institutional stakeholders have incrementally increased their positions, signaling positive market sentiment. This ownership distribution supports strong governance and strategic continuity, positioning the company well within the competitive financial services industry in India.
Sector and Industry Analysis
India’s power transmission sector is undergoing significant expansion, driven by a planned investment pipeline of approximately Rs. 9 lakh crore under the National Electricity Plan for FY23–32. This growth phase is bolstered by rising domestic demand and export opportunities, with key players including major transmission equipment manufacturers and financial services firms supporting infrastructure development. The sector’s market size is expanding rapidly as India pushes to upgrade and expand its electricity grid to meet increasing consumption and renewable integration targets.
Key industry trends include a shift towards high-voltage direct current (HVDC) systems and more complex transmission technologies essential for long-distance power transfer and renewable energy integration. Capacity constraints in transformer manufacturing have created short-term supply bottlenecks, prompting major companies to invest in capacity expansions. Indian manufacturers are also capitalizing on global supply shortages, particularly in markets like the US and Europe, enhancing their competitive positioning through export growth and technological advancements.
The regulatory environment supports the sector’s expansion through government initiatives aimed at modernizing the grid and integrating renewable energy sources. Policies promoting grid stability and energy storage, such as battery energy storage systems (BESS), are expected to further stimulate demand for transmission infrastructure. Continued regulatory focus on infrastructure investment and renewable integration underpins a positive sector outlook, with sustained growth anticipated as capacity constraints ease and new projects come online.
Note: Analysis synthesized from industry research, market reports, and regulatory filings. Information is subject to change based on market conditions.
Financial Ratios Dashboard
Illustrative Scenario Analysis
DCF Assumptions:
Method: Two-Stage EPS-Priority Model
Financials
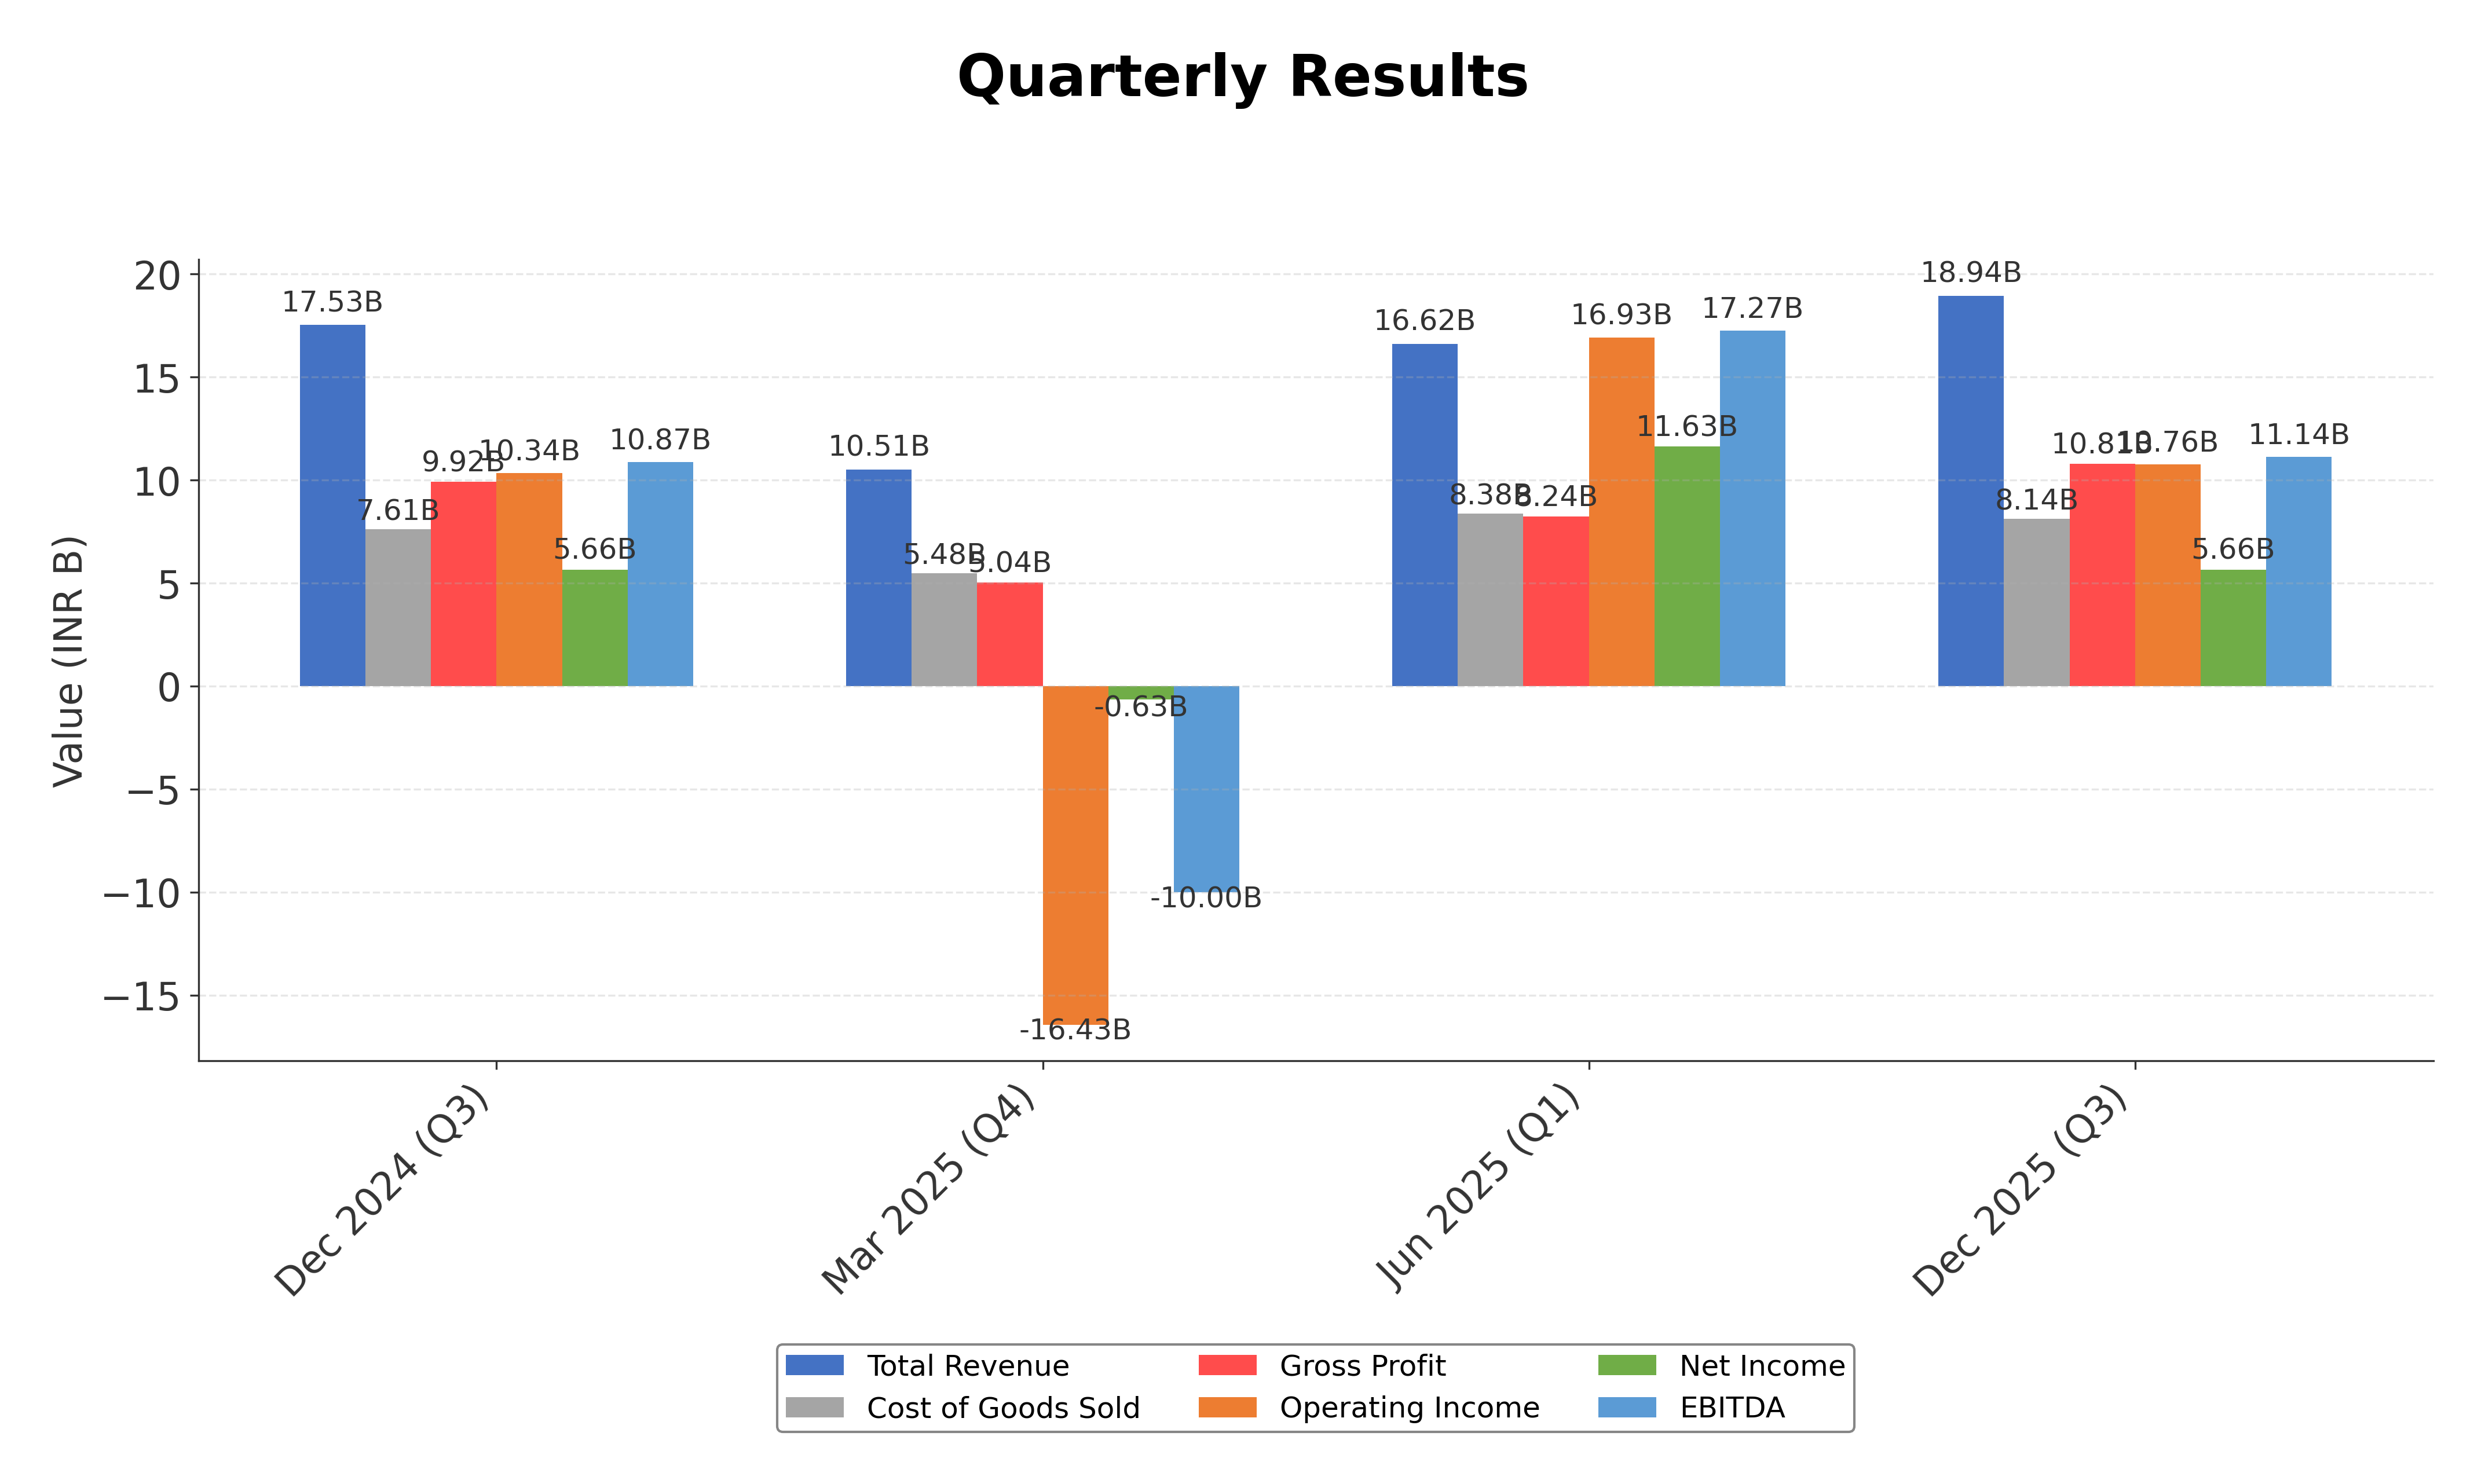
Peer Analysis
| Company Name | Market Cap | P/E Ratio | P/B Ratio | EV/EBITDA | Price to CFO |
|---|---|---|---|---|---|
| Motilal Oswal Financial Services Ltd. | ₹507.70B | 25.64 | 3.92 | 17.75 | -8.36 |
| Angel One Ltd. | ₹279.85B | 31.18 | 4.56 | 10.65 | -6.76 |
| Tata Investment Corporation Limited | ₹342.00B | 78.60 | 1.07 | 3.75 | 122.41 |
| JM Financial Ltd. | ₹127.98B | 10.44 | 1.24 | N/A | 2.31 |
| Icici Securities Ltd. | ₹ 0.00 | N/A | N/A | N/A | N/A |
| Indian Energy Exchange Ltd. | ₹111.40B | 22.61 | 8.22 | 14.46 | 25.74 |
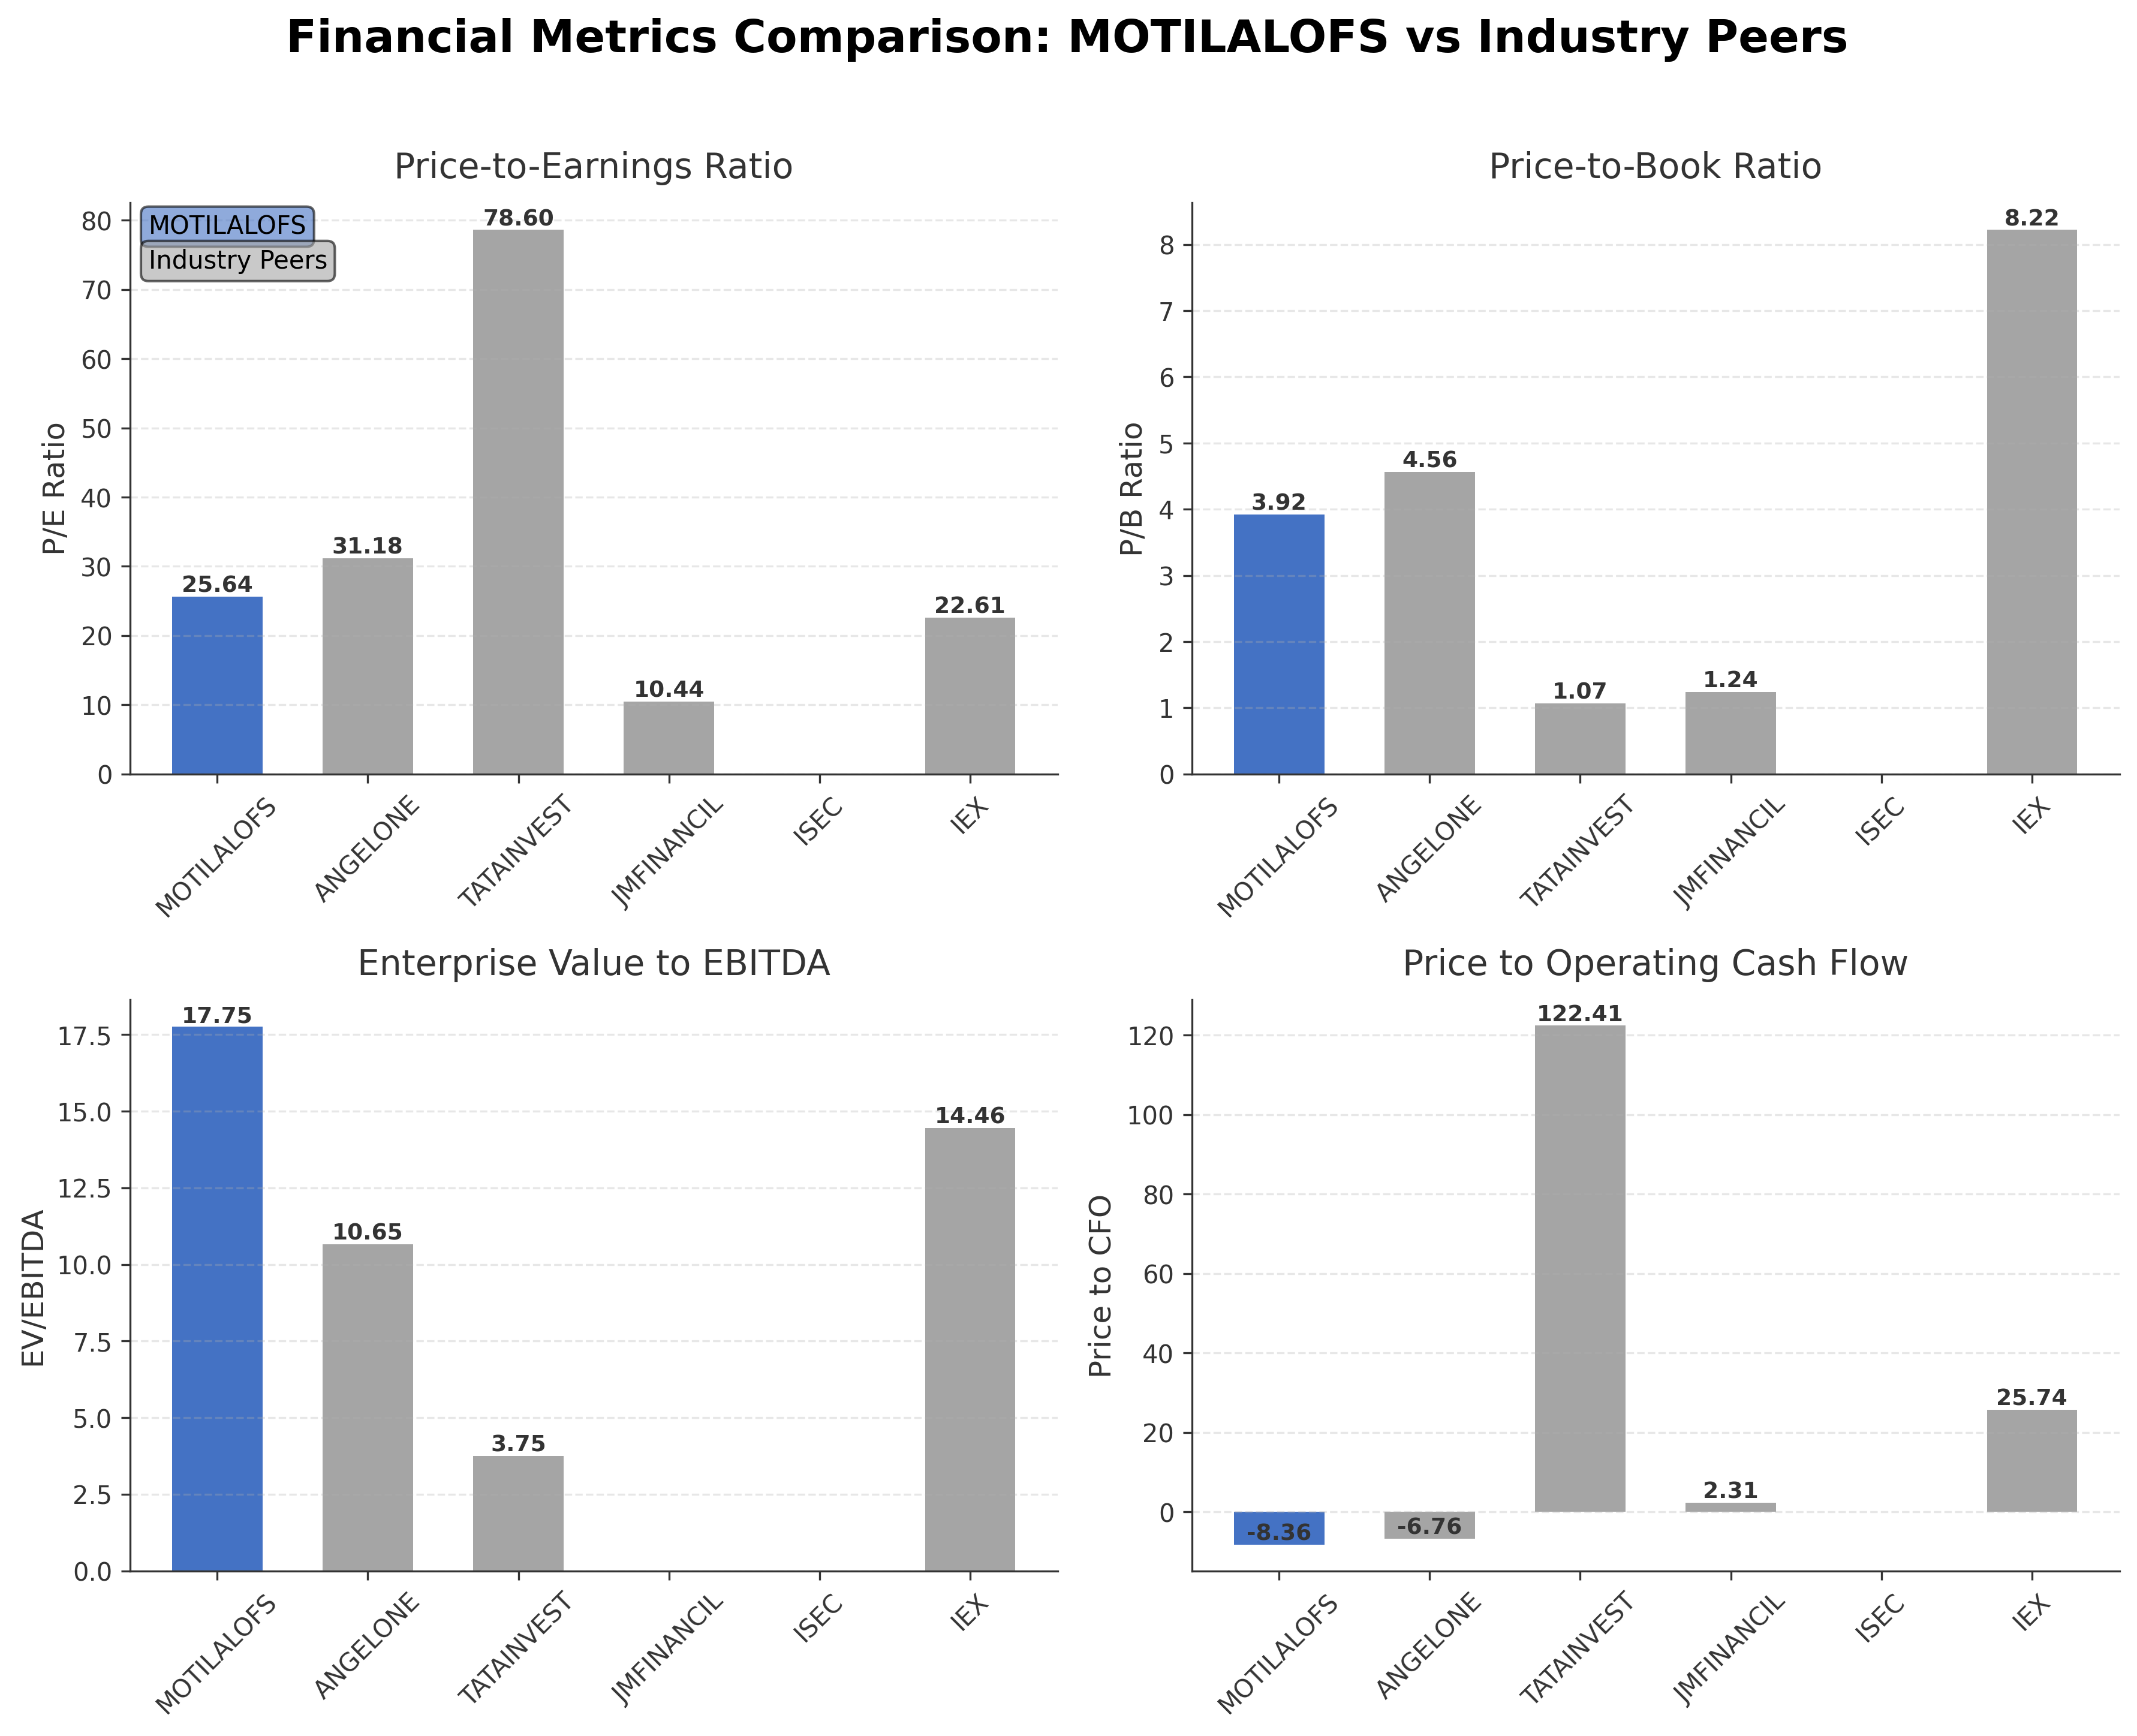
Comparison Analysis: Motilal Oswal Financial Services Ltd. holds the largest market capitalization among its peers at ₹507.70 billion. Its P/E ratio of 25.64 is moderate compared to Angel One’s higher 31.18 and Tata Investment’s elevated 78.60, indicating a relatively balanced valuation. The company’s P/B ratio of 3.92 is higher than Tata Investment and JM Financial but lower than Indian Energy Exchange’s 8.22, suggesting moderate premium over book value. Its EV/EBITDA of 17.75 is above Angel One and Indian Energy Exchange, reflecting a higher enterprise valuation relative to earnings. The negative price to CFO ratio (-8.36) contrasts with positive ratios for peers like Tata Investment and JM Financial, highlighting cash flow challenges. Return on equity at 15.55% aligns closely with Angel One but is lower than Indian Energy Exchange’s 39%, indicating solid but not leading profitability within the sector.
Financial Metrics Comparison with Peers
Financial Statements
Comprehensive financial data including income, balance sheet, and cash flow metrics
Income Statement
| fiscal_date | 2025-03-31 | 2024-03-31 | 2023-03-31 | 2022-03-31 | 2021-03-31 |
|---|---|---|---|---|---|
| Sales | 64.42B | 51.37B | 38.19B | 36.68B | 27.02B |
| Cost Of Goods | 29.15B | 23.65B | 17.86B | 17.14B | 12.45B |
| Gross Profit | 35.26B | 27.72B | 20.33B | 19.53B | 14.57B |
| Operating Expense Selling General And Administrative | 4.14B | 2.82B | 2.22B | 1.85B | 1.30B |
| Operating Expense Other Operating Expenses | 2.43B | 2.12B | 1.68B | 1.92B | 1.79B |
| Operating Income | 25.50B | 20.53B | 14.59B | 14.40B | 10.45B |
| Non Operating Interest Income | 6.07B | 4.66B | 2.20B | 1.34B | 641.10M |
| Non Operating Interest Expense | 12.53B | 9.76B | 5.62B | 4.52B | 4.10B |
| Pretax Income | 32.26B | 30.32B | 12.42B | 16.16B | 14.58B |
| Income Tax | 7.18B | 5.86B | 3.09B | 3.05B | 2.55B |
| Net Income | 25.08B | 24.46B | 9.35B | 13.12B | 12.65B |
| Eps Basic | 41.83 | 41.16 | 15.72 | 22.29 | 22.29 |
| Eps Diluted | 41.00 | 40.73 | 15.66 | 22.09 | 22.09 |
| Basic Shares Outstanding | 598.10M | 593.09M | 592.54M | 587.75M | 588.53M |
| Diluted Shares Outstanding | 598.10M | 593.09M | 592.54M | 587.75M | 588.53M |
| Ebit | 44.79B | 40.08B | 18.04B | 20.68B | 18.68B |
| Ebitda | 32.88B | 26.26B | 17.24B | 16.20B | 11.40B |
| Net Income Continuous Operations | 32.26B | 30.32B | 12.42B | 16.16B | 14.58B |
| Minority Interests | -65.40M | -45.50M | -30.90M | -26.70M | -42.80M |
| Preferred Stock Dividends | 0.00 | 0.00 | 0.00 | 0.00 | 0.00 |
Source: Financial statements and regulatory filings
Balance Sheet
| fiscal_date | 2025-03-31 | 2024-03-31 | 2023-03-31 | 2022-03-31 | 2021-03-31 |
|---|---|---|---|---|---|
| Cash And Cash Equivalents | 65.93B | 52.86B | 25.76B | 21.38B | 12.92B |
| Accounts Receivable | 20.84B | 16.03B | 7.45B | 7.25B | 6.57B |
| Total Assets | 339.87B | 318.29B | 230.10B | 169.23B | 141.17B |
| Total Liabilities | 228.56B | 230.60B | 167.27B | 112.23B | 96.23B |
| Long Term Debt | 45.29B | 32.48B | 32.22B | 24.02B | 19.73B |
| Shareholders Equity | 111.31B | 87.69B | 62.83B | 57.01B | 44.94B |
Source: Financial statements and regulatory filings
Cash Flow Statement
| fiscal_date | 2025-03-31 | 2024-03-31 | 2023-03-31 | 2022-03-31 | 2021-03-31 |
|---|---|---|---|---|---|
| Operating Activities Net Income | 32.26B | 30.32B | 12.42B | 16.16B | 14.58B |
| Operating Activities Stock Based Compensation | 587.60M | 249.30M | 290.40M | 240.40M | 198.60M |
| Operating Activities Other Non Cash Items | 112.80M | -12.56B | 1.61B | -4.93B | -8.56B |
| Operating Activities Accounts Receivable | -8.97B | -37.72B | -23.82B | -5.70B | -7.03B |
| Operating Activities Other Assets Liabilities | -20.75B | 764.60M | -13.79B | -1.35B | -13.97B |
| Operating Activities Operating Cash Flow | 3.24B | -18.95B | -23.29B | 4.41B | -14.78B |
| Investing Activities Capital Expenditures | -2.81B | -1.51B | -1.54B | -545.40M | -607.80M |
| Investing Activities Net Intangibles | -32.20M | 54.20M | 0.00 | N/A | N/A |
| Investing Activities Purchase Of Investments | -18.78B | -5.41B | -4.83B | -11.13B | -5.88B |
| Investing Activities Sale Of Investments | 10.74B | 4.29B | 3.53B | 6.16B | 3.73B |
| Investing Activities Investing Cash Flow | -10.85B | -2.62B | -2.83B | -5.51B | -2.76B |
| Financing Activities Long Term Debt Issuance | 4.32B | 29.14B | 22.27B | 3.78B | 19.43B |
| Financing Activities Long Term Debt Payments | -7.60B | -4.14B | -7.86B | -7.16B | -14.14B |
| Financing Activities Short Term Debt Issuance | 13.15B | 9.70B | 26.84B | 7.97B | 5.37B |
| Financing Activities Common Stock Issuance | 717.10M | 772.80M | 103.40M | 339.80M | 151.40M |
| Financing Activities Common Dividends | -3.00B | -2.52B | -1.48B | -867.30M | -289.40M |
| Financing Activities Other Financing Charges | 291.00M | 447.30M | 3.30M | -1.20B | -385.60M |
| Financing Activities Financing Cash Flow | 7.87B | 33.39B | 37.88B | 2.86B | 8.65B |
| End Cash Position | 66.00B | 52.86B | 25.76B | 21.38B | 12.92B |
| Free Cash Flow | 9.30B | -5.00B | -32.12B | 9.56B | -2.03B |
| Financing Activities Common Stock Repurchase | N/A | 0.00 | -1.98B | 0.00 | -1.49B |
Source: Financial statements and regulatory filings
Technical Analysis
Key Insights
- Motilal Oswal Financial Services Ltd. is currently trading in a mixed trend, with price action showing consolidation below the 200-day moving average at ₹853.05 but above the 50-day moving average at ₹753.09, indicating short-term support.
- Key support levels are identified near ₹750 and ₹615, corresponding to the 50-day moving average and the 52-week low, while resistance is observed near ₹850 and ₹1097, the latter being the 52-week high.
- The stock price is positioned above the 10-day and 50-day moving averages but remains slightly below the 200-day moving average, suggesting intermediate-term resistance.
- Momentum indicators show the Relative Strength Index (RSI) in a neutral zone around 50-60, MACD lines are close to a crossover but without clear momentum, and Stochastic oscillators indicate neither overbought nor oversold conditions.
- Analysis across daily, weekly, and monthly timeframes reveals consolidation with no strong directional breakout, reflecting cautious investor sentiment.
- Potential market scenarios include a breakout above the 200-day moving average leading to renewed upward momentum or a retest of support levels near ₹750 if selling pressure intensifies.
Trending News
1. Headline: Gold, Silver Rate Today Live Updates: Gold prices set for second straight week of decline - The Times of India
Summary: Markets now remain focused on official ... release. Focus today will be on US Michigan consumer sentiment, says Manav Modi Commodities Analyst Motilal Oswal Financial Services Ltd....
Sentiment: negative
Summary: Sensex, Nifty 50 | Stock Market LIVE: While investors cheered the sharp crash in crude oil prices amid hopes that the US may be nearing a deal with Iran to end the Middle East conflict, the possibility of higher inflation and a possible rate hike by the US Federal Reserve tempered optimism.
Sentiment: positive
Summary: Motilal Oswal remains cautiously optimistic on FY27, supported by a strong order book, committed customer offtake plans, and the planned launch of over 5+ new molecules in the CSM business, which should accelerate PI Industries' growth in H2 FY27.
Sentiment: positive
Summary: Stock Market Highlights Today: BSE Sensex and NSE Nifty50 saw a positive start to the day on Thursday but ended in red in a volatile trading session.
Sentiment: negative
Summary: Motilal Oswal Share Price: Find the latest news on Motilal Oswal Stock Price. Get all the information on Motilal Oswal with historic price charts for NSE / BSE. Experts & Broker view also get the Motilal Oswal Ltd. buy/sell tips detailed news, announcements, Forecasts, Analysts, Valuation, ...
Sentiment: neutral
Recent Updates
News Summary
As of 2026-05-22. Recent updates on Motilal Oswal Financial Services Ltd. highlight the company's sustained market capitalization near ₹509 billion and a stable share price around ₹845.85. The firm continues to maintain a diversified financial services business model, encompassing brokerage, wealth management, asset management, and investment banking, generating revenues primarily through fees and commissions. The company's investor relations communications emphasize its strong market positioning and growth trajectory, supported by a 127.06% quarterly revenue jump over the last three months. Financial reports and presentations confirm consistent operational performance and strategic focus on expanding client services and market reach.
News Sentiment
The overall sentiment from recent updates is moderately positive, reflecting confidence in the company's growth prospects and market positioning. Positive sentiment is driven by strong revenue growth and strategic diversification, while neutral tones arise from routine financial disclosures and investor communications. No significant negative developments were reported, supporting a stable outlook. The balance of news suggests steady operational momentum with cautious optimism regarding future performance.
Source List
- https://www.alphaspread.com/security/nse/motilalofs/investor-relations
- https://www.motilaloswalgroup.com/Investor-Relations/Financial-Report/Quarterly
- https://www.motilaloswalgroup.com/Investor-Relations/Financial-Report/Annual
Analytical Overview
Analysis Summary
Motilal Oswal Financial Services Ltd. trades at a trailing P/E of 25.64 and a forward P/E of 14.43, which are in line with or slightly below the industry average P/E of 25.64, indicating reasonable valuation relative to peers. The company’s revenue growth rate of 1.52% quarterly and a significant 127.06% jump in recent quarterly revenue demonstrate a positive growth trajectory, although operating margins remain negative. Financial health shows a mixed picture with a high debt-to-equity ratio of 164.4% contrasted by a strong current ratio of 5.63 and a substantial cash balance of INR 135.8 billion, suggesting liquidity strength despite leverage. Sector-specific challenges include regulatory scrutiny and competitive pressures in India’s financial services market, while opportunities arise from expanding wealth management and asset management segments. The Indian market environment, characterized by evolving regulatory frameworks and growing investor participation, provides both risks and growth potential for the company.
Overall Business and Market Assessment
Supporting Factors: diversified revenue streams across brokerage, asset management, and investment banking, a strong cash position of INR 135.8 billion, and a reasonable valuation relative to industry peers
Risk Factors: the negative operating margin, high leverage with a debt-to-equity ratio of 164.4%, and potential regulatory and competitive challenges
SWOT Analysis
Strengths
- Strong brand presence and diversified financial services portfolio.
- Robust cash position with INR 135.8 billion in total cash.
- High return on equity at 15.55% indicating efficient equity utilization.
- Extensive distribution network across India supporting broad client reach.
Weaknesses
- Negative operating margin at -9.2% indicating operational inefficiencies.
- High debt-to-equity ratio of 164.4% raising financial risk concerns.
- Negative price to cash flow ratio reflecting cash flow challenges.
- Relatively low quarterly revenue growth rate of 1.52%.
Opportunities
- Expansion in wealth and asset management segments in India’s growing market.
- Increasing retail investor participation boosting brokerage and advisory services.
- Potential for strategic partnerships and acquisitions to enhance market share.
- Favorable regulatory developments supporting capital market activities.
Threats
- Regulatory changes and compliance costs impacting operational flexibility.
- Intense competition from established and emerging financial services firms.
- Macroeconomic volatility affecting investor sentiment and market activity.
- Rising interest rates potentially increasing borrowing costs.
Company Description
Motilal Oswal Financial Services Ltd. is a diversified financial services company based in India, renowned for providing a broad spectrum of financial solutions and investment products. Established in 1987, the firm's primary function is to offer investment banking, asset management, wealth management, and brokerage services. It caters to individual investors, corporate clients, and financial institutions, leveraging a robust network of branches and franchisees across India. One of the notable features of Motilal Oswal is its research-driven approach, offering market-leading insights and advisory services to clients. The company's significant role in the financial market is evidenced by its consistent contribution to capital market activities and investment advisory, making it a pivotal player in facilitating informed investment decisions. Through strategic innovations and comprehensive offerings, Motilal Oswal Financial Services Ltd. continues to be instrumental in shaping the financial fortunes of its diverse clientele.