


Micron Technology, Inc (MU)
Stock Analysis Report
Stock Journey
Key Positives and Key Risks
Pros
- Return on equity of 66.64% demonstrates exceptional profitability and efficient capital use.
- Strong cash position with $26.02 billion in total cash supports financial flexibility.
- Forward P/E ratio of 5.99 indicates market expectations of significant earnings growth.
Cons
- High price-to-book ratio of 10.32 suggests the stock trades at a premium relative to book value.
- Recent CEO stock sale of $37.3 million may raise concerns about insider confidence.
- Stock price volatility with a beta of 2.14 increases investment risk.
Disclosure: This information is for general awareness and does not constitute investment advice
Report Summary
Micron Technology, Inc. is a leading global semiconductor company specializing in advanced memory and storage solutions. Listed on NASDAQ under the symbol MU, it operates within the Technology sector, specifically the Semiconductors industry. The company serves diverse markets including original equipment manufacturers, cloud providers, and consumer electronics, offering products such as DRAM, NAND flash, and solid-state drives. Its business segments encompass compute and networking, mobile, embedded, and storage applications, positioning it as a critical player in supporting data-intensive workloads like AI and high-performance computing.
Financially, Micron reported trailing twelve months revenue of approximately $90.27 billion with a gross margin of 84.56%, operating margin of 80.37%, and a net profit margin of 55.91%, indicating robust profitability and operational efficiency. The company’s return on equity (ROE) stands at 66.64%, return on assets (ROA) at 34.87%, and return on invested capital (ROIC) is strong, reflecting effective capital utilization. Quarterly revenue growth was 3.46%, and net income to common shareholders reached about $50.47 billion, underscoring solid earnings momentum.
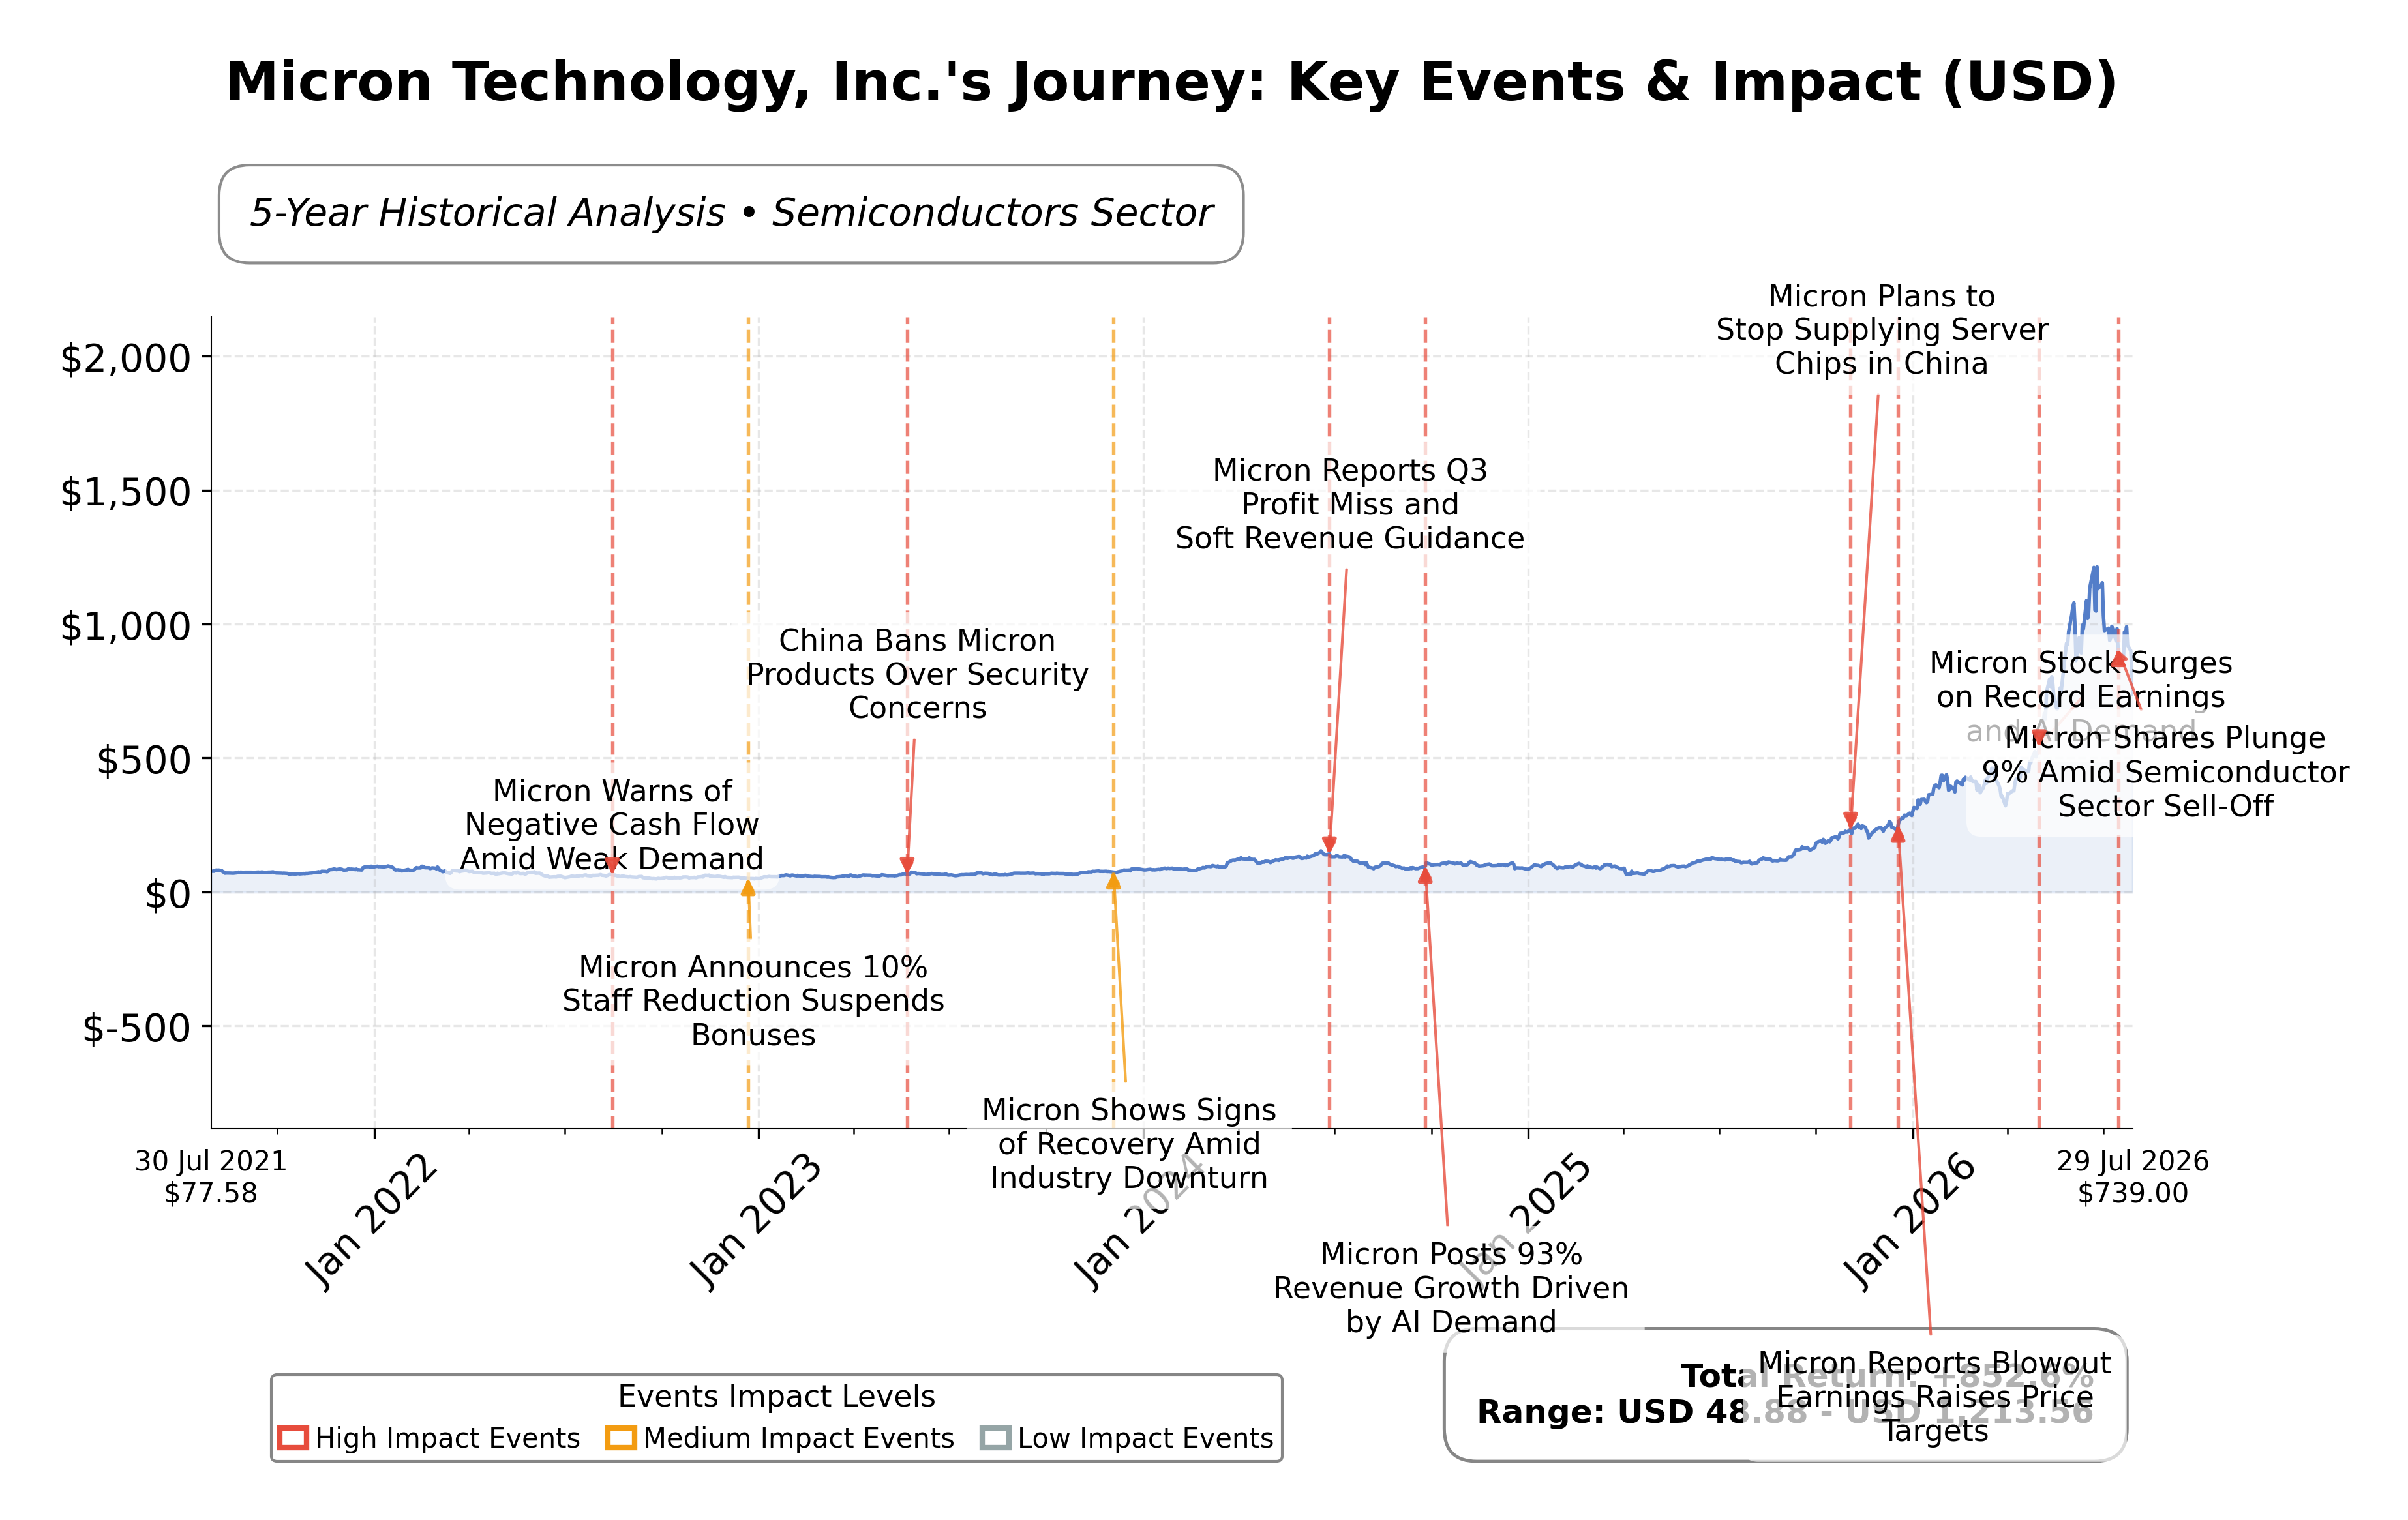
Valuation metrics show a trailing price-to-earnings (P/E) ratio of 22.37 and a forward P/E of 5.99, suggesting the market anticipates significant earnings growth. The price-to-book (P/B) ratio is 10.32, and the enterprise value to EBITDA (EV/EBITDA) ratio is 14.96. Micron’s market capitalization is approximately $1.04 trillion. The stock currently trades at $737.88, within a 52-week range of $103.38 to $1255, indicating substantial price appreciation over the year. The current price is below the 50-day moving average of $955.39 but above the 200-day average of $502.06.
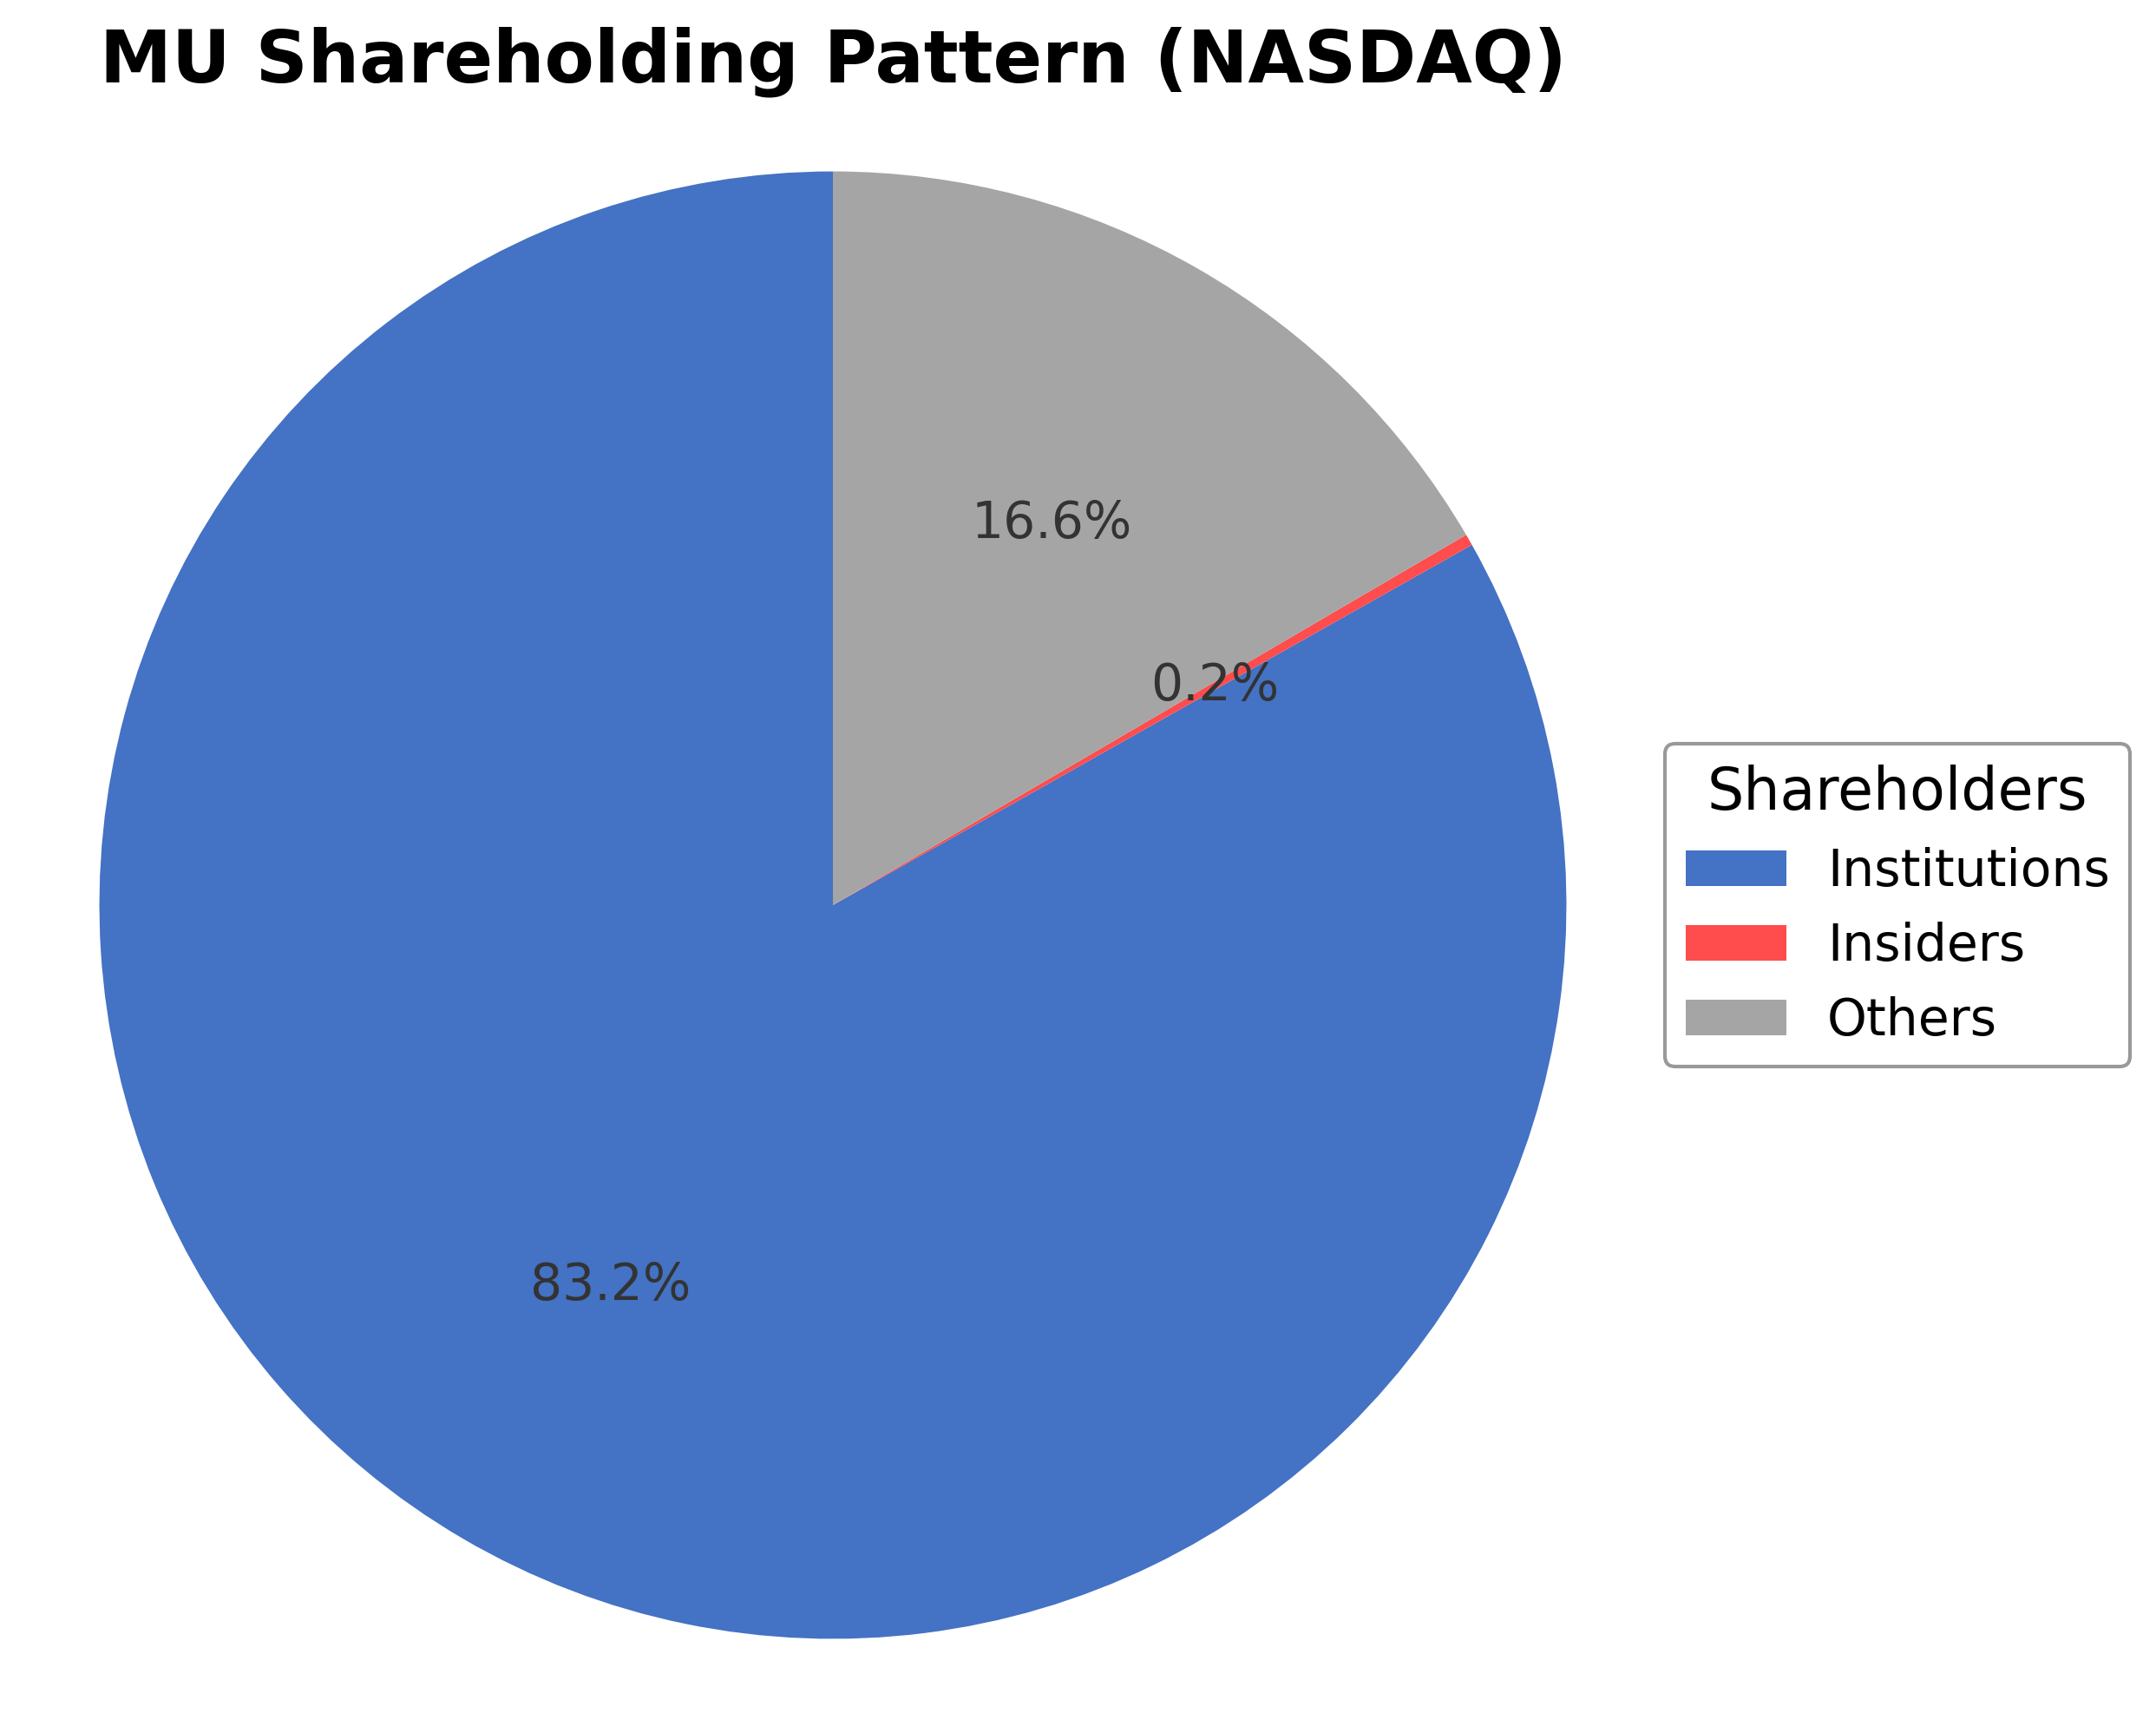
Key strengths include a strong cash position with over $26 billion in cash, low debt relative to equity (debt-to-equity ratio of 6.33%), and market leadership in memory technologies. Institutional ownership is high at 83.17%, reflecting confidence from major investors. Risks involve semiconductor industry cyclicality, competitive pressures from peers such as TSM and NVIDIA, and potential regulatory challenges. Recent strategic actions include consistent earnings growth and maintaining a solid balance sheet, though CEO stock sales have attracted some market attention.
Technically, the stock shows mixed signals with price below the short-term moving average but strong momentum indicators in longer timeframes. Recent news reflects volatility with both positive earnings reports and some stock price pullbacks. Overall, the data suggests a cautious stance with potential for accumulation in favorable market conditions, balanced by awareness of near-term price fluctuations.
Company and Industry Overview
Company Basics
Price Performance
Company Size
Shareholding Pattern
Sector and Industry Analysis
The semiconductor sector is a critical component of the global technology ecosystem, with a market size exceeding hundreds of billions of dollars and strong growth driven by demand for memory, processors, and integrated circuits. Key players include Micron Technology, Samsung Electronics, and SK Hynix, which dominate the memory segment, particularly DRAM and NAND flash markets. The sector benefits from rapid technological advancements and increasing adoption across computing, mobile, automotive, and data center applications.
Industry trends highlight the cyclical nature of memory markets, with pricing and margins highly sensitive to supply-demand imbalances. Recent shifts include the rising importance of high-bandwidth memory (HBM) for AI workloads, where Micron is expanding production to capitalize on premium pricing. Competitive dynamics are shaped by high capital intensity, scale advantages, and innovation barriers, limiting new entrants and fostering competition among a few large firms with strong R&D capabilities and strategic partnerships with OEMs and cloud providers.
The regulatory environment for semiconductors involves export controls, intellectual property protections, and environmental standards, which vary across key markets like the U.S., China, and South Korea. Recent geopolitical tensions have intensified scrutiny on supply chain security and technology transfer, impacting global trade flows and investment decisions. Regulatory frameworks continue to evolve, emphasizing domestic manufacturing incentives and sustainability, which could influence industry structure and capital allocation in the coming years.
Note: Analysis synthesized from industry research, market reports, and regulatory filings. Information is subject to change based on market conditions.
Financial Ratios Dashboard
Illustrative Scenario Analysis
DCF Assumptions:
Method: Two-Stage EPS-Priority Model
Financials
Peer Analysis
| Company Name | Market Cap | P/E Ratio | P/B Ratio | EV/EBITDA | Price to CFO |
|---|---|---|---|---|---|
| Micron Technology, Inc. | $1.04T | 22.37 | 10.32 | 14.96 | 20.22 |
| Taiwan Semiconductor Manufacturing Co. Ltd. ADR | $2.09T | 36.51 | 84.03 | 4.49 | 25.69 |
| NVIDIA Corporation | $5.01T | 31.63 | 25.63 | 30.00 | 39.87 |
| Advanced Micro Devices, Inc. | $851.09B | 178.75 | 13.20 | 113.41 | 87.52 |
| Analog Devices, Inc. | $181.13B | 56.51 | 5.37 | 30.31 | 35.47 |
| Texas Instruments Inc | $254.44B | 42.55 | 14.18 | 27.55 | 29.36 |
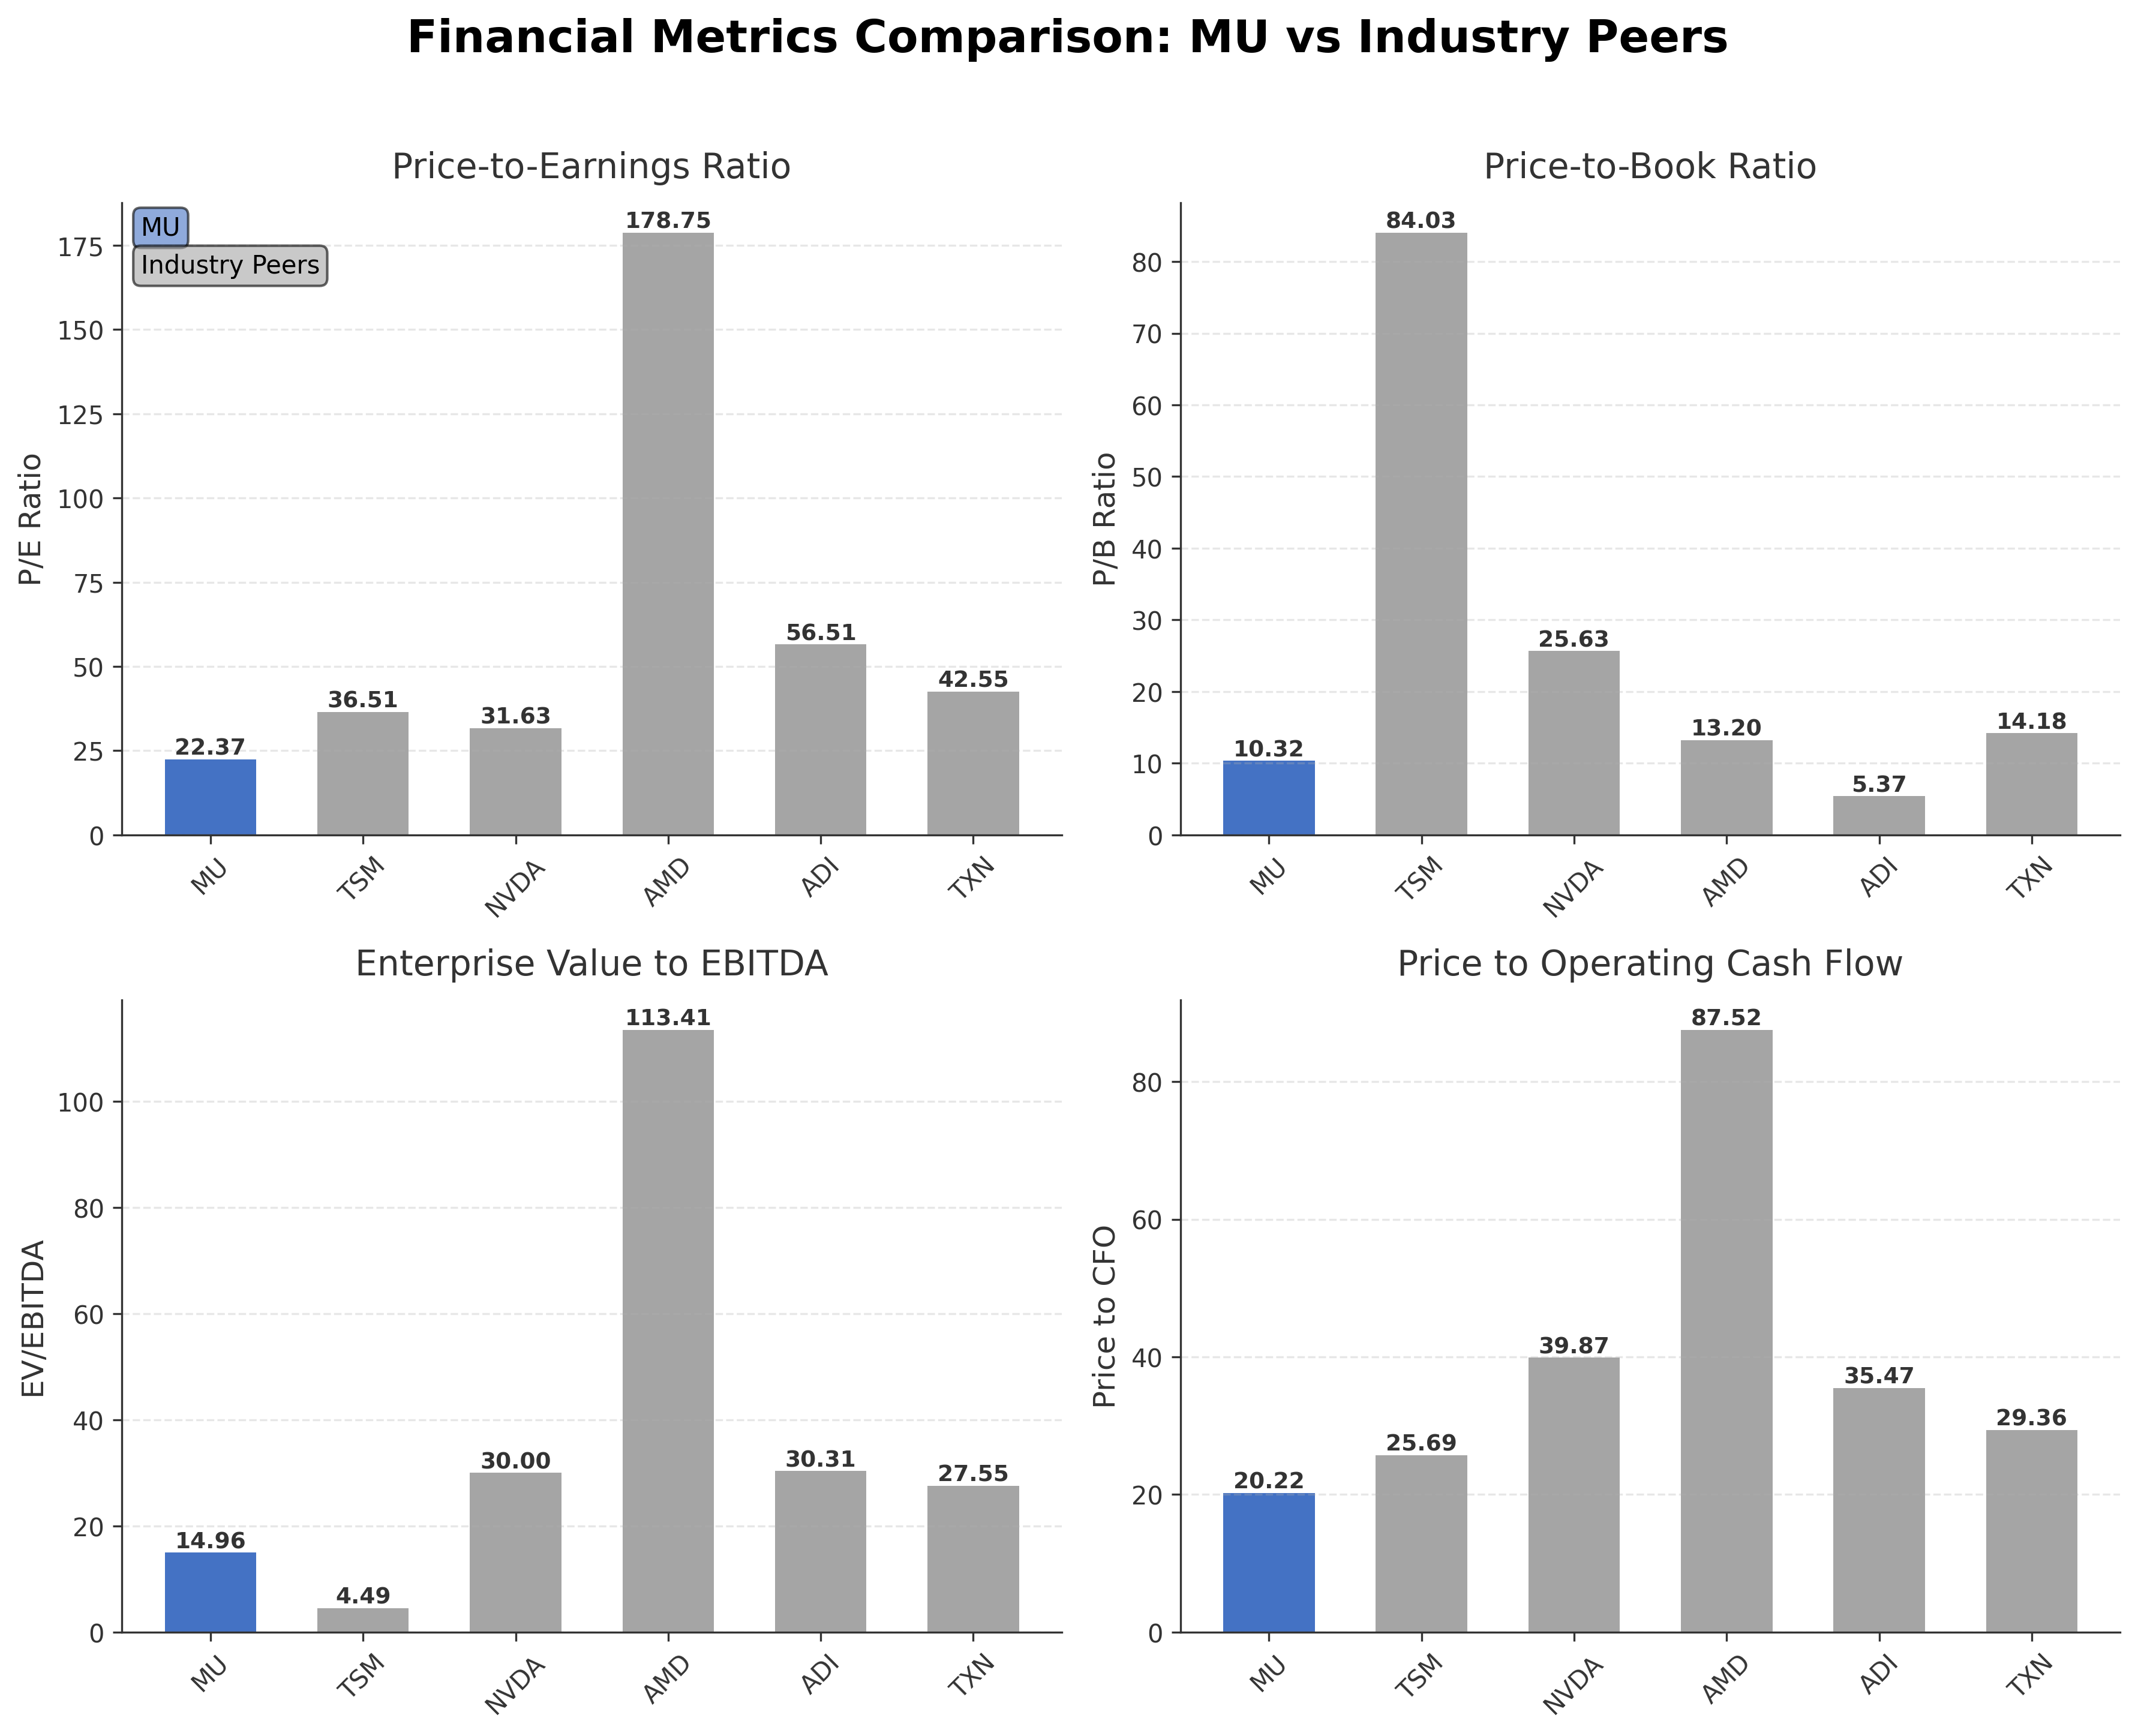
Comparison Analysis: Micron Technology demonstrates a strong return on equity (66.64%) that significantly exceeds its semiconductor peers, reflecting superior profitability and capital efficiency. Its trailing P/E ratio of 22.37 is lower than many peers such as AMD (178.75) and NVIDIA (31.63), suggesting relatively attractive valuation. The P/B ratio of 10.32 is moderate compared to Taiwan Semiconductor’s high 84.03 but higher than Analog Devices at 5.37, indicating a premium on book value. Micron’s EV/EBITDA of 14.96 is higher than TSM’s 4.49 but substantially lower than AMD’s 113.41, positioning it in a mid-range valuation tier. Price to CFO at 20.22 is competitive, supporting its strong cash flow generation relative to price. Overall, Micron stands out for its robust profitability and balanced valuation among leading semiconductor companies.
Financial Metrics Comparison with Peers
Financial Statements
Comprehensive financial data including income, balance sheet, and cash flow metrics
Income Statement
| fiscal_date | 2025-08-31 | 2024-08-31 | 2023-08-31 | 2022-08-31 | 2021-08-31 |
|---|---|---|---|---|---|
| Sales | 37.38B | 25.11B | 15.54B | 30.76B | 27.70B |
| Cost Of Goods | 22.50B | 19.50B | 16.96B | 16.86B | 17.28B |
| Gross Profit | 14.87B | 5.61B | -1.42B | 13.90B | 10.42B |
| Operating Expense Research And Development | 3.80B | 3.43B | 3.11B | 3.12B | 2.66B |
| Operating Expense Selling General And Administrative | 1.21B | 1.13B | 920.00M | 1.07B | 894.00M |
| Operating Expense Other Operating Expenses | 61.00M | -192.00M | 9.00M | 7.00M | 119.00M |
| Operating Income | 9.81B | 1.25B | -5.46B | 9.71B | 6.75B |
| Non Operating Interest Income | 496.00M | 529.00M | 468.00M | 96.00M | 37.00M |
| Non Operating Interest Expense | 477.00M | 562.00M | 388.00M | 189.00M | 183.00M |
| Other Income Expense | -174.00M | 27.00M | -279.00M | -45.00M | -383.00M |
| Pretax Income | 9.65B | 1.24B | -5.66B | 9.57B | 6.22B |
| Income Tax | 1.12B | 451.00M | 177.00M | 888.00M | 394.00M |
| Net Income | 8.54B | 778.00M | -5.83B | 8.69B | 5.86B |
| Eps Basic | 7.65 | 0.70 | -5.34 | 7.81 | 5.23 |
| Eps Diluted | 7.59 | 0.70 | -5.34 | 7.75 | 5.14 |
| Basic Shares Outstanding | 1.12B | 1.10B | 1.09B | 1.11B | 1.12B |
| Diluted Shares Outstanding | 1.12B | 1.10B | 1.09B | 1.11B | 1.12B |
| Ebit | 10.13B | 1.80B | -5.27B | 9.76B | 6.40B |
| Ebitda | 18.65B | 9.52B | 2.78B | 16.94B | 13.00B |
| Net Income Continuous Operations | 8.54B | 778.00M | -5.83B | 8.69B | 5.86B |
| Minority Interests | N/A | N/A | N/A | 0.00 | 0.00 |
Data provided by Twelve Data
Balance Sheet
| fiscal_date | 2025-08-31 | 2024-08-31 | 2023-08-31 | 2022-08-31 | 2021-08-31 |
|---|---|---|---|---|---|
| Cash And Cash Equivalents | 9.64B | 7.04B | 8.58B | 8.26B | 7.76B |
| Accounts Receivable | 7.16B | 5.42B | 2.05B | 4.76B | 4.92B |
| Total Assets | 82.80B | 69.42B | 64.25B | 66.28B | 58.85B |
| Total Liabilities | 28.63B | 24.29B | 20.13B | 16.38B | 14.92B |
| Long Term Debt | 14.72B | 13.58B | 13.65B | 7.41B | 7.12B |
| Shareholders Equity | 54.16B | 45.13B | 44.12B | 49.91B | 43.93B |
Data provided by Twelve Data
Cash Flow Statement
| fiscal_date | 2025-08-31 | 2024-08-31 | 2023-08-31 | 2022-08-31 | 2021-08-31 |
|---|---|---|---|---|---|
| Operating Activities Net Income | 8.54B | 778.00M | -5.83B | 8.69B | 5.86B |
| Operating Activities Depreciation | 8.35B | 7.78B | 7.76B | 7.12B | 6.21B |
| Operating Activities Stock Based Compensation | 972.00M | 833.00M | 596.00M | 514.00M | 378.00M |
| Operating Activities Other Non Cash Items | 328.00M | 281.00M | 19.00M | 119.00M | 384.00M |
| Operating Activities Accounts Receivable | -1.78B | -3.58B | 2.76B | 190.00M | -1.45B |
| Operating Activities Other Assets Liabilities | 248.00M | 501.00M | -4.37B | -1.78B | 816.00M |
| Operating Activities Operating Cash Flow | 16.66B | 6.59B | 929.00M | 14.85B | 12.21B |
| Investing Activities Purchase Of Investments | -1.89B | -2.00B | -723.00M | -1.77B | -3.16B |
| Investing Activities Sale Of Investments | 1.70B | 1.79B | 1.59B | 1.61B | 2.11B |
| Investing Activities Other Investing Activity | 1.96B | 282.00M | 617.00M | -251.00M | 498.00M |
| Investing Activities Investing Cash Flow | 1.77B | 77.00M | 1.49B | 482.00M | -559.00M |
| Financing Activities Long Term Debt Issuance | 4.43B | 999.00M | 6.72B | 2.00B | 1.19B |
| Financing Activities Long Term Debt Payments | -4.62B | -1.90B | -761.00M | -2.03B | -1.52B |
| Financing Activities Common Stock Repurchase | 0.00 | -300.00M | -425.00M | -2.43B | -1.20B |
| Financing Activities Common Dividends | -522.00M | -513.00M | -504.00M | -461.00M | 0.00 |
| Financing Activities Other Financing Charges | -139.00M | -131.00M | -43.00M | -55.00M | -249.00M |
| Financing Activities Financing Cash Flow | -850.00M | -1.84B | 4.98B | -2.98B | -1.78B |
| End Cash Position | 9.65B | 7.05B | 8.66B | 8.34B | 7.83B |
| Income Tax Paid | 583.00M | 338.00M | 532.00M | 493.00M | 361.00M |
| Interest Paid | 418.00M | 503.00M | 323.00M | 154.00M | 171.00M |
| Free Cash Flow | 1.67B | 121.00M | -6.12B | 3.11B | 2.44B |
| Investing Activities Net Acquisitions | N/A | 0.00 | 0.00 | 888.00M | 0.00 |
| Investing Activities Capital Expenditures | N/A | N/A | N/A | N/A | N/A |
Data provided by Twelve Data
Technical Analysis
Key Insights
- The current trend shows mixed price action with the stock trading below the 50-day moving average of $955.39 but above the 200-day moving average of $502.06, indicating medium-term support but short-term resistance.
- Key support levels are identified near $500 and $700, while resistance is observed around $950 and the 52-week high near $1255.
- The stock is positioned below the 10-day and 50-day moving averages but remains above the 200-day moving average, suggesting potential consolidation within a longer-term uptrend.
- Momentum indicators show the RSI in a neutral range, MACD indicates weakening bullish momentum, and the stochastic oscillator suggests the stock is neither overbought nor oversold.
- Daily and weekly timeframes reveal consolidation after a strong rally, while monthly charts confirm sustained upward momentum over the past year.
- Current technical setup implies potential for sideways movement with volatility, where price may test support levels before attempting to break resistance in upcoming sessions.
Trending News
1. Headline: Micron (MU) stock drop: Inside CEO Sanjay Mehrotra's sale - TheStreet
Summary: As Micron Technology shares pull back, CEO Sanjay Mehrotra's $37.3M stock sale is raising eyebrows. SEC filings reveal a pre-arranged plan behind the trade.
Sentiment: negative
2. Headline: Micron Stock Has Surged 637% in a Year. History Has a Clear Answer Where It Will Be in 2027
Summary: The exponential growth in earnings registered by Micron Technology (NASDAQ: MU) over the past year has translated into solid gains on the stock market, with shares of the memory giant up by a whopping 637% during this period. The incredible demand for memory and the accompanying shortage of ...
Sentiment: positive
3. Headline: Why Micron Stock Dropped Again Today | The Motley Fool
Summary: Jul 29, 2026 •By Harsh ChauhanMicron Stock Has Surged 637% in a Year. History Has a Clear Answer Where It Will Be in 2027. Jul 29, 2026 •By Keithen DruryBetter Artificial Intelligence (AI) Memory Buy: Micron Technology vs. Sandisk After the July 2026 Sell-off · Jul 29, 2026 •By John BromelsElon Musk Thanked Micron Twice on Tesla's Earnings Call -- Here's Why That's Great News...
Sentiment: positive
4. Headline: 10 Information Technology Stocks Whale Activity In Today’s Session - Micron Technology (NASDAQ:MU), Nebiu - Benzinga
Summary: This whale alert can help traders discover the next big trading opportunities. Whales are entities with large sums of money and we track their transactions here at Benzinga on our options activity scanner. Traders often
Sentiment: neutral
5. Headline: Micron Technology Inc Stock (MU) Moved Down by 4.42% on Jul 29: Drivers Behind the Movement
Summary: Micron Technology Inc (MU) moved down by 4.42%. The Technology Equipment sector is down by 2.10%. The company underperformed the industry. Top 3 stocks by turnover in the sector: Micron Technology Inc (MU) down 4.42%; SanDisk Corporation (SNDK) down 6.90%; NVIDIA Corp (NVDA) down 2.36%.
Sentiment: negative
Powered by Brave
Recent Updates
News Summary
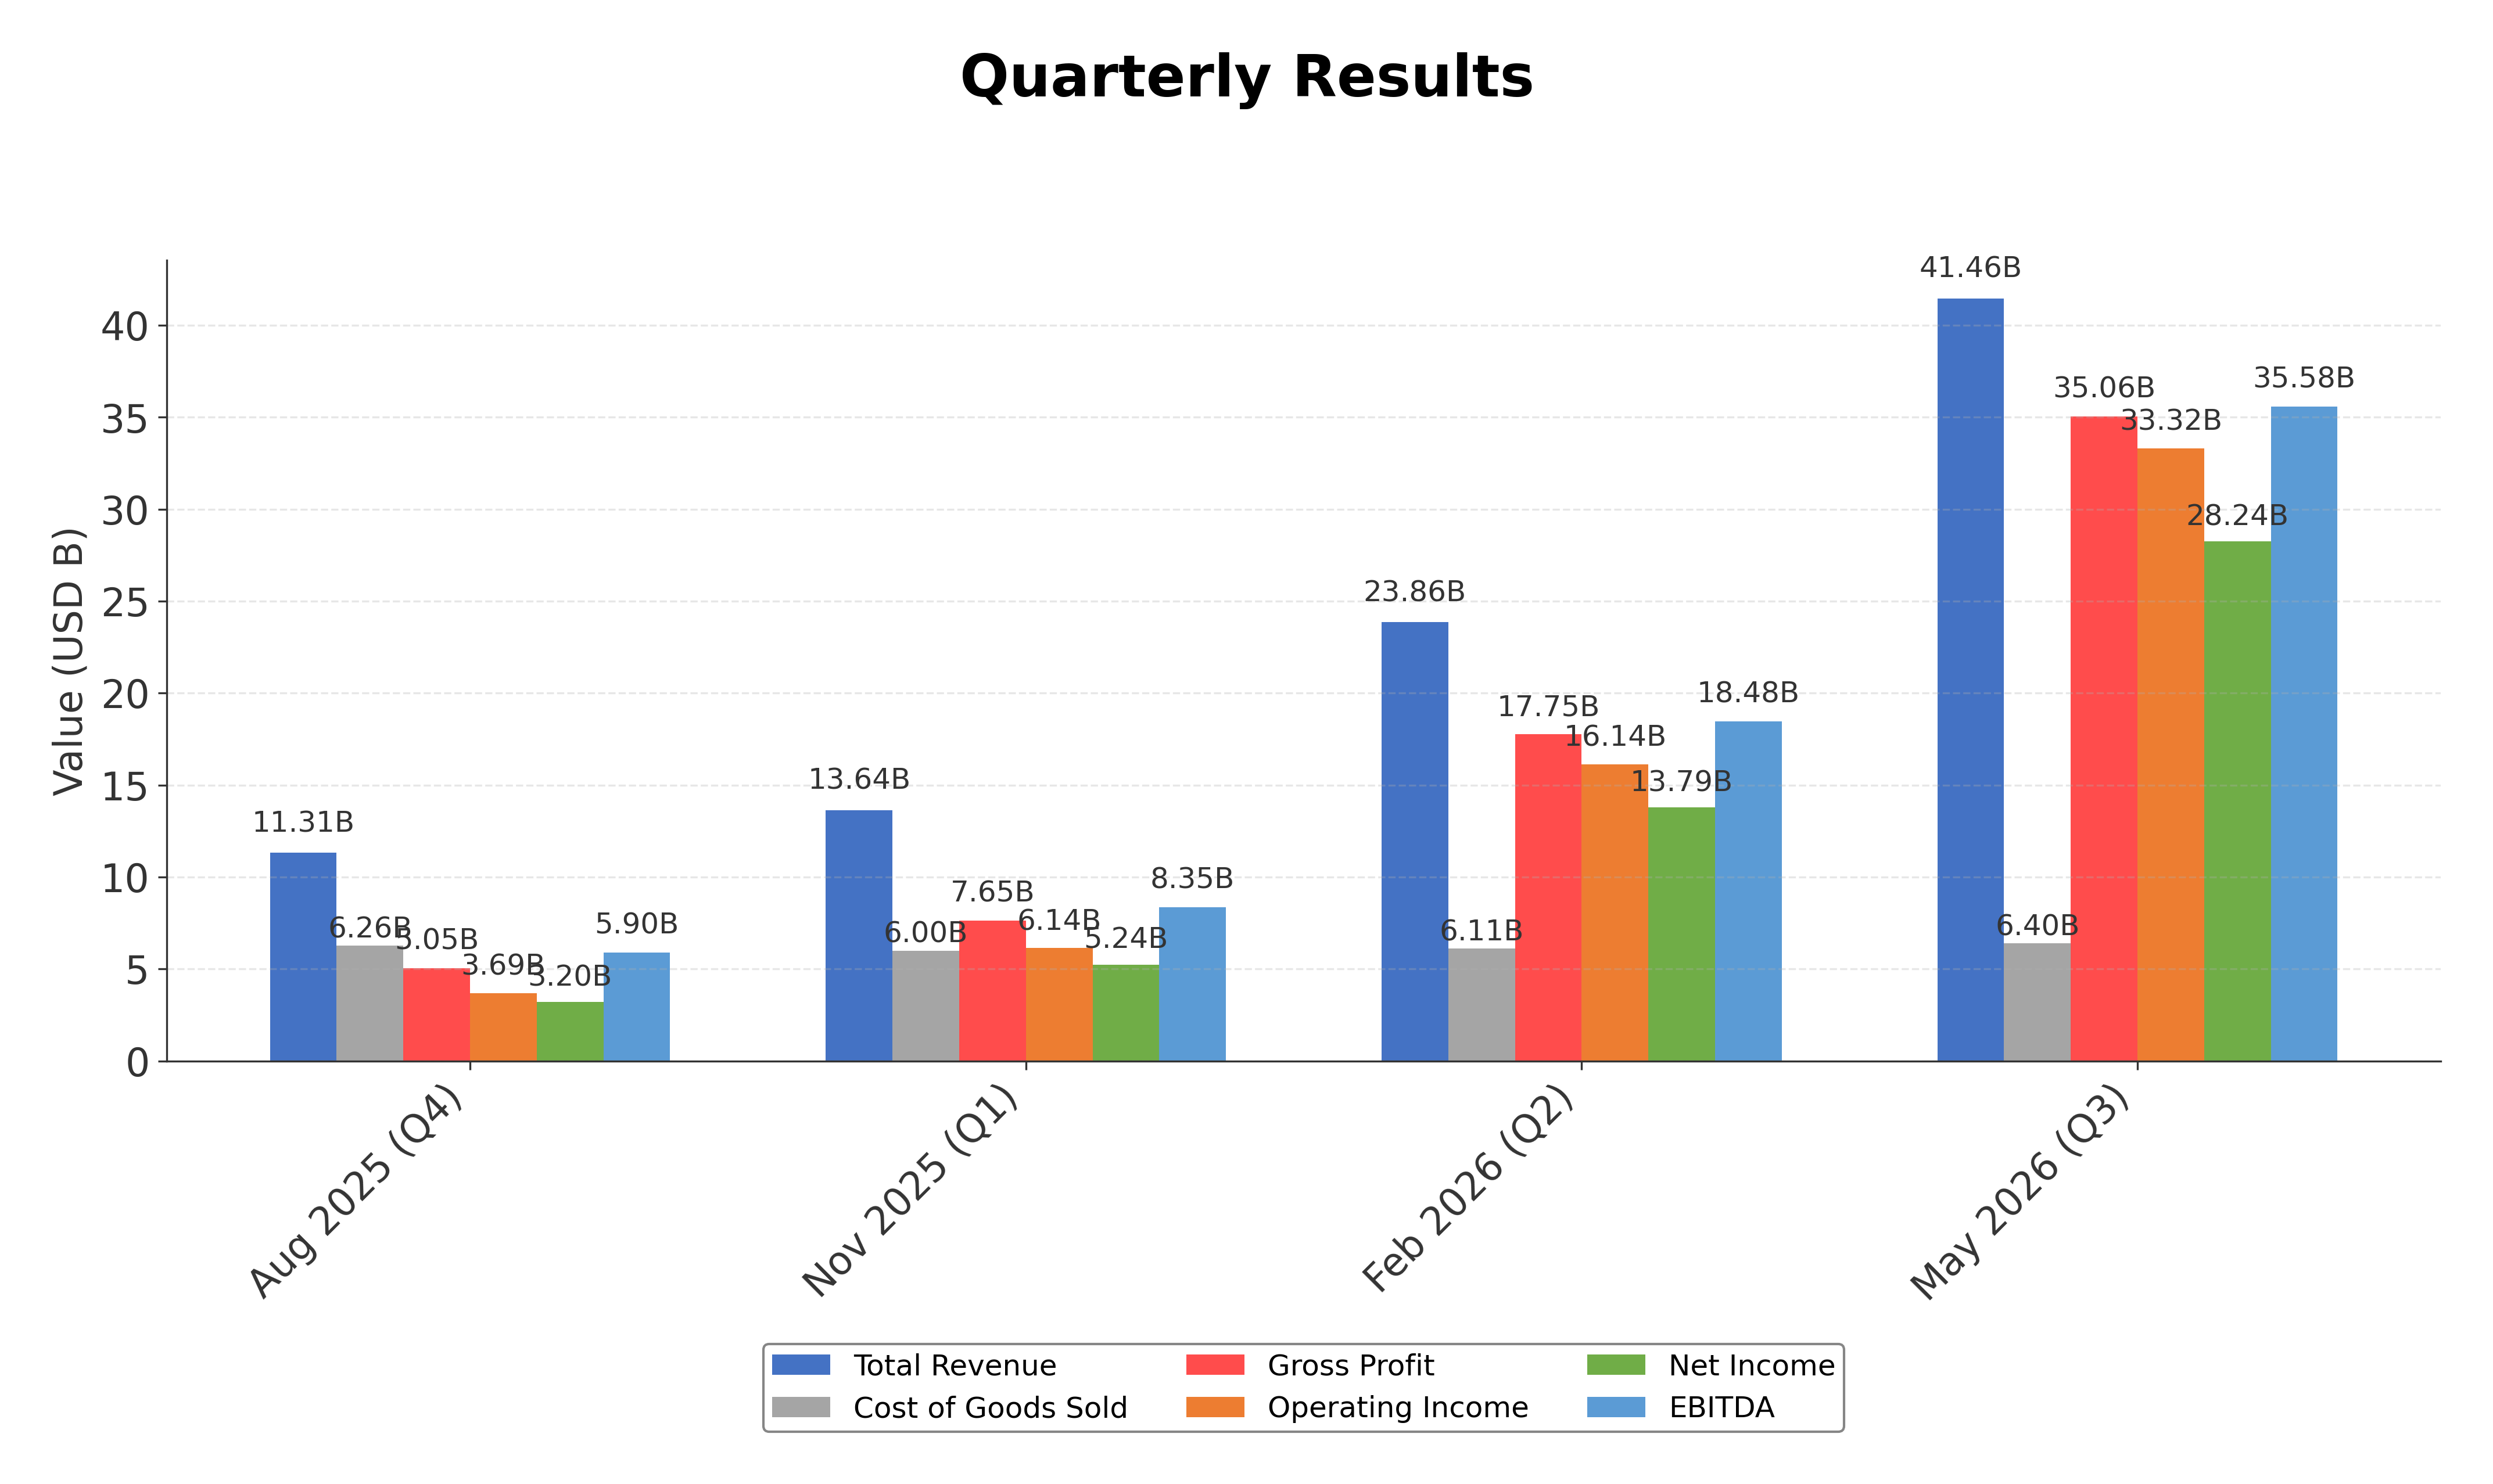
As of 2026-07-30. Micron Technology recently reported record results for the third quarter of fiscal 2026, highlighting strong revenue growth and profitability metrics. The company’s quarterly revenue increased significantly compared to prior periods, with net income reaching $28.24 billion (GAAP) and diluted EPS of $24.67. These results underscore continued demand for memory and storage solutions amid favorable market conditions. Investor relations communications emphasize transparency and ongoing updates on financial performance, with no major changes to forward-looking statements. The company maintains a robust balance sheet with substantial cash reserves and manageable debt levels, supporting operational flexibility and strategic initiatives.
News Sentiment
The overall sentiment from recent updates is predominantly neutral to positive, driven by strong quarterly earnings and solid financial health. While the company’s disclosures maintain cautious language regarding future outlooks, the record results and steady revenue growth contribute to a constructive tone. No significant negative developments or regulatory challenges were reported in the latest communications, supporting confidence in operational execution. This positive sentiment is somewhat tempered by broader market volatility and recent CEO stock sales noted in external news sources, suggesting a balanced view of near-term risks and opportunities.
Source List
Analytical Overview
Analysis Summary
Micron’s valuation metrics reveal a trailing P/E of 22.37 and a forward P/E of 5.99, both below or near industry averages, indicating the stock is reasonably valued relative to expected earnings growth. The PEG ratio of 0.02 suggests undervaluation considering growth prospects. Revenue growth of 3.46% and strong operating cash flow of over $51 billion demonstrate a positive growth trajectory supported by solid cash generation. The company’s financial health is robust, with a low debt-to-equity ratio of 6.33% and a high current ratio of 3.43, reflecting strong liquidity and low leverage. Sector challenges include semiconductor cyclicality and competitive pressures, while opportunities arise from AI and data center demand. Market positioning is strong, supported by institutional ownership of 83.17% and a diversified product portfolio.
Overall Business and Market Assessment
Supporting Factors: No data
Risk Factors: Micron’s investment appeal is supported by strong profitability metrics, effective capital management, and a favorable growth environment driven by memory demand. Key risks include sector volatility and recent insider stock sales that may influence market sentiment. The appropriate investment timeframe is medium to long term, considering the company’s strategic positioning and earnings momentum. Overall, the analysis reflects a balanced outlook with strengths in fundamentals tempered by typical industry risks.
SWOT Analysis
Strengths
- Market leadership in advanced memory and storage solutions.
- Strong profitability with gross margin above 84% and net margin near 56%.
- Robust balance sheet with high cash reserves and low debt-to-equity ratio.
- High institutional ownership indicating investor confidence.
Weaknesses
- High price-to-book ratio suggesting premium valuation.
- Minimal insider ownership which may limit alignment with shareholders.
- Stock price volatility with significant recent fluctuations.
- Dependence on cyclical semiconductor industry dynamics.
Opportunities
- Growing demand for AI and high-performance computing memory solutions.
- Expansion in automotive and industrial semiconductor applications.
- Potential to leverage supply chain strengths amid global shortages.
- Strategic partnerships and technological innovation in memory products.
Threats
- Intense competition from global semiconductor manufacturers.
- Regulatory and geopolitical risks affecting supply chains.
- Market sensitivity to macroeconomic and technology sector cycles.
- Potential negative impact from insider stock sales on investor sentiment.
Company Description
Micron Technology, Inc. is a global semiconductor company that focuses on designing and manufacturing advanced memory and storage solutions. Headquartered in Boise, Idaho, it serves original equipment manufacturers, cloud providers, and other enterprise and consumer-focused customers worldwide. Micron Technology operates through business units dedicated to compute and networking, mobile, embedded, and storage applications, delivering dynamic random-access memory (DRAM), NAND flash, and other solid-state storage products for use in data centers, smartphones, personal computers, automotive systems, and industrial equipment. Its portfolio underpins workloads such as artificial intelligence, high-performance computing, and real-time data analytics by enabling fast, reliable access to large volumes of data. Micron Technology also supplies memory modules and solid-state drives for client and enterprise environments, along with specialized solutions tailored to automotive safety systems and connected devices. Through its broad product range and global manufacturing footprint, the company plays a central role in the semiconductor supply chain and in supporting the infrastructure of modern digital services and applications.