


Micron Technology, Inc (MU)
Stock Analysis Report
Stock Journey
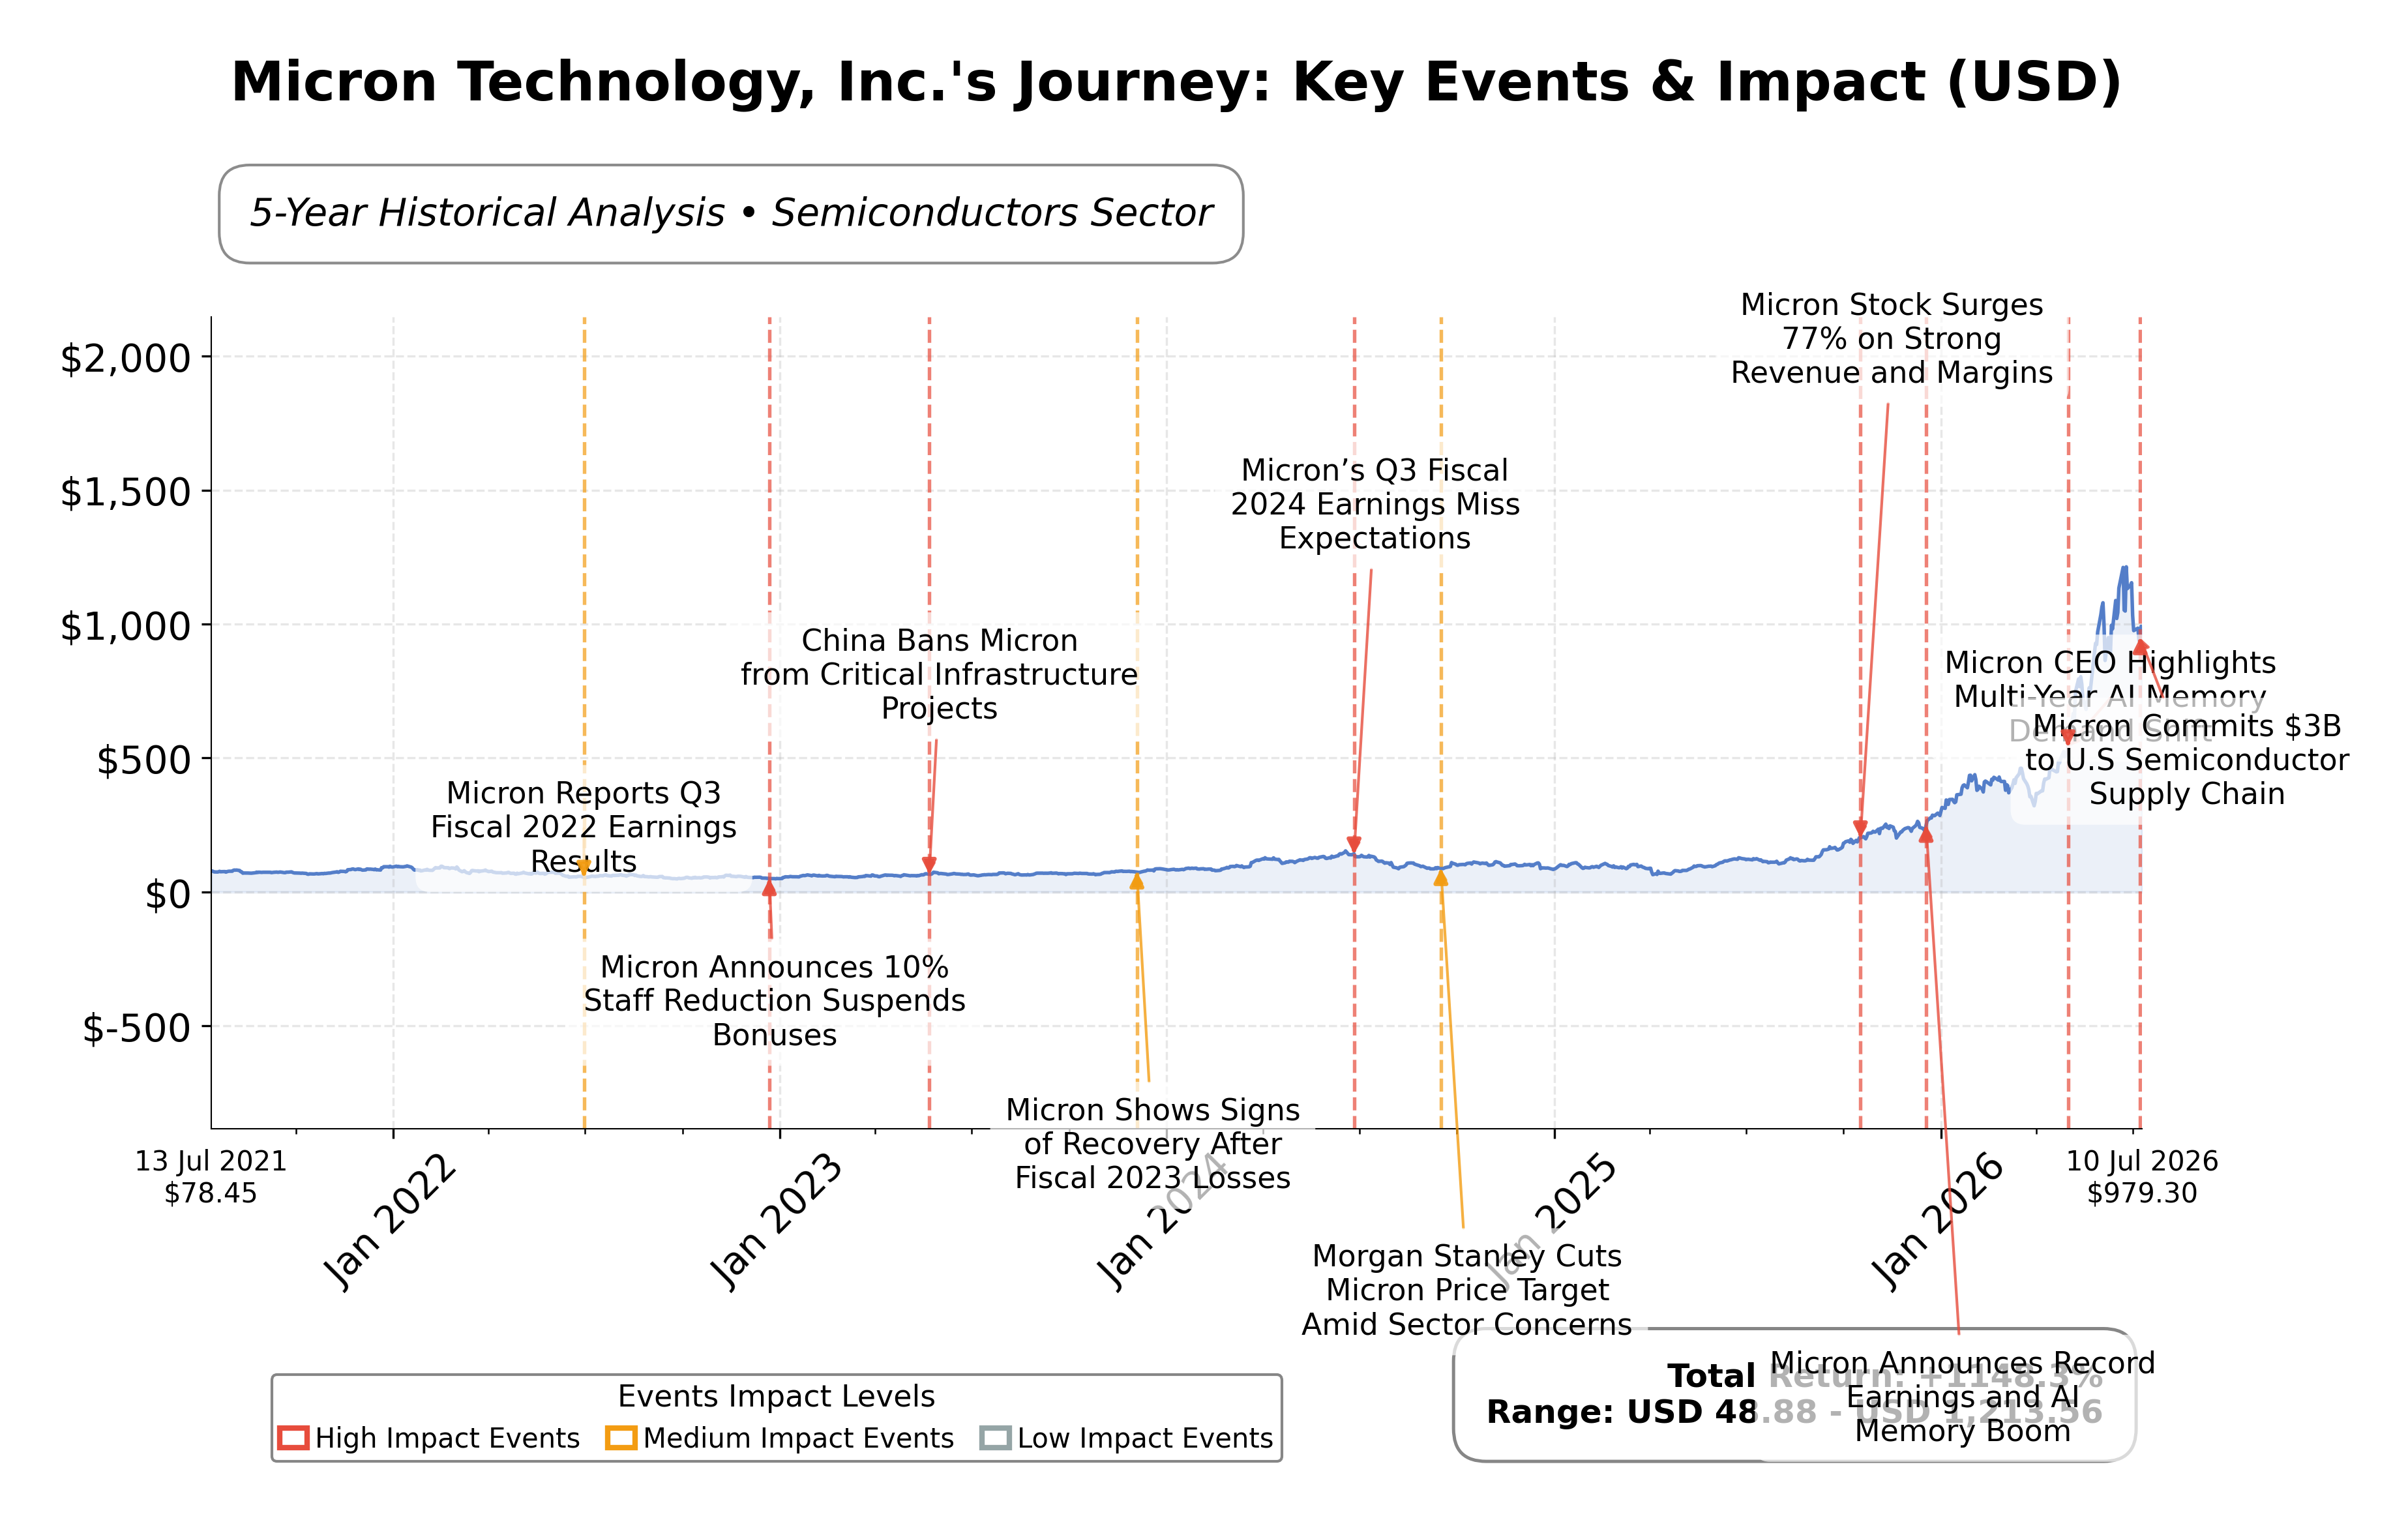
Key Positives and Key Risks
Pros
- High return on equity of 66.64% indicates strong profitability and efficient capital use.
- Robust operating cash flow of $51.43 billion TTM supports financial flexibility and growth investments.
- Forward P/E ratio of 6.54 suggests market expectations of significant earnings growth.
Cons
- Elevated price-to-book ratio of 15.25 reflects a premium valuation that may limit upside.
- Stock exhibits high volatility with a beta of 2.14, increasing investment risk.
- Cyclical semiconductor demand and competitive pressures pose ongoing challenges.
Disclosure: This information is for general awareness and does not constitute investment advice
Report Summary
Micron Technology, Inc. is a leading global semiconductor company specializing in advanced memory and storage solutions. Listed on NASDAQ under the symbol MU, it operates within the technology sector, specifically in the semiconductor industry. The company serves a diverse customer base including original equipment manufacturers, cloud providers, and enterprises worldwide. Its product portfolio encompasses DRAM, NAND flash, and solid-state drives, supporting applications in data centers, mobile devices, automotive systems, and industrial equipment. Micron’s broad manufacturing footprint and product range position it as a key player in the semiconductor supply chain.
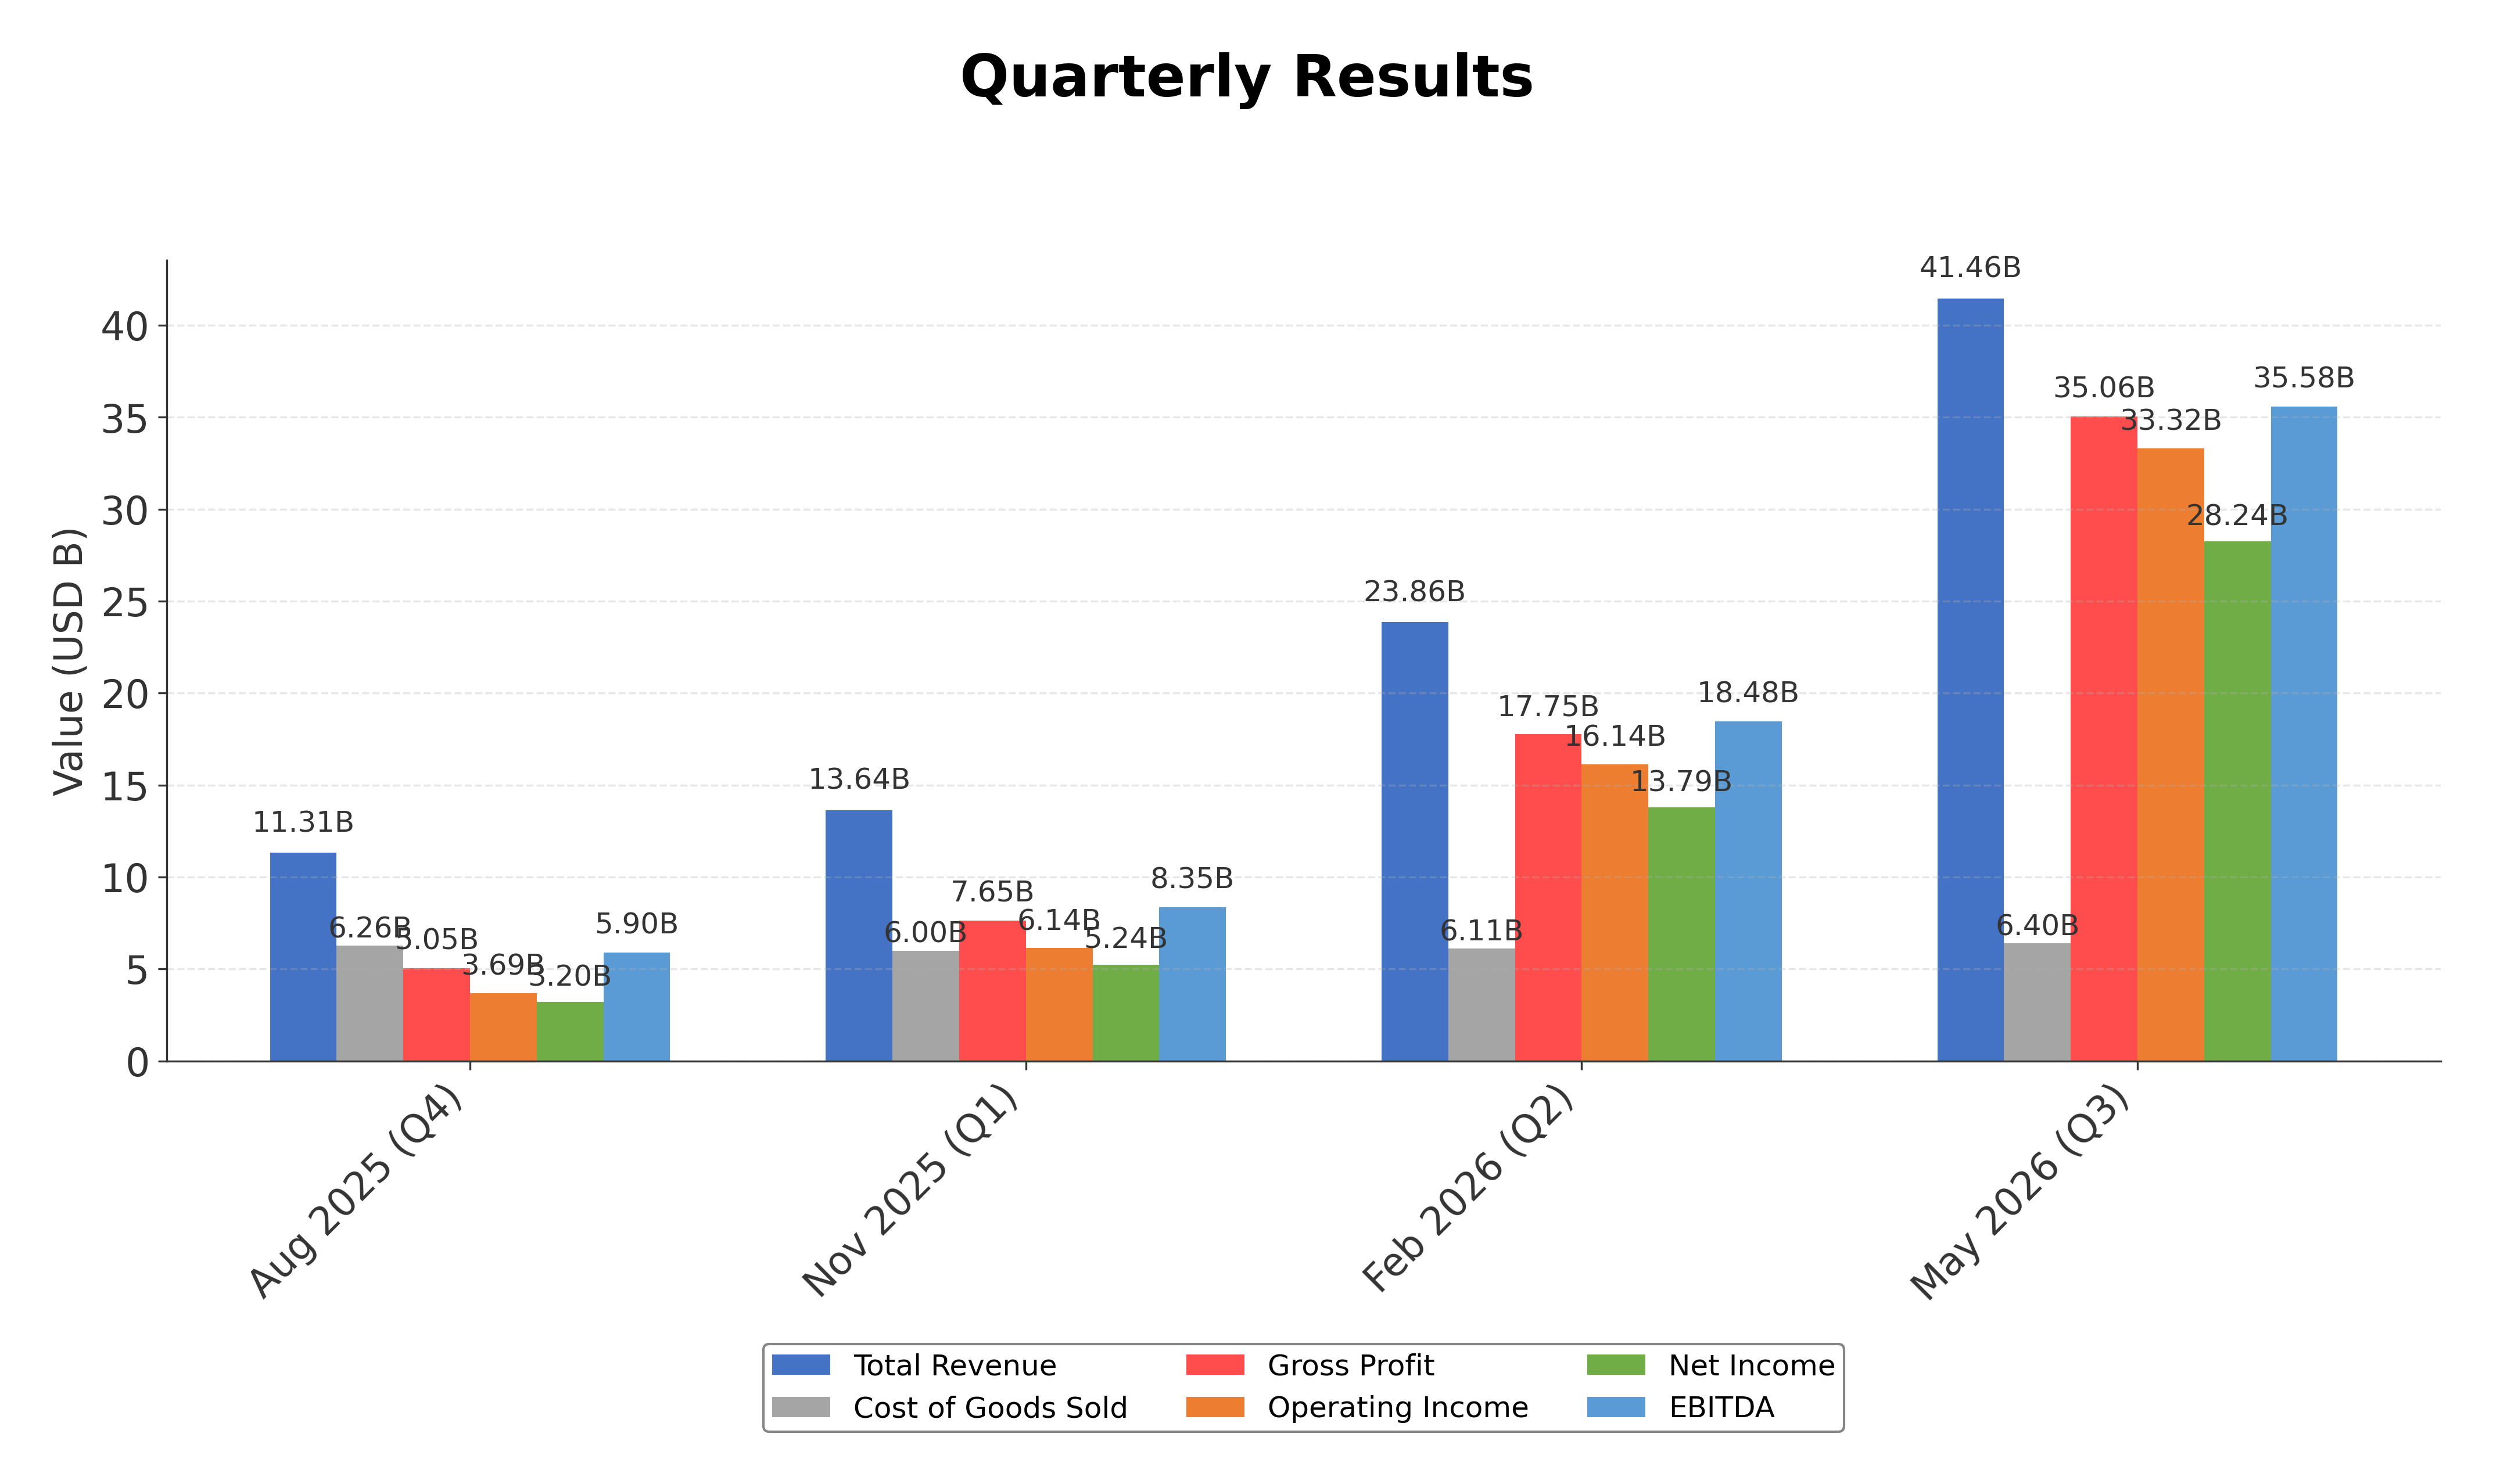
Financially, Micron reported trailing twelve months (TTM) revenue of approximately $90.27 billion with a gross margin of 84.56%, operating margin of 80.37%, and a net profit margin of 55.91%, indicating strong profitability and operational efficiency. The company’s return on equity (ROE) stands at 66.64%, and return on assets (ROA) at 34.87%, reflecting effective capital utilization and asset management. Its operating cash flow reached $51.43 billion TTM, with levered free cash flow of $7.64 billion, underscoring robust cash generation capabilities.
Valuation metrics show a trailing price-to-earnings (P/E) ratio of 22.42 and a forward P/E of 6.54, suggesting the market anticipates significant earnings growth. The price-to-book (P/B) ratio is elevated at 15.25, and enterprise value to EBITDA (EV/EBITDA) stands at 15.92. Micron’s market capitalization is approximately $1.11 trillion, with the current stock price near $928, positioned below its 52-week high of $1,255 and well above its 52-week low of $103.38. This pricing context reflects a premium valuation relative to book value but a discount to recent highs.
Micron’s strengths include a strong balance sheet with $26 billion in cash against $6.38 billion in debt, a high current ratio of 3.43 indicating liquidity, and dominant market positioning in memory technologies. Risks involve cyclical semiconductor demand fluctuations, competitive pressures from peers like SK hynix and Samsung, and regulatory or geopolitical challenges impacting supply chains. Recent strategic actions include multi-billion dollar investments to expand U.S. manufacturing capacity, aligning with government initiatives to enhance domestic semiconductor production.
Technically, Micron’s stock shows a mixed trend with price action fluctuating around key moving averages and momentum indicators signaling volatility. Recent news reveals both positive developments such as investment announcements and negative sentiment from short-seller activity and sector-wide memory stock downturns. The overall data suggests a cautious stance with conditions warranting close monitoring of market dynamics and company fundamentals.
Company and Industry Overview
Company Basics
Price Performance
Company Size
Shareholding Pattern
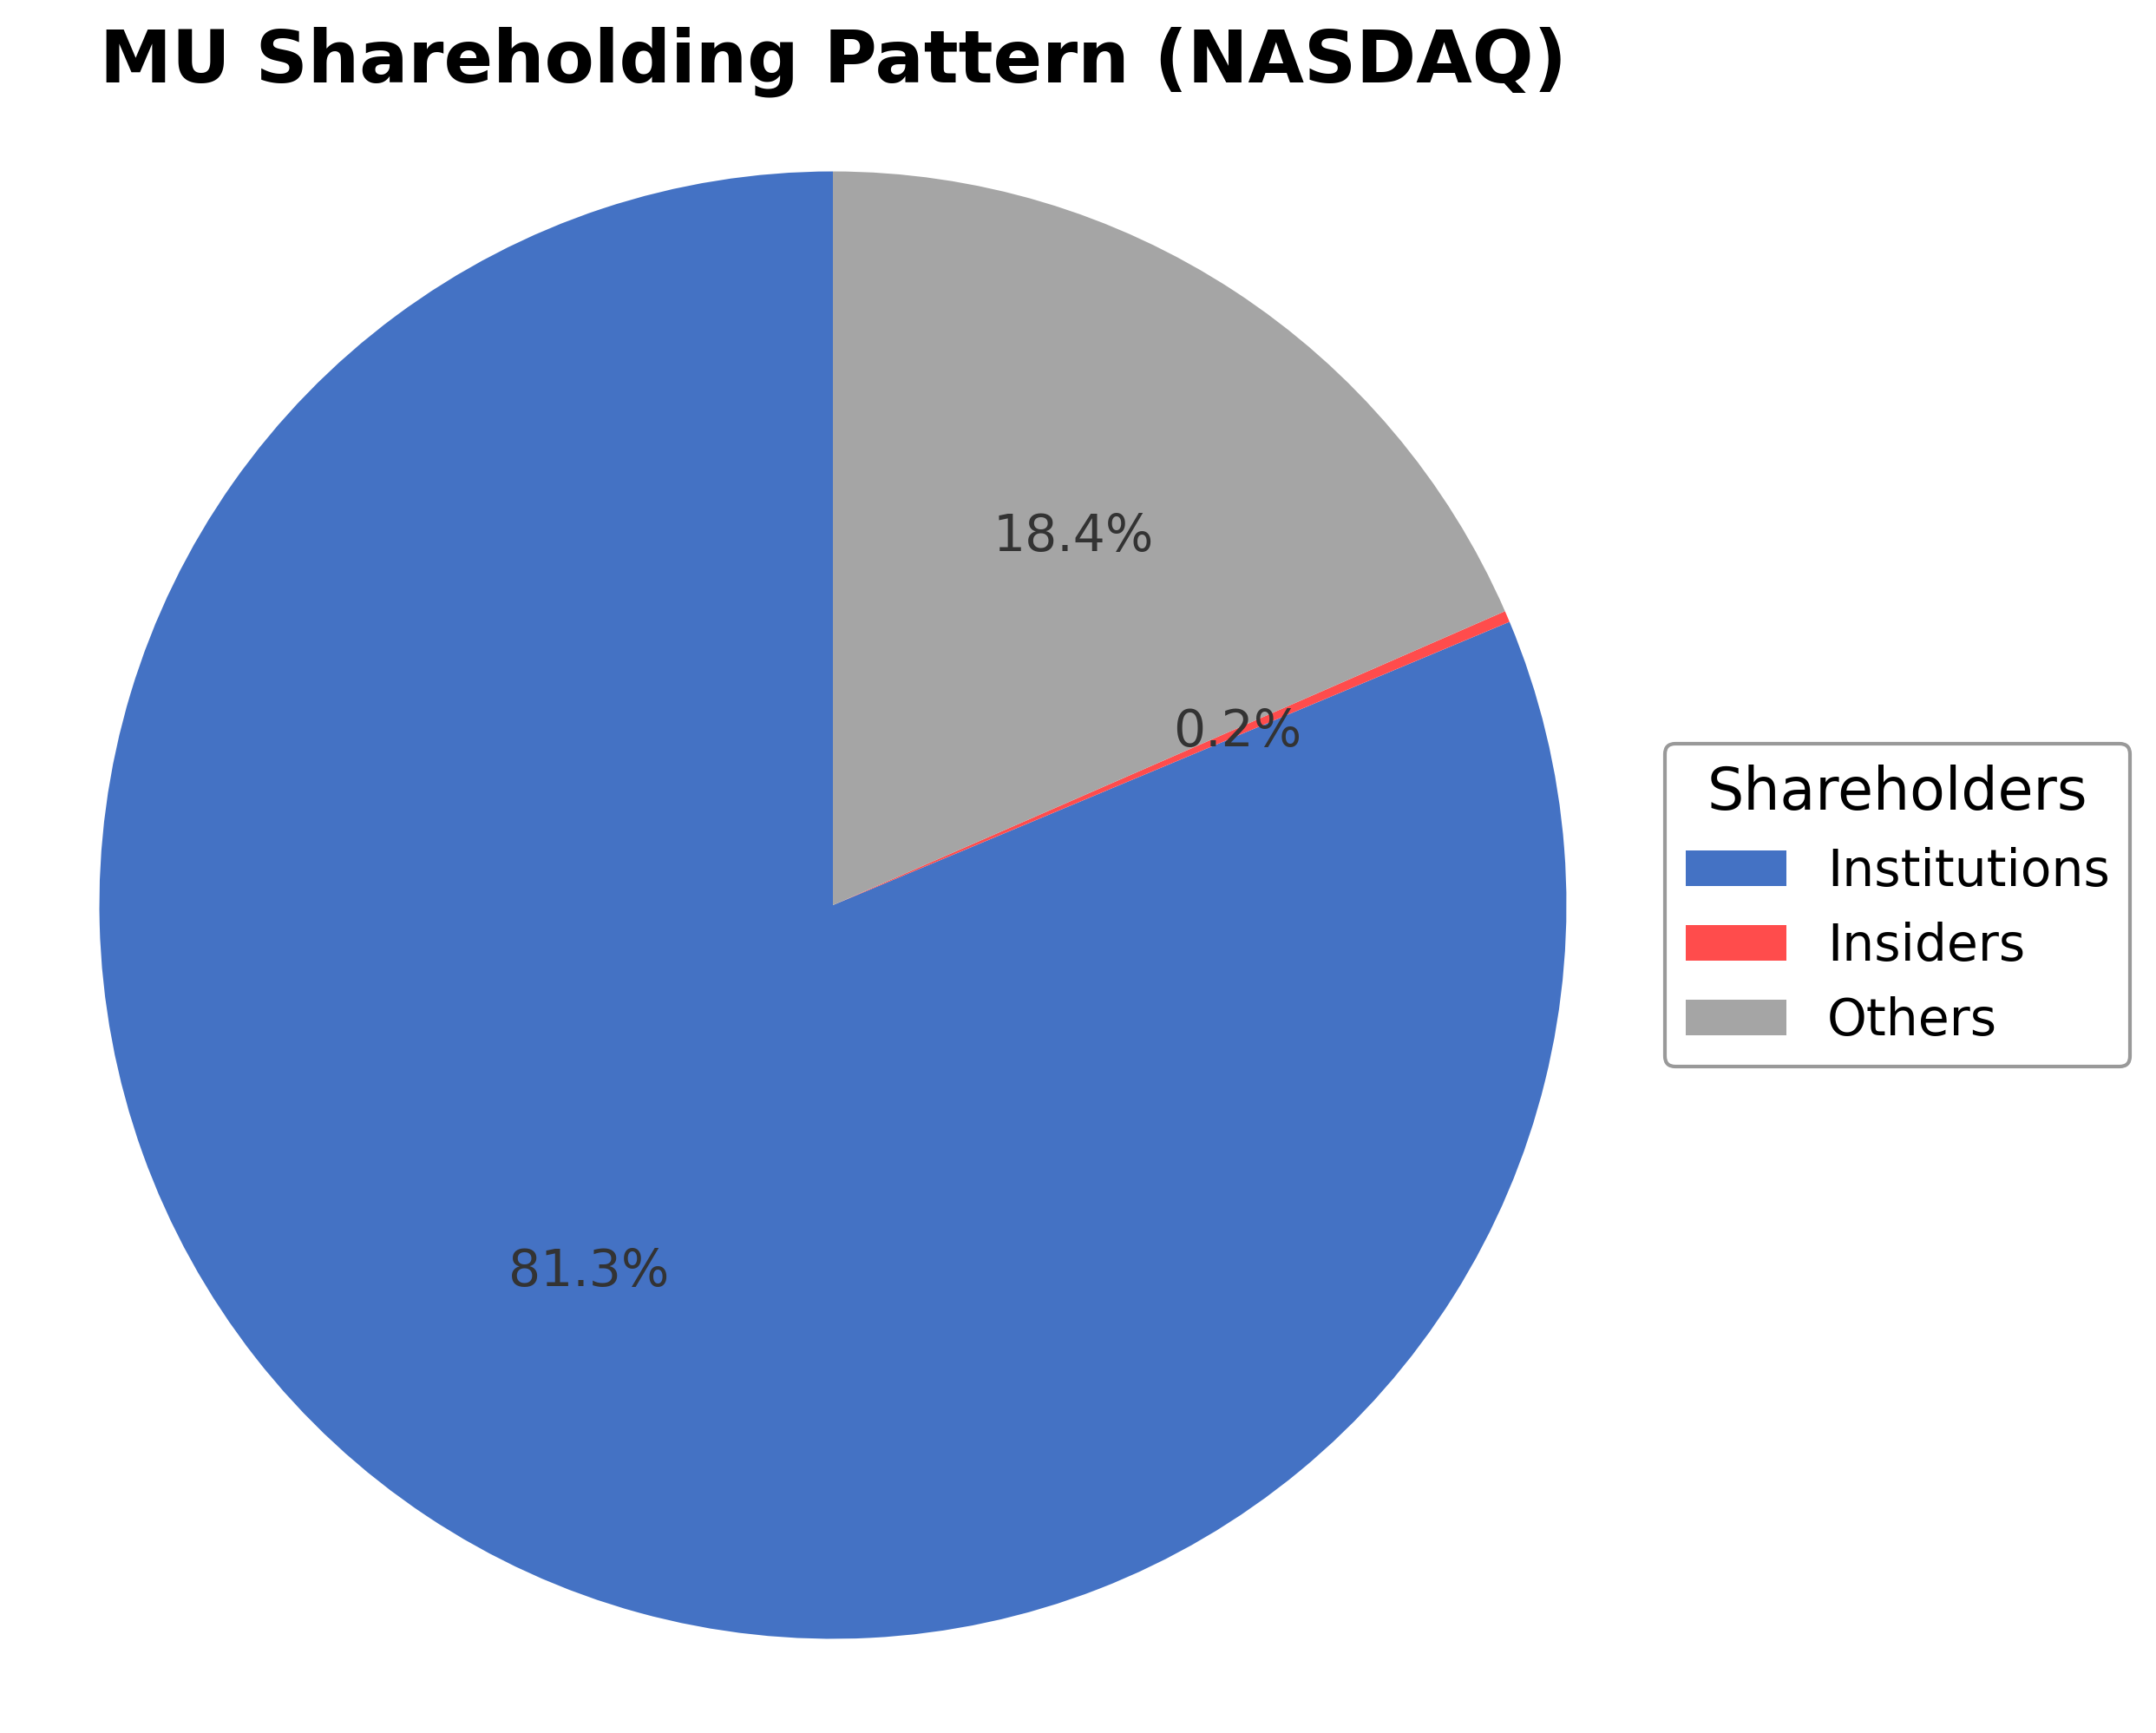
Micron Technology, Inc.'s ownership structure is characterized by a dominant institutional investor presence, holding approximately 81.31% of shares, reflecting strong institutional confidence and active participation by mutual funds, pension funds, and asset managers. Insider ownership is minimal at 0.25%, indicating limited direct executive or board member holdings. Public and other shareholders constitute roughly 18.37% of the share base. Over the past 12-24 months, institutional accumulation has remained steady with no significant shifts reported, suggesting a stable market sentiment towards the company. This ownership distribution underscores a governance framework influenced primarily by institutional investors, which may impact strategic decisions and corporate actions. The semiconductor industry remains highly competitive and cyclical, with Micron positioned as a key player amid evolving market demands and technological advancements.
Sector and Industry Analysis
The semiconductor sector is a critical component of the global technology ecosystem, with a market size valued in the hundreds of billions of dollars and characterized by rapid growth driven by demand for computing, mobile devices, and data storage. Key players include Micron Technology, Samsung Electronics, SK Hynix, and Kioxia, who dominate the memory segment with products such as DRAM and NAND flash memory. The sector experiences cyclical demand fluctuations but has recently benefited from strong tailwinds in artificial intelligence and cloud computing infrastructure.
Industry dynamics are shaped by high barriers to entry due to the capital-intensive nature of semiconductor manufacturing and the need for advanced technological innovation. Competitive positioning hinges on scale, product differentiation, and supply chain integration, with companies like Micron leveraging high-bandwidth memory (HBM) technologies to capture AI-driven growth opportunities. The market is also marked by consolidation and strategic partnerships to enhance capacity and technological leadership, intensifying competition among established firms.
The regulatory environment for semiconductors involves export controls, intellectual property protections, and trade policies that influence global supply chains and market access. Governments are increasingly focused on securing domestic semiconductor production capabilities to mitigate geopolitical risks and supply disruptions. Regulatory measures can impact capital investment decisions and cross-border collaborations, shaping the sector’s long-term outlook and competitive landscape.
Note: Analysis synthesized from industry research, market reports, and regulatory filings. Information is subject to change based on market conditions.
Financial Ratios Dashboard
Illustrative Scenario Analysis
DCF Assumptions:
Method: Two-Stage EPS-Priority Model
Financials
Peer Analysis
| Company Name | Market Cap | P/E Ratio | P/B Ratio | EV/EBITDA | Price to CFO |
|---|---|---|---|---|---|
| Micron Technology, Inc. | $1.11T | 22.42 | 15.25 | 15.92 | 21.50 |
| Advanced Micro Devices, Inc. | $909.70B | 181.72 | 14.11 | 121.30 | 93.54 |
| NVIDIA Corporation | $5.11T | 32.26 | 26.14 | 30.60 | 40.67 |
| Analog Devices, Inc. | $192.72B | 58.44 | 5.71 | 32.20 | 37.74 |
| Texas Instruments Inc | $283.46B | 52.87 | 16.77 | 32.68 | 36.23 |
| Intel Corporation | $552.06B | 809.33 | 4.95 | 40.77 | 55.32 |
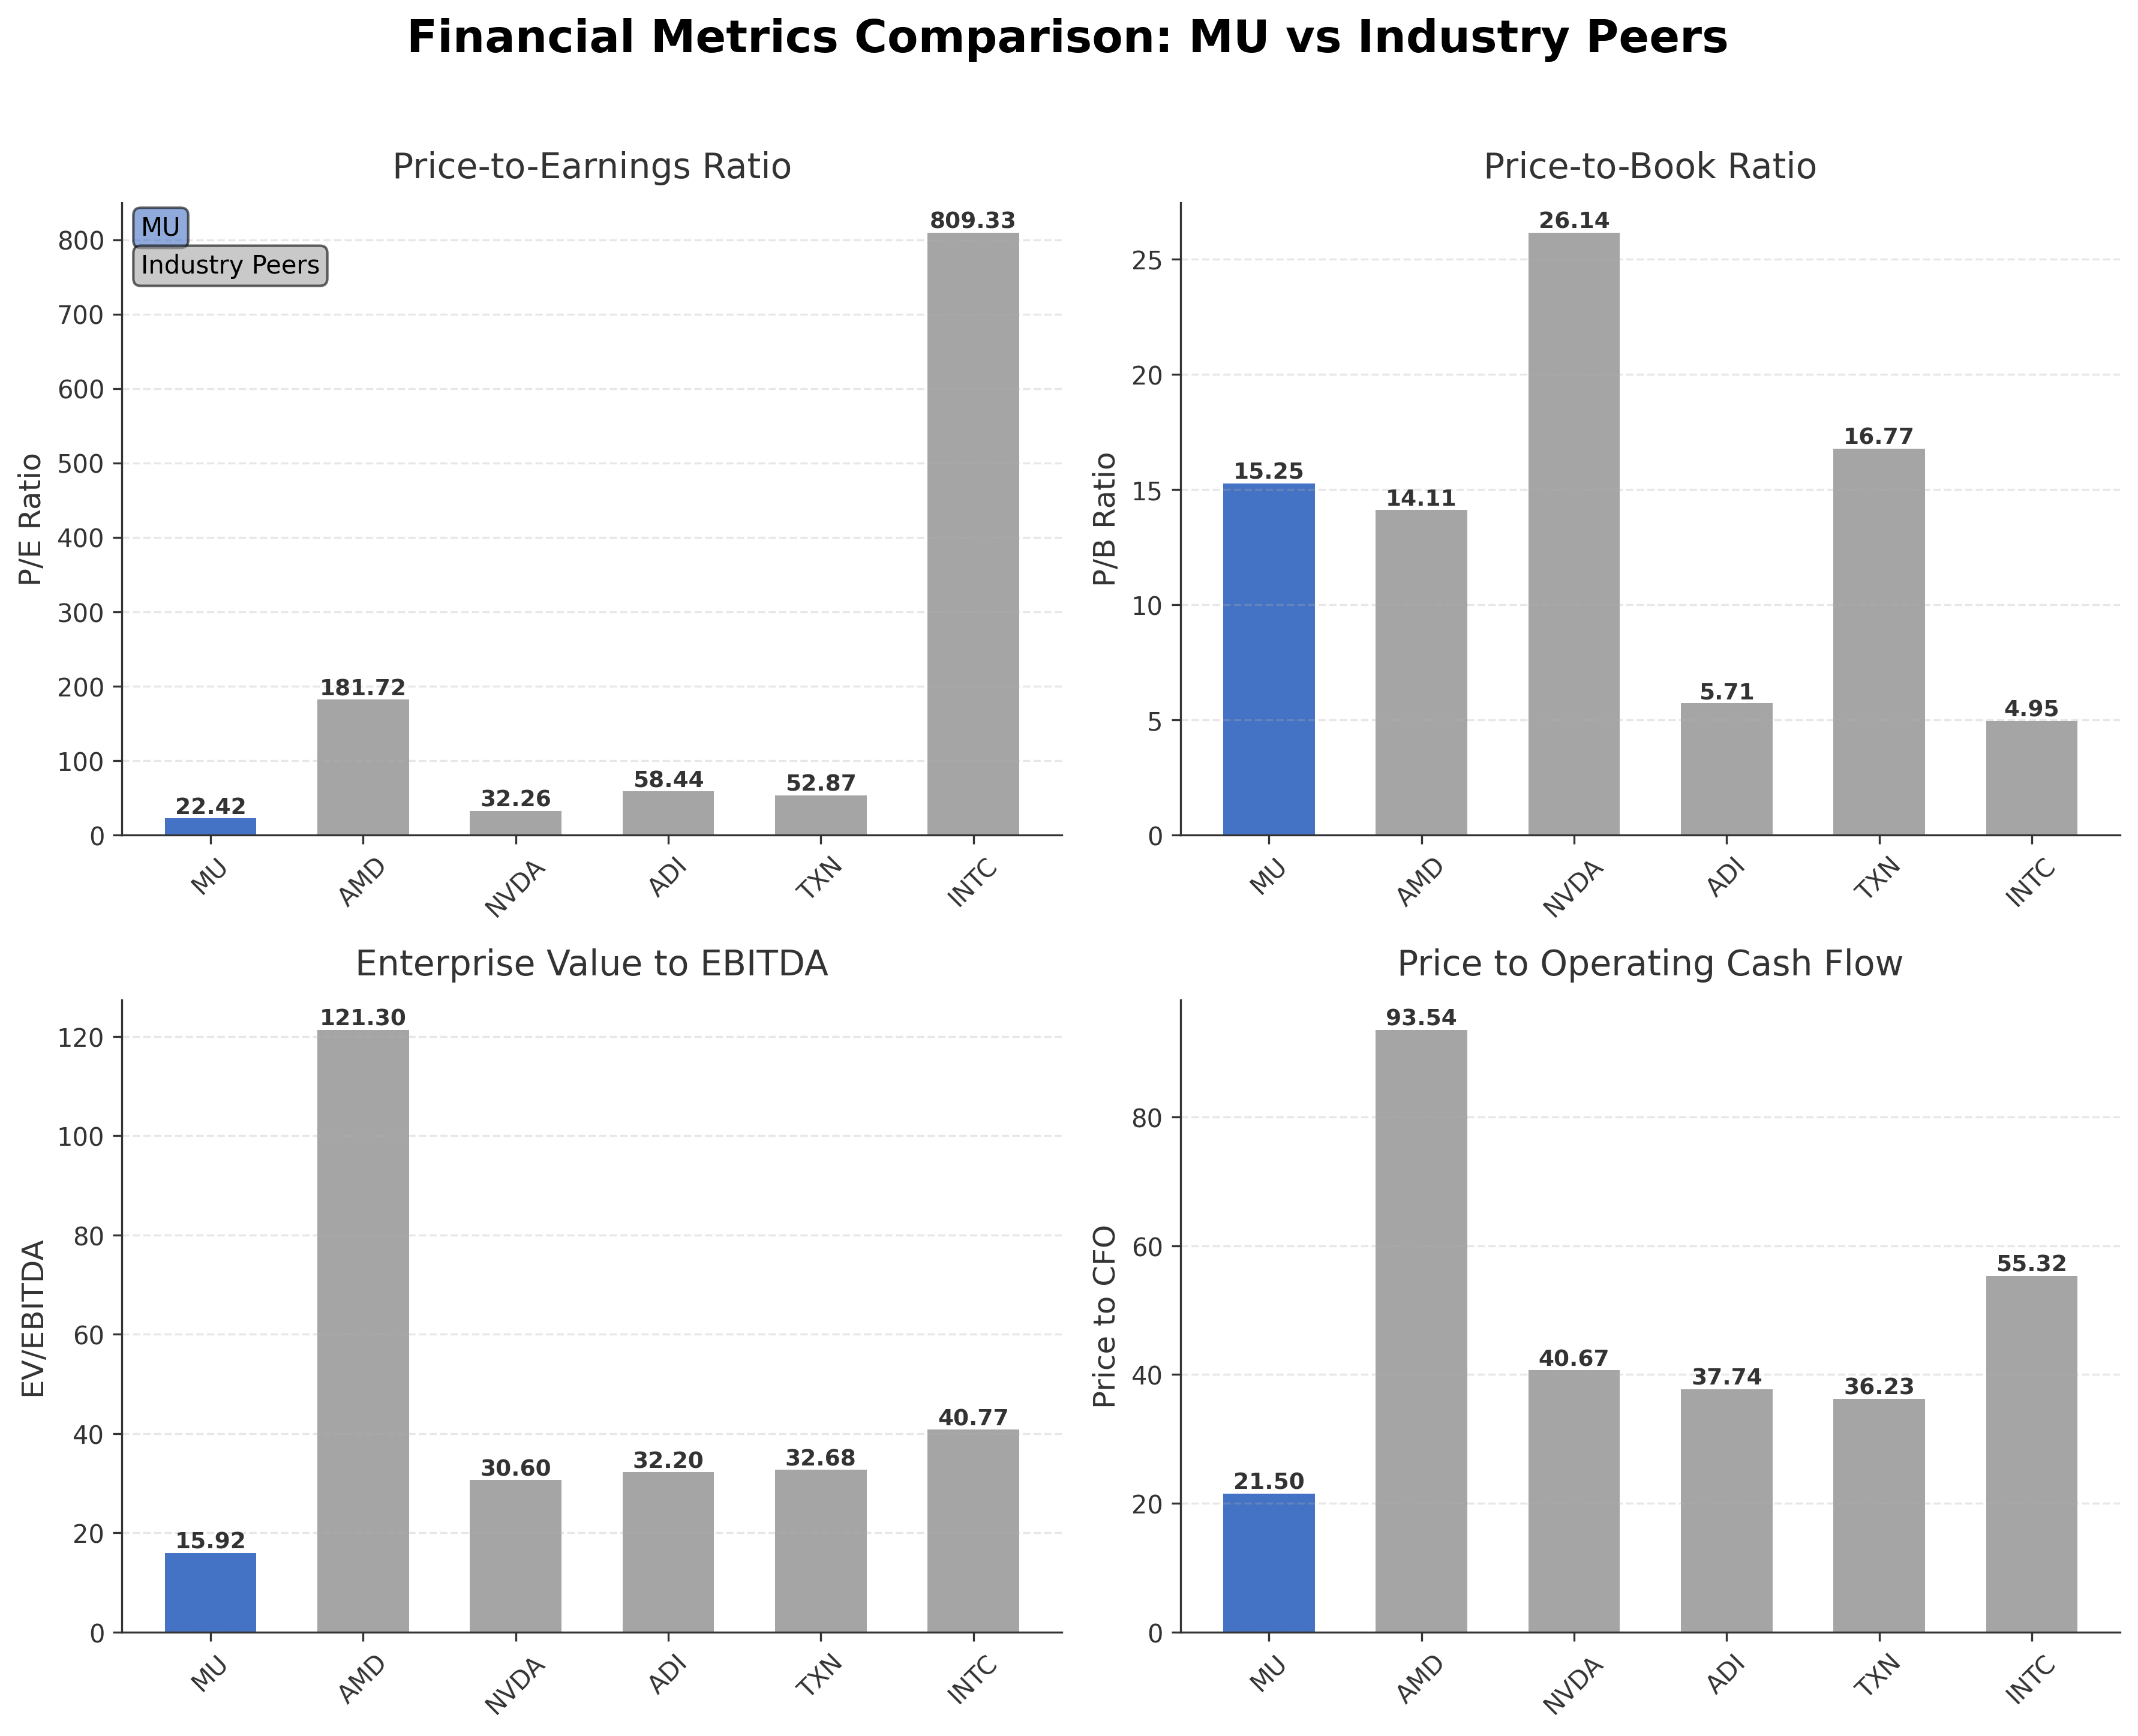
Comparison Analysis: Micron Technology exhibits a strong return on equity (66.64%) significantly higher than its peers, indicating superior profitability and capital efficiency. Its P/E ratio of 22.42 is considerably lower than many peers such as AMD (181.72) and Intel (809.33), suggesting a more reasonable valuation relative to earnings. The company’s P/B ratio of 15.25 is elevated compared to some competitors, reflecting a premium valuation on book value. EV/EBITDA of 15.92 is moderate within the peer group, indicating balanced enterprise valuation relative to earnings before interest, taxes, depreciation, and amortization. Overall, Micron stands out for its robust profitability metrics and comparatively attractive valuation multiples in the semiconductor sector.
Financial Metrics Comparison with Peers
Financial Statements
Comprehensive financial data including income, balance sheet, and cash flow metrics
Income Statement
| fiscal_date | 2025-08-31 | 2024-08-31 | 2023-08-31 | 2022-08-31 | 2021-08-31 |
|---|---|---|---|---|---|
| Sales | 37.38B | 25.11B | 15.54B | 30.76B | 27.70B |
| Cost Of Goods | 22.50B | 19.50B | 16.96B | 16.86B | 17.28B |
| Gross Profit | 14.87B | 5.61B | -1.42B | 13.90B | 10.42B |
| Operating Expense Research And Development | 3.80B | 3.43B | 3.11B | 3.12B | 2.66B |
| Operating Expense Selling General And Administrative | 1.21B | 1.13B | 920.00M | 1.07B | 894.00M |
| Operating Expense Other Operating Expenses | 61.00M | -192.00M | 9.00M | 7.00M | 119.00M |
| Operating Income | 9.81B | 1.25B | -5.46B | 9.71B | 6.75B |
| Non Operating Interest Income | 496.00M | 529.00M | 468.00M | 96.00M | 37.00M |
| Non Operating Interest Expense | 477.00M | 562.00M | 388.00M | 189.00M | 183.00M |
| Other Income Expense | -174.00M | 27.00M | -279.00M | -45.00M | -383.00M |
| Pretax Income | 9.65B | 1.24B | -5.66B | 9.57B | 6.22B |
| Income Tax | 1.12B | 451.00M | 177.00M | 888.00M | 394.00M |
| Net Income | 8.54B | 778.00M | -5.83B | 8.69B | 5.86B |
| Eps Basic | 7.65 | 0.70 | -5.34 | 7.81 | 5.23 |
| Eps Diluted | 7.59 | 0.70 | -5.34 | 7.75 | 5.14 |
| Basic Shares Outstanding | 1.12B | 1.10B | 1.09B | 1.11B | 1.12B |
| Diluted Shares Outstanding | 1.12B | 1.10B | 1.09B | 1.11B | 1.12B |
| Ebit | 10.13B | 1.80B | -5.27B | 9.76B | 6.40B |
| Ebitda | 18.65B | 9.52B | 2.78B | 16.94B | 13.00B |
| Net Income Continuous Operations | 8.54B | 778.00M | -5.83B | 8.69B | 5.86B |
| Minority Interests | N/A | N/A | N/A | 0.00 | 0.00 |
Data provided by Twelve Data
Balance Sheet
| fiscal_date | 2025-08-31 | 2024-08-31 | 2023-08-31 | 2022-08-31 | 2021-08-31 |
|---|---|---|---|---|---|
| Cash And Cash Equivalents | 9.64B | 7.04B | 8.58B | 8.26B | 7.76B |
| Accounts Receivable | 7.16B | 5.42B | 2.05B | 4.76B | 4.92B |
| Total Assets | 82.80B | 69.42B | 64.25B | 66.28B | 58.85B |
| Total Liabilities | 28.63B | 24.29B | 20.13B | 16.38B | 14.92B |
| Long Term Debt | 14.72B | 13.58B | 13.65B | 7.41B | 7.12B |
| Shareholders Equity | 54.16B | 45.13B | 44.12B | 49.91B | 43.93B |
Data provided by Twelve Data
Cash Flow Statement
| fiscal_date | 2025-08-31 | 2024-08-31 | 2023-08-31 | 2022-08-31 | 2021-08-31 |
|---|---|---|---|---|---|
| Operating Activities Net Income | 8.54B | 778.00M | -5.83B | 8.69B | 5.86B |
| Operating Activities Depreciation | 8.35B | 7.78B | 7.76B | 7.12B | 6.21B |
| Operating Activities Stock Based Compensation | 972.00M | 833.00M | 596.00M | 514.00M | 378.00M |
| Operating Activities Other Non Cash Items | 328.00M | 281.00M | 19.00M | 119.00M | 384.00M |
| Operating Activities Accounts Receivable | -1.78B | -3.58B | 2.76B | 190.00M | -1.45B |
| Operating Activities Other Assets Liabilities | 248.00M | 501.00M | -4.37B | -1.78B | 816.00M |
| Operating Activities Operating Cash Flow | 16.66B | 6.59B | 929.00M | 14.85B | 12.21B |
| Investing Activities Purchase Of Investments | -1.89B | -2.00B | -723.00M | -1.77B | -3.16B |
| Investing Activities Sale Of Investments | 1.70B | 1.79B | 1.59B | 1.61B | 2.11B |
| Investing Activities Other Investing Activity | 1.96B | 282.00M | 617.00M | -251.00M | 498.00M |
| Investing Activities Investing Cash Flow | 1.77B | 77.00M | 1.49B | 482.00M | -559.00M |
| Financing Activities Long Term Debt Issuance | 4.43B | 999.00M | 6.72B | 2.00B | 1.19B |
| Financing Activities Long Term Debt Payments | -4.62B | -1.90B | -761.00M | -2.03B | -1.52B |
| Financing Activities Common Stock Repurchase | 0.00 | -300.00M | -425.00M | -2.43B | -1.20B |
| Financing Activities Common Dividends | -522.00M | -513.00M | -504.00M | -461.00M | 0.00 |
| Financing Activities Other Financing Charges | -139.00M | -131.00M | -43.00M | -55.00M | -249.00M |
| Financing Activities Financing Cash Flow | -850.00M | -1.84B | 4.98B | -2.98B | -1.78B |
| End Cash Position | 9.65B | 7.05B | 8.66B | 8.34B | 7.83B |
| Income Tax Paid | 583.00M | 338.00M | 532.00M | 493.00M | 361.00M |
| Interest Paid | 418.00M | 503.00M | 323.00M | 154.00M | 171.00M |
| Free Cash Flow | 1.67B | 121.00M | -6.12B | 3.11B | 2.44B |
| Investing Activities Net Acquisitions | N/A | 0.00 | 0.00 | 888.00M | 0.00 |
| Investing Activities Capital Expenditures | N/A | N/A | N/A | N/A | N/A |
Data provided by Twelve Data
Technical Analysis
Key Insights
- The current trend shows mixed price action with fluctuations around the 50-day moving average near $889.55 and the 200-day moving average at approximately $460.41, indicating consolidation after recent volatility.
- Key support levels are identified near $880 and $830, while resistance is observed around the recent high near $1,000 and the 52-week peak at $1,255.
- The stock price is trading above the 200-day and 50-day moving averages but shows intermittent dips below the 10-day moving average, suggesting short-term volatility within a longer-term upward trend.
- Momentum indicators show the Relative Strength Index (RSI) near neutral levels, the MACD histogram fluctuating around the zero line, and stochastic oscillators indicating potential short-term oversold conditions.
- Analysis across daily, weekly, and monthly timeframes reveals consolidation phases with no clear breakout, reflecting market indecision amid mixed sentiment.
- Potential market scenarios include a continuation of sideways movement with volatility or a breakout above resistance levels if positive catalysts emerge, balanced by downside risk if negative momentum persists.
Trending News
1. Headline: Why is Micron Technology stock sliding today? By Investing.com
Summary: The move pulled other memory names including SanDisk, Western Digital, and Seagate sharply lower. Adding to the pressure on Micron specifically, noted short-seller Michael Burry initiated a put-option short position against the stock near $1,051.87 on July 1, 2026 — close to its historical ...
Sentiment: negative
2. Headline: MU: Micron Technology Inc Latest Stock Price, Analysis, News and Trading Ideas
Summary: Get real-time Micron Technology Inc (MU) stock price, news, financials, community insights, and trading ideas. Join 10 million+ investors and traders tracking markets in real-time on Stocktwits.
Sentiment: neutral
3. Headline: Here is Why Micron (MU) is One of the Stocks Set to Explode in the Next 2 Years
Summary: READ NEXT: 33 Stocks That Should Double in 3 Years and Cathie Wood 2026 Portfolio: 10 Best Stocks to Buy. Disclosure: None. Follow Insider Monkey on Google News. ... SKHYV SK hynix Inc. American Depositary Shares When Issued ... MU Micron Technology, Inc.
Sentiment: positive
4. Headline: SK hynix Vs. Micron: The Nasdaq's New Memory Stock Is The Better Buy (NASDAQ:MU) | Seeking Alpha
Summary: Jul 10, 2026, 4:01 PM ETMicron Technology, Inc. (MU) Stock, MU:CA Stock, ZMIC:CA Stock, SKHY StockSSNLF ... SK hynix Inc. debuts on NASDAQ via ADR IPO, offering US investors direct access to the HBM market leader. SKHY commands 56.4% HBM market share, outpacing Micron and Samsung, and benefits ...
Sentiment: positive
5. Headline: MU Stock Slumps As AI Euphoria Flips To Fear
Summary: Micron Technology Inc. stocks have been trading down by -2.69 percent amid bearish sentiment over weakening memory-chip demand. Key Takeaways Recent MU price action shows a 15.8% surge followed by a 5.7% premarket drop, flashing classic momentum exhaustion. Selling in MU deepened with a 10.6% slide
Sentiment: negative
Powered by Brave
Recent Updates
News Summary
As of 2026-07-09. Micron Technology announced a significant multi-billion dollar investment initiative aimed at expanding U.S. semiconductor manufacturing capacity, aligning with government efforts to enhance domestic chip production and reduce foreign dependency. The company reported record financial results for the third quarter of fiscal 2026, with revenue surpassing $41 billion, exceeding consensus estimates and demonstrating strong year-over-year growth. These developments underscore Micron's strategic focus on scaling production capabilities and capitalizing on robust demand in memory and storage markets. Investor relations communications reaffirm ongoing transparency and engagement with shareholders, supporting confidence in the company's operational and financial trajectory.
News Sentiment
The overall sentiment from recent updates is predominantly positive, driven by the announcement of substantial U.S. investment plans and record quarterly financial results. These factors highlight Micron's proactive approach to growth and supply chain resilience. Neutral tones arise from routine investor relations disclosures and earnings summaries, providing factual updates without significant market-moving implications. No material negative news was reported in the recent updates, indicating stable business conditions and constructive investor communications. The positive momentum is tempered by broader market volatility and sector-specific challenges noted in external news sources.
Source List
- https://www.cnbc.com/2026/07/09/micron-stock-us-chipmaking.html
- https://investors.micron.com/
- https://investors.micron.com/news-releases/news-release-details/micron-technology-inc-reports-record-results-third-quarter
- https://investors.micron.com/news-releases/news-release-details/micron-technology-inc-reports-results-second-quarter-fiscal-2026
- https://www.cnbc.com/2026/06/24/micron-mu-earnings-report-q3-2026.html
Analytical Overview
Analysis Summary
Micron Technology's valuation metrics show a trailing P/E of 22.42 and a forward P/E of 6.54, which are below many industry peers, indicating a relatively attractive earnings valuation compared to the semiconductor sector average P/E of 22.42. The company exhibits a positive growth trajectory with quarterly revenue growth of 3.46% and strong cash flow generation, including operating cash flow of $51.43 billion TTM and levered free cash flow of $7.64 billion, supporting financial flexibility. Its financial health is robust, with a low total debt to equity ratio of 6.33%, a strong current ratio of 3.43, and substantial cash reserves of $26 billion, reflecting solid liquidity and manageable leverage. Sector-specific challenges include cyclical demand fluctuations and competitive pressures, while opportunities arise from increasing demand in AI, data centers, and U.S. manufacturing expansion. Market positioning and competitive advantages are evident in Micron's leadership in memory technology and strategic investments enhancing domestic production capabilities.
Overall Business and Market Assessment
Supporting Factors: Key supporting factors include Micron's strong profitability metrics such as a 66.64% ROE and robust cash flow generation, alongside its strategic investments in U.S. manufacturing capacity that align with government initiatives. Risks to monitor involve semiconductor industry cyclicality, competitive dynamics with peers like SK hynix, and potential regulatory or geopolitical disruptions. The appropriate investment timeframe is medium to long-term, considering the company's capital-intensive growth strategy and sector volatility. Overall, Micron presents a balanced profile with solid fundamentals tempered by sector-specific risks, warranting a measured approach.
Risk Factors: No data
SWOT Analysis
Strengths
- Strong profitability with a 66.64% return on equity.
- Robust cash flow generation supporting operational flexibility.
- Dominant market position in advanced memory and storage solutions.
- Substantial cash reserves and low debt enhance financial stability.
Weaknesses
- High price-to-book ratio indicating premium valuation.
- Limited insider ownership potentially reducing direct executive alignment.
- Exposure to cyclical semiconductor demand fluctuations.
- Relatively high beta of 2.14 indicating stock price volatility.
Opportunities
- Expansion of U.S. manufacturing capacity through multi-billion dollar investments.
- Growing demand for memory products in AI and data center applications.
- Government initiatives supporting domestic semiconductor production.
- Technological advancements enabling new product development.
Threats
- Intense competition from global semiconductor companies like SK hynix and Samsung.
- Geopolitical risks affecting supply chains and trade policies.
- Potential regulatory challenges in key markets.
- Market volatility impacting stock price and investor sentiment.
Company Description
Micron Technology, Inc. is a global semiconductor company that focuses on designing and manufacturing advanced memory and storage solutions. Headquartered in Boise, Idaho, it serves original equipment manufacturers, cloud providers, and other enterprise and consumer-focused customers worldwide. Micron Technology operates through business units dedicated to compute and networking, mobile, embedded, and storage applications, delivering dynamic random-access memory (DRAM), NAND flash, and other solid-state storage products for use in data centers, smartphones, personal computers, automotive systems, and industrial equipment. Its portfolio underpins workloads such as artificial intelligence, high-performance computing, and real-time data analytics by enabling fast, reliable access to large volumes of data. Micron Technology also supplies memory modules and solid-state drives for client and enterprise environments, along with specialized solutions tailored to automotive safety systems and connected devices. Through its broad product range and global manufacturing footprint, the company plays a central role in the semiconductor supply chain and in supporting the infrastructure of modern digital services and applications.