
Micron Technology, Inc (MU)
Stock Analysis Report
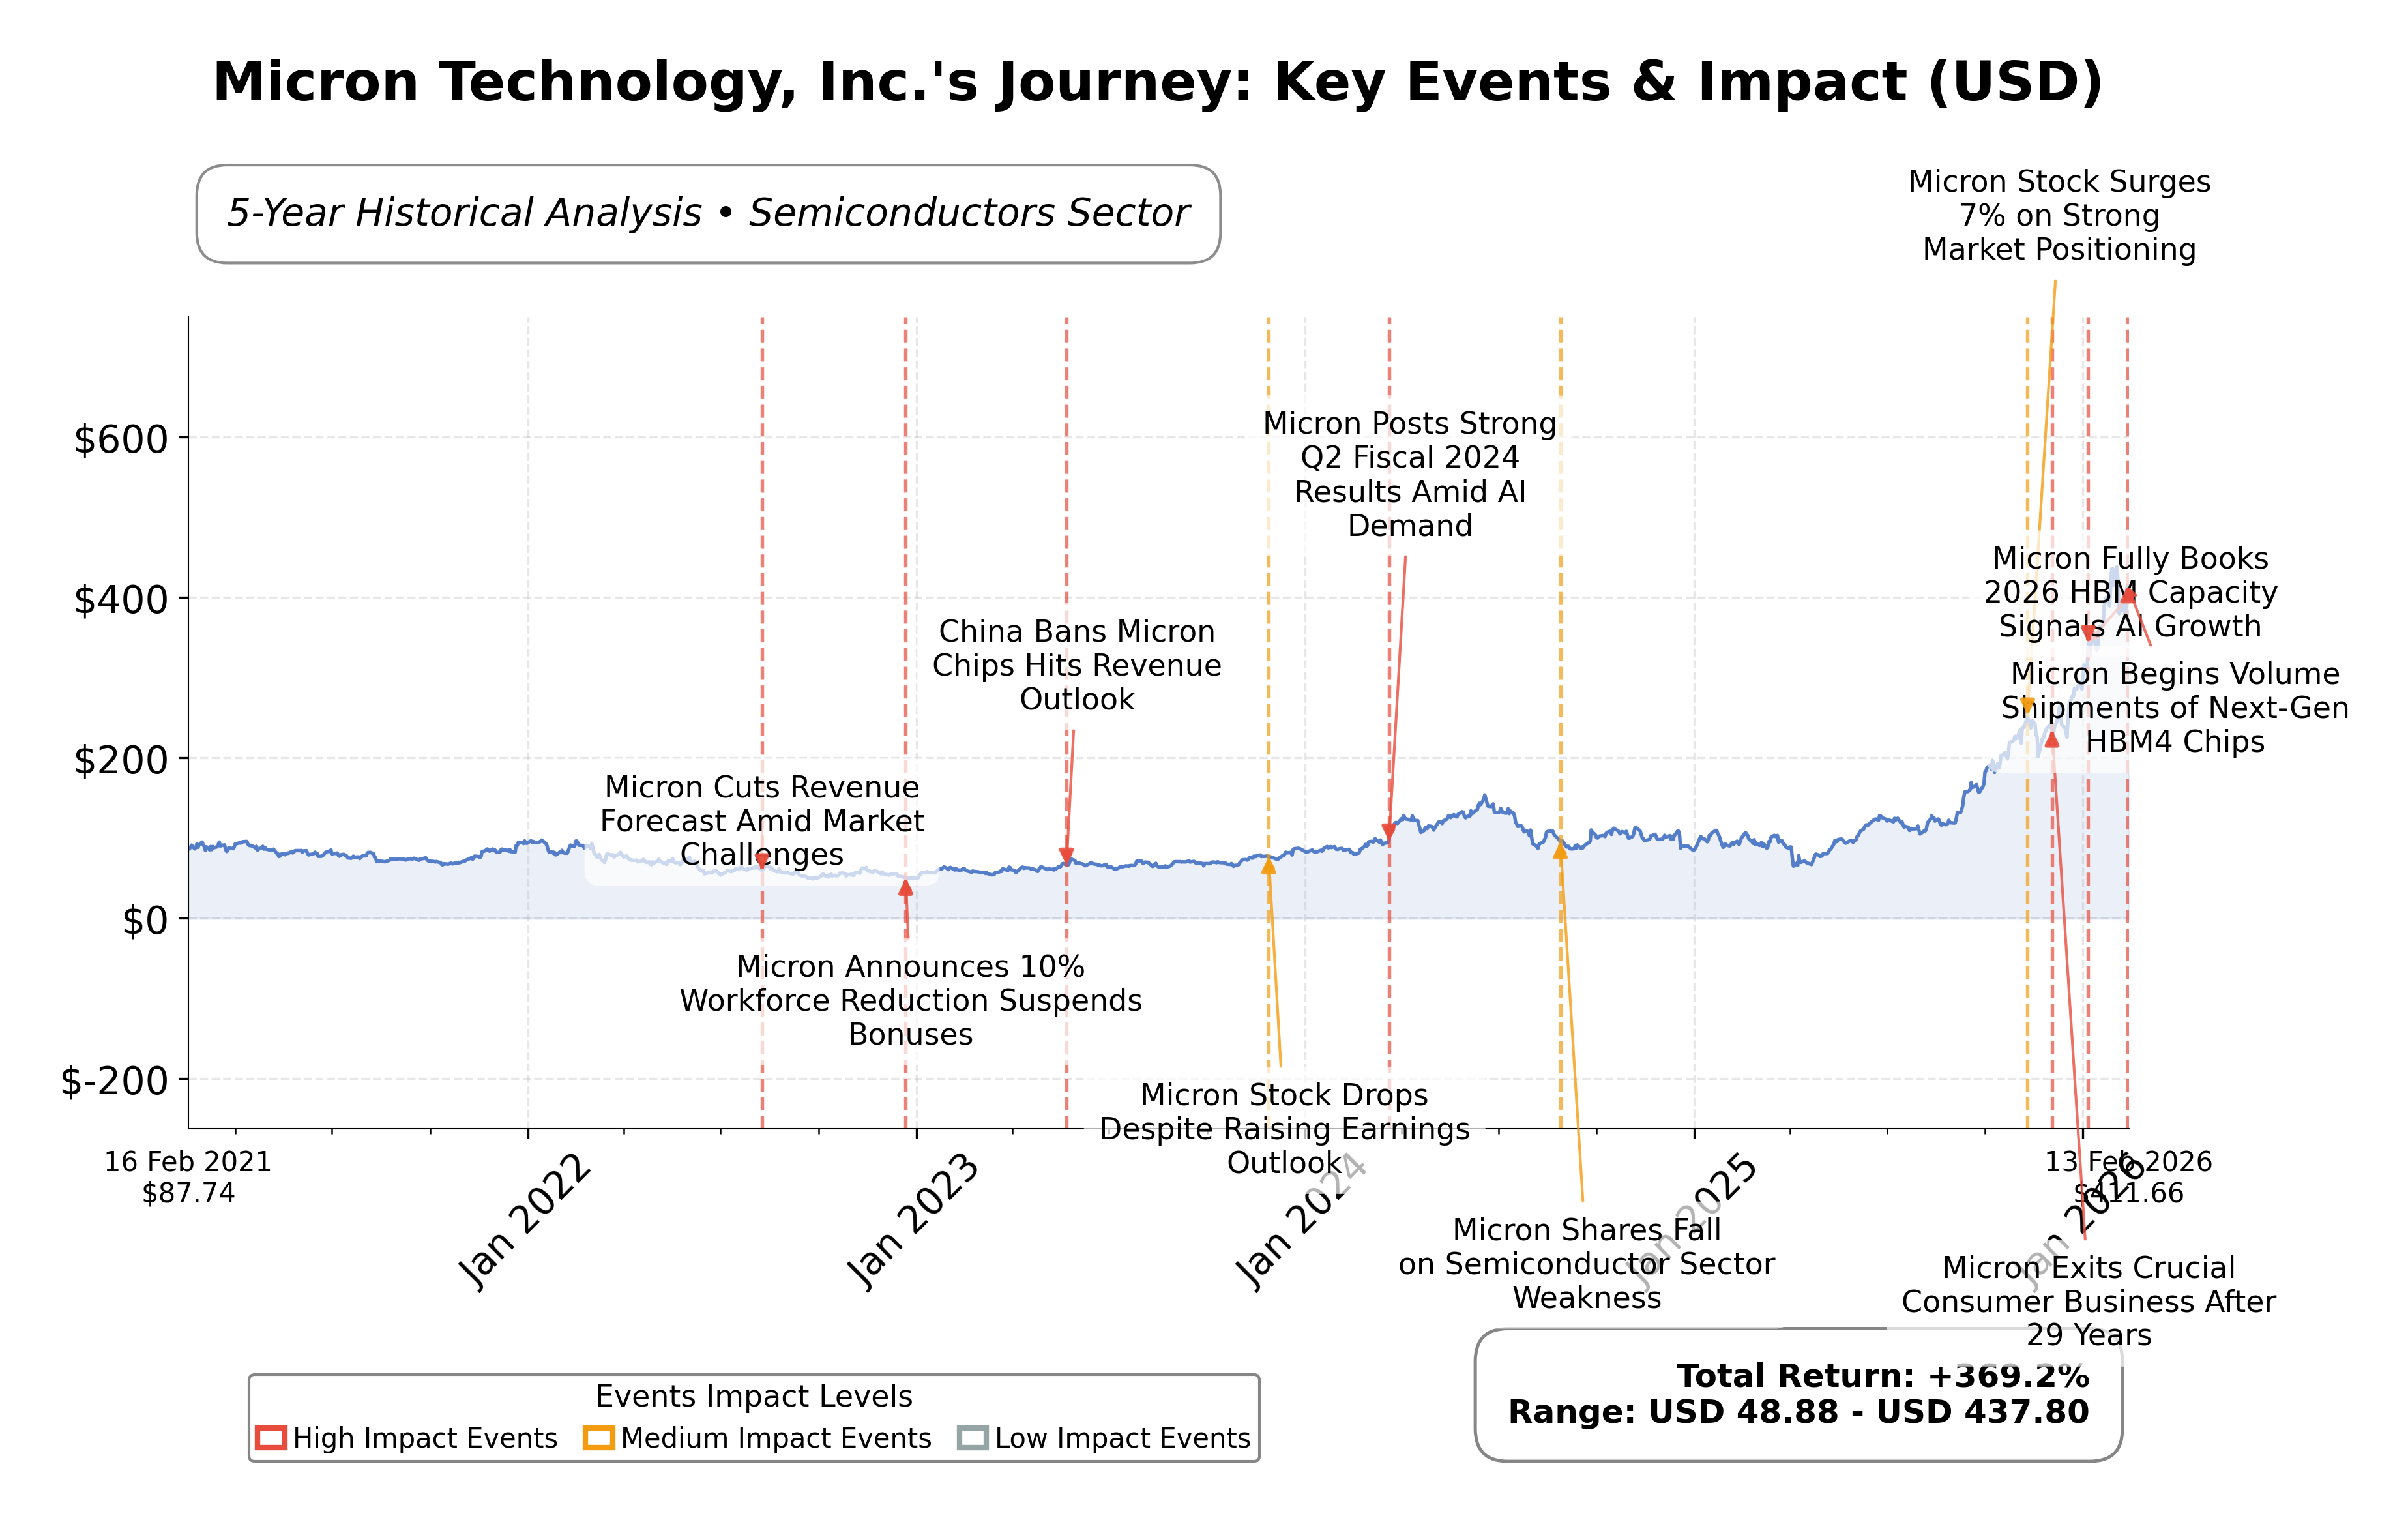
Stock Journey
Key Positives and Key Risks
Pros
- Strong revenue growth with a quarterly increase of 56.7% and year-over-year earnings growth of 180.2%, indicating robust operational performance.
- Healthy liquidity position with over $10 billion in total cash and a current ratio of 2.46, supporting financial flexibility.
- Forward P/E ratio of 9.48 and PEG ratio of 0.22 suggest potential undervaluation relative to expected earnings growth.
Cons
- Trailing P/E ratio of 39.17 is relatively high compared to some peers, reflecting elevated current valuation.
- Debt-to-equity ratio of 21.24 indicates moderate leverage that requires monitoring amid market volatility.
- Institutional ownership changes show some selling activity, which may introduce short-term sentiment risks.
Disclosure: This information is for general awareness and does not constitute investment advice
Report Summary
Micron Technology, Inc. operates as a leading global semiconductor company specializing in memory and storage solutions, including DRAM and NAND flash products. Positioned within the technology sector, Micron serves diverse markets such as data centers, mobile devices, automotive, and industrial applications, leveraging a vertically integrated model to enhance operational efficiency. The company maintains a significant presence across major global regions including the United States, Taiwan, Singapore, and China, reflecting its broad market reach and industry influence.
Financially, Micron demonstrates robust performance with trailing twelve-month revenue exceeding $42 billion and a net income of approximately $11.9 billion. Key valuation metrics include a trailing P/E ratio of 39.17 and a forward P/E of 9.48, indicating expectations of improved earnings. The company exhibits strong profitability margins with a gross margin of 56.04% and operating margin near 45%. Its market capitalization stands at $463.3 billion, supported by a solid balance sheet featuring a current ratio of 2.46 and total cash holdings over $10 billion.
Recent technical indicators show Micron trading above its 50-day and 200-day moving averages, suggesting a positive trend momentum. Strategic initiatives include advancing AI-related memory technologies such as HBM4 and capitalizing on DRAM supply constraints. Leadership and institutional ownership changes reflect active market engagement, with notable increases in holdings by certain investment firms. Key risks involve semiconductor supply chain volatility and competitive pressures, while strengths include innovation capacity and strong cash flow generation.
Within the semiconductor industry and U.S. market, Micron compares favorably against peers such as QUALCOMM, Intel, and Texas Instruments. It holds a larger market capitalization than most peers except for NVIDIA and Taiwan Semiconductor Manufacturing. Valuation metrics reveal a relatively high P/E ratio compared to some competitors but a lower forward P/E, indicating anticipated earnings growth. Enterprise value to EBITDA and price to cash flow ratios position Micron in a competitive stance, balancing growth prospects with valuation considerations.
Micron Technology stands as a pivotal player navigating the dynamic semiconductor landscape, marked by rapid technological advancements and evolving demand driven by AI and data center expansion. Recent achievements include strong revenue growth and successful product launches, while ongoing challenges encompass supply shortages and market competition. The company faces critical junctures where strategic execution and market conditions will significantly influence its trajectory. Observers may find value in monitoring Micronâs financial health, market positioning, and industry developments to inform their perspective on the stockâs potential.
Company and Industry Overview
Company Basics
Price Performance
Company Size
Shareholding Pattern
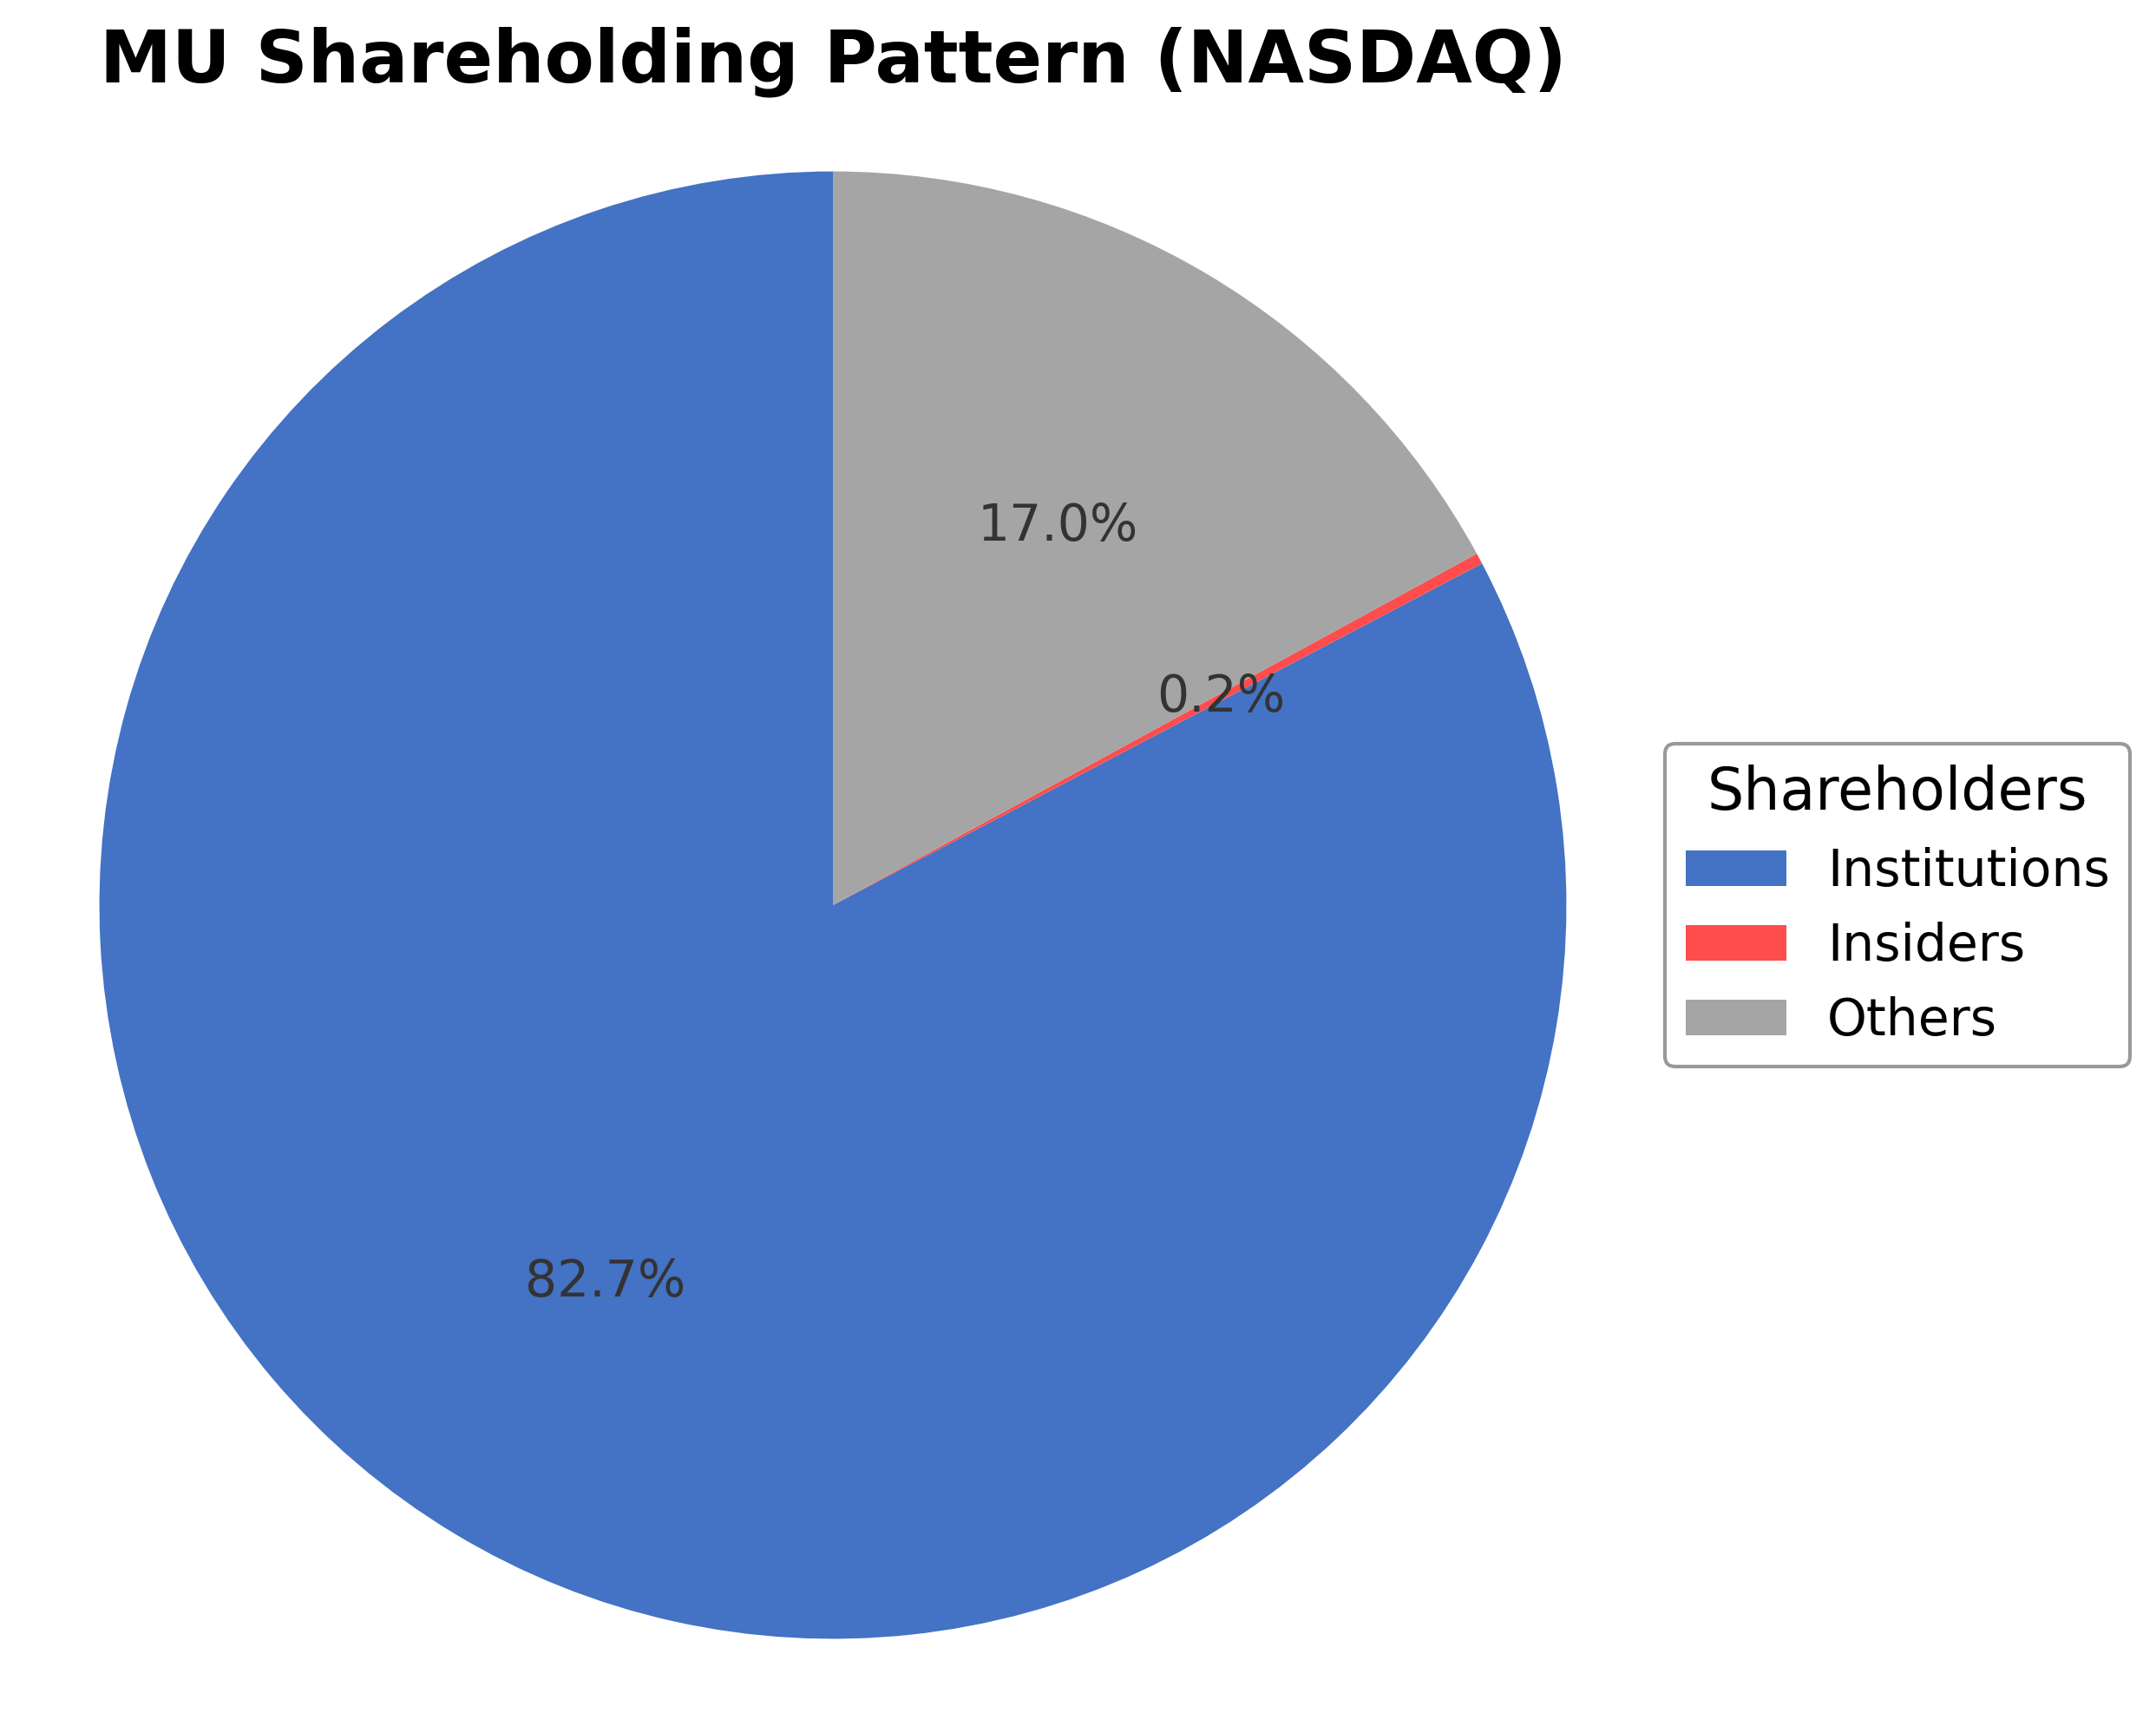
Micron Technology, Inc.'s ownership structure is predominantly institutional, with approximately 82.71% of shares held by mutual funds, pension funds, and asset managers, reflecting strong institutional interest and confidence. Insider ownership, including executives and board members, is minimal at 0.24%, while public and other shareholders constitute about 17.05%. Over the past 12-24 months, institutional investors have actively adjusted positions, with some funds increasing stakes notably, indicating dynamic market engagement. These shareholding patterns suggest robust governance oversight and a strategic focus aligned with institutional priorities, potentially influencing corporate decisions and long-term direction within the competitive semiconductor industry.
Sector and Industry Analysis
Micron Technology, Inc. (MU) operates within the broader Information Technology sector, specifically in the semiconductor industry, which is a critical enabler of modern electronics and computing. The global semiconductor market is substantial, valued at several hundred billion dollars, with a compound annual growth rate (CAGR) typically in the mid-single digits, driven by increasing demand for memory and storage solutions across consumer electronics, data centers, automotive, and industrial applications. Key players alongside Micron include Samsung Electronics, SK Hynix, Intel, and Western Digital, each competing primarily in memory segments such as DRAM and NAND flash. The sector is characterized by high capital intensity, rapid innovation cycles, and cyclical demand influenced by end-market consumption patterns.
Industry trends reveal a pronounced shift toward advanced memory technologies, including 3D NAND, DDR5 DRAM, and emerging non-volatile memories, which are critical for supporting cloud computing, artificial intelligence (AI), 5G infrastructure, and edge computing. Consumer behavior increasingly favors devices with higher performance and storage capacity, fueling demand for sophisticated memory solutions. Additionally, the rise of electric vehicles and IoT devices presents new growth avenues. The industry is also witnessing consolidation and strategic partnerships to manage the high costs of R&D and manufacturing. Supply chain resilience and diversification have become priorities following recent global disruptions, prompting investments in domestic manufacturing capabilities in key markets like the U.S. and Europe.
The regulatory landscape for the semiconductor industry is complex and evolving, shaped by national security concerns, export controls, and trade policies. Governments worldwide are implementing stricter export restrictions on advanced semiconductor technologies to safeguard intellectual property and maintain technological leadership, notably between the U.S. and China. Compliance with environmental regulations related to manufacturing processes and materials handling is also critical. Subsidies and incentives under initiatives such as the U.S. CHIPS Act aim to bolster domestic production and innovation, influencing capital allocation and competitive dynamics. Companies must navigate these regulations while managing geopolitical risks that can impact supply chains and market access.
Competitive dynamics in the semiconductor memory industry are defined by oligopolistic market structure with a few dominant firms controlling significant market share, creating high barriers to entry due to the substantial capital expenditure required for fabrication plants and R&D. Micron’s competitive positioning hinges on technological innovation, scale efficiencies, and product portfolio breadth. The industry’s cyclical nature demands operational agility to manage inventory and pricing pressures. Intellectual property protection and continuous process improvements are vital for maintaining differentiation. Strategic collaborations with OEMs and end-users enhance market reach and product integration. Overall, the competitive landscape is intense, with firms investing heavily in next-generation technologies to capture emerging demand segments and sustain long-term growth.
Note: Analysis synthesized from industry research, market reports, and regulatory filings. Information is subject to change based on market conditions.
Illustrative Scenario Analysis
DCF Assumptions:
Method: Two-Stage EPS-Priority Model
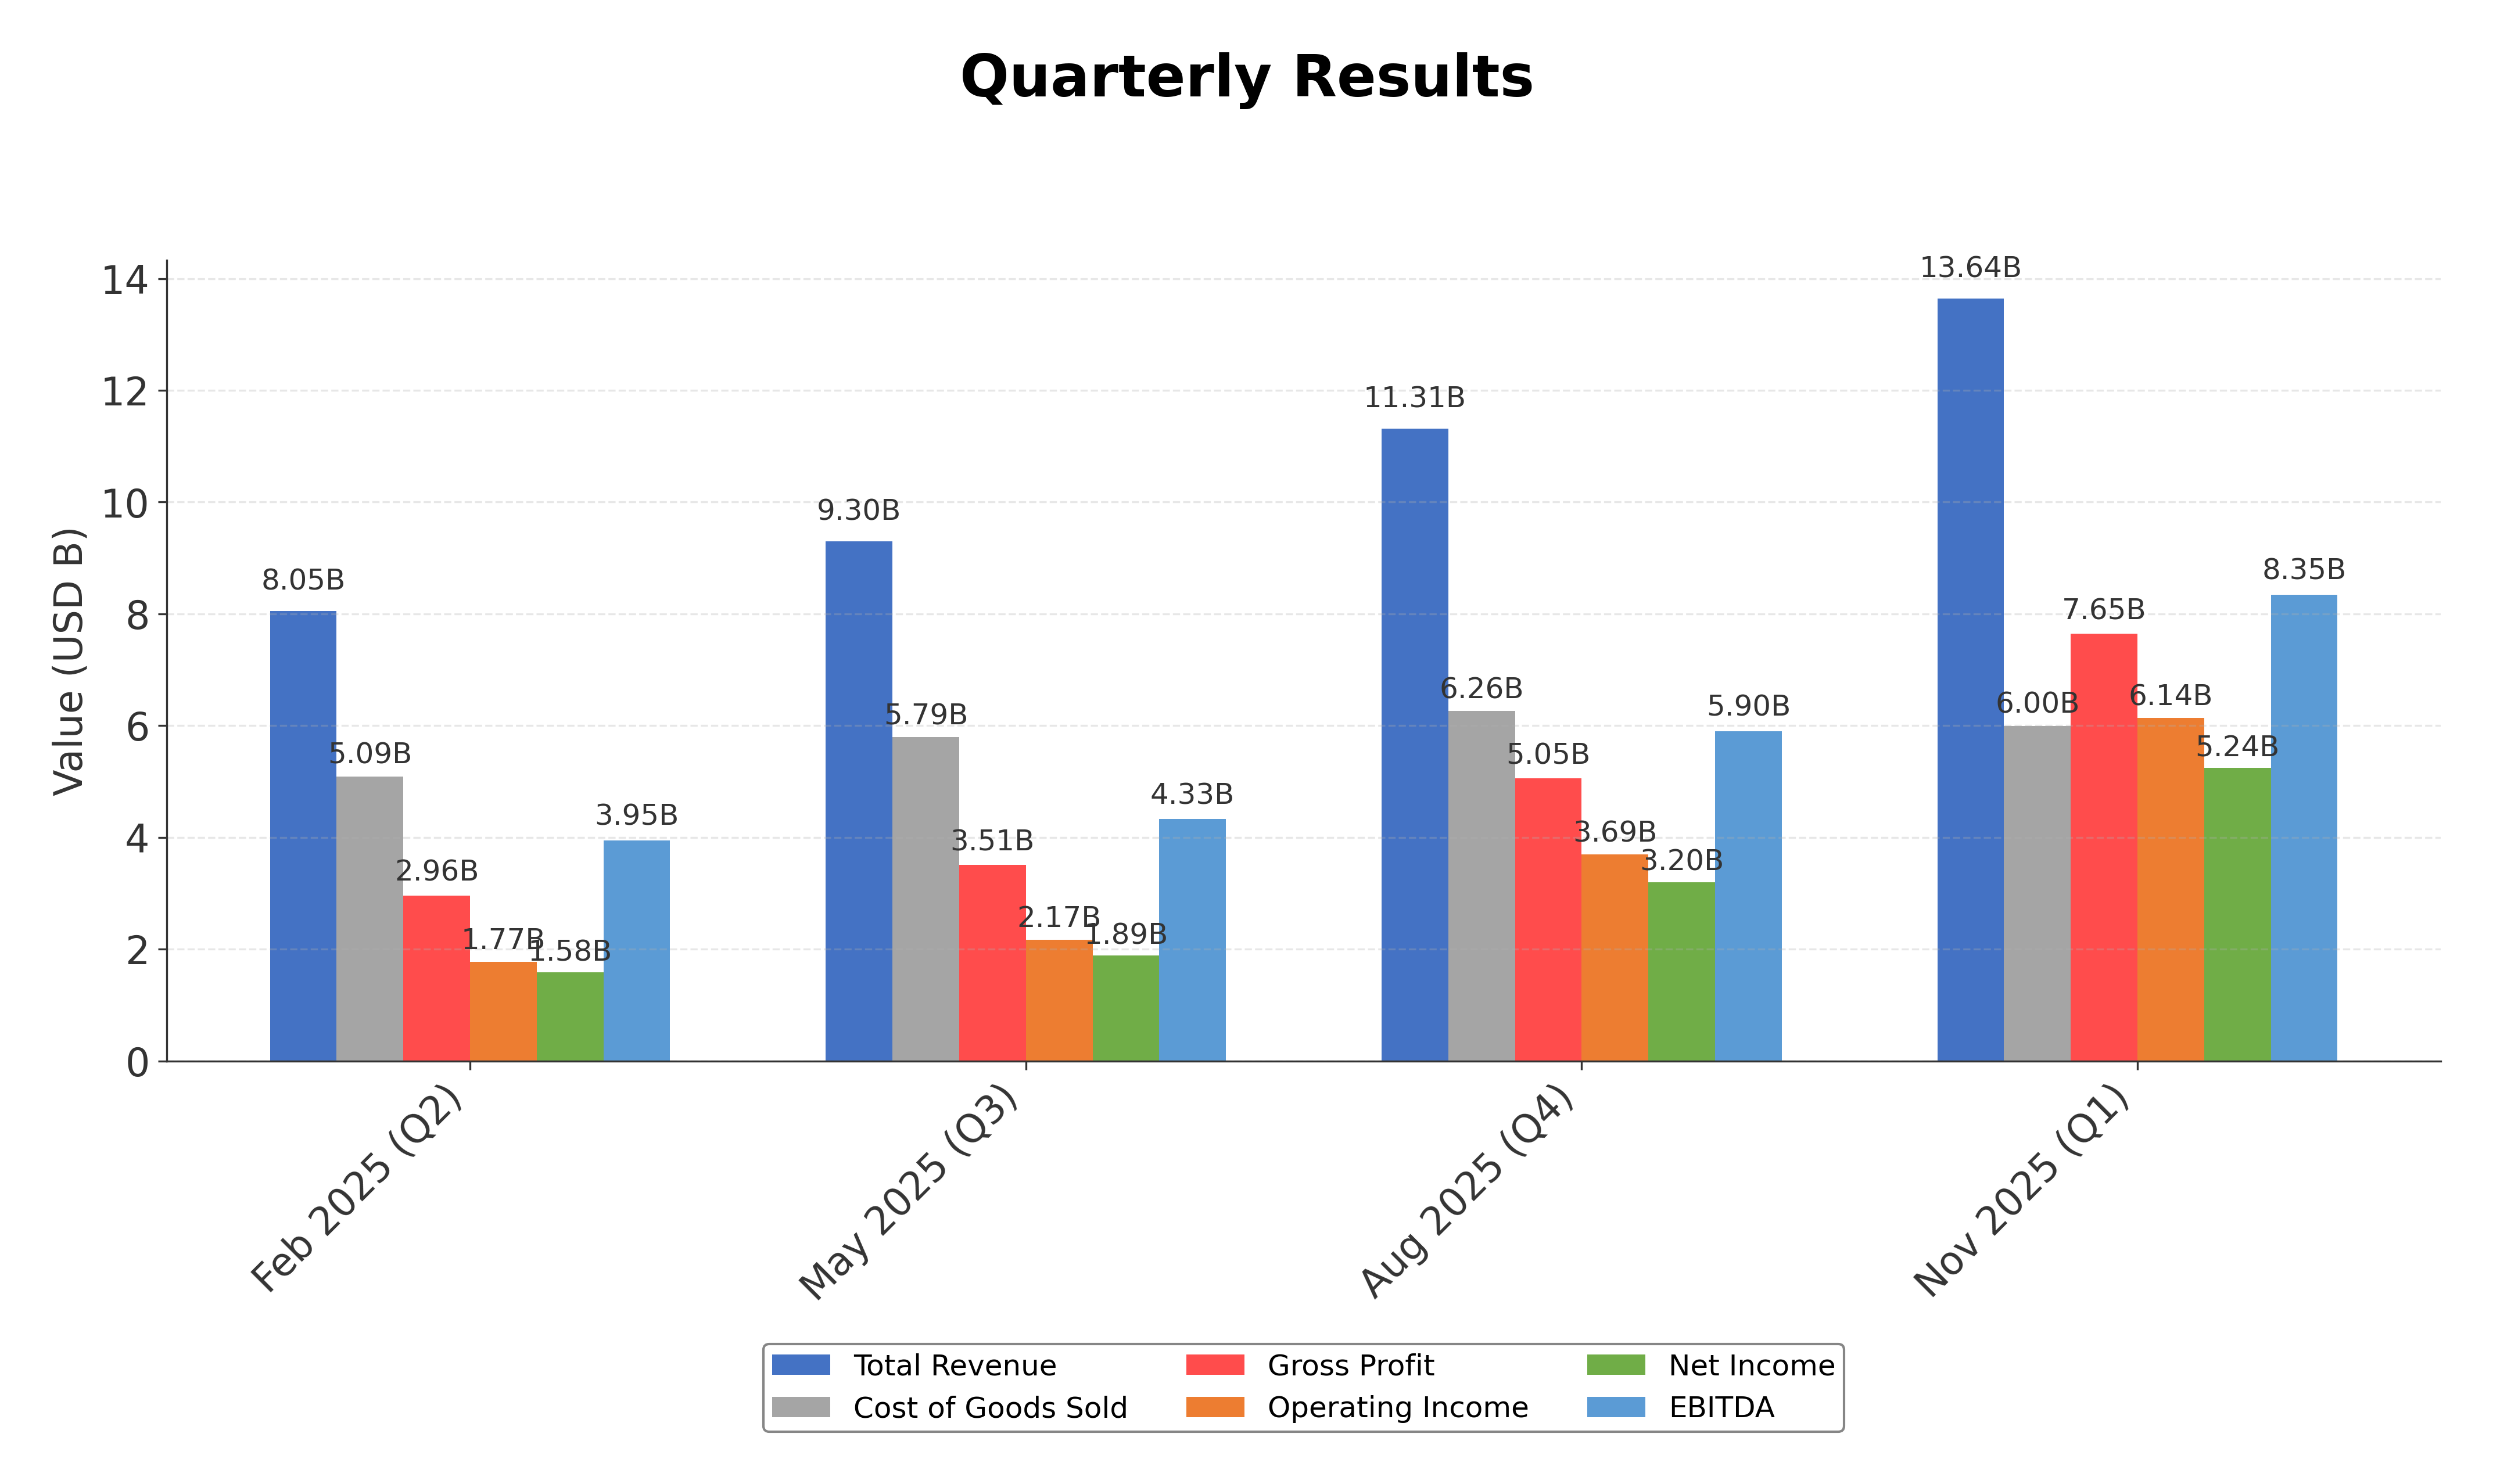
Financials
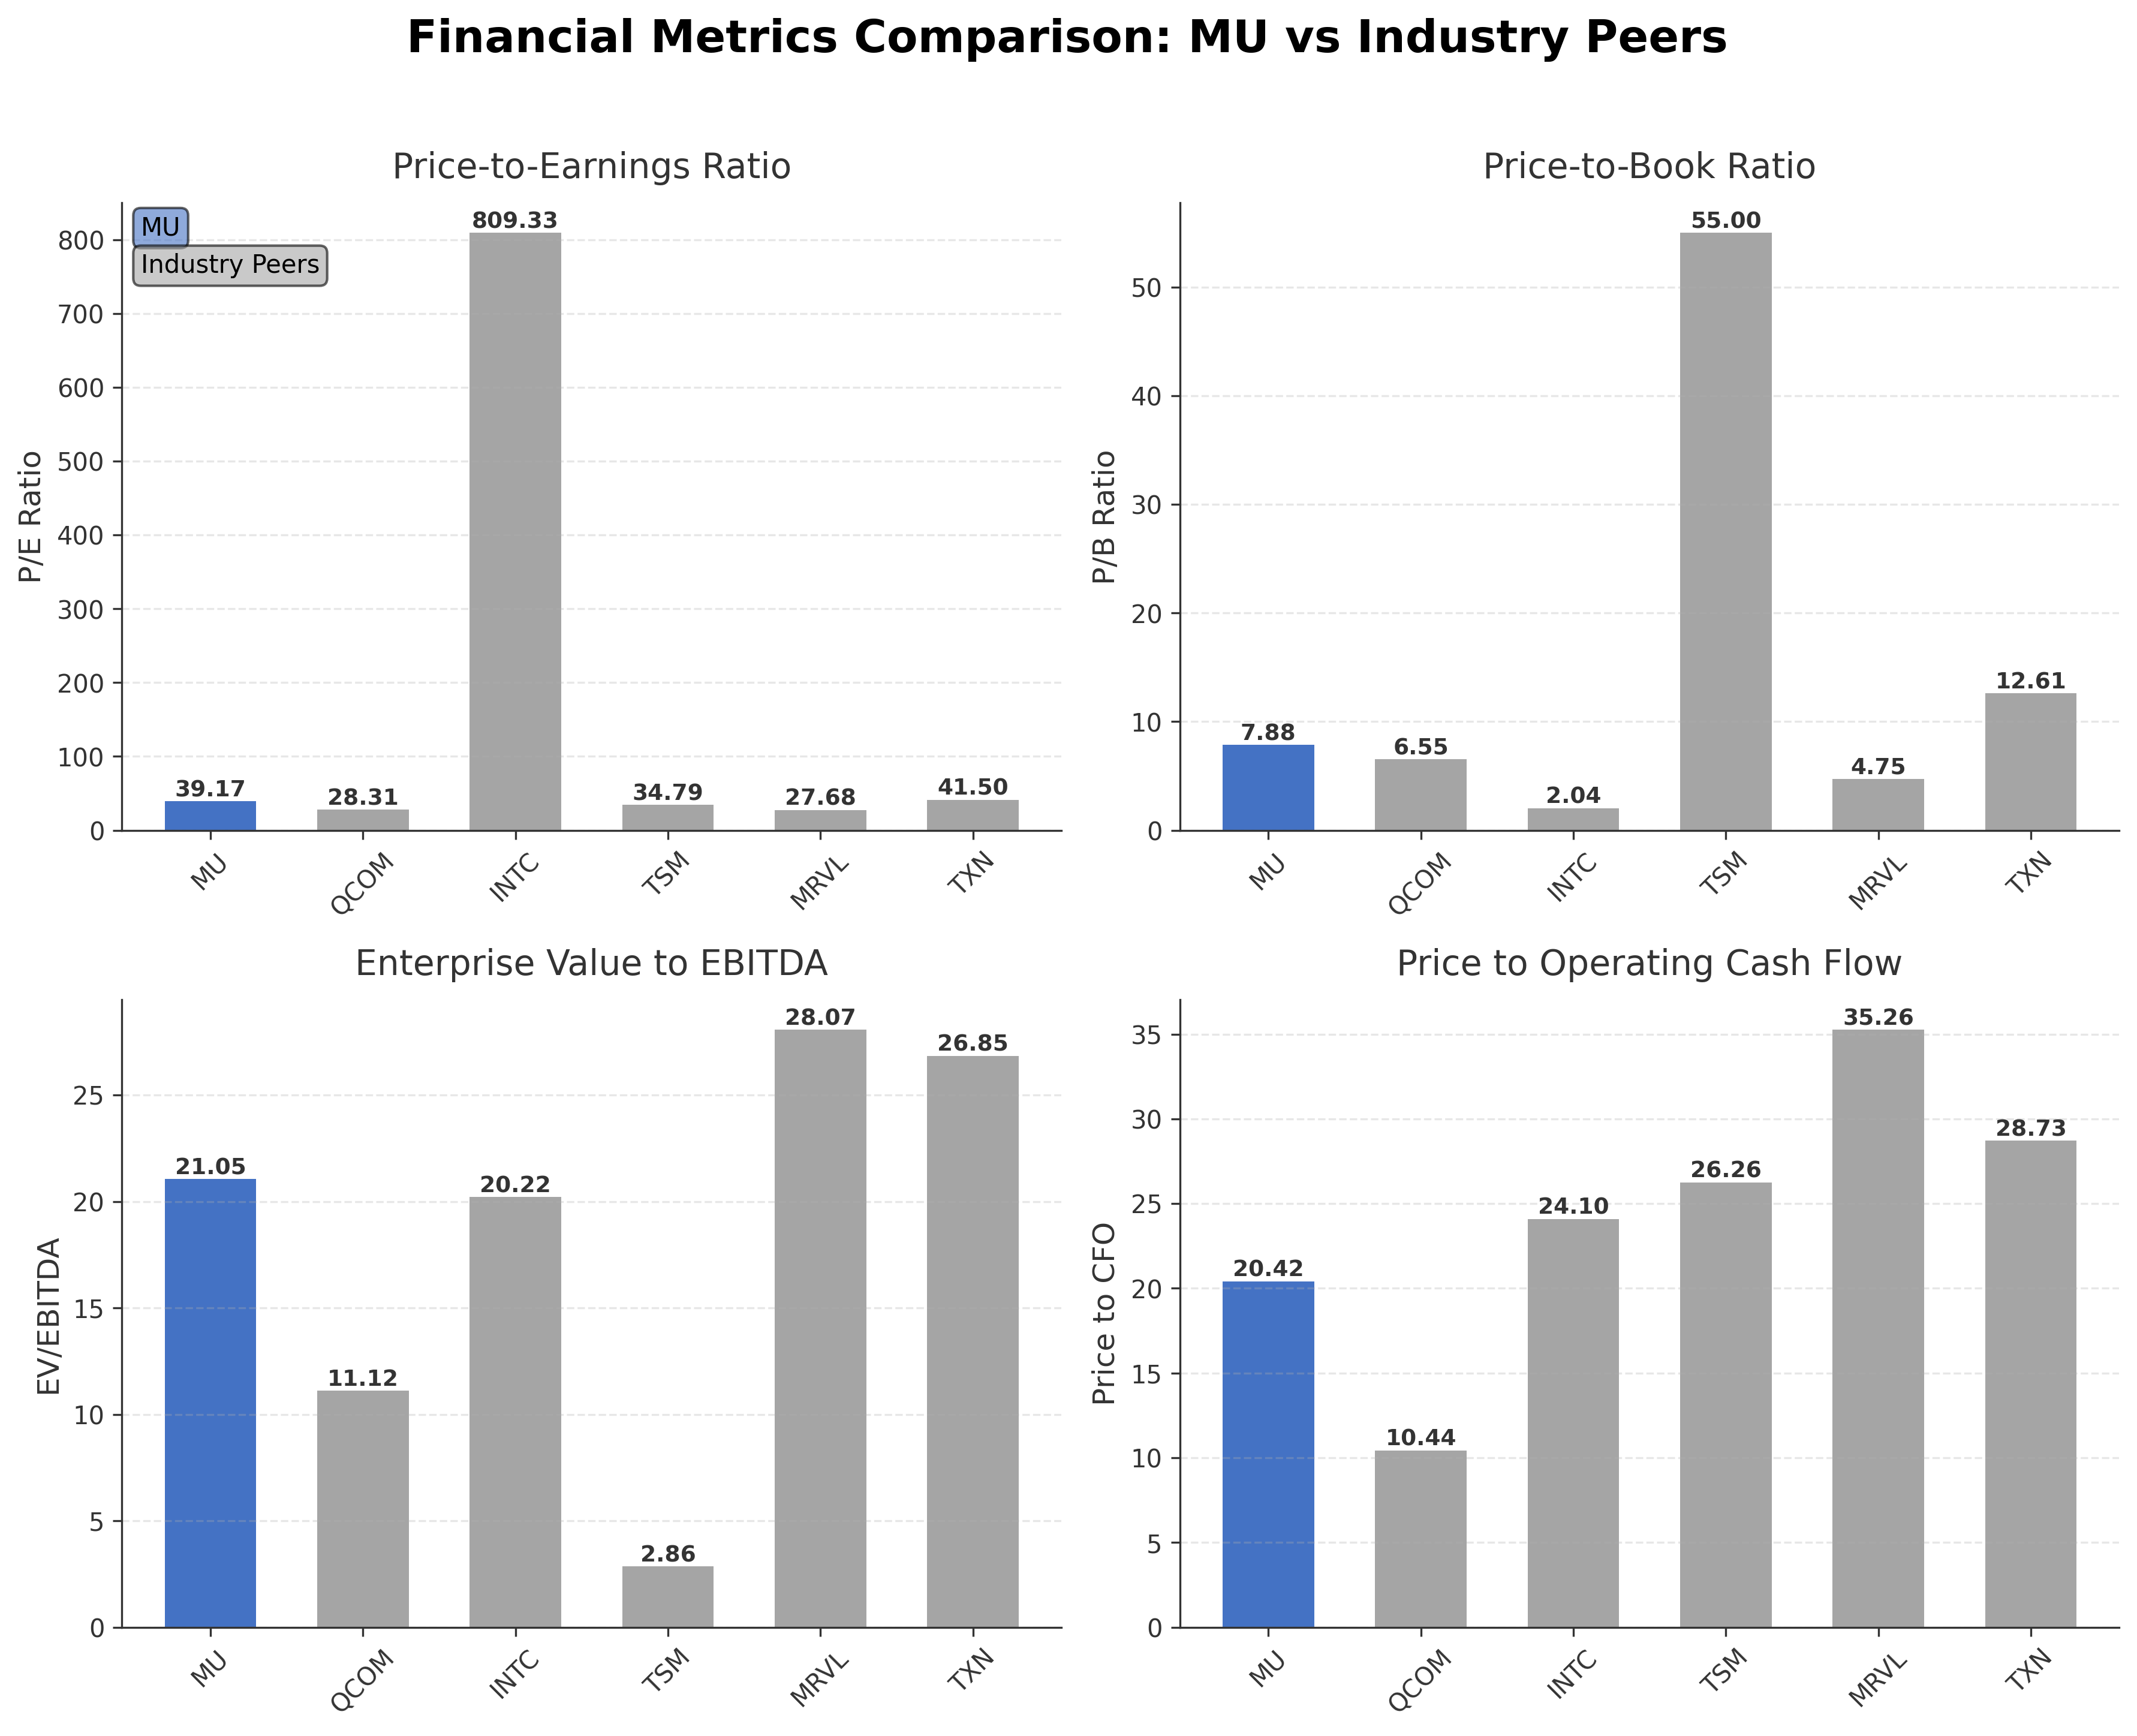
Peer Analysis
| Company Name | Market Cap | P/E Ratio | P/B Ratio | EV/EBITDA | Price to CFO |
|---|---|---|---|---|---|
| Micron Technology, Inc. | $463.33B | 39.17 | 7.88 | 21.05 | 20.42 |
| QUALCOMM Incorporated | $150.27B | 28.31 | 6.55 | 11.12 | 10.44 |
| Intel Corporation | $233.72B | 809.33 | 2.04 | 20.22 | 24.10 |
| Taiwan Semiconductor Manufacturing Co. Ltd. ADR | $1.90T | 34.79 | 55.00 | 2.86 | 26.26 |
| Marvell Technology, Inc. | $66.67B | 27.68 | 4.75 | 28.07 | 35.26 |
| Texas Instruments Inc | $205.49B | 41.50 | 12.61 | 26.85 | 28.73 |
Comparison Analysis: Micron Technology holds a substantial market capitalization of $463.33 billion, surpassing many regional semiconductor peers except for Taiwan Semiconductor Manufacturing. Its P/E ratio of 39.17 is higher than QUALCOMM and Marvell but significantly lower than Intel's elevated figure, reflecting varied earnings expectations. The price-to-book ratio at 7.88 is moderate compared to TSM's high valuation, indicating a balanced market view on asset value. Enterprise value to EBITDA and price to cash flow ratios place Micron competitively within the peer group, suggesting a solid valuation framework relative to growth and profitability metrics.
Financial Metrics Comparison with Peers
Financial Statements
Comprehensive financial data including income, balance sheet, and cash flow metrics
Income Statement
| fiscal_date | 2025-08-31 | 2024-08-31 | 2023-08-31 | 2022-08-31 | 2021-08-31 |
|---|---|---|---|---|---|
| Sales | 37.38B | 25.11B | 15.54B | 30.76B | 27.70B |
| Cost Of Goods | 22.50B | 19.50B | 16.96B | 16.86B | 17.28B |
| Gross Profit | 14.87B | 5.61B | -1.42B | 13.90B | 10.42B |
| Operating Expense Research And Development | 3.80B | 3.43B | 3.11B | 3.12B | 2.66B |
| Operating Expense Selling General And Administrative | 1.21B | 1.13B | 920.00M | 1.07B | 894.00M |
| Operating Expense Other Operating Expenses | 61.00M | -192.00M | 9.00M | 7.00M | 119.00M |
| Operating Income | 9.81B | 1.25B | -5.46B | 9.71B | 6.75B |
| Non Operating Interest Income | 496.00M | 529.00M | 468.00M | 96.00M | 37.00M |
| Non Operating Interest Expense | 477.00M | 562.00M | 388.00M | 189.00M | 183.00M |
| Other Income Expense | -174.00M | 27.00M | -279.00M | -45.00M | -383.00M |
| Pretax Income | 9.65B | 1.24B | -5.66B | 9.57B | 6.22B |
| Income Tax | 1.12B | 451.00M | 177.00M | 888.00M | 394.00M |
| Net Income | 8.54B | 778.00M | -5.83B | 8.69B | 5.86B |
| Eps Basic | 7.65 | 0.70 | -5.34 | 7.81 | 5.23 |
| Eps Diluted | 7.59 | 0.70 | -5.34 | 7.75 | 5.14 |
| Basic Shares Outstanding | 1.12B | 1.10B | 1.09B | 1.11B | 1.12B |
| Diluted Shares Outstanding | 1.12B | 1.10B | 1.09B | 1.11B | 1.12B |
| Ebit | 10.13B | 1.80B | -5.27B | 9.76B | 6.40B |
| Ebitda | 18.65B | 9.52B | 2.78B | 16.94B | 13.00B |
| Net Income Continuous Operations | 8.54B | 778.00M | -5.83B | 8.69B | 5.86B |
| Minority Interests | N/A | N/A | N/A | 0.00 | 0.00 |
Data provided by Twelve Data
Balance Sheet
| fiscal_date | 2025-11-30 | 2025-08-31 | 2025-05-31 | 2025-02-28 | 2024-11-30 |
|---|---|---|---|---|---|
| Cash And Cash Equivalents | 9.73B | 9.64B | 10.16B | 7.55B | 6.69B |
| Accounts Receivable | 8.01B | 7.16B | 5.49B | 5.09B | 6.25B |
| Total Assets | 85.97B | 82.80B | 78.40B | 73.05B | 71.46B |
| Total Liabilities | 27.16B | 28.63B | 27.65B | 24.42B | 24.66B |
| Long Term Debt | 11.86B | 14.72B | 15.60B | 14.45B | 13.84B |
| Shareholders Equity | 58.81B | 54.16B | 50.75B | 48.63B | 46.80B |
Data provided by Twelve Data
Cash Flow Statement
| fiscal_date | 2025-08-31 | 2024-08-31 | 2023-08-31 | 2022-08-31 | 2021-08-31 |
|---|---|---|---|---|---|
| Operating Activities Net Income | 8.54B | 778.00M | -5.83B | 8.69B | 5.86B |
| Operating Activities Depreciation | 8.35B | 7.78B | 7.76B | 7.12B | 6.21B |
| Operating Activities Stock Based Compensation | 972.00M | 833.00M | 596.00M | 514.00M | 378.00M |
| Operating Activities Other Non Cash Items | 328.00M | 281.00M | 19.00M | 119.00M | 384.00M |
| Operating Activities Accounts Receivable | -1.78B | -3.58B | 2.76B | 190.00M | -1.45B |
| Operating Activities Other Assets Liabilities | 248.00M | 501.00M | -4.37B | -1.78B | 816.00M |
| Operating Activities Operating Cash Flow | 16.66B | 6.59B | 929.00M | 14.85B | 12.21B |
| Investing Activities Purchase Of Investments | -1.89B | -2.00B | -723.00M | -1.77B | -3.16B |
| Investing Activities Sale Of Investments | 1.70B | 1.79B | 1.59B | 1.61B | 2.11B |
| Investing Activities Other Investing Activity | 1.96B | 282.00M | 617.00M | -251.00M | 498.00M |
| Investing Activities Investing Cash Flow | 1.77B | 77.00M | 1.49B | 482.00M | -559.00M |
| Financing Activities Long Term Debt Issuance | 4.43B | 999.00M | 6.72B | 2.00B | 1.19B |
| Financing Activities Long Term Debt Payments | -4.62B | -1.90B | -761.00M | -2.03B | -1.52B |
| Financing Activities Common Stock Repurchase | 0.00 | -300.00M | -425.00M | -2.43B | -1.20B |
| Financing Activities Common Dividends | -522.00M | -513.00M | -504.00M | -461.00M | 0.00 |
| Financing Activities Other Financing Charges | -139.00M | -131.00M | -43.00M | -55.00M | -249.00M |
| Financing Activities Financing Cash Flow | -850.00M | -1.84B | 4.98B | -2.98B | -1.78B |
| End Cash Position | 9.65B | 7.05B | 8.66B | 8.34B | 7.83B |
| Income Tax Paid | 583.00M | 338.00M | 532.00M | 493.00M | 361.00M |
| Interest Paid | 418.00M | 503.00M | 323.00M | 154.00M | 171.00M |
| Free Cash Flow | 1.67B | 121.00M | -6.12B | 3.11B | 2.44B |
| Investing Activities Net Acquisitions | N/A | 0.00 | 0.00 | 888.00M | 0.00 |
| Investing Activities Capital Expenditures | N/A | N/A | N/A | N/A | N/A |
Data provided by Twelve Data
Technical Analysis
Key Insights
- Micron Technology's current trend shows an upward momentum with the stock price trading above both the 50-day ($326.76) and 200-day ($191.01) moving averages, indicating sustained bullish price action.
- Key support levels are identified near $320 and $190, corresponding to the 50-day and 200-day moving averages respectively, while resistance is observed around the recent high near $455.
- The stock maintains a position above major moving averages, reinforcing a positive medium to long-term trend across daily and weekly timeframes.
- Momentum indicators reflect strength, with RSI levels indicating neither overbought nor oversold conditions, MACD showing bullish crossover patterns, and stochastic oscillators confirming upward momentum.
- Multi-timeframe analysis reveals consistent bullish signals on daily, weekly, and monthly charts, supporting the current positive price trajectory.
- Potential market scenarios include continuation of the upward trend if support levels hold, while a breach below key moving averages could signal consolidation or correction phases.
Trending News
1. Headline: Micron Technology, Inc. $MU Shares Purchased by Atria Investments Inc
Summary: Atria Investments Inc increased its holdings in Micron Technology by 26.0% during the third quarter, acquiring an additional 25,506 shares. This institutional buying reflects confidence in Micron's growth prospects amid a dynamic semiconductor market.
Sentiment: Positive
2. Headline: Aberdeen Group plc Sells 106,599 Shares of Micron Technology, Inc. $MU
Summary: Aberdeen Group plc reduced its stake in Micron Technology by 11.4% during the third quarter, selling 106,599 shares. This divestment indicates some institutional repositioning within the semiconductor sector.
Sentiment: Negative
3. Headline: Alps Advisors Inc. Invests $485,000 in Micron Technology, Inc. $MU
Summary: Alps Advisors Inc initiated a new position in Micron Technology by purchasing 2,900 shares valued at approximately $485,000 during the third quarter, signaling fresh institutional interest.
Sentiment: Neutral
4. Headline: Micron Stock Surges, Morgan Stanley Says There's More Room To Run - AOL
Summary: Micron Technology's stock price rose following Morgan Stanley's reiteration of an Overweight rating and an increased price target from $350 to $450, supported by strong DRAM pricing and supply dynamics.
Sentiment: Positive
5. Headline: Public Sector Pension Investment Board Boosts Position in Micron Technology, Inc. $MU
Summary: The Public Sector Pension Investment Board increased its holdings in Micron Technology by 51.9% during the third quarter, reflecting growing institutional confidence in the company's strategic direction.
Sentiment: Positive
Powered by Brave
Recent Updates
News Summary
Recent news highlights Micron Technology's prominent role amid intensifying DRAM shortages and rising AI-driven memory demand, positioning the company favorably within the semiconductor sector. Institutional activity shows mixed sentiment with some investors increasing stakes while others reduce exposure, reflecting nuanced market perspectives. Strategic announcements include early shipping of HBM4 memory products and continued supply constraints expected through 2026. These developments underscore Micron's operational focus on capitalizing on AI infrastructure growth and navigating supply chain challenges. Market sentiment remains cautiously optimistic, supported by positive analyst coverage and sector momentum.
News Sentiment
Overall sentiment across recent news is moderately positive, with institutional buying and analyst upgrades balancing some cautious views on supply and demand dynamics. Positive coverage emphasizes growth opportunities in AI memory demand and product innovation, while neutral and negative sentiments relate to institutional repositioning and market volatility. This mixed but constructive sentiment environment suggests attentive monitoring of supply trends and capital expenditure impacts.
Analytical Overview
Analysis Summary
Valuation Metrics: Micron's trailing P/E of 39.17 is aligned with the semiconductor industry average of 39.17, while its forward P/E of 9.48 suggests anticipated earnings growth relative to peers. The PEG ratio of 0.22 indicates potential undervaluation considering expected growth rates.
Growth Trajectory: The company exhibits strong revenue growth at 56.7% quarterly and robust earnings growth year-over-year at 180.2%, supported by expanding demand for memory products in AI and data centers. Operating cash flow remains healthy at approximately $22.7 billion, indicating solid cash generation.
Financial Health: Micron maintains a current ratio of 2.46, reflecting good short-term liquidity, and a manageable debt-to-equity ratio of 21.24, suggesting prudent leverage. Total cash holdings exceed $10 billion, supporting operational flexibility and capital investments.
Sector Specific Factors: The semiconductor sector faces cyclical supply constraints and rapid technological evolution, with AI-driven memory demand presenting significant growth opportunities. However, supply chain disruptions and competitive pressures remain challenges to monitor.
Market Positioning: Micron's strong market position, innovation in advanced memory technologies, and broad geographic footprint provide competitive advantages within the global semiconductor industry.
Investment Conclusion
Supporting Factors: Robust revenue and earnings growth driven by AI and data center demand.
Risk Factors: Volatility in semiconductor supply chains and market demand cycles.
SWOT Analysis
Strengths
- Leading global position in memory and storage semiconductor products.
- Strong revenue growth supported by AI and data center market demand.
- Robust liquidity with over $10 billion in cash and a healthy current ratio.
- Innovative product portfolio including advanced memory technologies like HBM4.
Weaknesses
- Relatively high trailing P/E ratio compared to some industry peers.
- Dependence on cyclical semiconductor market dynamics.
- Limited insider ownership which may affect alignment of interests.
- Moderate debt levels requiring ongoing management.
Opportunities
- Expanding demand for AI infrastructure and high-performance memory.
- Potential to capitalize on supply shortages in DRAM and NAND markets.
- Growth in automotive and embedded semiconductor applications.
- Strategic partnerships and technological advancements enhancing market share.
Threats
- Supply chain disruptions impacting production and delivery.
- Intense competition from global semiconductor manufacturers.
- Rapid technological changes requiring continuous innovation.
- Regulatory and geopolitical risks affecting global operations.
Company Description
Micron Technology, Inc. is one of the world's largest semiconductor companies, specializing in the design, development, manufacture, and sale of memory and storage products. Its primary revenue derives from dynamic random access memory (DRAM) components and modules, with additional exposure to NAND flash chips. The company operates through key segments including the Cloud Memory Business Unit, Core Data Center Business Unit, Mobile and Client Business Unit, and Automotive and Embedded Business Unit, serving diverse markets such as data centers, mobile devices, consumer electronics, automotive, and industrial applications. Vertically integrated for efficiency, Micron provides innovative solutions like CXL-based memory, LPDDR, and graphics memory, supporting global customers across the United States, Taiwan, Singapore, Japan, Malaysia, China, India, and beyond. Headquartered in Boise, Idaho, with approximately 53,000 employees, Micron plays a pivotal role in the semiconductor industry, particularly amid rising demand from artificial intelligence and data center expansions. In fiscal 2025, it reported revenue of $37.38 billion, reflecting substantial growth.