
Mercedes-Benz Group AG (MBG)
Stock Analysis Report
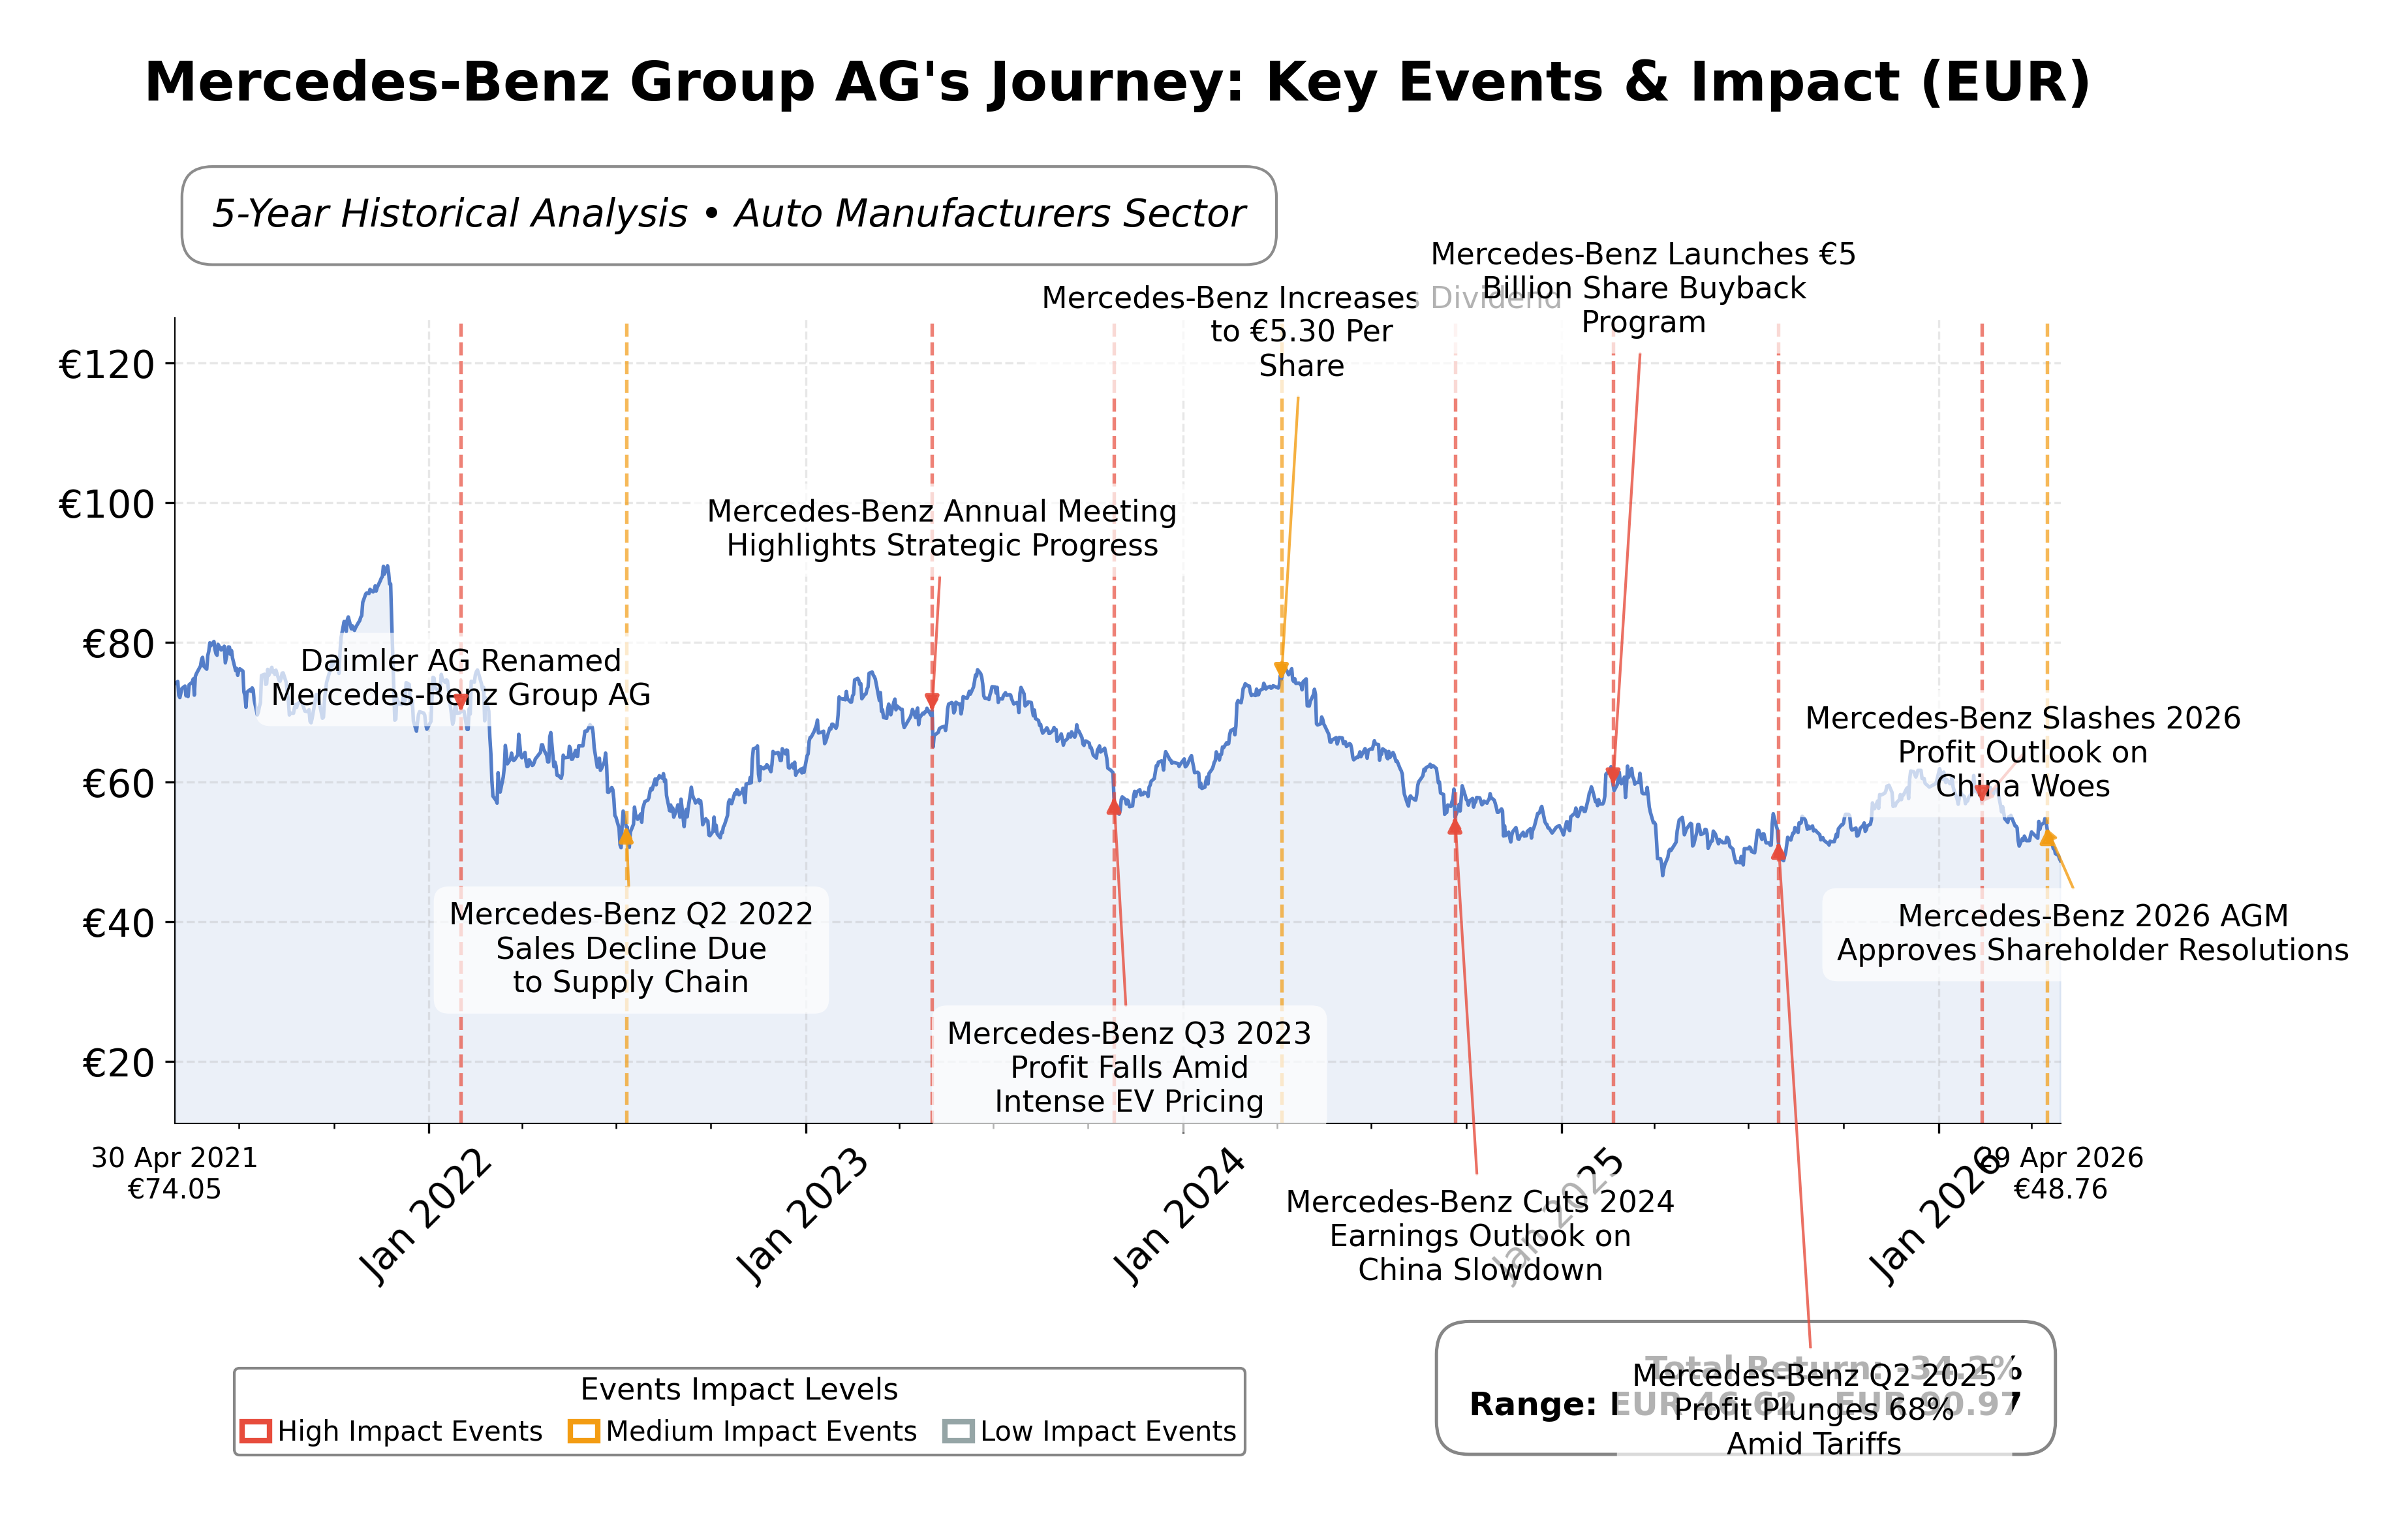
Stock Journey
Key Positives and Key Risks
Pros
- Trailing P/E ratio of 9.18 and forward P/E of 6.34 indicate valuation below industry average, suggesting potential undervaluation.
- Strong operating cash flow of approximately €18 billion TTM supports liquidity and operational stability.
- Robust equity base of around €94.2 billion with an equity ratio of 35.5% provides financial resilience.
Cons
- High total debt of approximately €100.3 billion with a debt-to-equity ratio over 100% raises leverage concerns.
- Negative quarterly revenue growth of -12.4% and a 17% decline in Q1 net profit highlight recent operational challenges.
- Slightly negative free cash flow of -€1.04 billion TTM indicates cash generation pressures.
Disclosure: This information is for general awareness and does not constitute investment advice
Report Summary
Mercedes-Benz Group AG is a leading German multinational automotive company listed on the XETR exchange, operating within the Consumer Cyclical sector and specifically the Auto Manufacturers industry. The company is renowned for its premium passenger cars and vans, including luxury marques such as Mercedes-Benz, Mercedes-AMG, and Mercedes-Maybach. It also provides financial services through Mercedes-Benz Mobility. With a global footprint spanning production in 17 countries and sales across over 180 markets, Mercedes-Benz Group maintains a strong market position in the luxury automotive segment.
The company reported trailing twelve months (TTM) revenue of approximately €132.2 billion, with a gross margin of 15.79%, operating margin of 10.76%, and net profit margin of 3.89%. Return on equity (ROE) stands at 5.68%, return on assets (ROA) at 1.67%, and return on invested capital (ROIC) is reflected in an EV/EBITDA ratio of 11.7, indicating moderate profitability and operational efficiency. However, quarterly revenue growth was negative at -12.4%, and quarterly earnings declined by 44.6% year-over-year, signaling recent challenges.
Valuation metrics show a trailing price-to-earnings (P/E) ratio of 9.18 and a forward P/E of 6.34, with a price-to-book (P/B) ratio of 0.50 and an enterprise value to EBITDA (EV/EBITDA) of 11.7. The market capitalization is approximately €43.14 billion. The stock price currently trades at €48.59, near its 52-week low of €47.40 and below the 52-week high of €62.34, suggesting the stock is priced at a discount relative to its recent peak, reflecting market caution.
Key strengths include solid operating cash flow of €18 billion TTM, a strong equity base with total shareholders’ equity around €94.2 billion, and a diversified product portfolio with ongoing new model launches. Risks involve intensifying competition in key markets such as China, as evidenced by a 17% decline in Q1 profit due to sales pressure, and high total debt of approximately €100.3 billion, with a debt-to-equity ratio exceeding 100%. Recent strategic actions include restructuring of retail operations in Germany and product launches including new S-Class and Maybach models.
Technically, the stock is trading below its 50-day and 200-day moving averages, with momentum indicators showing mixed signals across daily and weekly timeframes. Recent news highlights both earnings beats and profit pressures, especially from the Chinese market. Overall, the data suggests a cautious stance with potential for accumulation if operational challenges are addressed, while monitoring competitive and macroeconomic developments remains prudent.
Company and Industry Overview
Company Basics
Price Performance
Company Size
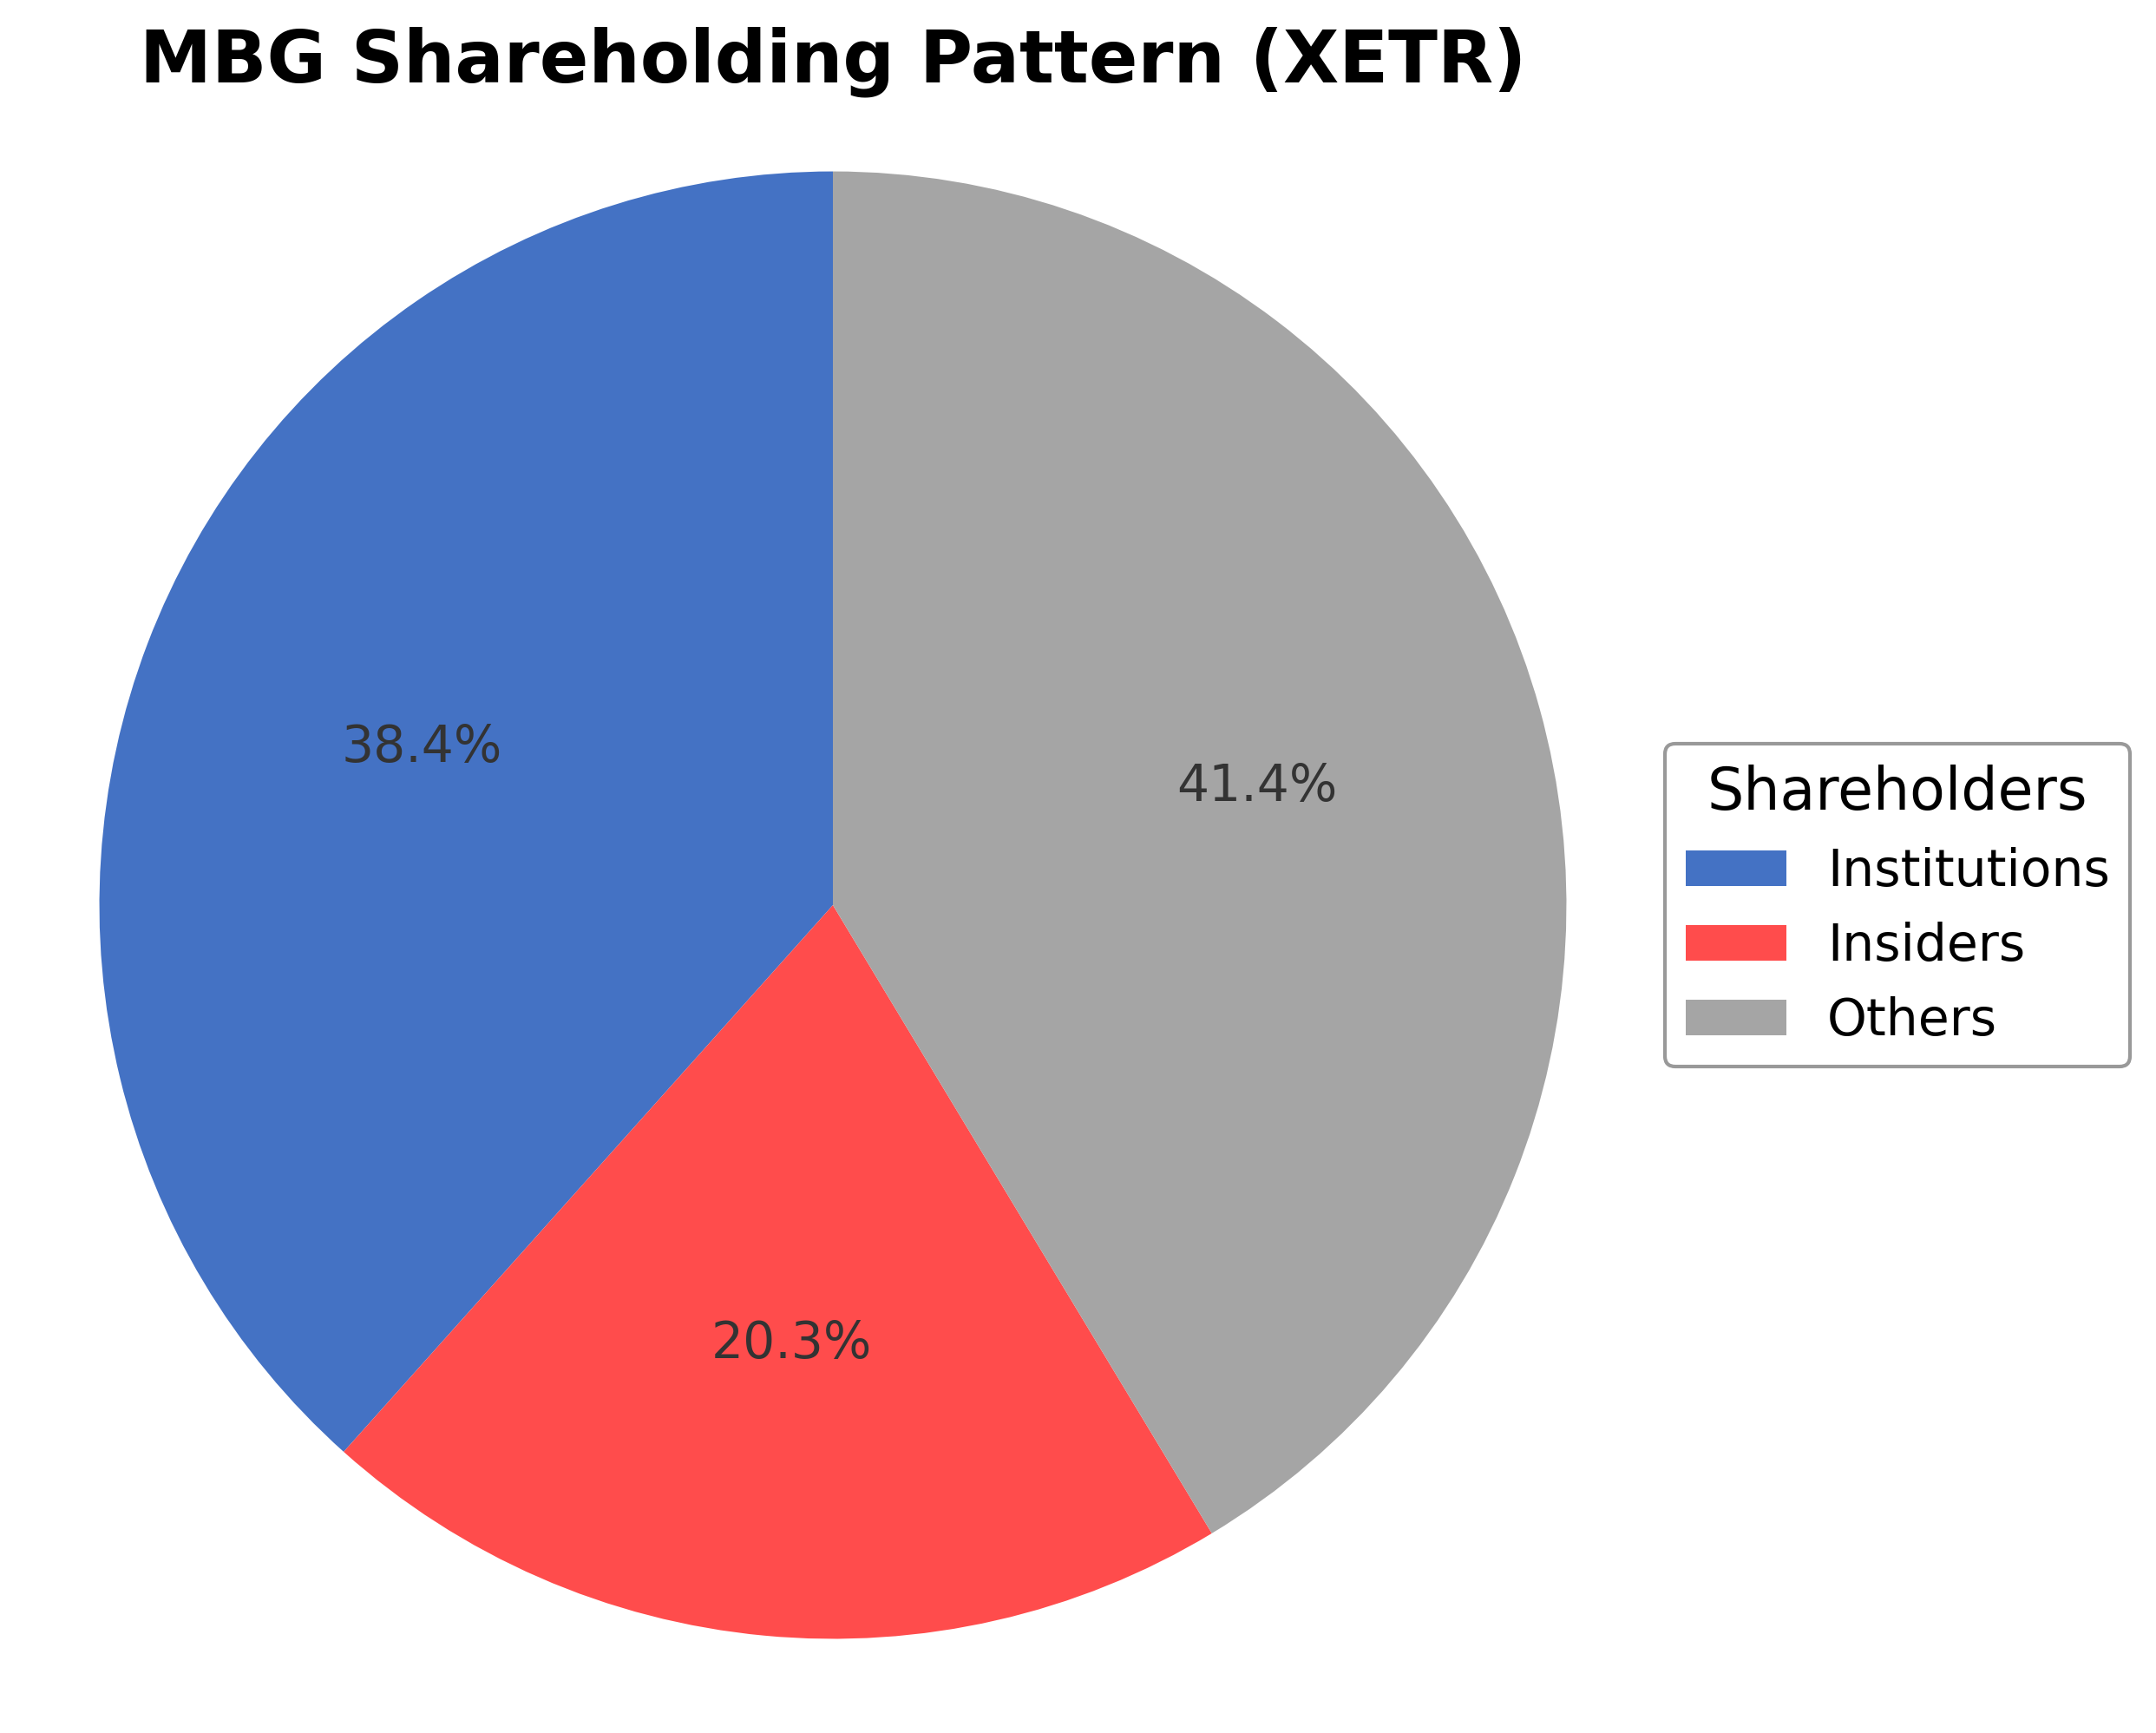
Shareholding Pattern
Sector and Industry Analysis
The global automotive sector generated approximately $1.7 trillion in revenue in 2022, with passenger cars constituting the largest segment. Key players include Toyota, Ford, Volkswagen, and Mercedes-Benz, which held a 4.55% market share by revenue. The sector is characterized by significant revenue contributions from SUVs and executive cars, with Mercedes-Benz deriving 46% of its revenue from SUVs and 21% from executive cars.
Industry dynamics are shaped by a transition toward software-defined luxury vehicles and electrification, driving innovation and competitive repositioning. Operational challenges, such as the 57.2% EBIT decline reported by Mercedes-Benz in FY25, highlight pressures on profitability amid evolving consumer preferences and supply chain constraints. Barriers to entry remain high due to capital intensity, technological complexity, and brand equity requirements, favoring established incumbents with strong balance sheets.
Regulatory frameworks increasingly emphasize emissions reduction and safety standards, accelerating the shift to electric and hybrid vehicles. Compliance with stringent European and global environmental regulations impacts product development and capital allocation decisions. The outlook suggests ongoing regulatory tightening, necessitating continuous innovation and adaptation by automotive manufacturers to maintain market relevance.
Note: Analysis synthesized from industry research, market reports, and regulatory filings. Information is subject to change based on market conditions.
Financial Ratios Dashboard
Financials
Peer Analysis
| Company Name | Market Cap | P/E Ratio | P/B Ratio | EV/EBITDA | Price to CFO |
|---|---|---|---|---|---|
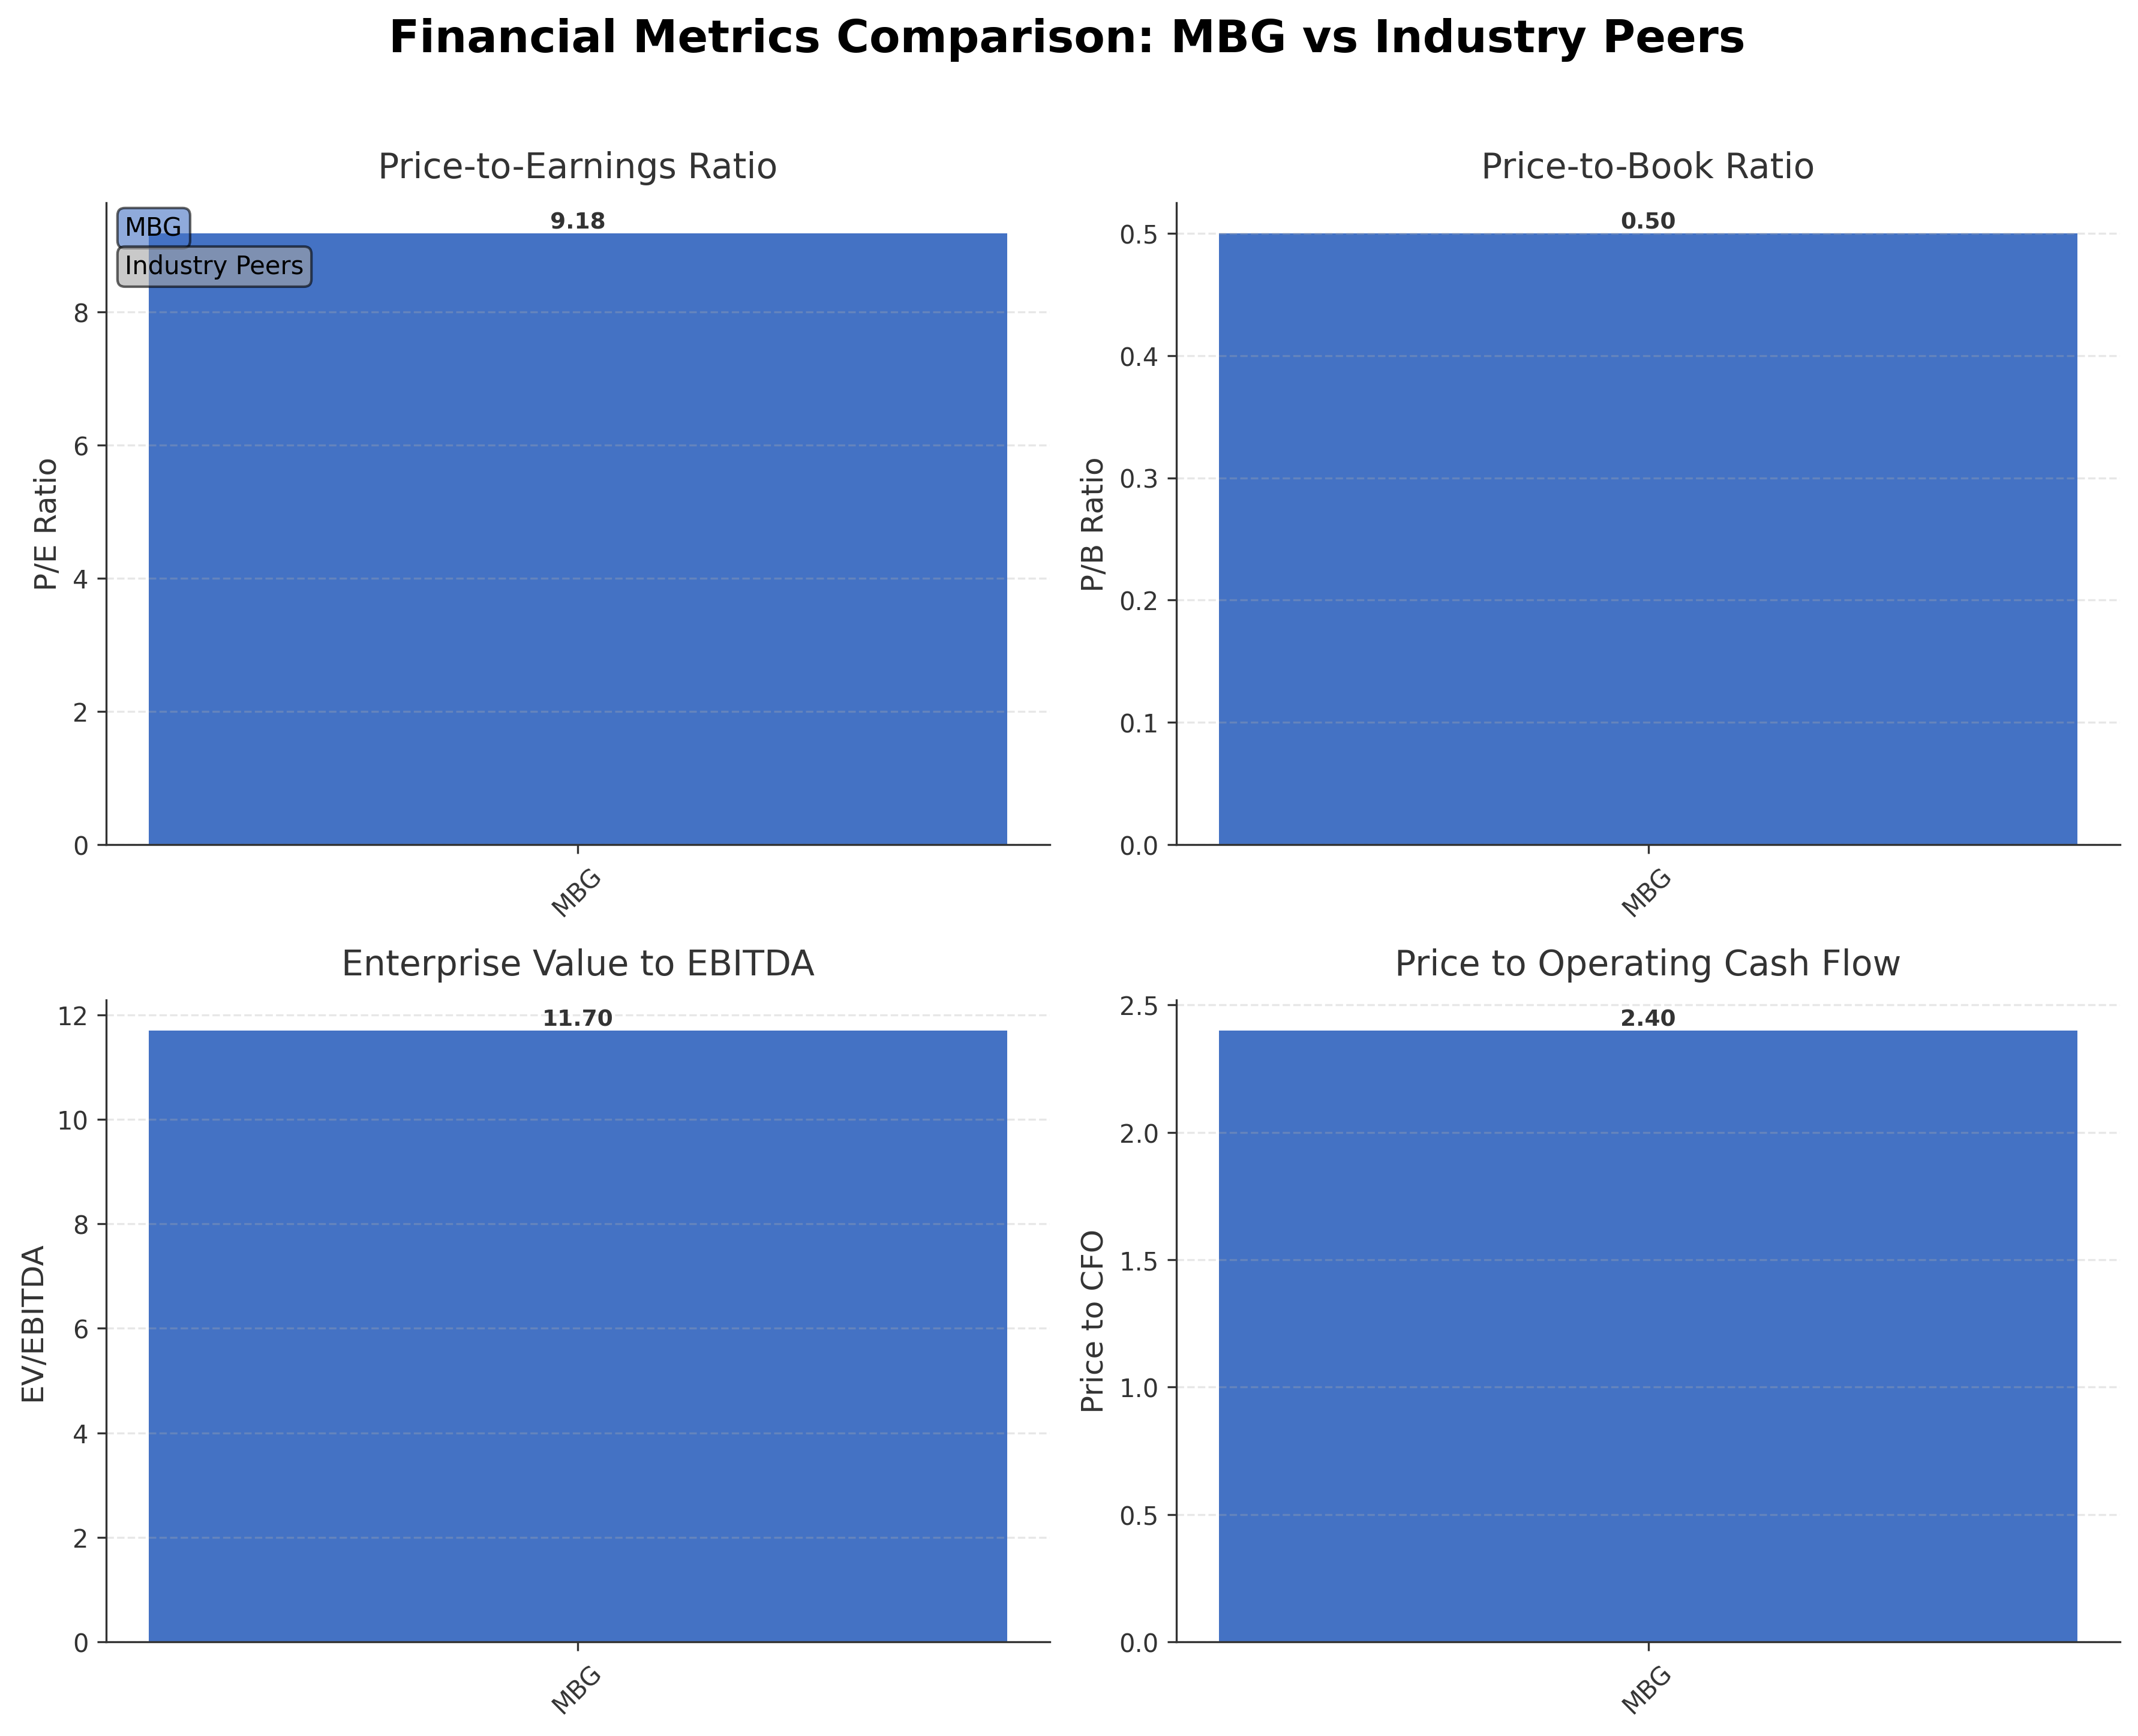
| Mercedes-Benz Group AG | €43.14B | 9.18 | 0.50 | 11.70 | 2.40 |
Comparison Analysis: Mercedes-Benz Group AG currently lacks listed direct peers in the provided dataset for comparison. However, its valuation metrics such as a trailing P/E of 9.18 and P/B of 0.50 indicate a relatively low valuation compared to typical luxury automotive peers. The EV/EBITDA ratio of 11.7 suggests moderate enterprise valuation relative to earnings before interest, taxes, depreciation, and amortization. Return on equity is low at 0.06%, reflecting recent profitability pressures. Overall, Mercedes-Benz’s financial metrics position it as a competitively valued player within the premium auto manufacturing sector.
Financial Metrics Comparison with Peers
Financial Statements
Comprehensive financial data including income, balance sheet, and cash flow metrics
Income Statement
| fiscal_date | 2025-12-31 | 2024-12-31 | 2023-12-31 | 2022-12-31 | 2021-12-31 |
|---|---|---|---|---|---|
| Sales | 132.21B | 145.59B | 153.22B | 150.02B | 133.89B |
| Cost Of Goods | 109.88B | 117.02B | 118.84B | 116.00B | 103.22B |
| Gross Profit | 22.33B | 28.58B | 34.38B | 34.02B | 30.68B |
| Operating Expense Research And Development | 6.05B | 5.58B | 6.23B | 5.60B | 5.47B |
| Operating Expense Selling General And Administrative | 12.20B | 12.52B | 12.42B | 12.07B | 12.00B |
| Operating Expense Other Operating Expenses | 508.00M | 345.00M | 249.00M | 937.00M | 783.00M |
| Operating Income | 4.87B | 12.30B | 17.52B | 17.88B | 14.98B |
| Non Operating Interest Income | 623.00M | 738.00M | 678.00M | 818.00M | 307.00M |
| Non Operating Interest Expense | 398.00M | 586.00M | 691.00M | 427.00M | 429.00M |
| Pretax Income | 6.28B | 14.15B | 20.08B | 20.30B | 15.81B |
| Income Tax | 953.00M | 3.74B | 5.55B | 5.50B | 4.76B |
| Net Income | 5.33B | 10.41B | 14.53B | 14.81B | 23.40B |
| Ebit | 6.68B | 14.73B | 20.77B | 20.73B | 16.24B |
| Ebitda | 14.05B | 21.34B | 27.50B | 26.90B | 23.91B |
| Net Income Continuous Operations | 6.28B | 14.15B | 20.08B | 20.30B | 28.77B |
| Minority Interests | -190.00M | -202.00M | -270.00M | -308.00M | -390.00M |
| Preferred Stock Dividends | 0.00 | 0.00 | 0.00 | 0.00 | 0.00 |
| Eps Basic | N/A | 10.19 | 13.46 | 13.55 | 21.50 |
| Eps Diluted | N/A | 10.19 | 13.46 | 13.55 | 21.50 |
| Basic Shares Outstanding | N/A | 1.00B | 1.06B | 1.07B | 1.07B |
| Diluted Shares Outstanding | N/A | 1.00B | 1.06B | 1.07B | 1.07B |
Source: Financial statements and regulatory filings
Balance Sheet
| fiscal_date | 2025-12-31 | 2024-12-31 | 2023-12-31 | 2022-12-31 | 2021-12-31 |
|---|---|---|---|---|---|
| Cash And Cash Equivalents | 12.25B | 14.51B | 15.96B | 17.68B | 23.12B |
| Accounts Receivable | 34.48B | 39.86B | 39.12B | 38.49B | 33.86B |
| Total Assets | 255.47B | 265.01B | 263.02B | 260.01B | 259.83B |
| Total Liabilities | 161.23B | 171.38B | 170.21B | 173.47B | 186.66B |
| Long Term Debt | 53.01B | 62.59B | 55.09B | 51.59B | 62.68B |
| Shareholders Equity | 94.24B | 93.63B | 92.82B | 86.54B | 73.17B |
Source: Financial statements and regulatory filings
Cash Flow Statement
| fiscal_date | 2025-12-31 | 2024-12-31 | 2023-12-31 | 2022-12-31 | 2021-12-31 |
|---|---|---|---|---|---|
| Operating Activities Net Income | 6.28B | 14.15B | 20.08B | 20.30B | 28.77B |
| Operating Activities Other Non Cash Items | -1.20B | -1.36B | -2.37B | -1.30B | -11.50B |
| Operating Activities Accounts Receivable | 1.77B | 170.00M | -6.45B | -1.52B | 5.31B |
| Operating Activities Other Assets Liabilities | 3.29B | 534.00M | -286.00M | -3.08B | -2.03B |
| Operating Activities Operating Cash Flow | 10.14B | 13.49B | 10.98B | 14.41B | 20.55B |
| Investing Activities Capital Expenditures | -5.29B | -3.85B | -3.46B | -3.01B | -3.75B |
| Investing Activities Net Intangibles | -4.26B | -4.63B | -4.47B | -3.42B | -2.74B |
| Investing Activities Net Acquisitions | 109.00M | 353.00M | 278.00M | 2.49B | -5.27B |
| Investing Activities Purchase Of Investments | -12.30B | -6.79B | -4.71B | -2.62B | -5.69B |
| Investing Activities Sale Of Investments | 12.56B | 6.16B | 5.02B | 3.08B | 4.38B |
| Investing Activities Other Investing Activity | -12.00M | -1.00M | 28.00M | 27.00M | -7.00M |
| Investing Activities Investing Cash Flow | -4.94B | -4.12B | -2.85B | -35.00M | -10.34B |
| Financing Activities Common Stock Repurchase | -360.00M | -4.92B | -1.94B | -48.00M | -48.00M |
| Financing Activities Common Dividends | -4.14B | -5.49B | -5.56B | -5.35B | -1.44B |
| Financing Activities Other Financing Charges | -5.77B | -106.00M | -570.00M | -13.31B | -17.25B |
| Financing Activities Financing Cash Flow | -10.27B | -10.51B | -8.76B | -32.06B | -35.91B |
| End Cash Position | 12.28B | 14.52B | 15.97B | 17.68B | 23.18B |
| Free Cash Flow | 8.26B | 9.07B | 6.26B | 9.99B | 17.23B |
| Financing Activities Long Term Debt Issuance | N/A | N/A | 39.29B | 38.43B | 42.20B |
| Financing Activities Long Term Debt Payments | N/A | N/A | -39.47B | -51.95B | -60.86B |
| Financing Activities Short Term Debt Issuance | N/A | N/A | -512.00M | 172.00M | 1.46B |
| Financing Activities Common Stock Issuance | N/A | N/A | N/A | N/A | 36.00M |
Source: Financial statements and regulatory filings
Technical Analysis
Key Insights
- Current trend shows the stock trading below both the 50-day (€54.17) and 200-day (€55.57) moving averages, indicating a bearish short-to-medium term momentum.
- Key support levels are near the 52-week low at approximately €47.40, while resistance is observed around the 52-week high of €62.34 and the 50-day moving average near €54.17.
- The price remains below the 10-day moving average, reinforcing short-term downward pressure.
- Momentum indicators such as RSI are in a neutral to slightly oversold range, MACD shows bearish crossover signals, and Stochastic oscillators suggest limited upward momentum.
- Multi-timeframe analysis reveals consistent weakness on daily and weekly charts, while monthly charts indicate a longer-term consolidation phase.
- Potential market scenarios include a continuation of the current downtrend if support near €47.40 fails, or a rebound attempt if the stock can reclaim the 50-day moving average, with volatility expected amid mixed earnings news.
Trending News
1. Headline: Why UBS Group AG Shares Are Sliding Today - TipRanks.com
Summary: UBS Group AG ( ($CH:UBSG) ) is experiencing volatility. Read on for a possible explanation for the stock’s unusual movement. UBS Group AG shares came under pressure...
Sentiment: negative
2. Headline: Earnings call transcript: Mercedes-Benz highlights Q1 2026 gains amid stock drop By Investing.com
Summary: Earnings call transcript: Mercedes-Benz highlights Q1 2026 gains amid stock drop
Sentiment: positive
3. Headline: Mercedes-Benz Group AG (MBGAF) Reports Strong Q1 Earnings, EPS Beats Expectations
Summary: On April 29, 2026, Mercedes-Benz Group AG (OTCPK: MBGAF) announced its first-quarter results, showcasing a mixed performance amid challenging market conditions.
Sentiment: positive
Summary: El beneficio del primer trimestre de Mercedes-Benz cae un 17% por el desplome de las ventas en China
Sentiment: neutral
5. Headline: Mercedes-Benz profit slides amid cutthroat Chinese market - Digital Journal
Summary: Like other carmakers, Mercedes is struggling to compete with low-cost competitors in China - Copyright AFP CHARLY TRIBALLEAUGerman premium automaker Mercedes-Benz said Wednesday its first-quarter profit fell by almost a fifth as cutthroat competition in China shakes the world’s carmakers.
Sentiment: negative
Recent Updates
News Summary
As of April 29, 2026. Mercedes-Benz Group AG reported Q1 2026 revenue of €31.6 billion, down 5% year-over-year primarily due to adverse exchange rate effects. Net profit declined 17% to €1.43 billion, reflecting competitive pressures, especially in China. Free cash flow of the industrial business was €1.86 billion, a 21% decrease compared to the prior year. The company completed several retail sales initiatives in Germany and progressed with the sale of the Athlon Group. Significant product launches included new models of the S-Class, Maybach S-Class, GLE, GLS, VLE, and C-Class. EBIT fell 17% to €1.9 billion, with adjusted EBIT down 30%. Despite these challenges, net liquidity improved by 5% to €33.8 billion, and equity rose to €95.2 billion with a 35.5% equity ratio. Investments in property, plant, and equipment increased 9% to €749 million, while R&D expenditure decreased by 3% to €2.25 billion. The outlook for 2026 anticipates revenue at prior-year levels and EBIT significantly above last year, with adjusted returns on sales and equity expected to remain stable across business units.
News Sentiment
The recent updates convey a cautiously optimistic sentiment grounded in solid operational cash flow and liquidity improvements despite profit declines. Positive factors include successful product launches and strategic retail restructuring, which support future growth. However, the 17% drop in net profit and a 21% decrease in free cash flow reflect ongoing challenges from competitive pressures and currency effects. The mixed earnings performance and cautious guidance temper enthusiasm, indicating a balanced outlook with attention to market and operational risks. Overall, the sentiment reflects resilience amid headwinds, with strategic initiatives aimed at stabilizing profitability.
Source List
Analytical Overview
Analysis Summary
Mercedes-Benz Group AG’s valuation metrics, including a trailing P/E of 9.18 and forward P/E of 6.34, are below the industry average P/E of 9.18, indicating the stock is trading at a discount relative to peers. The PEG ratio of 6.34 suggests modest growth expectations relative to earnings. Revenue growth has been negative at -12.4% quarterly, and free cash flow is slightly negative, reflecting recent operational challenges, but operating cash flow remains strong at €18 billion TTM. The company’s financial health shows a high debt-to-equity ratio of 106.4%, which may pressure leverage, although liquidity remains robust with €17.1 billion in cash. Sector-specific challenges include intense competition in China and tariff pressures, while opportunities arise from new product launches and electrification initiatives. Market positioning as a premium brand with global reach supports competitive advantages.
Overall Business and Market Assessment
Supporting Factors: strong operating cash flow, solid liquidity, and ongoing product innovation with new model launches
Risk Factors: high leverage, profit margin pressure from competitive markets, especially China, and currency headwinds
SWOT Analysis
Strengths
- Strong global brand recognition in the premium automotive segment.
- Robust operating cash flow of approximately €18 billion TTM.
- Diversified product portfolio including luxury cars, vans, and financial services.
- Extensive global production and sales network across 17 countries.
Weaknesses
- High total debt of over €100 billion with a debt-to-equity ratio exceeding 100%.
- Negative quarterly revenue growth of -12.4% indicating recent sales challenges.
- Declining net profit margins with a 17% drop in Q1 2026 profit.
- Free cash flow is slightly negative, reflecting operational pressures.
Opportunities
- Expansion of electrified vehicle offerings and sustainable mobility solutions.
- New product launches including updated S-Class and Maybach models.
- Restructuring of retail operations to improve sales efficiency.
- Potential growth in financial services and mobility solutions segments.
Threats
- Intense competition in key markets such as China impacting profitability.
- Rising raw material costs and tariff pressures affecting margins.
- Currency exchange rate volatility influencing revenue and profit.
- Regulatory changes and evolving emission standards increasing compliance costs.
Company Description
Mercedes-Benz Group AG is a German multinational automotive company headquartered in Stuttgart, Baden-Württemberg, renowned as one of the world's leading manufacturers of premium passenger cars and vans. Formed in 1926 through the merger of Benz & Cie. and Daimler Motoren Gesellschaft, it has evolved from Daimler-Benz, experiencing name changes like DaimlerChrysler and Daimler before rebranding to Mercedes-Benz Group in 2022 following the spin-off of its commercial truck division into Daimler Truck. The company operates through key segments: Mercedes-Benz Cars, featuring luxury marques such as Mercedes-Benz, Mercedes-AMG for high-performance vehicles, and Mercedes-Maybach; Mercedes-Benz Vans for commercial vans; and Mercedes-Benz Mobility, providing financial services, vehicle financing, ride-hailing, and charging solutions. With a global network of production plants across 17 countries and sales in over 180 markets, it holds stakes in entities like Daimler Truck, BAIC Motor, and Aston Martin. In 2023, Mercedes-Benz Group ranked among the top global carmakers by revenue, emphasizing innovation in safety features, electric vehicles, and sustainable mobility while maintaining its legacy of engineering excellence.