
MercadoLibre, Inc (MELI)
Stock Analysis Report
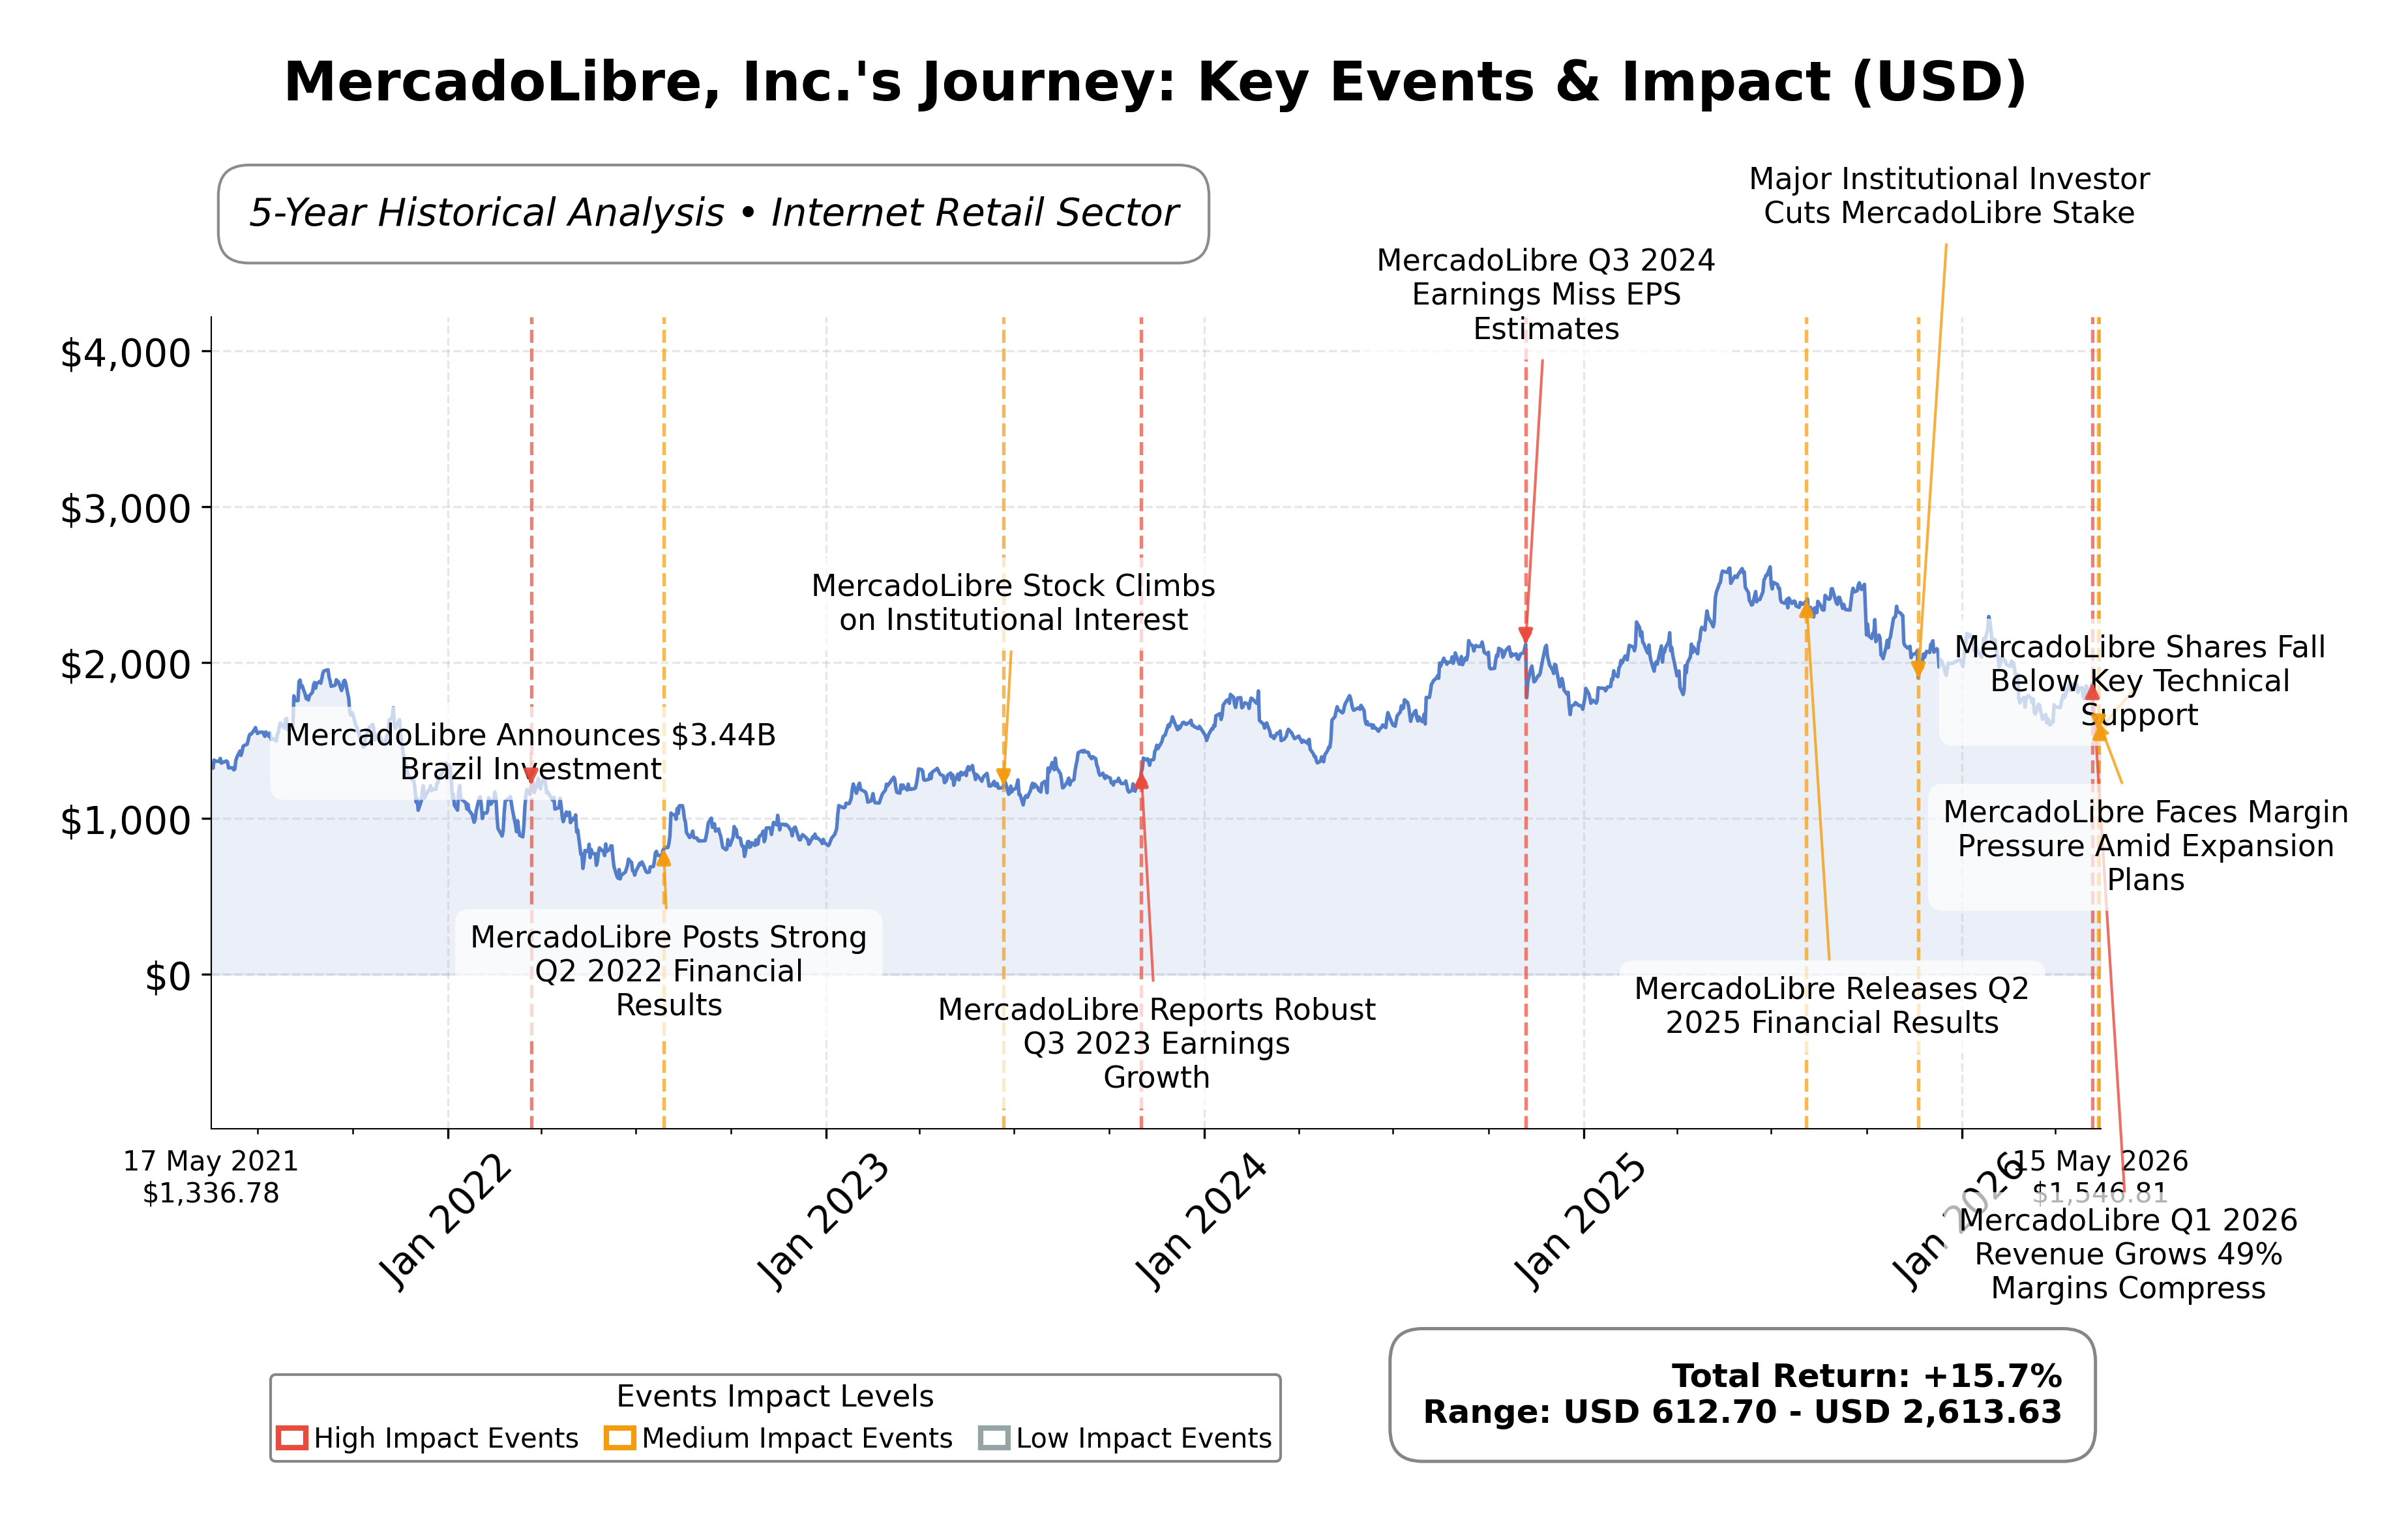
Stock Journey
Key Positives and Key Risks
Pros
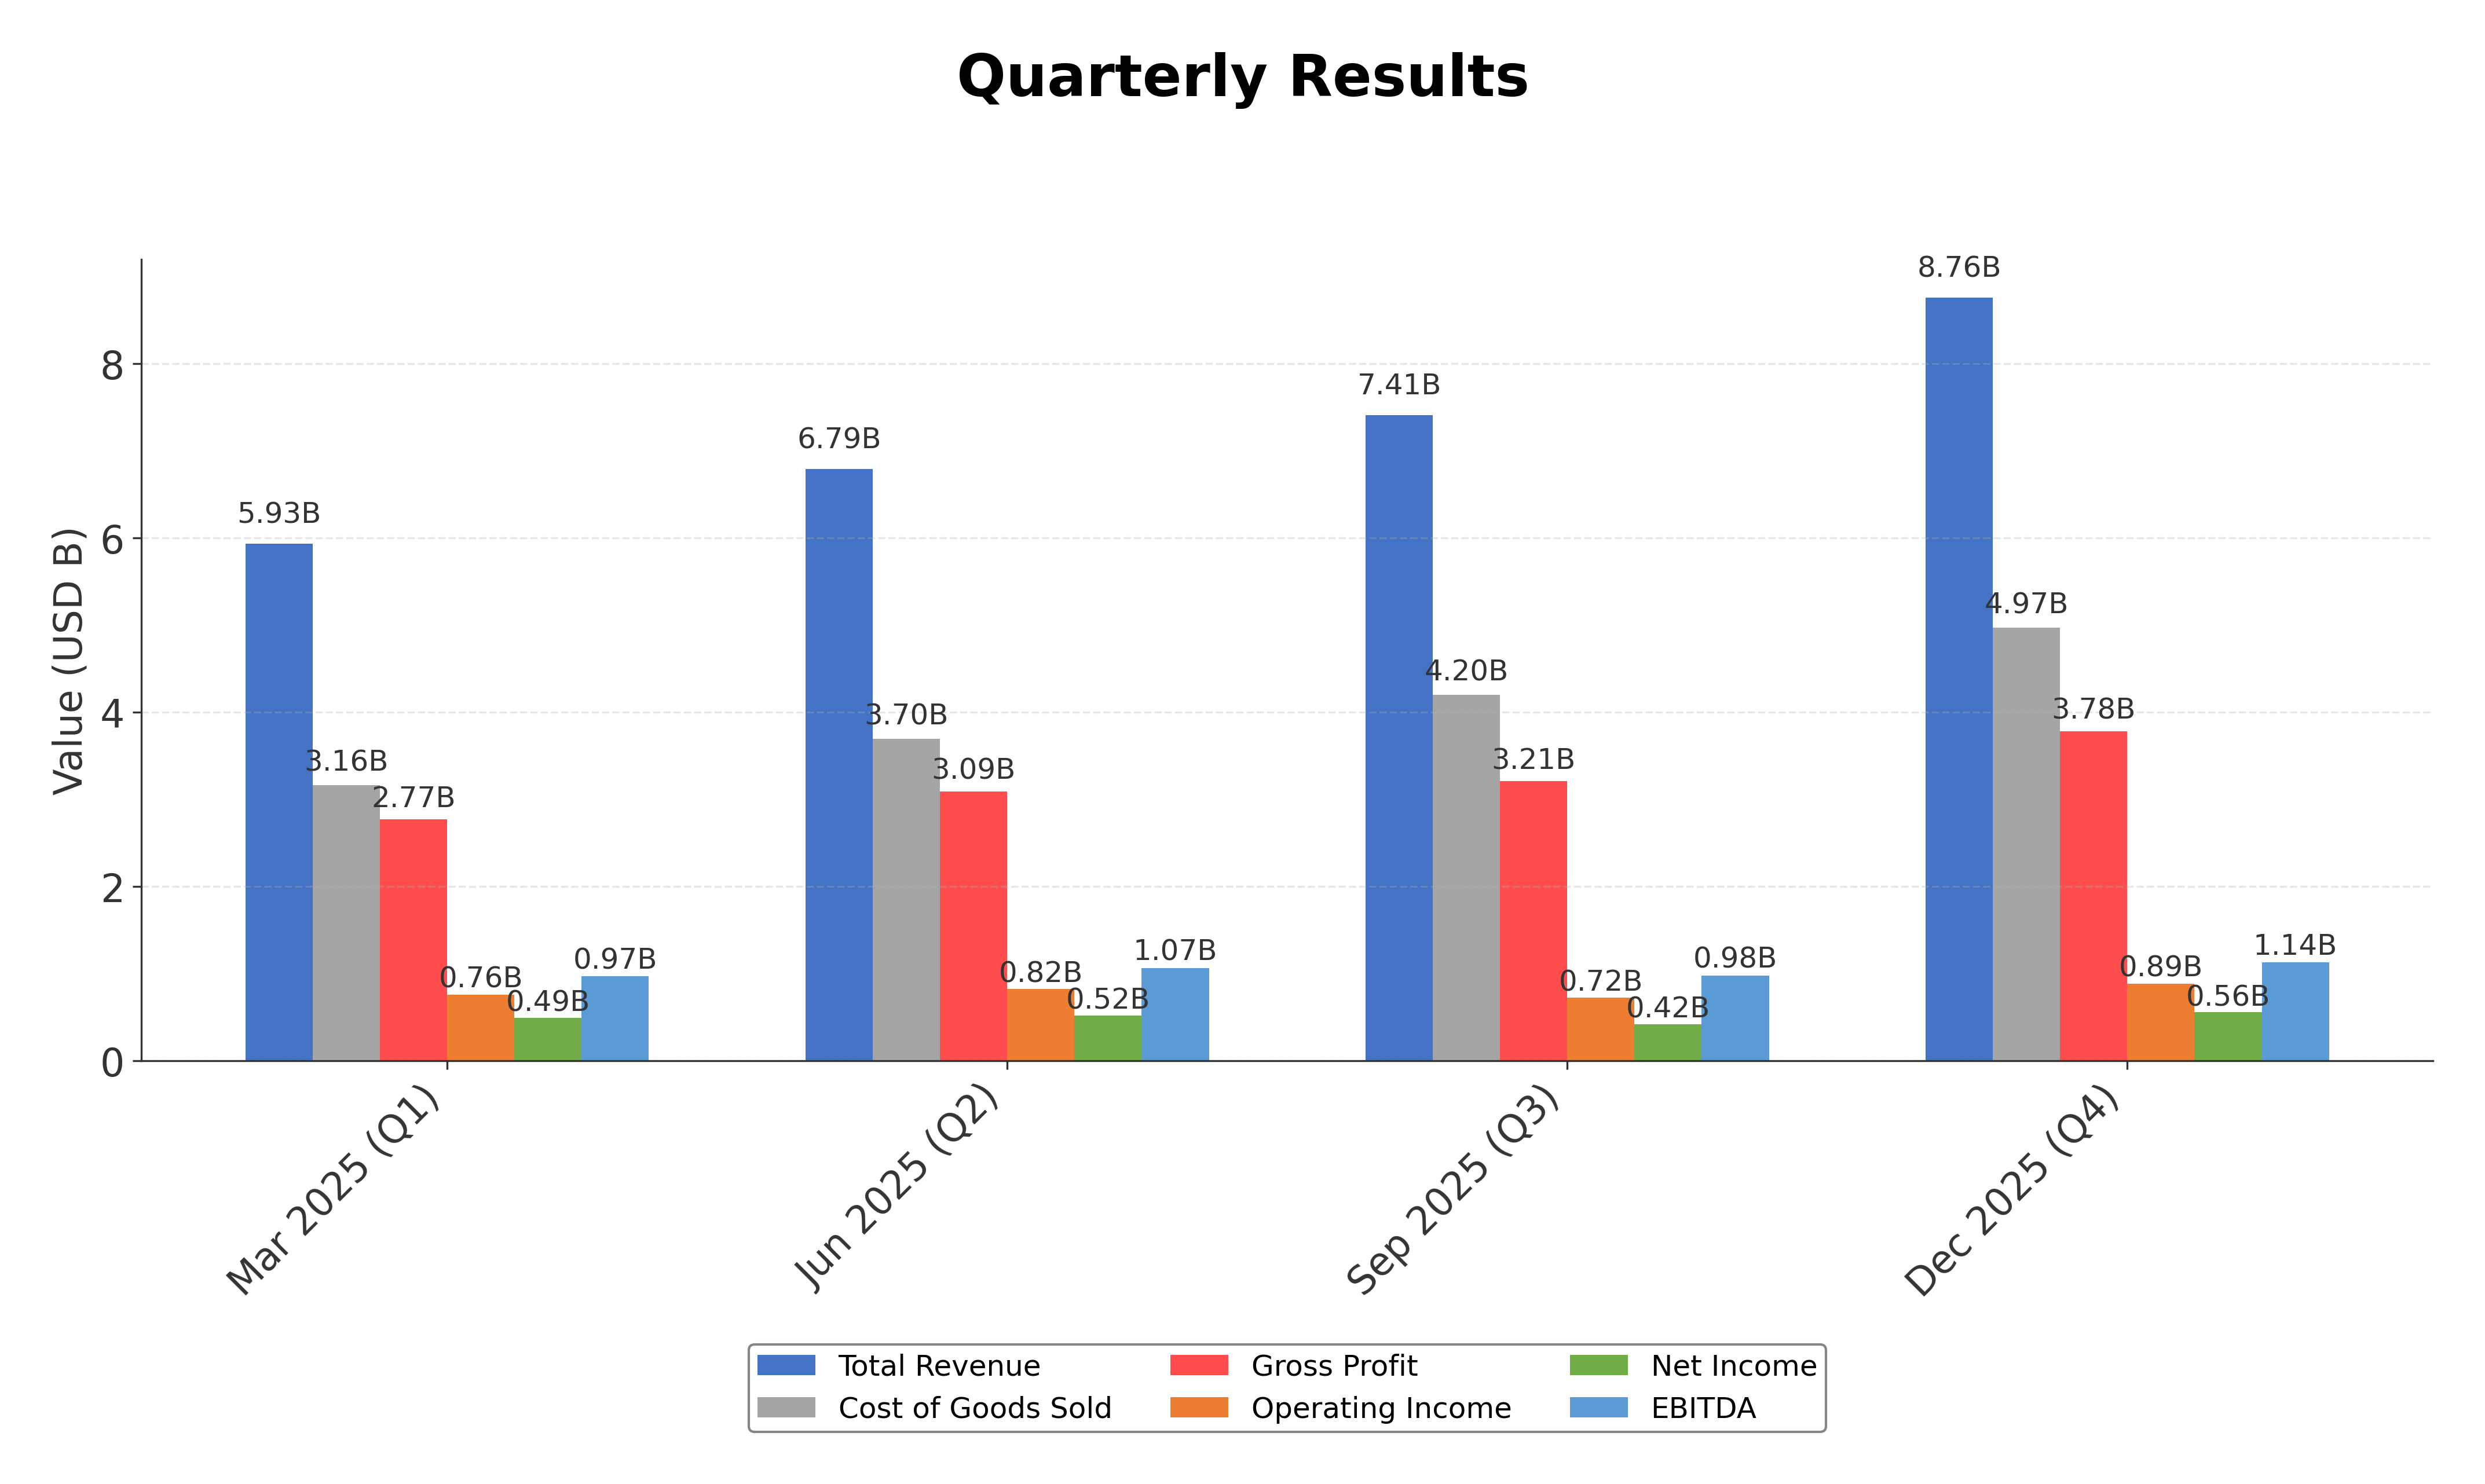
- Strong revenue growth of 49% year-over-year indicates robust top-line expansion.
- High return on equity at 31.3% demonstrates effective capital utilization and profitability.
- Operating cash flow of $13.2 billion reflects solid cash generation capability.
Cons
- High total debt to equity ratio of 170% suggests elevated financial leverage and risk.
- Operating margin compression to approximately 7% signals pressure on profitability.
- Negative free cash flow of around -$4.1 billion indicates significant cash outflows.
Disclosure: This information is for general awareness and does not constitute investment advice
Report Summary
MercadoLibre, Inc. is a leading e-commerce and fintech platform operating primarily in Latin America, headquartered in Montevideo, Uruguay. Listed on NASDAQ under the symbol MELI, it operates in the Consumer Cyclical sector within the Internet Retail industry. The company offers a comprehensive digital ecosystem including marketplace services, online payments through MercadoPago, logistics via MercadoEnvios, and advertising solutions, serving millions of users across countries such as Brazil, Argentina, and Mexico. MercadoLibre's integrated platform positions it as a dominant player in Latin America's digital commerce and financial services landscape.
Financially, MercadoLibre reported trailing twelve-month revenue of approximately $31.8 billion with a gross margin of 43.2%, operating margin of 6.9%, and net profit margin of 6.0%. Its return on equity (ROE) stands at a robust 31.3%, indicating strong profitability relative to shareholder equity, while return on assets (ROA) is 5.1%, reflecting efficient asset utilization. The company’s operating cash flow is healthy at $13.2 billion, although free cash flow is negative at approximately -$4.1 billion, suggesting ongoing investments or working capital needs. The quarterly revenue growth rate is strong at 49%, although quarterly earnings growth year-over-year declined by 15.6%.
From a valuation perspective, MercadoLibre’s trailing price-to-earnings (P/E) ratio is 42.4, with a forward P/E of 26.4, indicating a premium valuation supported by expected earnings growth. The price-to-book (P/B) ratio is elevated at 11.19, and the enterprise value to EBITDA (EV/EBITDA) multiple is 22.38, both reflecting market expectations for continued growth. The market capitalization is approximately $78.4 billion. The stock price currently trades near $1,547, closer to its 52-week low of $1,495 than its high of $2,645, indicating a significant decline of over 40% from peak levels in the past year.
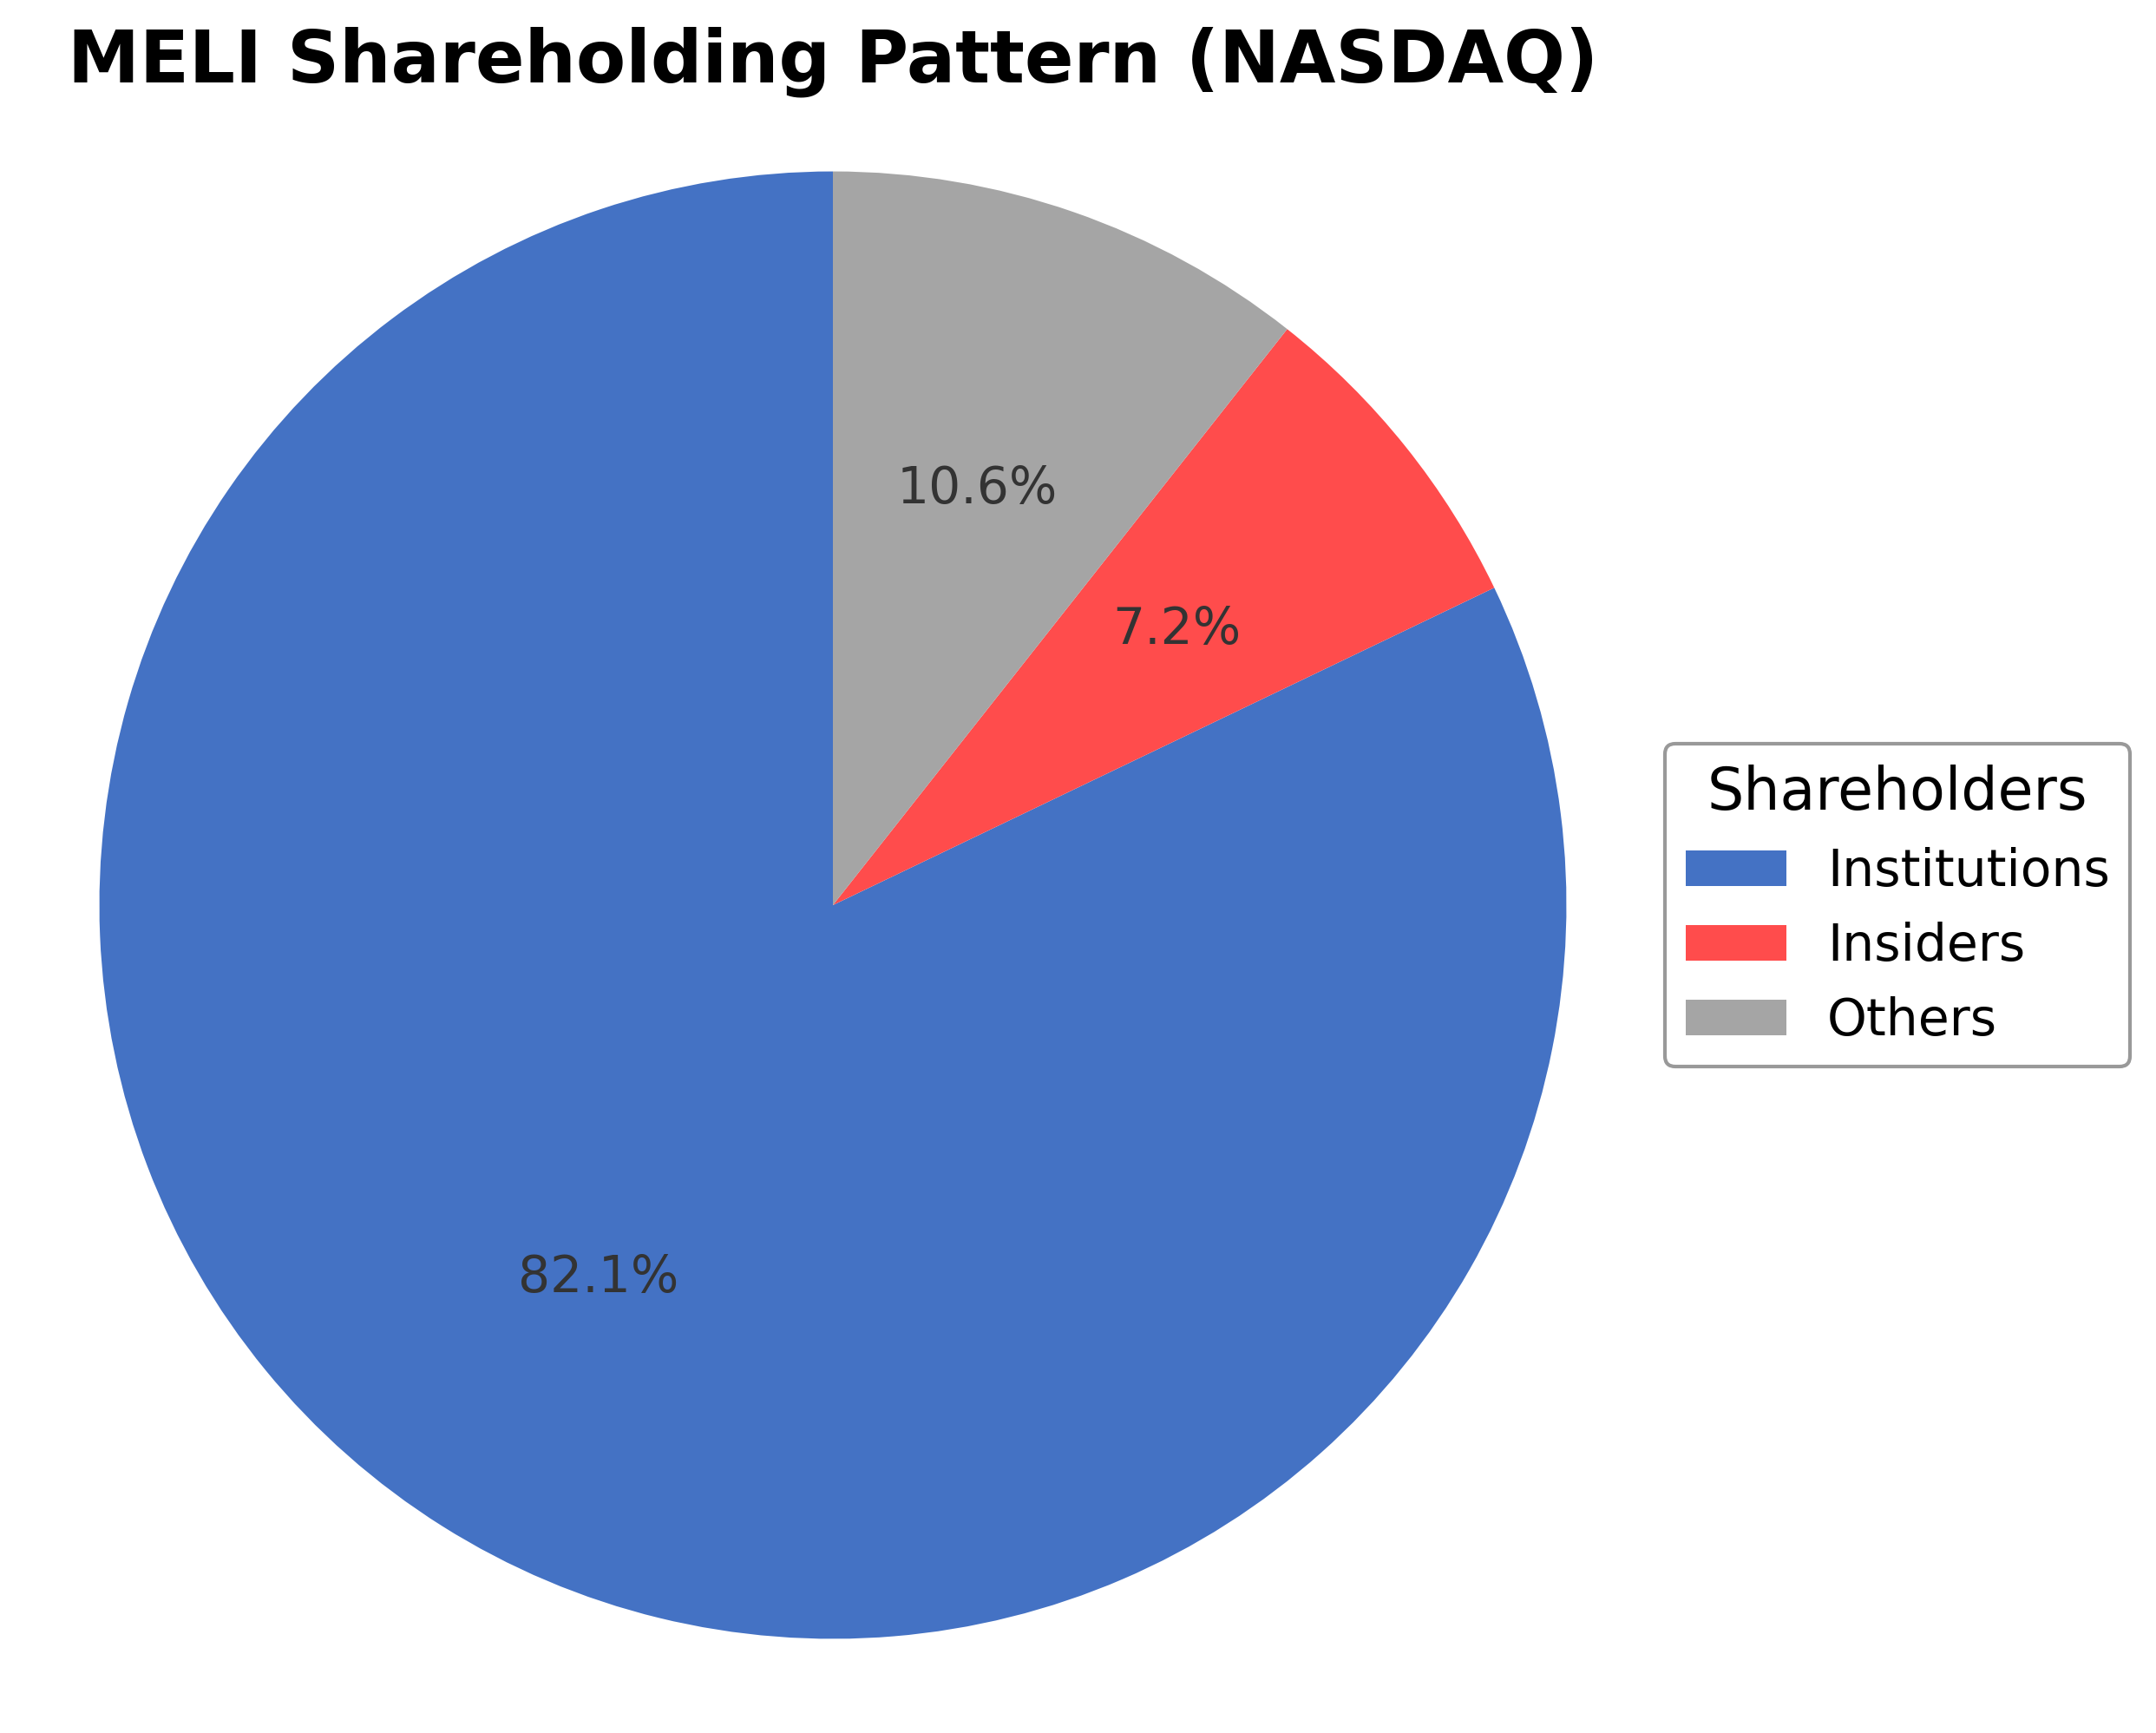
MercadoLibre’s strengths include its market leadership in Latin America’s e-commerce and fintech sectors, strong institutional ownership at 82.1%, and solid operating cash flow. Key risks involve margin compression, as operating margin has reset near 7%, and elevated debt levels with a total debt to equity ratio of 170%. Recent strategic actions include continued expansion of credit and logistics services, although recent analyst target price cuts and earnings misses have introduced volatility. Notably, prominent investors such as Michael Burry have increased positions at multi-year lows, highlighting divergent market views.
Technically, the stock is trading below its 200-day moving average ($2,062) and near the 50-day moving average ($1,743), with momentum indicators reflecting bearish sentiment over multiple timeframes. Recent news flow is predominantly negative, centered on earnings misses and margin pressures, though some positive developments include institutional stake disclosures and ongoing market share gains. Overall, the data suggests a cautious stance with conditions warranting close monitoring of operational execution and market response.
Company and Industry Overview
Company Basics
Price Performance
Company Size
Shareholding Pattern
Sector and Industry Analysis
The Latin American ecommerce and fintech sector is experiencing rapid expansion, with ecommerce penetration currently in the mid-teens percentage of total retail, significantly behind the U.S. market. The ecommerce market is projected to grow from $151 billion in 2023 to $232 billion by 2028, representing a 54% increase. Key players include MercadoLibre, which leads the region’s commerce and fintech ecosystem, alongside emerging fintech firms and traditional banks.
Industry dynamics are shaped by the ongoing shift from offline to online retail and the expansion of digital financial services. MercadoLibre leverages its large user base and first-party data to capture growth in retail media, payments processing, and credit services. Barriers to entry include the need for extensive logistics infrastructure, regulatory compliance, and the ability to scale fintech offerings across diverse Latin American markets with varying financial inclusion levels.
The regulatory environment in Latin America presents challenges and opportunities, with financial inclusion and digital payments under increased scrutiny. Regulations affecting credit operations, data privacy, and cross-border trade influence market strategies. Companies like MercadoLibre must navigate these frameworks while capitalizing on relatively low fintech penetration and evolving digital advertising regulations to sustain long-term growth.
Note: Analysis synthesized from industry research, market reports, and regulatory filings. Information is subject to change based on market conditions.
Financial Ratios Dashboard
Illustrative Scenario Analysis
DCF Assumptions:
Method: Two-Stage EPS-Priority Model
Financials
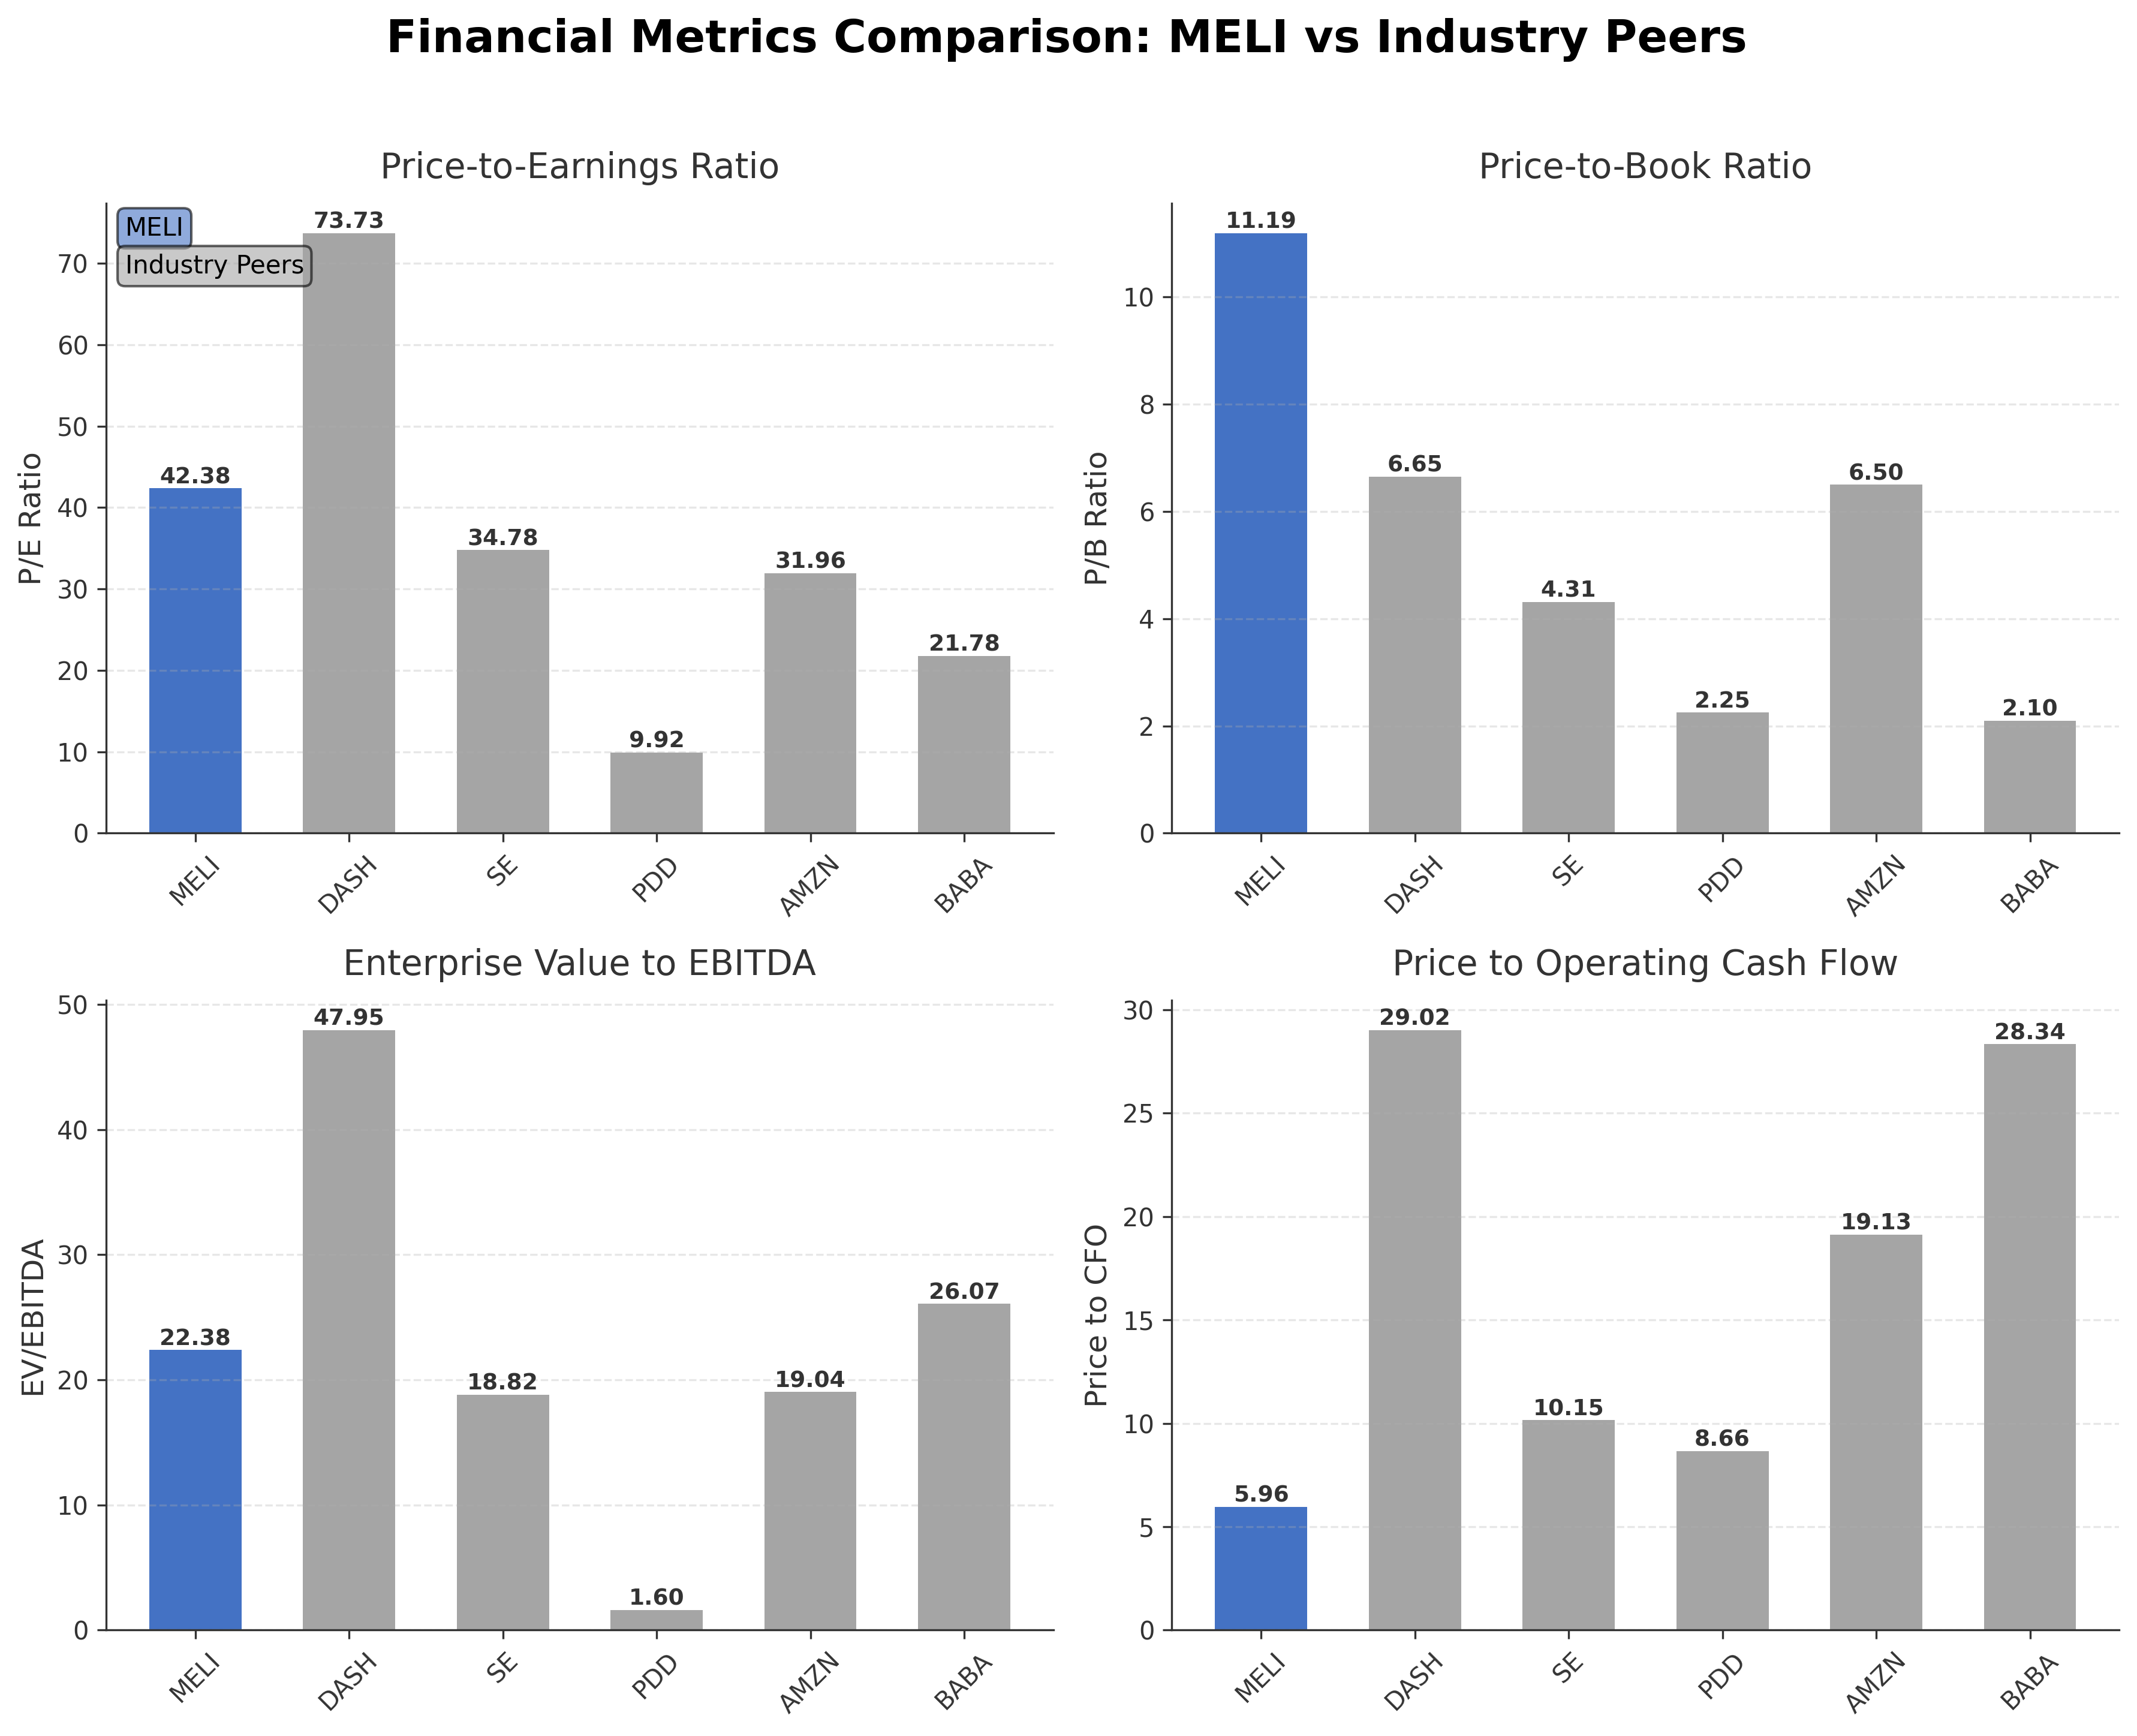
Peer Analysis
| Company Name | Market Cap | P/E Ratio | P/B Ratio | EV/EBITDA | Price to CFO |
|---|---|---|---|---|---|
| MercadoLibre, Inc. | $78.42B | 42.38 | 11.19 | 22.38 | 5.96 |
| DoorDash, Inc. | $69.37B | 73.73 | 6.65 | 47.95 | 29.02 |
| Sea Ltd. | $54.04B | 34.78 | 4.31 | 18.82 | 10.15 |
| PDD Holdings Inc. American Depositary Shares | $136.40B | 9.92 | 2.25 | 1.60 | 8.66 |
| Amazon.com, Inc. | $2.84T | 31.96 | 6.50 | 19.04 | 19.13 |
| Alibaba Group Holding Limited SP ADR | $318.09B | 21.78 | 2.10 | 26.07 | 28.34 |
Comparison Analysis: MercadoLibre trades at a higher P/E ratio of 42.38 compared to most peers, reflecting elevated growth expectations relative to companies like PDD Holdings (9.92) and Alibaba (21.78). Its P/B ratio of 11.19 is significantly above the peer average, indicating a premium valuation of its equity base. The EV/EBITDA multiple at 22.38 is also on the higher side, though Amazon and DoorDash exhibit comparable or higher multiples. MercadoLibre's return on equity of 31.3% is among the highest in the group, demonstrating strong profitability efficiency. Price to CFO at 5.96 is relatively low compared to peers like DoorDash and Alibaba, suggesting better cash flow valuation. Overall, MercadoLibre stands out for its profitability but commands a premium valuation relative to regional and global internet retail peers.
Financial Metrics Comparison with Peers
Financial Statements
Comprehensive financial data including income, balance sheet, and cash flow metrics
Income Statement
| fiscal_date | 2025-12-31 | 2024-12-31 | 2023-12-31 | 2022-12-31 | 2021-12-31 |
|---|---|---|---|---|---|
| Sales | 28.89B | 20.78B | 14.47B | 10.54B | 7.07B |
| Cost Of Goods | 16.04B | 11.20B | 7.27B | 5.37B | 4.06B |
| Gross Profit | 12.86B | 9.58B | 7.21B | 5.16B | 3.00B |
| Operating Expense Research And Development | 2.27B | 1.93B | 1.83B | 1.10B | 590.00M |
| Operating Expense Selling General And Administrative | 4.30B | 3.15B | 2.50B | 1.96B | 1.54B |
| Operating Income | 3.20B | 2.63B | 1.82B | 1.03B | 441.00M |
| Non Operating Interest Income | 138.00M | 148.00M | 723.00M | 265.00M | 138.00M |
| Non Operating Interest Expense | 160.00M | 165.00M | 378.00M | 321.00M | 229.00M |
| Other Income Expense | -337.00M | -182.00M | -615.00M | -198.00M | -109.00M |
| Pretax Income | 2.84B | 2.43B | 1.55B | 780.00M | 241.00M |
| Income Tax | 845.00M | 521.00M | 569.00M | 298.00M | 149.00M |
| Net Income | 2.00B | 1.91B | 987.00M | 482.00M | 83.00M |
| Eps Basic | 39.40 | 37.69 | 19.64 | 9.57 | 1.67 |
| Eps Diluted | 39.40 | 37.69 | 19.46 | 9.53 | 1.67 |
| Basic Shares Outstanding | 50.70M | 50.70M | 50.26M | 50.35M | 49.80M |
| Diluted Shares Outstanding | 50.70M | 50.70M | 50.26M | 50.35M | 49.80M |
| Ebit | 3.00B | 2.60B | 1.93B | 1.10B | 470.00M |
| Ebitda | 4.16B | 3.40B | 3.07B | 1.70B | 783.00M |
| Net Income Continuous Operations | 2.00B | 1.91B | 987.00M | 482.00M | 83.00M |
| Preferred Stock Dividends | N/A | 0.00 | 0.00 | 0.00 | 0.00 |
Source: Financial statements and regulatory filings
Balance Sheet
| fiscal_date | 2025-12-31 | 2024-12-31 | 2023-12-31 | 2022-12-31 | 2021-12-31 |
|---|---|---|---|---|---|
| Cash And Cash Equivalents | 3.67B | 2.63B | 2.56B | 1.91B | 2.58B |
| Accounts Receivable | 369.00M | 255.00M | 156.00M | 130.00M | 98.00M |
| Total Assets | 42.67B | 25.20B | 17.65B | 13.74B | 10.10B |
| Total Liabilities | 35.92B | 20.84B | 14.57B | 11.91B | 8.57B |
| Long Term Debt | 6.34B | 3.78B | 2.88B | 3.14B | 2.60B |
| Shareholders Equity | 6.75B | 4.35B | 3.07B | 1.83B | 1.53B |
Source: Financial statements and regulatory filings
Cash Flow Statement
| fiscal_date | 2025-12-31 | 2024-12-31 | 2023-12-31 | 2022-12-31 | 2021-12-31 |
|---|---|---|---|---|---|
| Operating Activities Net Income | 2.00B | 1.91B | 987.00M | 482.00M | 83.00M |
| Operating Activities Depreciation | 818.00M | 617.00M | 524.00M | 403.00M | 204.00M |
| Operating Activities Deferred Taxes | -469.00M | -243.00M | 40.00M | -97.00M | -29.00M |
| Operating Activities Other Non Cash Items | -820.00M | -301.00M | -20.00M | 56.00M | 129.00M |
| Operating Activities Accounts Receivable | -1.51B | -2.69B | -1.41B | -1.16B | -1.09B |
| Operating Activities Accounts Payable | 1.49B | 1.59B | 1.23B | 449.00M | 380.00M |
| Operating Activities Other Assets Liabilities | -989.00M | -535.00M | -212.00M | -55.00M | -409.00M |
| Operating Activities Operating Cash Flow | 516.00M | 357.00M | 1.30B | 84.00M | -730.25M |
| Investing Activities Capital Expenditures | -1.34B | -860.00M | -509.00M | -454.00M | -573.00M |
| Investing Activities Net Intangibles | 75.00M | N/A | 0.00 | -1.00M | -36.00M |
| Investing Activities Net Acquisitions | 0.00 | -6.00M | 0.00 | 0.00 | -56.00M |
| Investing Activities Purchase Of Investments | -14.85B | -16.72B | -18.99B | -12.74B | -7.39B |
| Investing Activities Sale Of Investments | 16.59B | 13.99B | 18.10B | 11.02B | 7.81B |
| Investing Activities Other Investing Activity | -6.66B | -4.69B | -2.05B | -1.70B | -1.35B |
| Investing Activities Investing Cash Flow | -6.25B | -8.29B | -3.45B | -3.87B | -1.56B |
| Financing Activities Long Term Debt Issuance | 44.05B | 19.47B | 24.96B | 17.02B | 9.26B |
| Financing Activities Long Term Debt Payments | -41.15B | -17.51B | -24.87B | -15.95B | -8.66B |
| Financing Activities Common Stock Repurchase | -1.00M | -1.00M | -356.00M | -148.00M | -486.00M |
| Financing Activities Financing Cash Flow | 2.90B | 1.96B | -267.00M | 916.00M | 1.93B |
| End Cash Position | 13.54B | 4.70B | 3.85B | 3.36B | 3.65B |
| Free Cash Flow | 10.77B | 7.06B | 4.63B | 2.48B | 356.00M |
| Operating Activities Stock Based Compensation | N/A | N/A | 167.00M | 1.00M | 755.00K |
| Financing Activities Common Stock Issuance | N/A | N/A | 0.00 | 0.00 | 1.52B |
| Income Tax Paid | N/A | N/A | 651.00M | 437.00M | 282.00M |
| Interest Paid | N/A | N/A | 608.00M | 247.00M | 58.00M |
| Financing Activities Common Dividends | N/A | N/A | N/A | 0.00 | 0.00 |
| Financing Activities Other Financing Charges | N/A | N/A | N/A | N/A | 296.00M |
Source: Financial statements and regulatory filings
Technical Analysis
Key Insights
- The current trend direction shows a bearish momentum with the stock trading below its 200-day moving average at $2062 and near the 50-day moving average at $1743, indicating downward pressure in price action.
- Key support levels are observed near the 52-week low of $1495, while resistance is noted around the 50-day moving average at approximately $1743 and the 200-day moving average near $2062.
- The stock is positioned below its 10-day, 50-day, and 200-day moving averages, suggesting a short to long-term bearish trend.
- Momentum indicators show a Relative Strength Index (RSI) below neutral levels, a negative MACD crossover, and stochastic oscillators indicating oversold conditions, reflecting weak momentum.
- Across daily, weekly, and monthly timeframes, the stock exhibits consistent bearish signals with declining volume and price consolidation near lows.
- Potential market scenarios include continued consolidation near current support with possible volatility spikes due to earnings and news flow, while a break above 50-day moving average could signal a shift in momentum.
Trending News
1. Headline: Is MercadoLibre (MELI) Now An Opportunity After A 40% One-Year Share Price Slide? - Simply Wall St News
Summary: Wondering if MercadoLibre at around US$1,546 per share is still priced for strength or starting to look appealing on value is a fair question given the stock's recent swings. The share price has slipped around 5.3% over the past week, around 16.7% over the past month, and is down 21.6% year ...
Sentiment: negative
2. Headline: BTIG Cuts Target on MercadoLibre, Inc. (MELI) as Margins Reset Near 7%
Summary: MercadoLibre, Inc. (NASDAQ:MELI) is among the stocks with the best earnings growth for the next 10 years. On May 10, BTIG trimmed the price target on MercadoLibre, Inc. (NASDAQ:MELI) to $2,150 from $2,400 and reiterated a Buy rating after the first-quarter results.
Sentiment: negative
3. Headline: MercadoLibre Inc stock (US58733R1023): Analyst target cuts meet post-earnings volatility
Summary: MercadoLibre Inc shares have been volatile after Q1 2026 results and fresh analyst target cuts from major Wall Street banks. How robust is the Latin American e?commerce and fintech leader’s growth story despite short-term margin pressure?
Sentiment: negative
4. Headline: MercadoLibre Inc (MELI) Shares Fall 3.8% -- What GF Score of 81 Tells Investors
Summary: On May 15, 2026, MercadoLibre Inc (MELI) shares fell 3.8%, closing at $1546.81. This decline continues a troubling trend, as the stock has experienced a 40.2% d
Sentiment: negative
5. Headline: Michael Burry Loads Up on Lululemon [NASDAQ: LULU] and MercadoLibre [NASDAQ: MELI] Stock at Multi-Year Lows
Summary: Michael Burry, the investor whose 2008 housing crisis bet was immortalised in The Big Short, has disclosed two significant new long positions in beaten-down stocks, adding Lululemon Athletica Inc. [NASDAQ: LULU] and MercadoLibre Inc.
Sentiment: positive
Recent Updates
News Summary
As of 2026-05-15. MercadoLibre reported first-quarter 2026 earnings with an EPS of $8.23, missing analyst forecasts by 12.17%, while revenue exceeded expectations at $8.85 billion versus $8.29 billion anticipated. This mixed earnings report led to an 11.33% decline in after-hours trading, reflecting margin pressures despite strong top-line growth. Additionally, Capital Research Global Investors disclosed a 5.4% stake in MercadoLibre, signaling continued institutional interest. These developments underscore a period of operational challenges amid sustained market confidence from major shareholders.
News Sentiment
The overall sentiment from recent updates is mixed to negative, driven primarily by earnings misses and margin compression impacting stock performance. The revenue beat provides a positive offset, indicating ongoing growth momentum, while institutional stake disclosures contribute a neutral to slightly positive tone. Market reactions to earnings volatility and analyst target price reductions have introduced caution, balancing optimism about long-term growth with concerns over near-term profitability.
Source List
- https://www.stocktitan.net/sec-filings/MELI/schedule-13g-mercadolibre-inc-passive-investment-disclosure-5-8acac574f6a3.html
Analytical Overview
Analysis Summary
MercadoLibre's valuation metrics, including a trailing P/E of 42.38 and forward P/E of 26.42, are elevated relative to the Internet Retail industry average P/E of 42.38, suggesting the market prices in significant growth potential. The company's revenue growth rate of 49% year-over-year and strong operating cash flow of $13.2 billion indicate a robust growth trajectory, although negative free cash flow points to substantial reinvestment or working capital needs. Financial health shows a high total debt to equity ratio of 170%, which may increase leverage risk, but a current ratio of 1.16 suggests adequate short-term liquidity. Sector-specific challenges include margin compression and competitive pressures in Latin America's evolving e-commerce and fintech markets. Consideration of market positioning and competitive advantages highlights MercadoLibre's leadership and integrated platform as key strengths.
Overall Business and Market Assessment
Supporting Factors: robust revenue growth of 49%, strong return on equity at 31.3%, and solid operating cash flow generation
Risk Factors: margin compression near 7%, a high debt-to-equity ratio of 170%, and recent earnings volatility
SWOT Analysis
Strengths
- Market leadership in Latin America's e-commerce and fintech sectors.
- Strong return on equity of 31.3% indicating efficient use of shareholder capital.
- Robust revenue growth of 49% year-over-year.
- Solid operating cash flow generation of $13.2 billion.
Weaknesses
- High total debt to equity ratio of 170% increasing financial leverage risk.
- Negative free cash flow of approximately -$4.1 billion indicating cash outflows.
- Operating margin compression to near 7% impacting profitability.
- Elevated valuation multiples including P/E of 42.4 and P/B of 11.19.
Opportunities
- Expansion of credit and logistics services in underpenetrated Latin American markets.
- Increasing digital payments adoption supporting MercadoPago growth.
- Potential institutional accumulation as indicated by recent stake disclosures.
- Growing e-commerce penetration in emerging markets.
Threats
- Intense competition from regional and global e-commerce players.
- Regulatory risks in multiple Latin American jurisdictions.
- Macroeconomic volatility affecting consumer spending in key markets.
- Margin pressures from increased investments and credit risk.
Company Description
MercadoLibre, Inc. is Latin America's leading e-commerce and fintech platform, headquartered in Montevideo, Uruguay. Founded in 1999, the company operates an integrated digital ecosystem that connects millions of buyers and sellers across Brazil, Argentina, Mexico, and numerous other countries throughout the region. The platform offers six core services: the MercadoLibre Marketplace for general commerce, Classifieds for specialized listings, MercadoPago for online payments and financial services, MercadoShops for merchant storefronts, MercadoEnvios for logistics and shipping, and advertising solutions. Through its comprehensive suite of services, MercadoLibre facilitates commerce transactions, enables digital payments, provides credit solutions, and supports financial inclusion throughout Latin America. The company serves individual consumers, small businesses, and enterprises, leveraging advanced technology and data analytics to optimize user experiences and streamline transaction efficiency across its diverse marketplace segments.