
MCY (MCY)
Stock Analysis Report
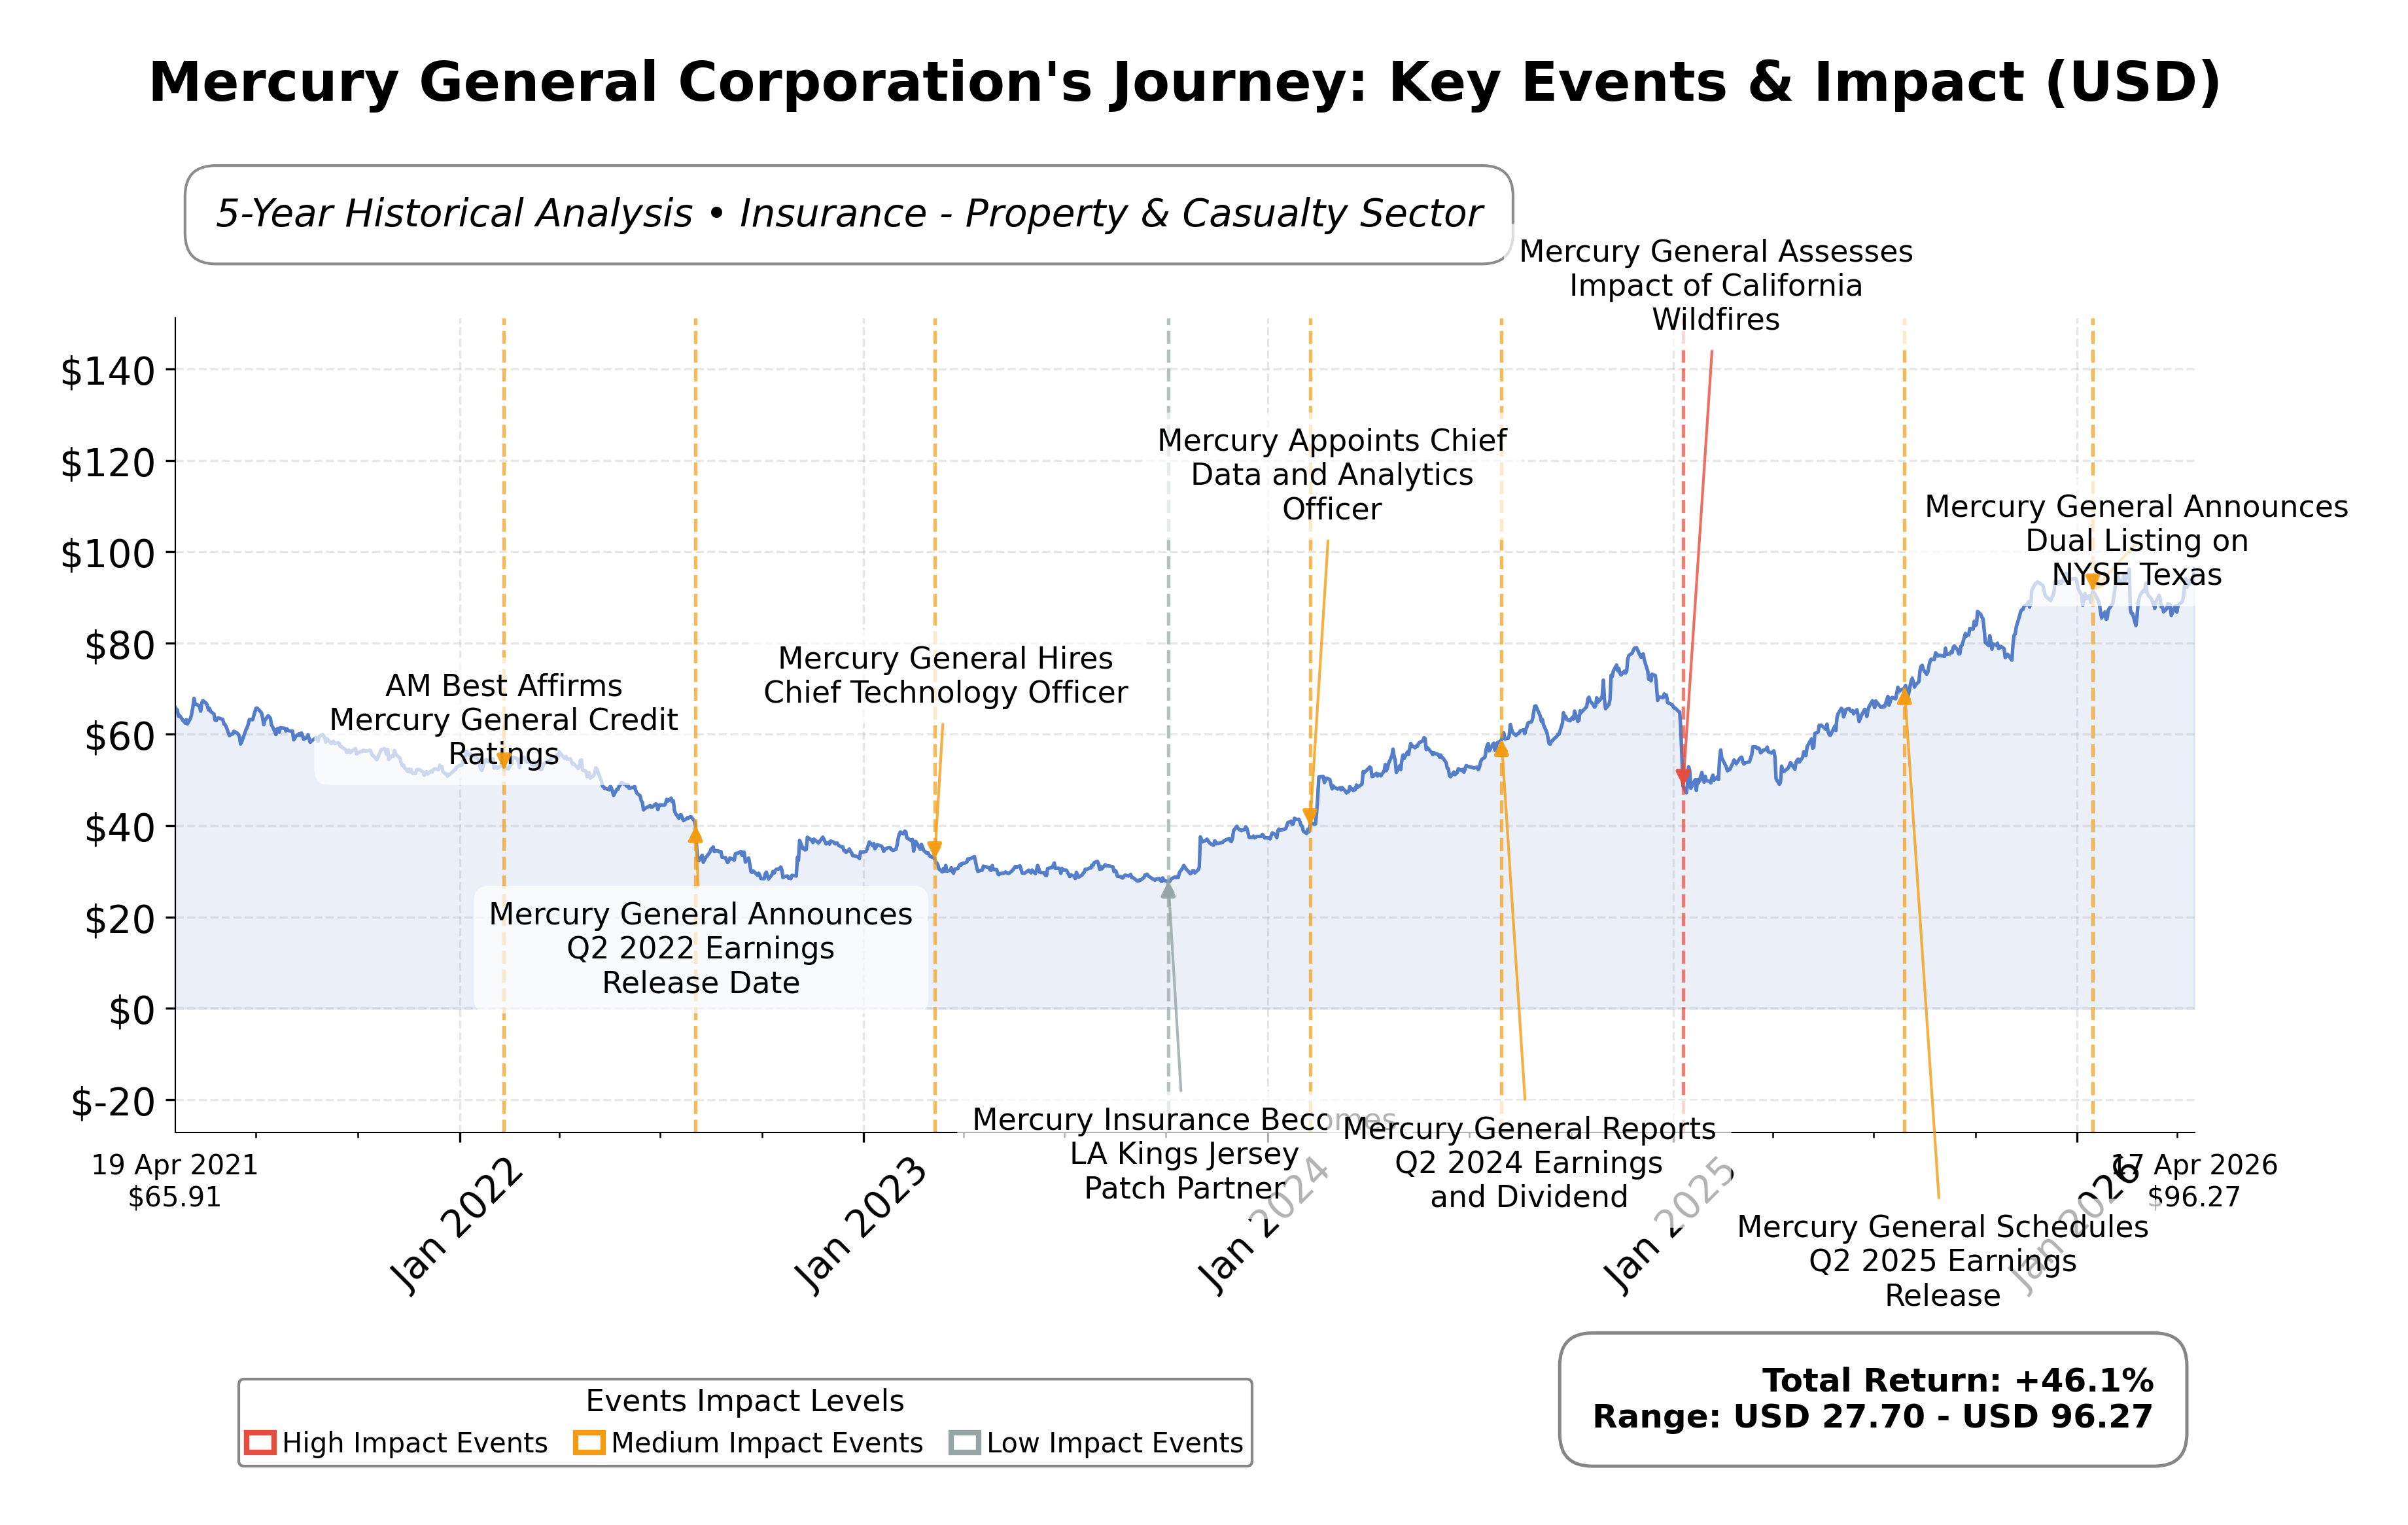
Stock Journey
Key Positives and Key Risks
Pros
- Strong return on equity of 24.8% demonstrates effective capital utilization and profitability.
- Robust levered free cash flow of $2.52 billion supports financial flexibility and shareholder returns.
- Reasonable valuation with a trailing P/E of 9.21 and EV/EBITDA of 5.06 compared to industry peers.
Cons
- Current ratio of 0.56 indicates potential short-term liquidity constraints.
- Dividend yield of 1.37% is relatively low compared to the sector average of 3.64%.
- Exposure to regulatory and competitive risks inherent in the U.S. insurance market.
Disclosure: This information is for general awareness and does not constitute investment advice
Report Summary
Mercury General Corporation operates as a prominent insurance holding company primarily focused on personal automobile insurance across the United States. Listed on the NYSE under the ticker MCY, it is positioned within the Financial Services sector, specifically in the Insurance - Property & Casualty industry. The company also offers homeowners, renters, and mechanical breakdown insurance, serving a broad customer base through a network of independent agents. Headquartered in Los Angeles, California, Mercury General holds a significant market presence, especially in California, and emphasizes underwriting discipline and cost management.
Financially, Mercury General reported trailing twelve months (TTM) revenue of approximately $5.99 billion with a profit margin of 9.03%, indicating solid profitability. Operating margin stands at 16.67%, reflecting efficient core operations. The company’s return on equity (ROE) is strong at 24.80%, and return on assets (ROA) is 4.82%, demonstrating effective use of shareholder capital and assets. Its operating cash flow totaled about $1.09 billion TTM, with levered free cash flow reaching $2.52 billion, underscoring robust cash generation capabilities.
Valuation metrics show a trailing P/E ratio of 9.21 and a forward P/E of 11.25, suggesting the stock is trading at a reasonable multiple relative to earnings expectations. The price-to-book ratio is 2.06, and the EV/EBITDA ratio is 5.06, indicating moderate valuation levels compared to industry peers. The market capitalization is approximately $5.15 billion, with the stock price currently near $96.25, trading closer to its 52-week high of $100.06 than its low of $48.79, reflecting recent positive momentum.
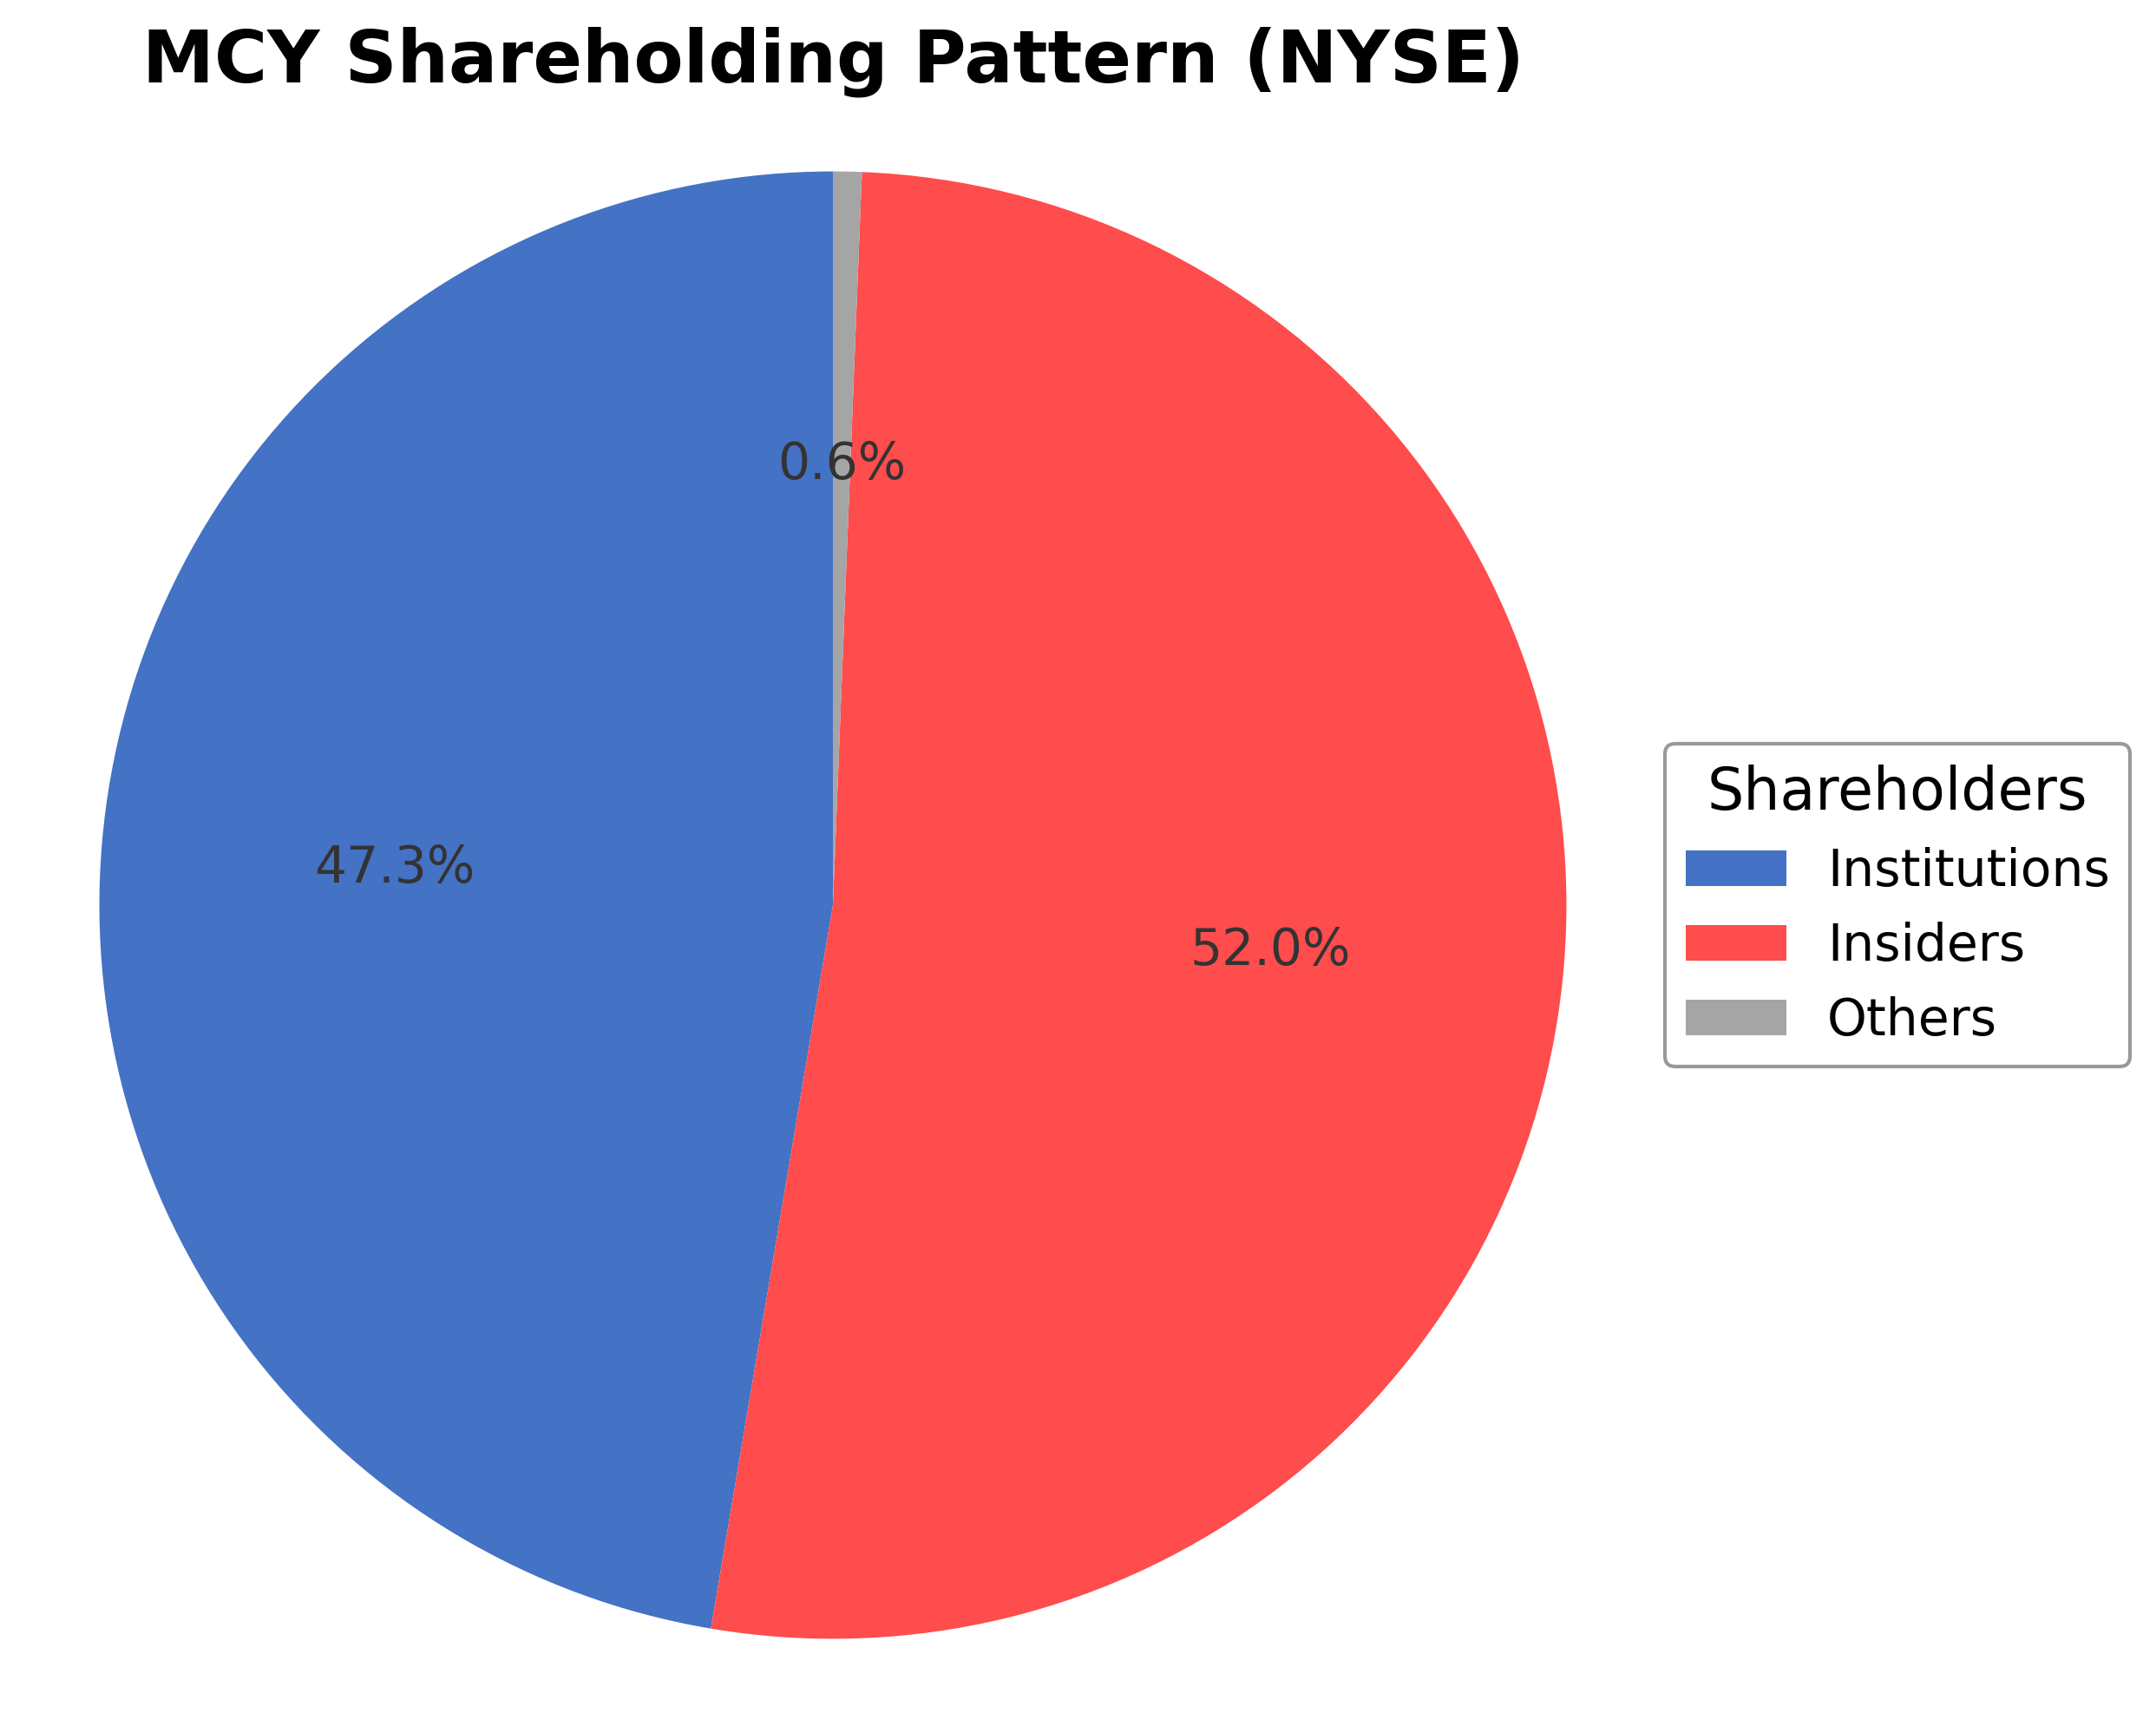
Mercury General’s strengths include a strong liquidity position with over $1.65 billion in cash, low debt levels with a debt-to-equity ratio of 24.3%, and a consistent dividend yield of about 1.37%. Institutional ownership is significant at 47.3%, complemented by insider holdings of 52%, which may support governance stability. Risks include exposure to regulatory changes in the insurance sector and competitive pressures. Recent strategic moves include a dual listing on NYSE Texas and ongoing digital initiatives to enhance underwriting and risk management.
Technically, the stock is trading above its 50-day and 200-day moving averages, supported by positive momentum indicators and recent volume trends. The price action suggests a sustained upward trend with key support near $89 and resistance close to the 52-week high. The overall data suggests a market environment conducive to accumulation and monitoring, with balanced considerations of valuation and growth prospects.
Company and Industry Overview
Company Basics
Price Performance
Company Size
Shareholding Pattern
Sector and Industry Analysis
The mercury sector is characterized by a global market experiencing a decline in demand due to heightened environmental concerns and regulatory pressures. Despite mercury’s historical applications in mining, power generation, and manufacturing, the market size is contracting as industries shift towards mercury-free alternatives. Key players include mining companies, manufacturers of mercury-containing products, and innovators developing sustainable substitutes, with market activity spanning North America, Europe, Asia-Pacific, Middle East, Africa, and Latin America.
Industry dynamics reveal a transition from traditional broad applications to niche uses where mercury remains essential, driven by technological advancements in mercury-free solutions. Competitive pressures are intensifying as new entrants face high capital requirements and stringent regulations, creating barriers to entry. Companies are focusing on product diversification and innovation to maintain market share amid the growing threat of substitutes and shifting demand patterns.
The regulatory environment is a critical factor shaping the mercury market, with strict global environmental policies aimed at reducing mercury usage due to its toxicity and ecological impact. These regulations have accelerated the development and adoption of mercury-free technologies, influencing supply chains and trade flows. Ongoing geopolitical events and international agreements continue to affect mercury pricing, availability, and market outlook through 2032, reinforcing the sector’s move toward sustainability.
Note: Analysis synthesized from industry research, market reports, and regulatory filings. Information is subject to change based on market conditions.
Financial Ratios Dashboard
Illustrative Scenario Analysis
DCF Assumptions:
Method: Two-Stage EPS-Priority Model
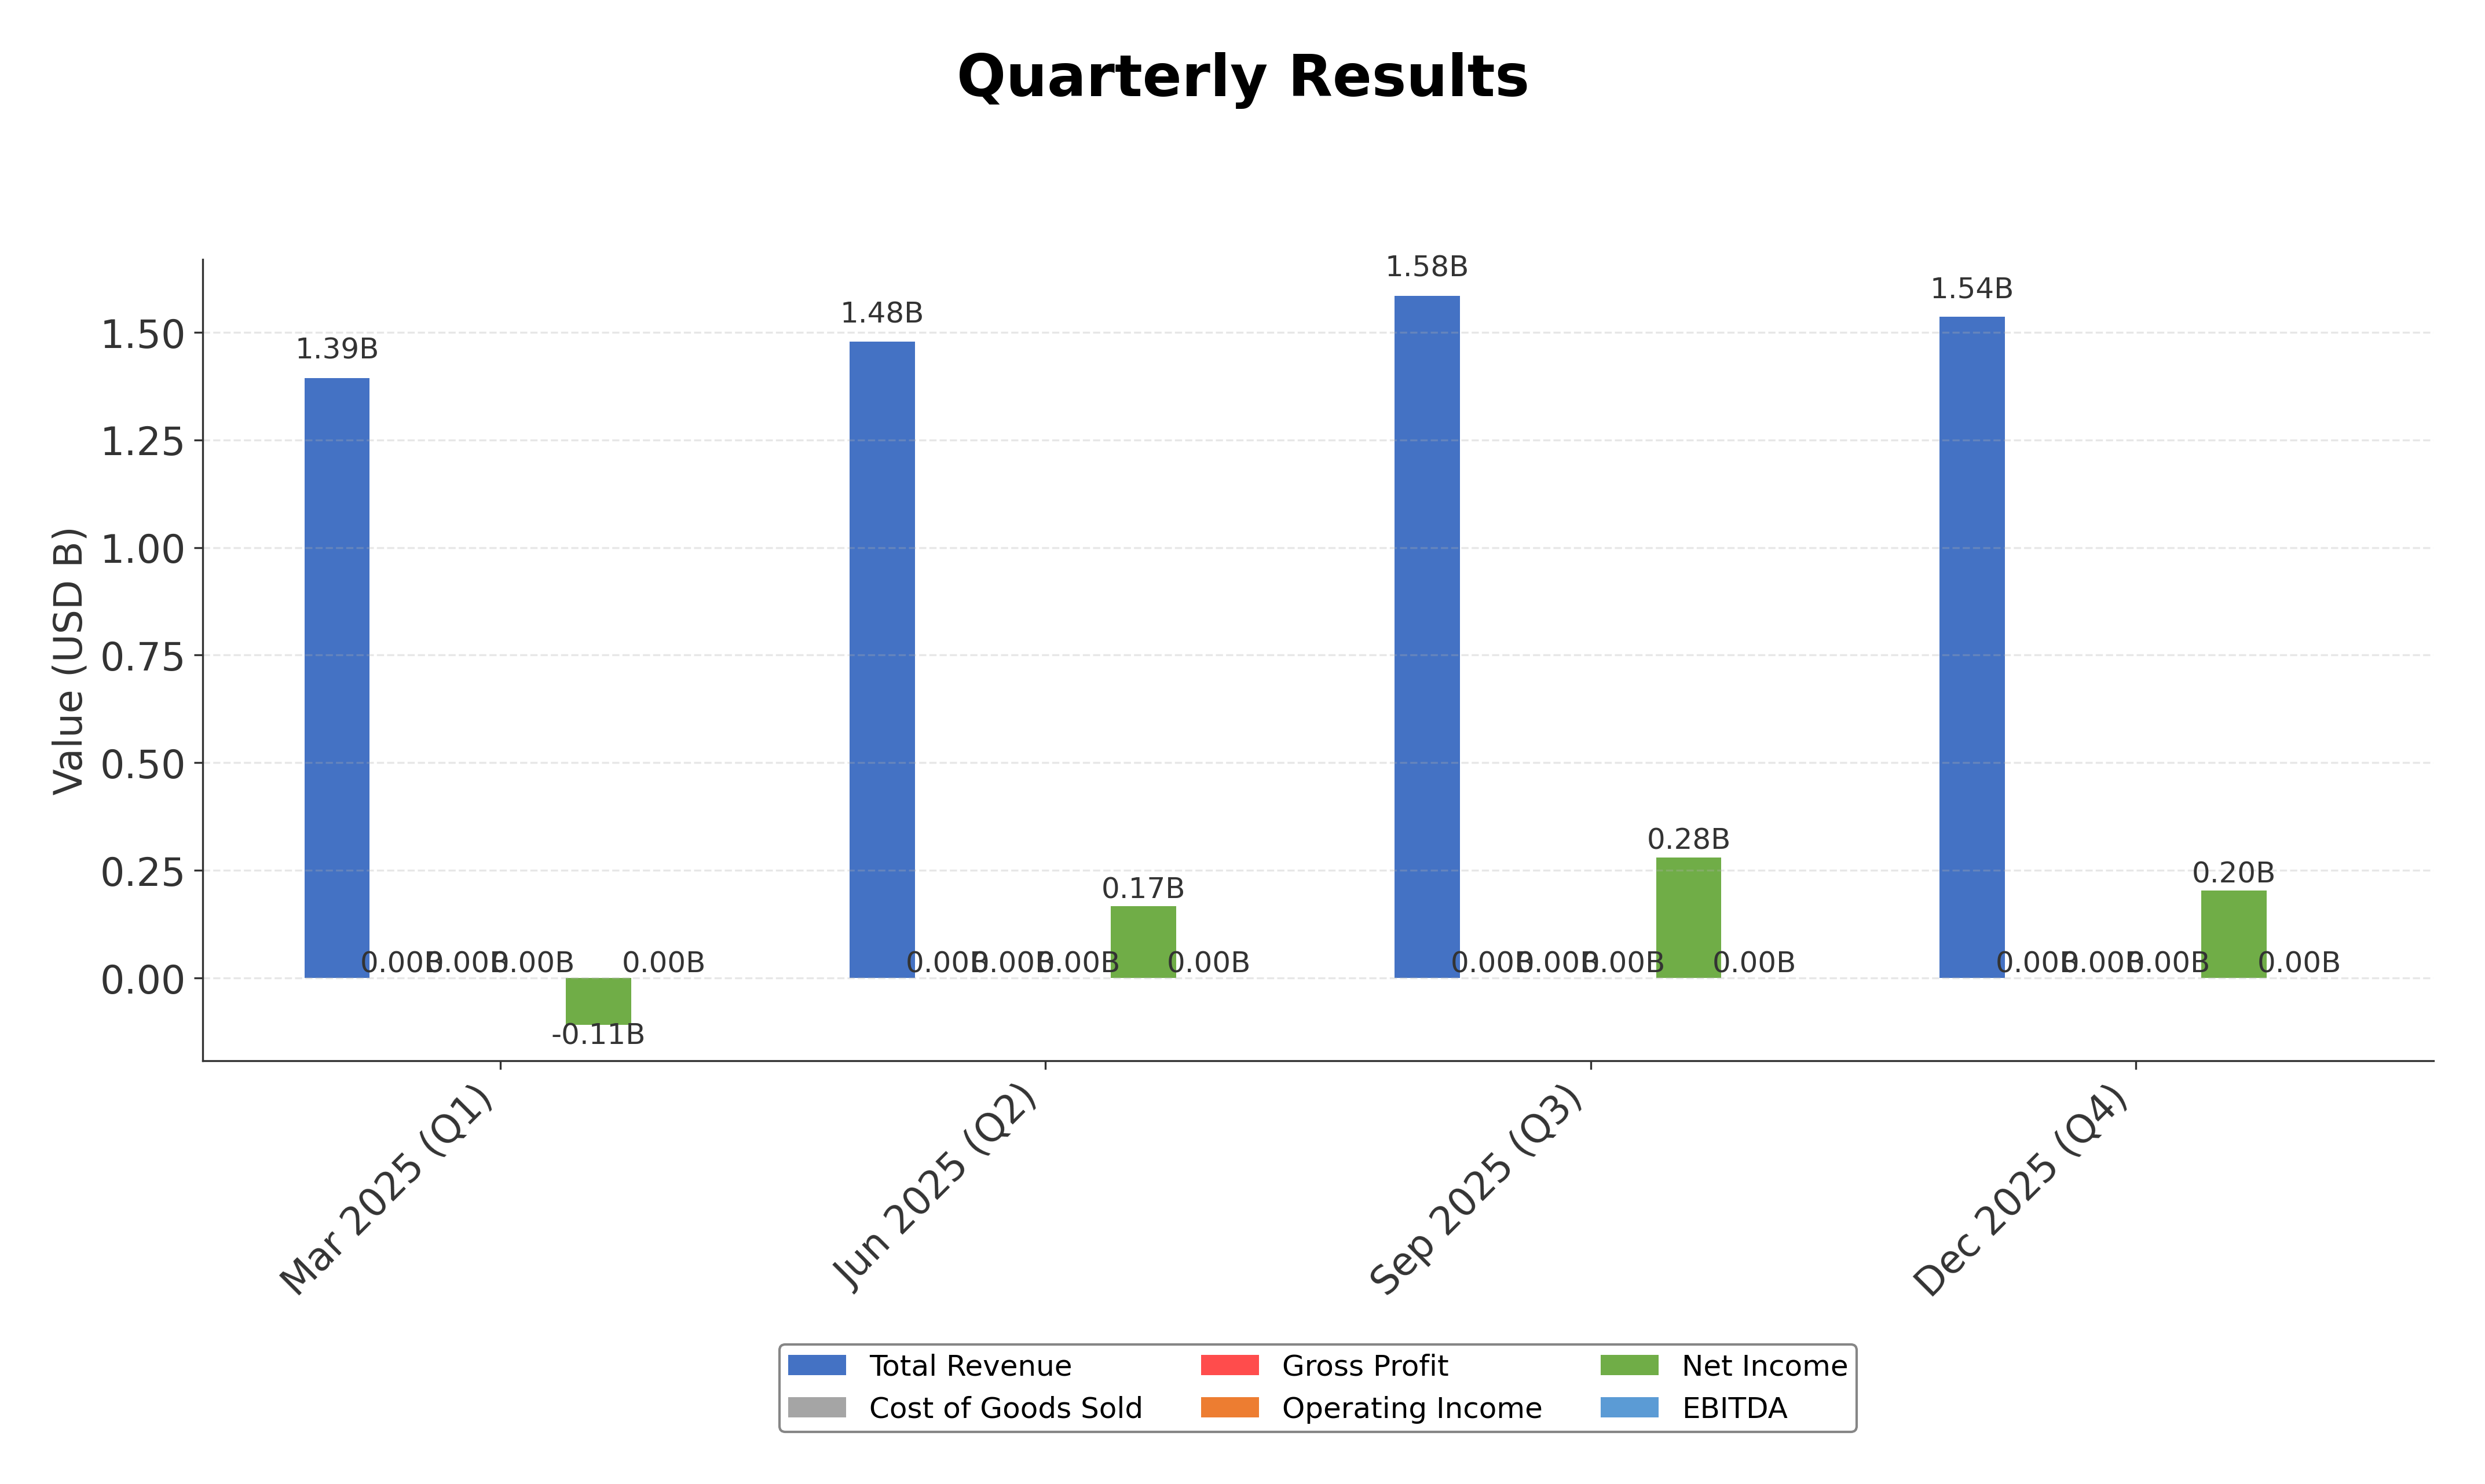
Financials
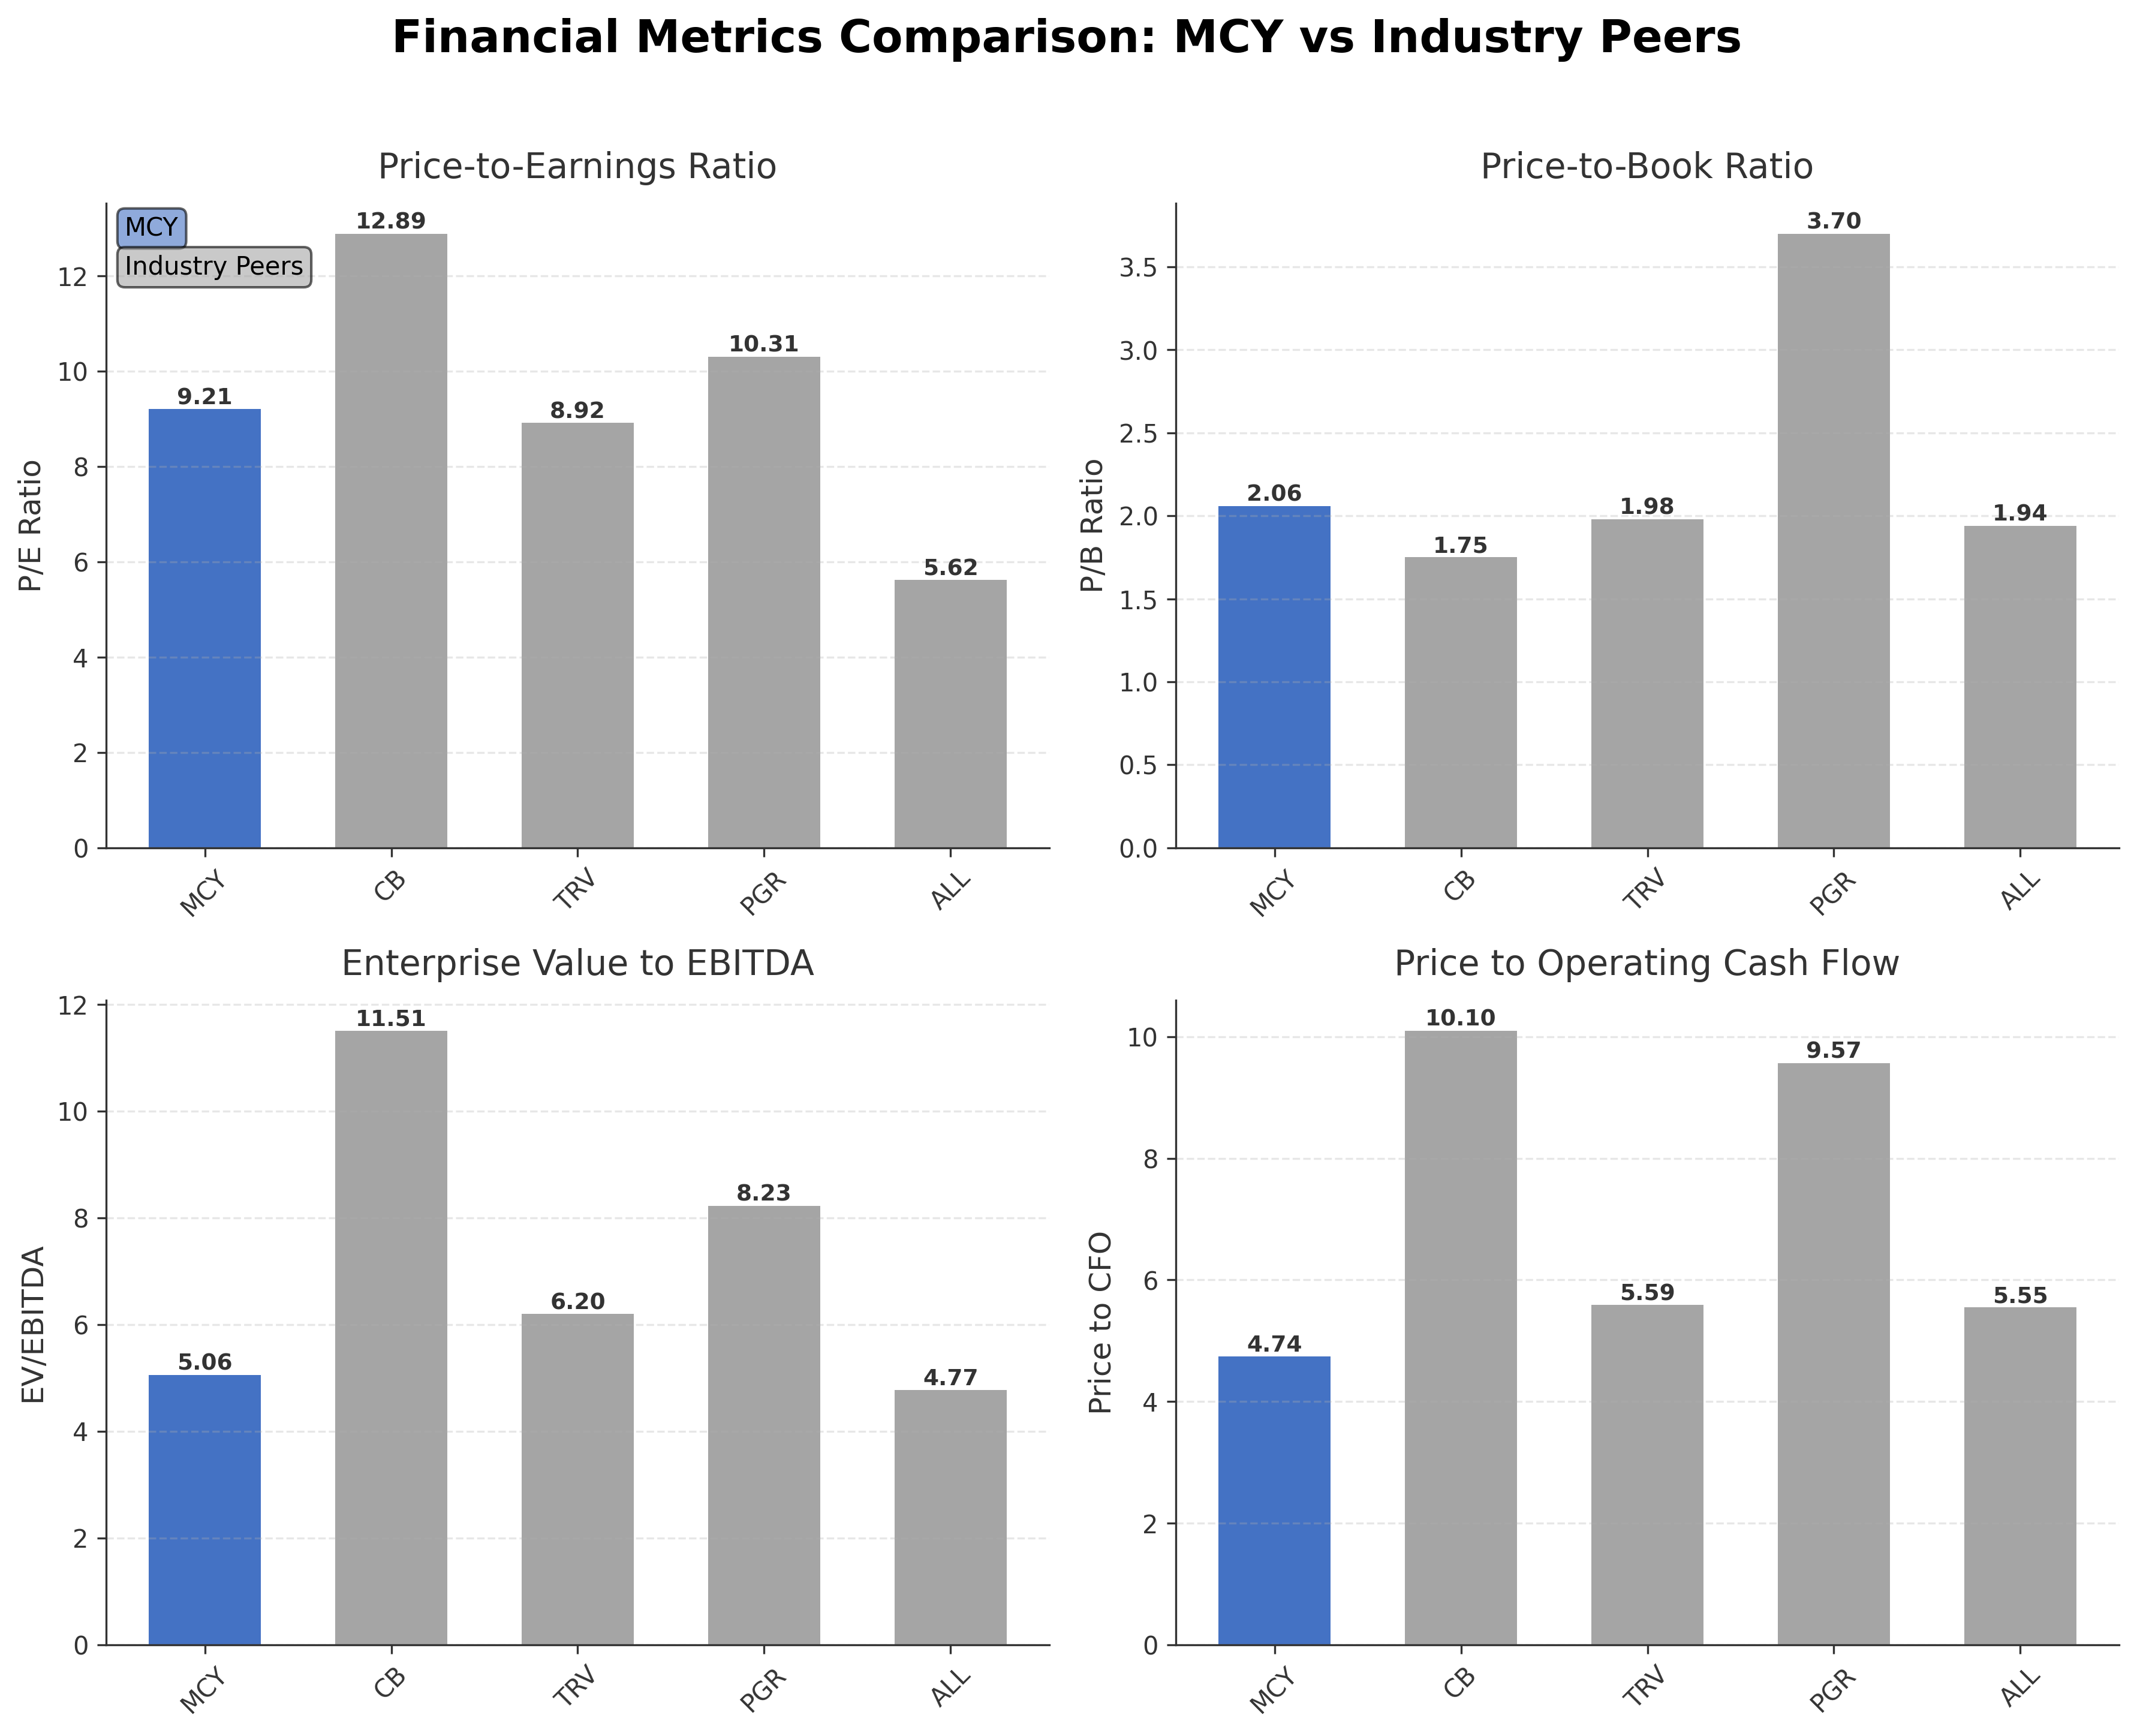
Peer Analysis
| Company Name | Market Cap | P/E Ratio | P/B Ratio | EV/EBITDA | Price to CFO |
|---|---|---|---|---|---|
| Mercury General Corporation | $5.15B | 9.21 | 2.06 | 5.06 | 4.74 |
| Chubb Limited | $129.39B | 12.89 | 1.75 | 11.51 | 10.10 |
| The Travelers Companies, Inc. | $63.97B | 8.92 | 1.98 | 6.20 | 5.59 |
| Progressive Corporation | $118.50B | 10.31 | 3.70 | 8.23 | 9.57 |
| Allstate Corporation | $56.10B | 5.62 | 1.94 | 4.77 | 5.55 |
Comparison Analysis: Mercury General Corporation trades at a moderate valuation with a trailing P/E of 9.21, which is below Chubb Limited’s 12.89 and Progressive Corporation’s 10.31 but above Allstate’s 5.62. Its price-to-book ratio of 2.06 is higher than Chubb and Travelers but lower than Progressive, reflecting a balanced valuation relative to book value. The EV/EBITDA ratio of 5.06 is competitive, indicating efficient earnings relative to enterprise value. Mercury’s return on equity at 24.80% is robust and comparable to Travelers but below Allstate and Progressive, highlighting solid profitability. Price to CFO at 4.74 is the lowest among peers, suggesting attractive cash flow valuation. Overall, Mercury General presents a compelling value proposition with strong profitability metrics relative to its regional industry peers.
Financial Metrics Comparison with Peers
Financial Statements
Comprehensive financial data including income, balance sheet, and cash flow metrics
Income Statement
| fiscal_date | 2025-12-31 | 2024-12-31 | 2023-12-31 | 2022-12-31 | 2021-12-31 |
|---|---|---|---|---|---|
| Sales | 5.99B | 5.48B | 4.63B | 3.64B | 3.99B |
| Operating Expense Other Operating Expenses | 394.23M | 327.16M | 279.66M | 279.72M | 283.40M |
| Non Operating Interest Expense | 28.62M | 30.82M | 24.17M | 17.23M | 17.11M |
| Other Income Expense | 26.79M | 31.52M | 19.61M | 10.31M | 10.02M |
| Pretax Income | 663.65M | 574.88M | 99.43M | -670.72M | 299.31M |
| Income Tax | 122.56M | 106.93M | 3.09M | -158.04M | 51.37M |
| Net Income | 541.09M | 467.95M | 96.34M | -512.67M | 247.94M |
| Eps Basic | 9.77 | 8.45 | 1.74 | -9.26 | 4.48 |
| Eps Diluted | 9.77 | 8.45 | 1.74 | -9.26 | 4.48 |
| Basic Shares Outstanding | 55.39M | 55.37M | 55.37M | 55.37M | 55.37M |
| Diluted Shares Outstanding | 55.39M | 55.37M | 55.37M | 55.37M | 55.37M |
| Ebit | 692.27M | 605.70M | 123.60M | -653.48M | 316.42M |
| Net Income Continuous Operations | 541.09M | 467.95M | 96.34M | -512.67M | 247.94M |
Source: Financial statements and regulatory filings
Balance Sheet
| fiscal_date | 2025-12-31 | 2024-12-31 | 2023-12-31 | 2022-12-31 | 2021-12-31 |
|---|---|---|---|---|---|
| Cash And Cash Equivalents | 1.32B | 720.26M | 550.90M | 289.78M | 335.56M |
| Accounts Receivable | 855.23M | 719.39M | 633.67M | 592.00M | 660.74M |
| Total Assets | 9.56B | 8.31B | N/A | N/A | N/A |
| Total Liabilities | 7.14B | 6.36B | N/A | N/A | N/A |
| Long Term Debt | 586.86M | 587.71M | 587.96M | 420.25M | 407.51M |
| Shareholders Equity | 2.42B | 1.95B | 1.55B | 1.52B | 2.14B |
Source: Financial statements and regulatory filings
Cash Flow Statement
| fiscal_date | 2025-12-31 | 2024-12-31 | 2023-12-31 | 2022-12-31 | 2021-12-31 |
|---|---|---|---|---|---|
| Operating Activities Net Income | 541.09M | 467.95M | 96.34M | -512.67M | 247.94M |
| Operating Activities Other Non Cash Items | 10.00M | -24.33M | -14.58M | -3.63M | 16.48M |
| Operating Activities Accounts Receivable | -135.84M | -85.72M | -41.67M | 68.73M | -23.18M |
| Operating Activities Other Assets Liabilities | 25.24M | 11.99M | 60.95M | -131.50M | -18.10M |
| Operating Activities Operating Cash Flow | 440.49M | 369.90M | 101.03M | -579.07M | 223.28M |
| Investing Activities Capital Expenditures | -24.28M | -33.43M | -6.93M | -35.51M | -41.41M |
| Investing Activities Purchase Of Investments | -3.82B | -3.48B | -2.19B | -2.84B | -2.42B |
| Investing Activities Sale Of Investments | 3.42B | 2.67B | 1.93B | 2.53B | 2.07B |
| Investing Activities Other Investing Activity | 8.20M | 43.74M | -26.06M | 27.87M | 17.40M |
| Investing Activities Investing Cash Flow | -420.16M | -796.66M | -295.44M | -316.38M | -373.67M |
| Financing Activities Long Term Debt Issuance | 0.00 | 0.00 | 175.00M | 25.00M | 0.00 |
| Financing Activities Common Dividends | -70.34M | -70.33M | -70.32M | -105.48M | -140.23M |
| Financing Activities Financing Cash Flow | -70.34M | -71.86M | 103.58M | -81.99M | -141.05M |
| End Cash Position | 1.32B | 720.26M | 550.90M | 289.78M | 335.56M |
| Income Tax Paid | 96.61M | 94.94M | N/A | 26.54M | 69.47M |
| Interest Paid | 28.16M | 30.08M | 23.00M | 16.66M | 16.62M |
| Free Cash Flow | 1.03B | 990.98M | 416.18M | 317.08M | 460.14M |
| Financing Activities Long Term Debt Payments | N/A | -1.53M | -1.10M | -1.50M | -825.00K |
| Operating Activities Stock Based Compensation | N/A | N/A | N/A | N/A | 141.00K |
| Operating Activities Accounts Payable | N/A | N/A | N/A | N/A | N/A |
Source: Financial statements and regulatory filings
Technical Analysis
Key Insights
- Mercury General’s stock exhibits a clear upward trend, with price action forming higher highs and higher lows over recent months.
- Key support levels are identified near $89.25 (50-day moving average) and $82.57 (200-day moving average), while resistance is near the 52-week high of $100.06.
- The current price of $96.25 is above both the 50-day and 200-day moving averages, indicating bullish momentum in the medium to long term.
- Momentum indicators show RSI near 65, suggesting moderate strength without overbought conditions; MACD is positive, confirming upward momentum; Stochastic oscillators indicate sustained buying interest.
- Analysis across daily, weekly, and monthly timeframes consistently supports a bullish trend with no significant reversal signals observed.
- Potential market scenarios include continuation of the upward trend if support holds, or consolidation near resistance levels before a possible breakout or pullback.
Trending News
1. Headline: Lobbying Update: $50,000 of MERCK & CO. INC lobbying was just disclosed | MRK Stock News
Summary: $50,000 of MERCK & CO. INC lobbying was just disclosed, from Q1 of 2026, in a new Lobbying Disclosure Act filing.This included lobbying on issues like:"Issues related to Medicare Part D and Part B Pricing Reform; Issues related to H.R. 4299 - Protecting Patient Access to Cancer and Complex ...
Sentiment: neutral
2. Headline: Why General Motors (GM) Stock Is Up Today
Summary: Shares of automotive manufacturer General Motors (NYSE:GM) jumped 4.7% in the afternoon session after the announcement that the Strait of Hormuz is "completely open," provided massive relief.
Sentiment: positive
3. Headline: Who Owns Mercury Company? – MatrixBCG.com
Summary: George Joseph directly and indirectly ... common stock · BlackRock holds ~12.4% and Vanguard ~9.8% (early 2025) Institutional investors collectively own roughly 45% of shares · Market cap near $3.9 billion in 2025 supports liquidity and growth capital · For context on strategic growth and governance under this ownership mix, see Growth Strategy of Mercury. ... Mercury General Corporation’s board ...
Sentiment: neutral
4. Headline: Do Mercury General’s (MCY) New Safety Efforts Reveal an Underappreciated Risk Management Edge? - Simply Wall St News
Summary: Recently, analyst coverage highlighted Mercury General within the broader property and casualty insurance group, emphasizing its prudent underwriting, exposure growth, digital initiatives, and strong liquidity profile alongside a top industry ranking and upbeat earnings estimates.
Sentiment: positive
5. Headline: Ritholtz Wealth Management Acquires 21,768 Shares of Mercury General Corporation $MCY
Summary: Ritholtz Wealth Management grew its holdings in shares of Mercury General Corporation (NYSE:MCY - Free Report) by 579.7% during the 4th quarter, according to its most recent 13F filing with the Securities and Exchange Commission (SEC). The institutional investor owned 25,523 shares of the insuranc
Sentiment: positive
Recent Updates
News Summary
As of April 13, 2026. Mercury General Corporation announced its first quarter 2026 earnings release date set for May 5, 2026, providing investors with a clear timeline for financial disclosure. The company also revealed a strategic dual listing of its common stock on NYSE Texas, aimed at enhancing liquidity and broadening market access. Recent quarterly results for fiscal 2025 demonstrated stable revenue growth and consistent dividend declarations, underscoring operational strength and shareholder value. Institutional interest is evidenced by significant share accumulation from Ritholtz Wealth Management, indicating positive market sentiment. Governance updates include the upcoming annual meeting with board director elections and executive compensation advisory votes, reflecting ongoing corporate governance practices.
News Sentiment
The overall sentiment from recent updates is predominantly neutral to positive, driven by clear communication of earnings timelines, strategic market expansion through dual listing, and steady financial performance. Institutional buying activity contributes to a positive tone, while governance matters maintain transparency without controversy. No significant negative developments or regulatory challenges were reported, supporting a balanced outlook grounded in operational consistency and shareholder engagement.
Source List
- https://www.marketbeat.com/instant-alerts/filing-ritholtz-wealth-management-acquires-21768-shares-of-mercury-general-corporation-mcy-2026-04-13/
Analytical Overview
Analysis Summary
Mercury General’s valuation metrics, including a trailing P/E of 9.21 and forward P/E of 11.25, are in line with or slightly below industry averages, suggesting reasonable pricing relative to earnings. The company’s PEG ratio of 0.09 indicates undervaluation relative to growth expectations. Revenue growth of 14.1% year-over-year and strong cash flow trends, including over $1 billion in operating cash flow and $2.5 billion in levered free cash flow, highlight a positive growth trajectory. Financial health is supported by a low debt-to-equity ratio of 24.3% and a strong liquidity position with $1.65 billion in cash, indicating solid balance sheet strength. Sector-specific challenges include regulatory scrutiny and competitive pressures in the U.S. insurance market, while opportunities arise from digital initiatives and risk management innovations. Market positioning and competitive advantages are evident in Mercury’s strong underwriting discipline and market leadership in California.
Overall Business and Market Assessment
Supporting Factors: No data
Risk Factors: regulatory developments and competitive dynamics that could impact underwriting margins
SWOT Analysis
Strengths
- Strong return on equity of 24.8% indicating efficient capital use.
- Robust cash flow with $2.52 billion in levered free cash flow.
- Low debt-to-equity ratio of 24.3% supporting financial stability.
- Market leadership in California with a diversified insurance product portfolio.
Weaknesses
- Current ratio of 0.56 suggests limited short-term liquidity.
- Price-to-book ratio above 2 may indicate premium valuation.
- Relatively low dividend yield of 1.37% compared to industry averages.
- Dependence on independent agents may limit direct customer control.
Opportunities
- Expansion through dual listing on NYSE Texas to increase liquidity.
- Increased digital initiatives to enhance underwriting and risk management.
- Growing demand for personal automobile insurance in the U.S. market.
- Potential to leverage safety campaigns to reduce claims and improve margins.
Threats
- Regulatory changes in insurance pricing and underwriting standards.
- Intense competition from larger insurance providers with broader scale.
- Macroeconomic factors affecting consumer insurance purchasing behavior.
- Exposure to catastrophic events impacting claims and profitability.
Company Description
Mercury General Corporation is a prominent insurance holding company that provides a broad range of personal automobile insurance products across the United States. Established in 1961 and headquartered in Los Angeles, California, Mercury General plays a significant role in the insurance sector by offering policies primarily for private passenger vehicles. Beyond basic auto coverage, the company also extends its services to include homeowners, renters, and mechanical breakdown insurance, catering to diverse customer needs. With a focus on customer service and competitive pricing, Mercury General operates through a network of independent agents, facilitating personalized interactions and localized service with policyholders. The company’s strategic emphasis on underwriting discipline and cost management ensures its sustainability and profitability in the highly competitive insurance market. As one of the largest insurers in California, Mercury General holds a strong market position, reflecting its robust financial operations and extensive industry expertise. Its commitment to financial responsibility and adaptability to regulatory changes underscores its significance in the U.S. insurance landscape. Mercury General continues to influence insurance market dynamics through innovation and efficient service delivery.