
Marvell Technology, Inc (MRVL)
Stock Analysis Report
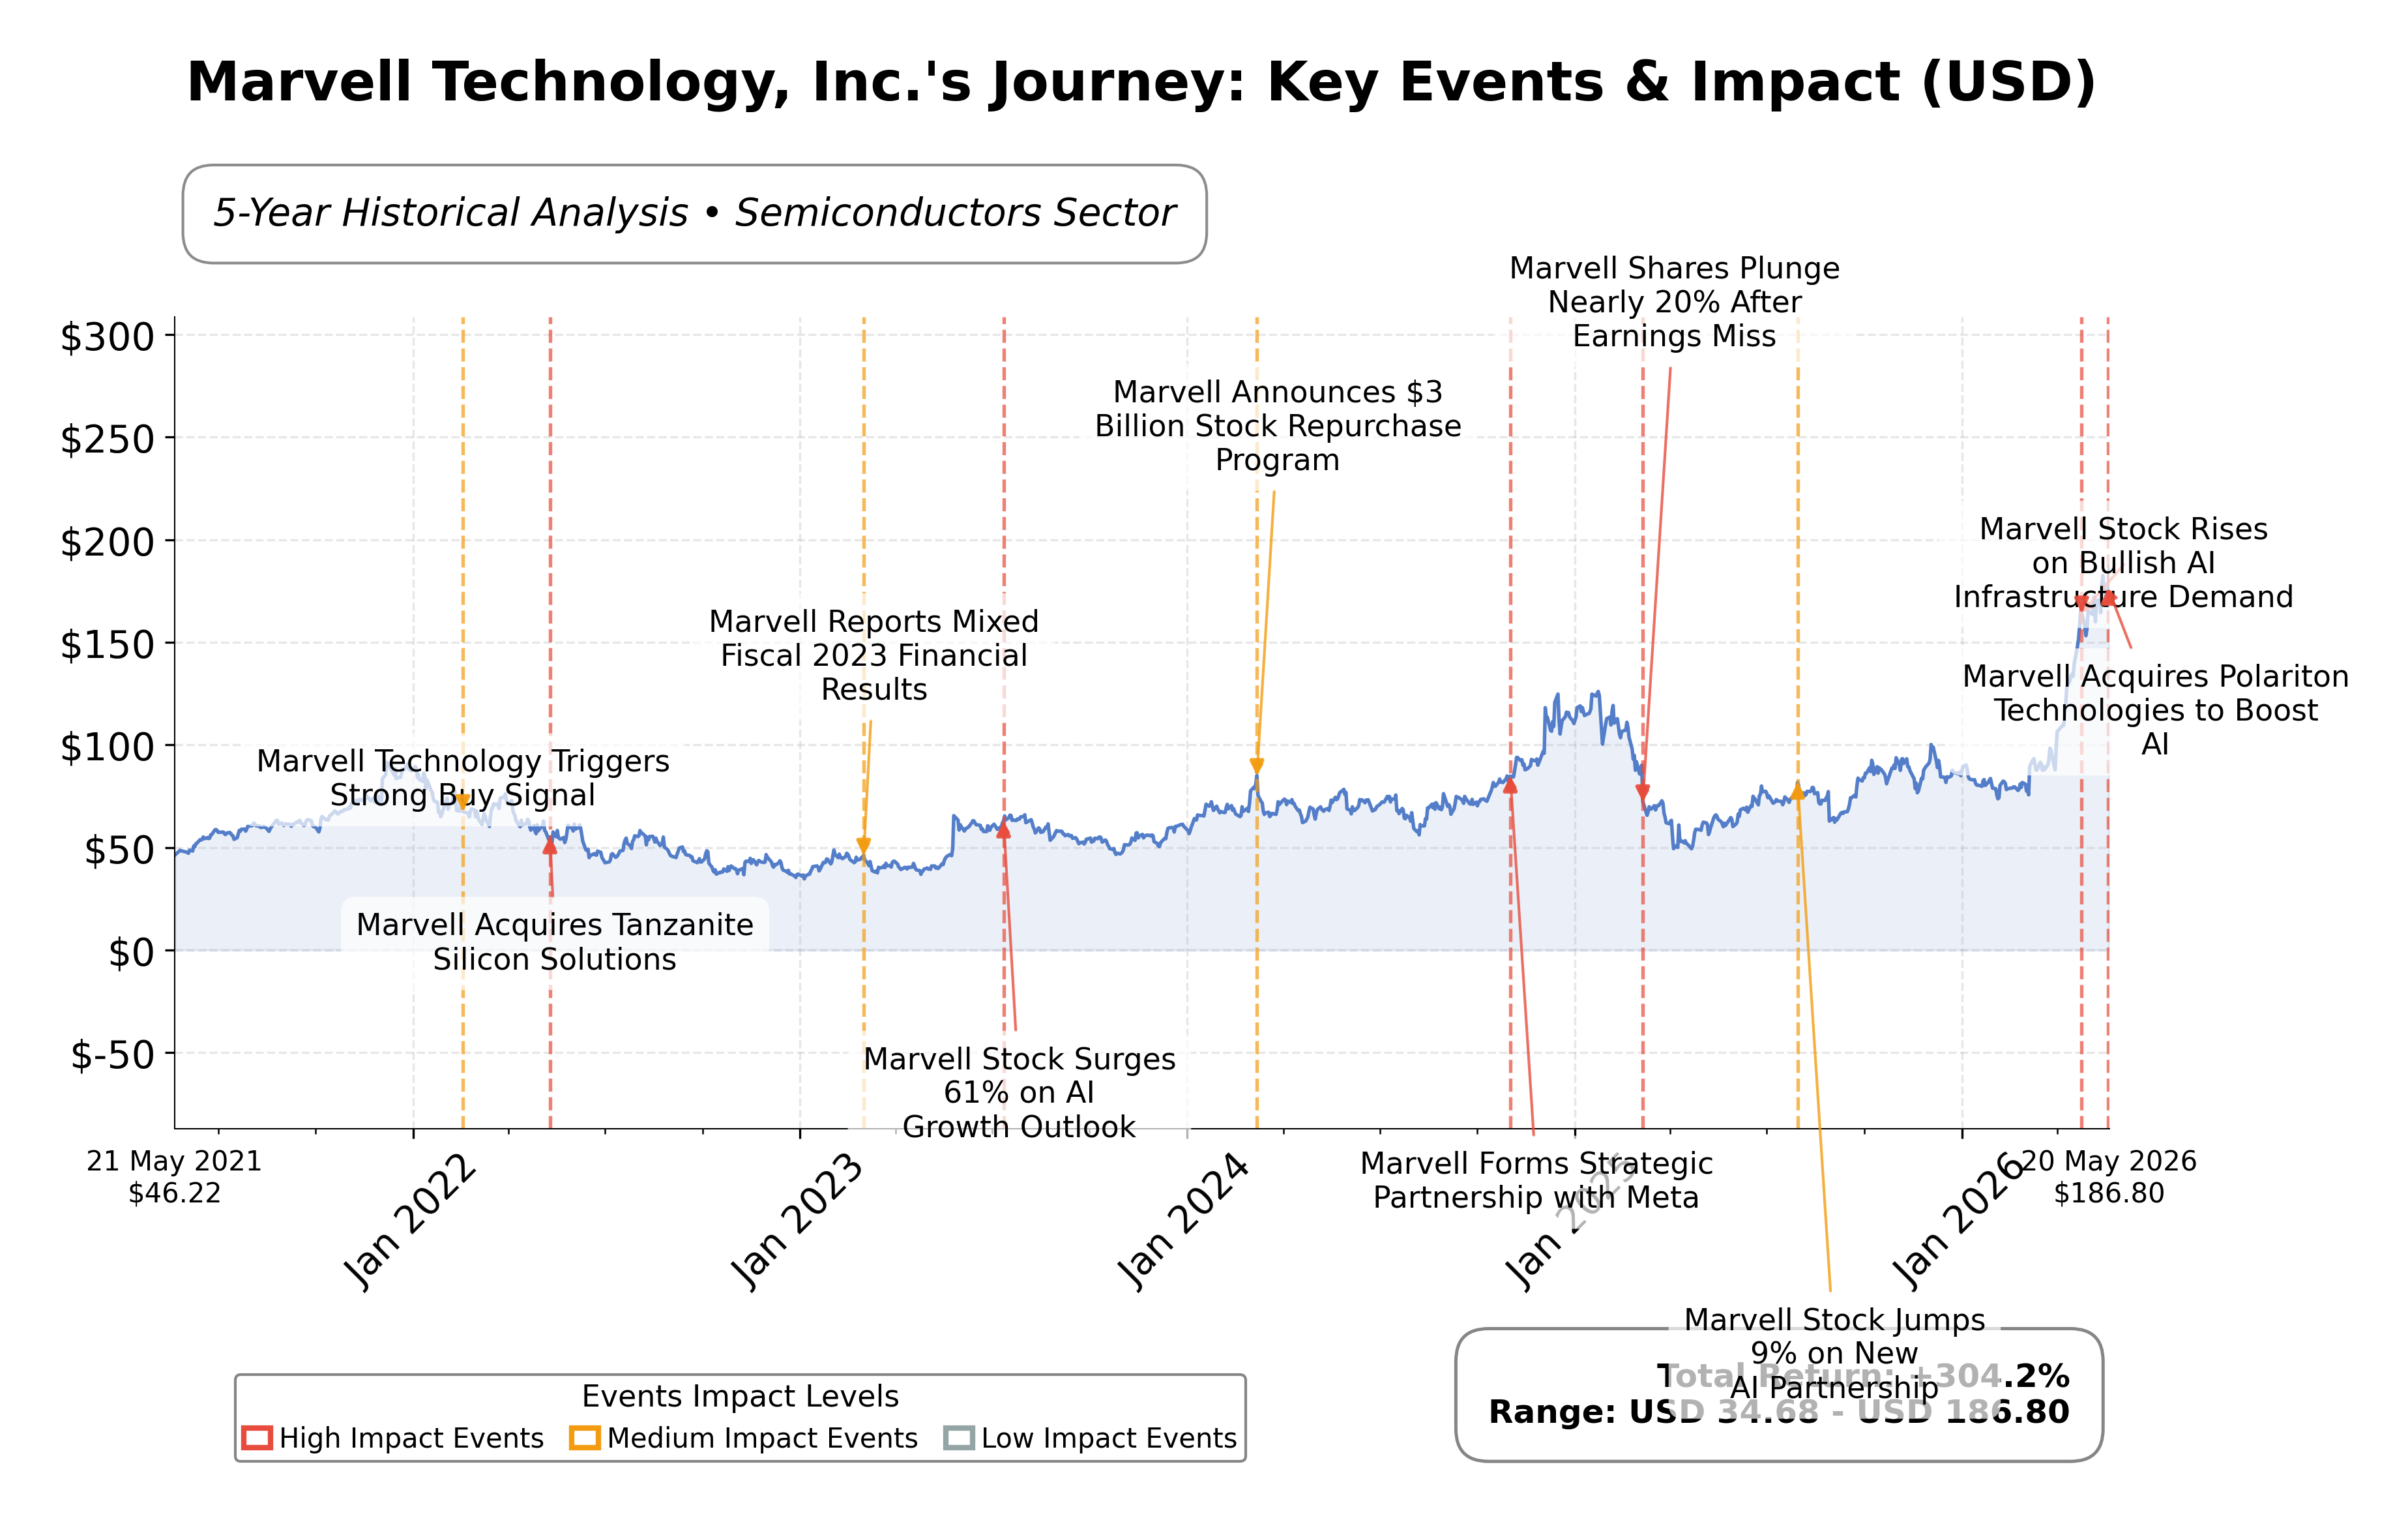
Stock Journey
Key Positives and Key Risks
Pros
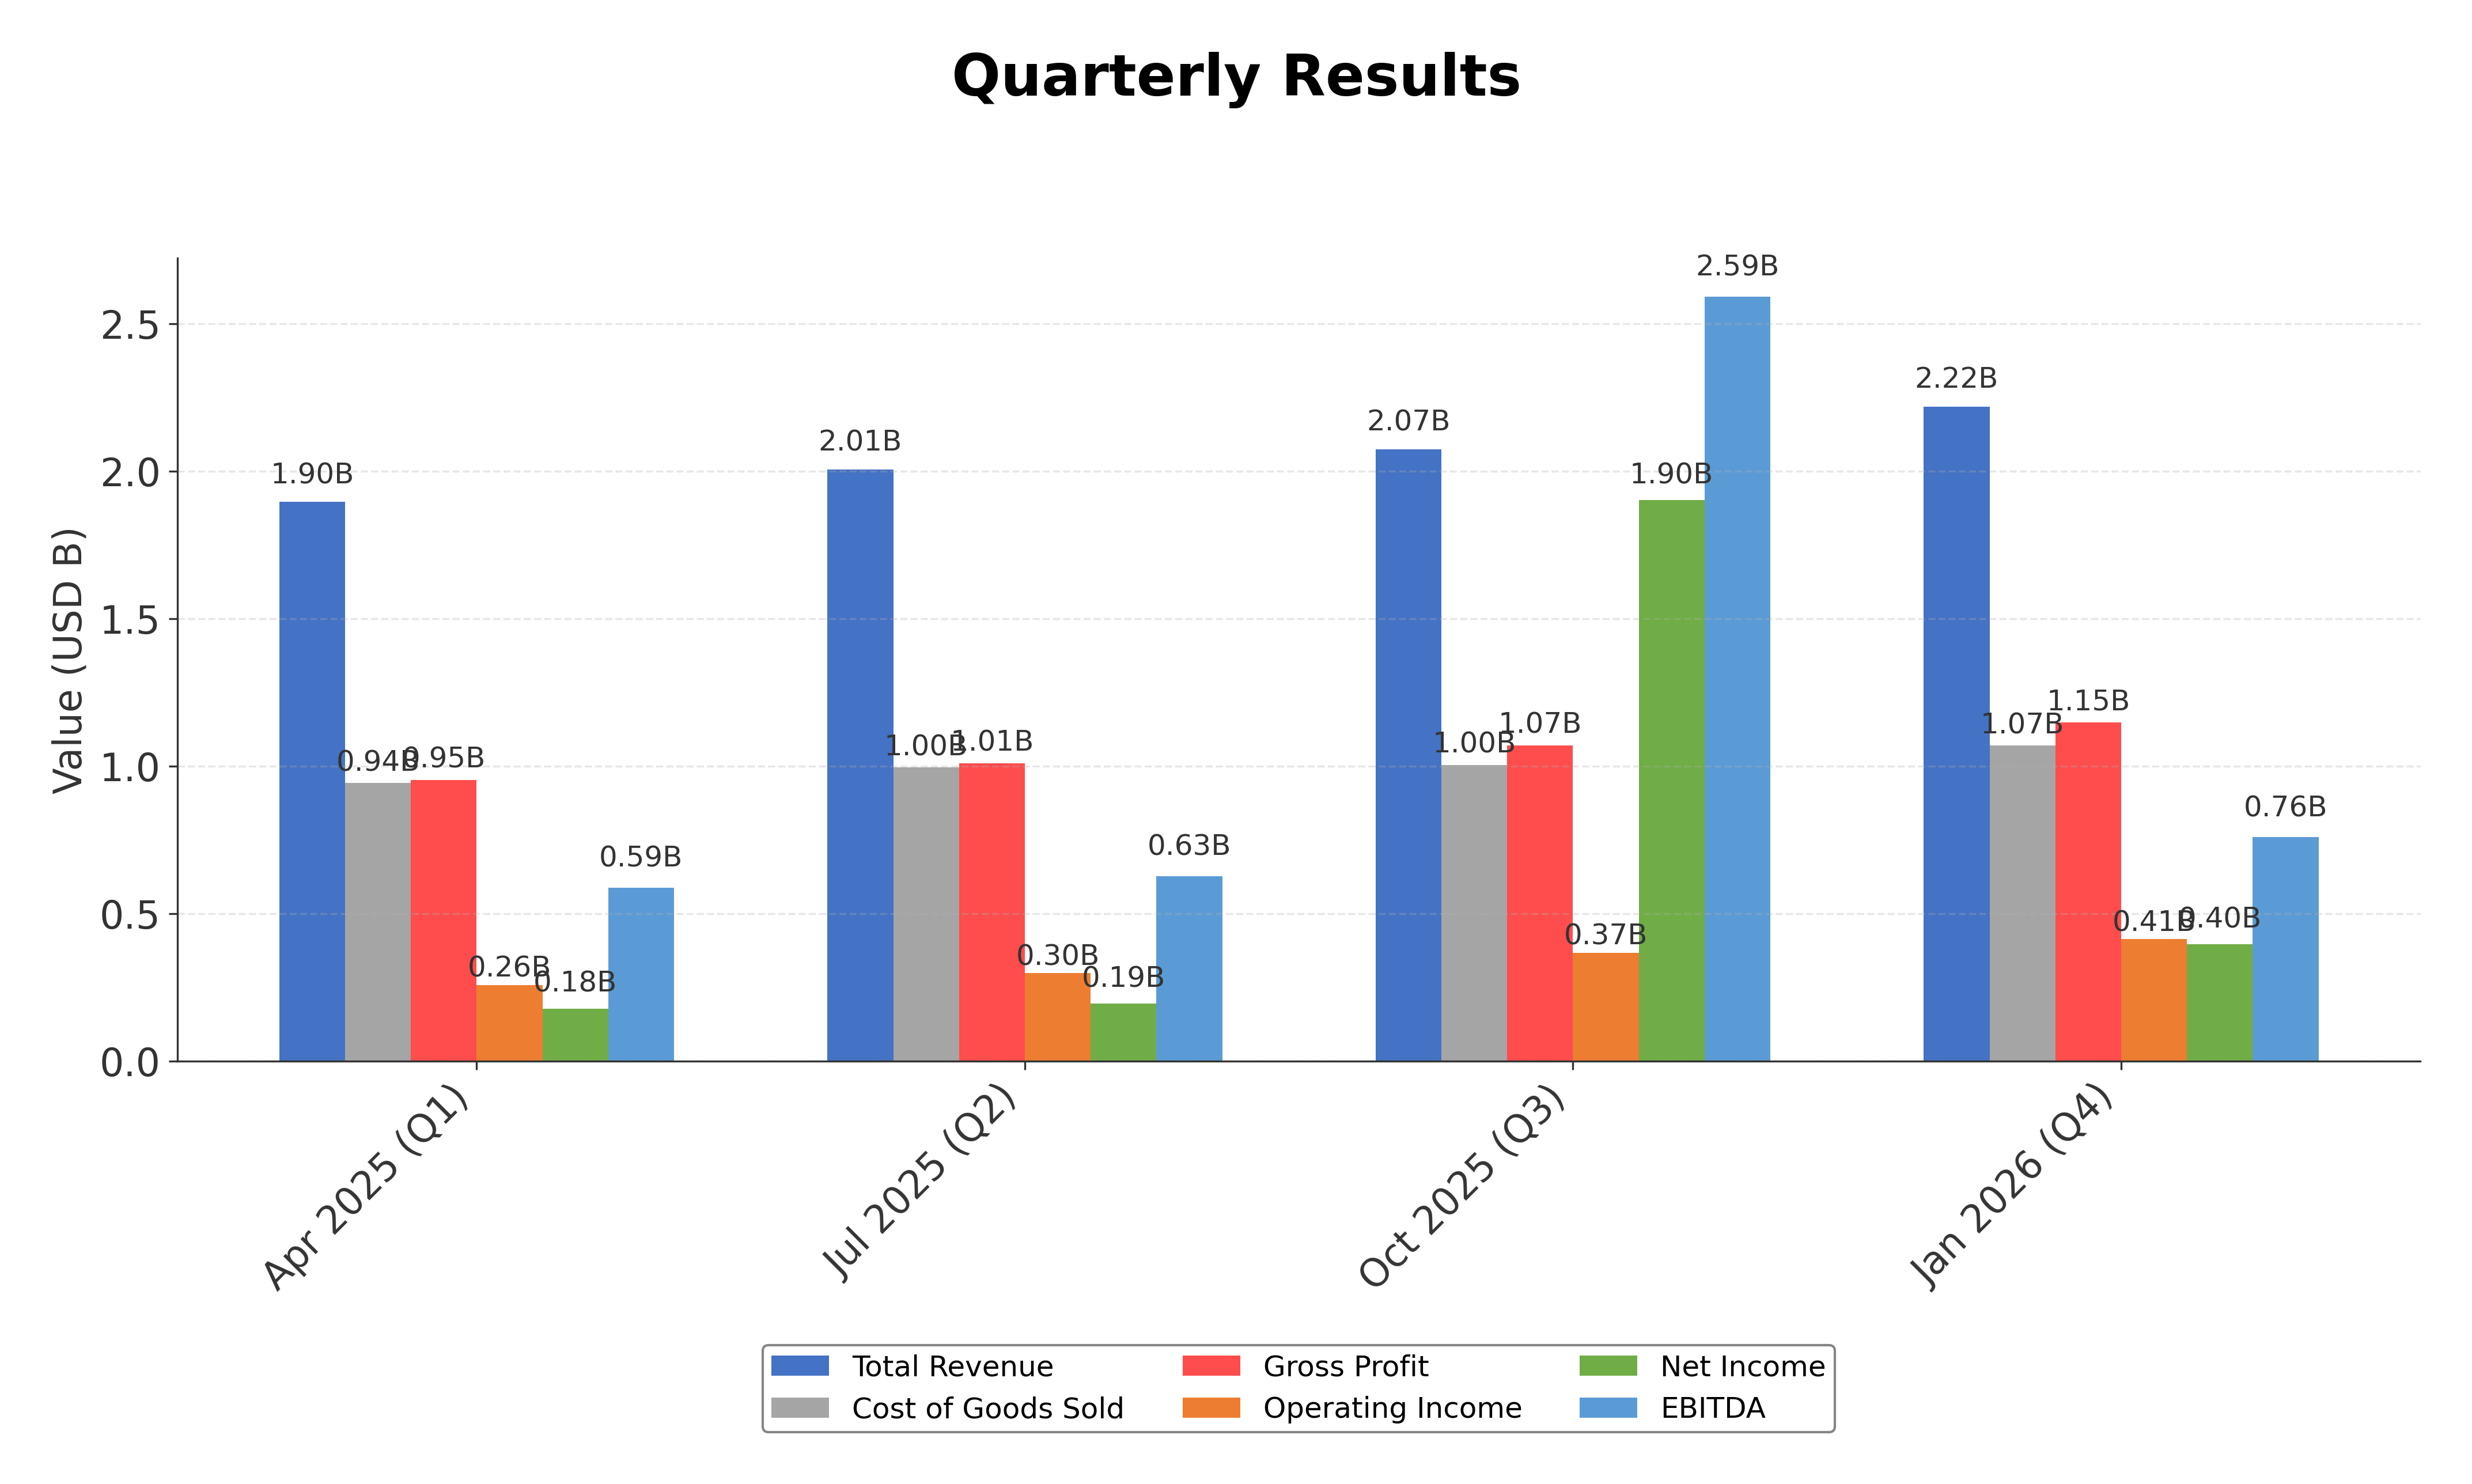
- Strong revenue growth with quarterly revenue increasing 22.1%, reflecting robust demand in AI infrastructure.
- Healthy profitability metrics including a net profit margin of 32.6% and return on equity of 19.25%, indicating efficient capital use.
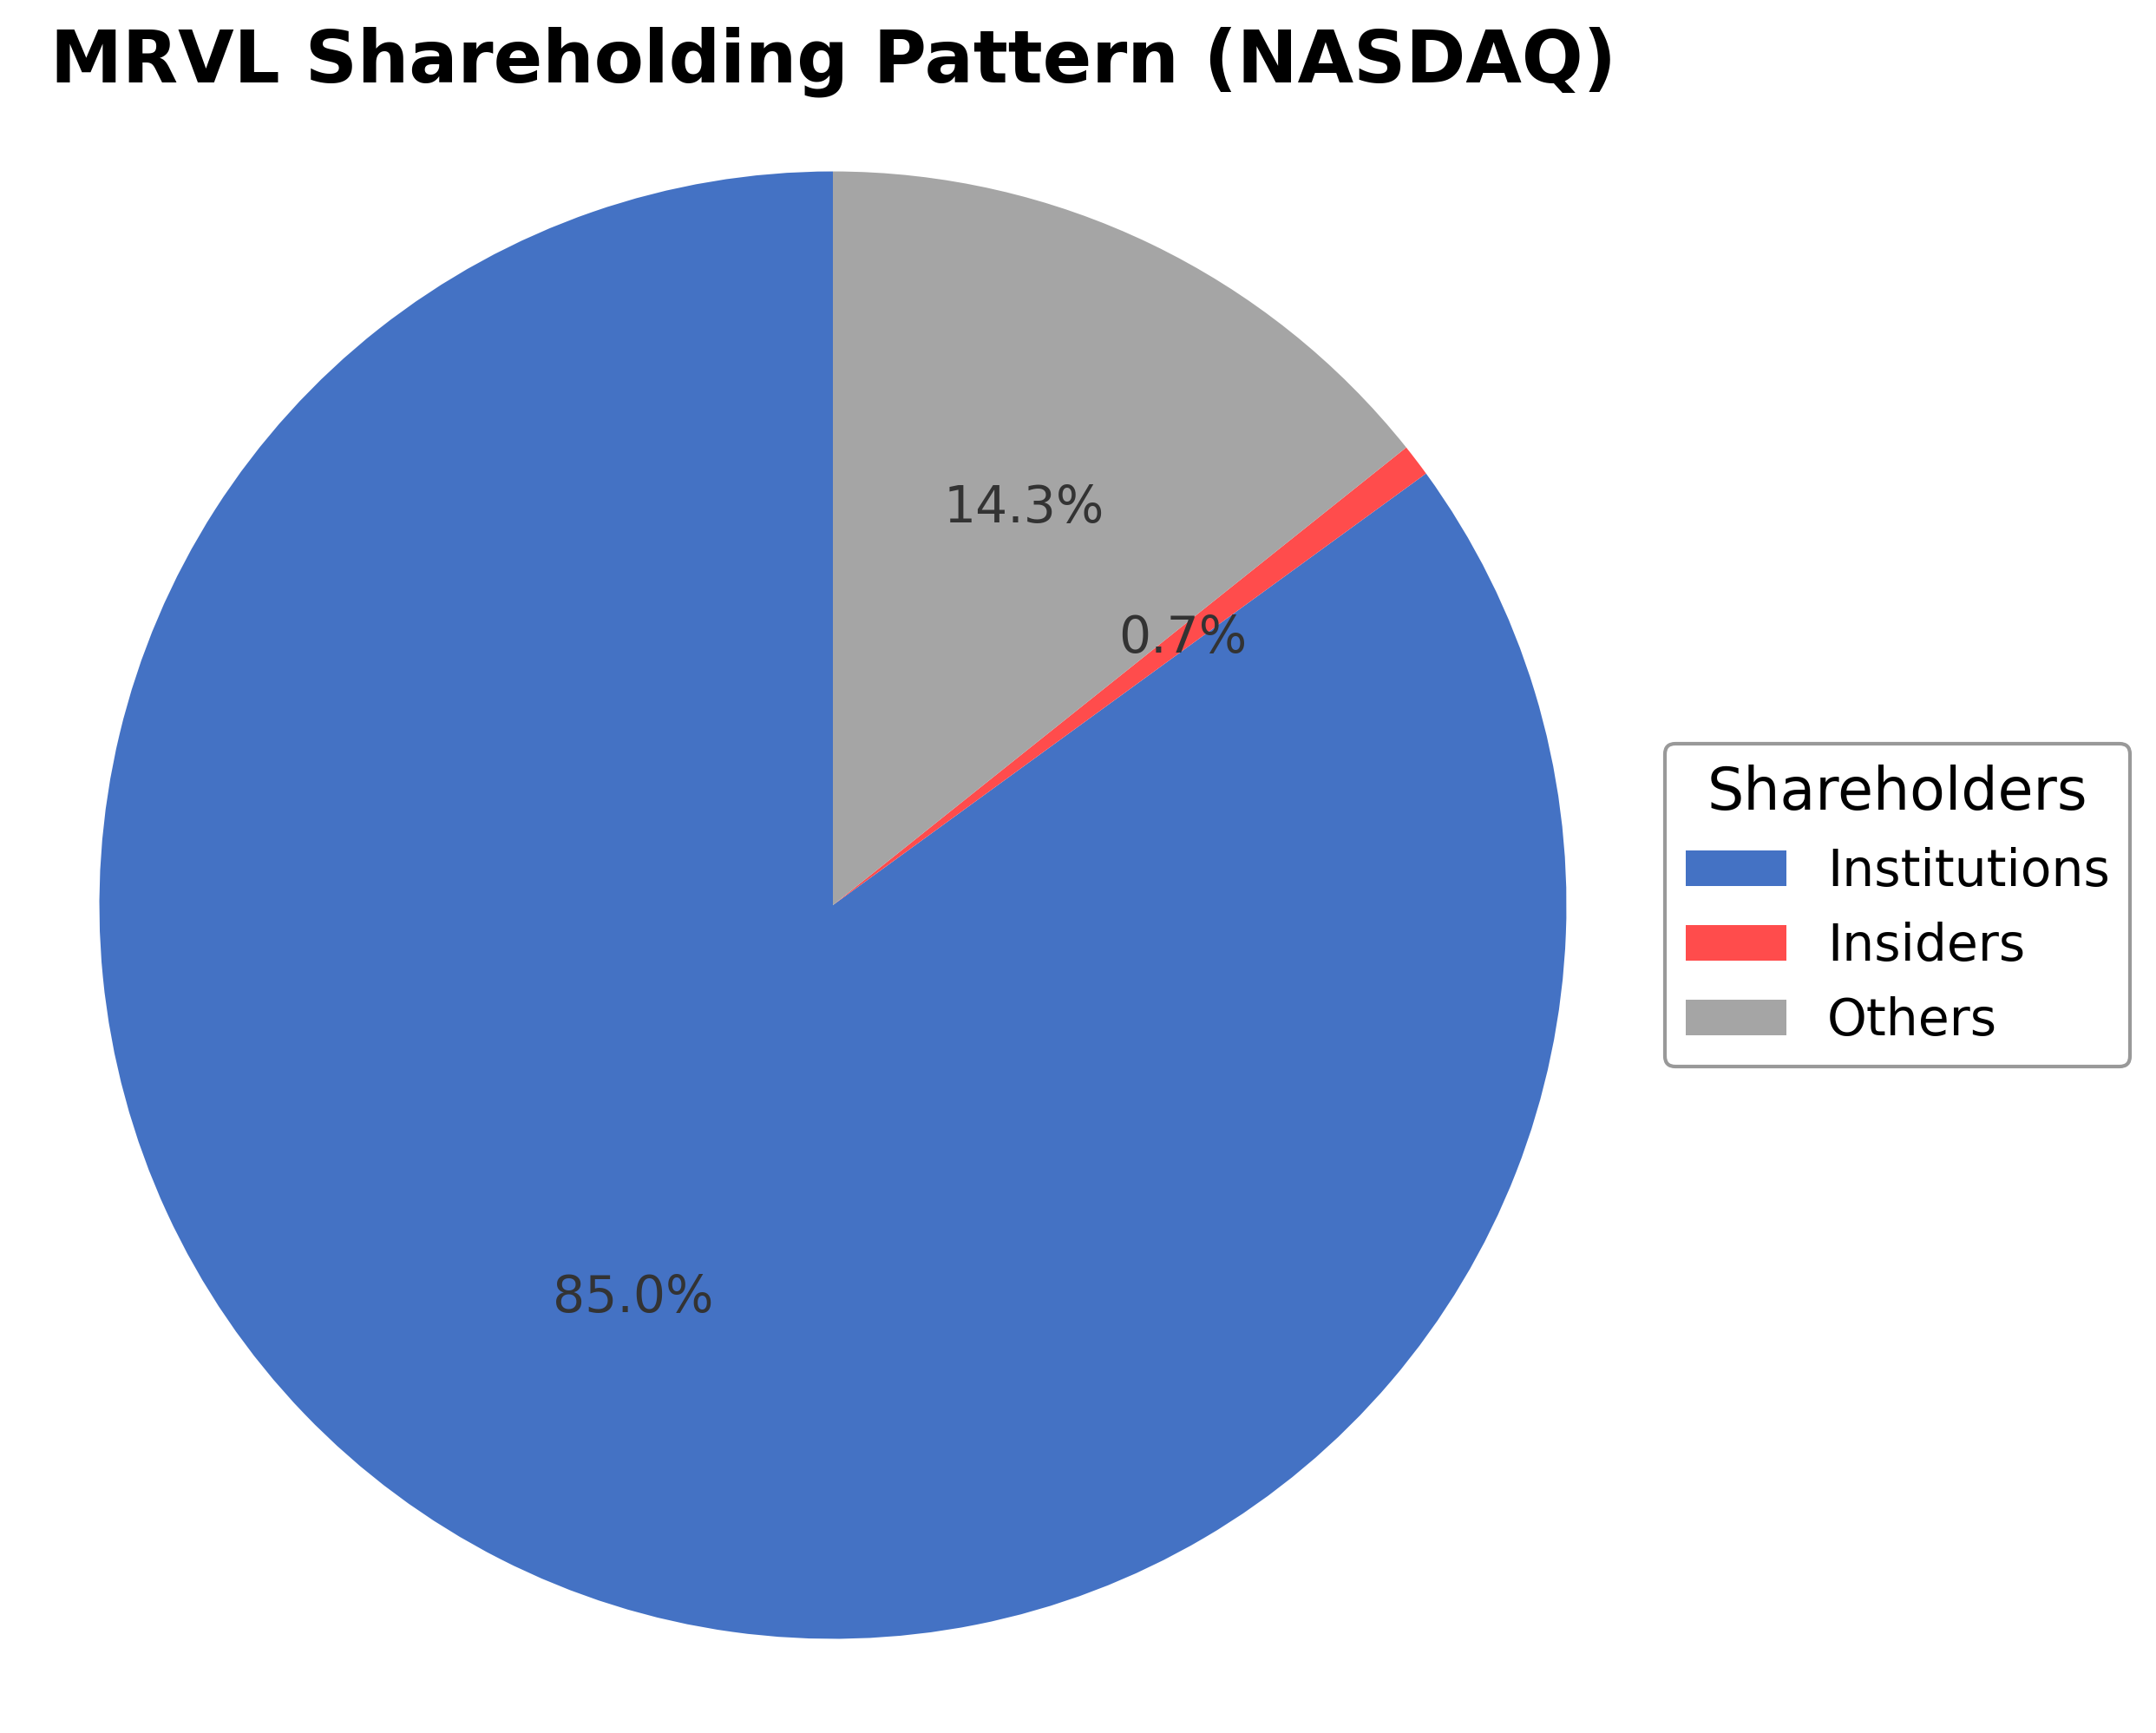
- Substantial institutional ownership at 85.01%, suggesting strong market confidence and governance oversight.
Cons
- High valuation multiples with a trailing P/E of 59.47 and EV/EBITDA of 61.53, implying limited margin for valuation errors.
- Price to cash flow ratio of 88.48 is elevated, indicating premium market pricing relative to cash generation.
- Potential volatility around earnings due to elevated implied volatility and market expectations of a 13% price swing.
Disclosure: This information is for general awareness and does not constitute investment advice
Report Summary
Marvell Technology, Inc. is a prominent player in the semiconductor industry, specializing in data infrastructure semiconductor solutions that serve data centers, enterprise networks, carriers, automotive, and consumer markets. Listed on NASDAQ under the symbol MRVL, the company operates within the technology sector and offers a diverse product portfolio including integrated circuits, system-on-a-chip architectures, ethernet solutions, interconnect products, storage controllers, and custom ASICs. Its global footprint spans key regions such as the United States, Singapore, Israel, India, and China, positioning it as a critical enabler of high-performance digital infrastructure.
Financially, Marvell reported trailing twelve months (TTM) revenue of approximately $8.19 billion with a gross margin of 51.7%, operating margin of 18.7%, and a net profit margin of 32.6%, reflecting robust profitability. The company’s return on equity (ROE) stands at 19.25%, and return on assets (ROA) is 3.94%, indicating efficient use of shareholder capital and assets. Its operating cash flow totaled $1.75 billion TTM, with free cash flow of $1.44 billion, underscoring strong cash generation capabilities.
Valuation metrics reveal a trailing price-to-earnings (P/E) ratio of 59.47 and a forward P/E of 33.66, suggesting the market prices in significant growth expectations. The price-to-book (P/B) ratio is 10.81, and enterprise value to EBITDA (EV/EBITDA) stands at 61.53, indicating a premium valuation relative to earnings. The stock trades near its 52-week high of $192.15, currently priced at $186.74, well above its 52-week low of $58.61, reflecting substantial appreciation over the past year.
Marvell’s strengths include strong institutional ownership at 85%, a healthy current ratio of 2.01, and a manageable debt-to-equity ratio of 33.48%, supporting financial stability. Key risks involve high valuation multiples, competitive pressures in the semiconductor sector, and potential regulatory or geopolitical challenges. Recent strategic developments highlight increasing AI infrastructure demand, analyst upgrades, and growing custom AI chip design wins, reinforcing the company’s market positioning.
Technically, the stock exhibits an upward trend with price action above its 50-day and 200-day moving averages, supported by positive momentum indicators. Market interest is heightened ahead of earnings, with implied volatility signaling potential price swings. Overall, the data suggests a dynamic environment where market participants may consider accumulation or monitoring for further developments, reflecting a balanced but attentive stance.
Company and Industry Overview
Company Basics
Price Performance
Company Size
Shareholding Pattern
Sector and Industry Analysis
The semiconductor sector is a critical component of the global technology industry, underpinning advancements in computing, communications, and consumer electronics. The market size is substantial, with revenues reaching hundreds of billions annually, driven by increasing demand for data centers, AI, 5G infrastructure, and IoT devices. Major players include Intel, NVIDIA, Qualcomm, and Marvell Technology, each competing in specialized segments such as processors, networking chips, and custom silicon solutions.
Industry trends emphasize innovation in AI-specific chips, high-bandwidth memory, and advanced packaging technologies like 3nm process nodes and optical interconnects. Competitive dynamics are shaped by rapid technological evolution, high R&D intensity, and strategic partnerships, such as Marvell’s collaboration with NVIDIA. Barriers to entry remain high due to capital-intensive manufacturing, complex supply chains, and the need for cutting-edge intellectual property and design expertise.
The regulatory landscape for semiconductors involves export controls, intellectual property protections, and environmental standards that vary globally. Recent geopolitical tensions have led to tighter export restrictions on advanced chip technologies, impacting supply chains and market access. Compliance with these regulations requires ongoing adaptation by companies, influencing strategic decisions around manufacturing locations, partnerships, and product development.
Note: Analysis synthesized from industry research, market reports, and regulatory filings. Information is subject to change based on market conditions.
Financial Ratios Dashboard
Illustrative Scenario Analysis
DCF Assumptions:
Method: Two-Stage EPS-Priority Model
Financials
Peer Analysis
| Company Name | Market Cap | P/E Ratio | P/B Ratio | EV/EBITDA | Price to CFO |
|---|---|---|---|---|---|
| Marvell Technology, Inc. | $154.88B | 59.47 | 10.81 | 61.52 | 88.48 |
| NVIDIA Corporation | $5.46T | 48.11 | 36.42 | 42.61 | 53.13 |
| NXP Semiconductors N.V. | $73.60B | 28.10 | 6.80 | 17.26 | 24.15 |
| Taiwan Semiconductor Manufacturing Co. Ltd. ADR | $2.10T | 34.71 | 89.49 | 2.86 | 28.19 |
| Analog Devices, Inc. | $203.82B | 76.94 | 6.25 | 39.52 | 40.33 |
| Texas Instruments Inc | $275.51B | 52.59 | 16.71 | 33.40 | 35.21 |
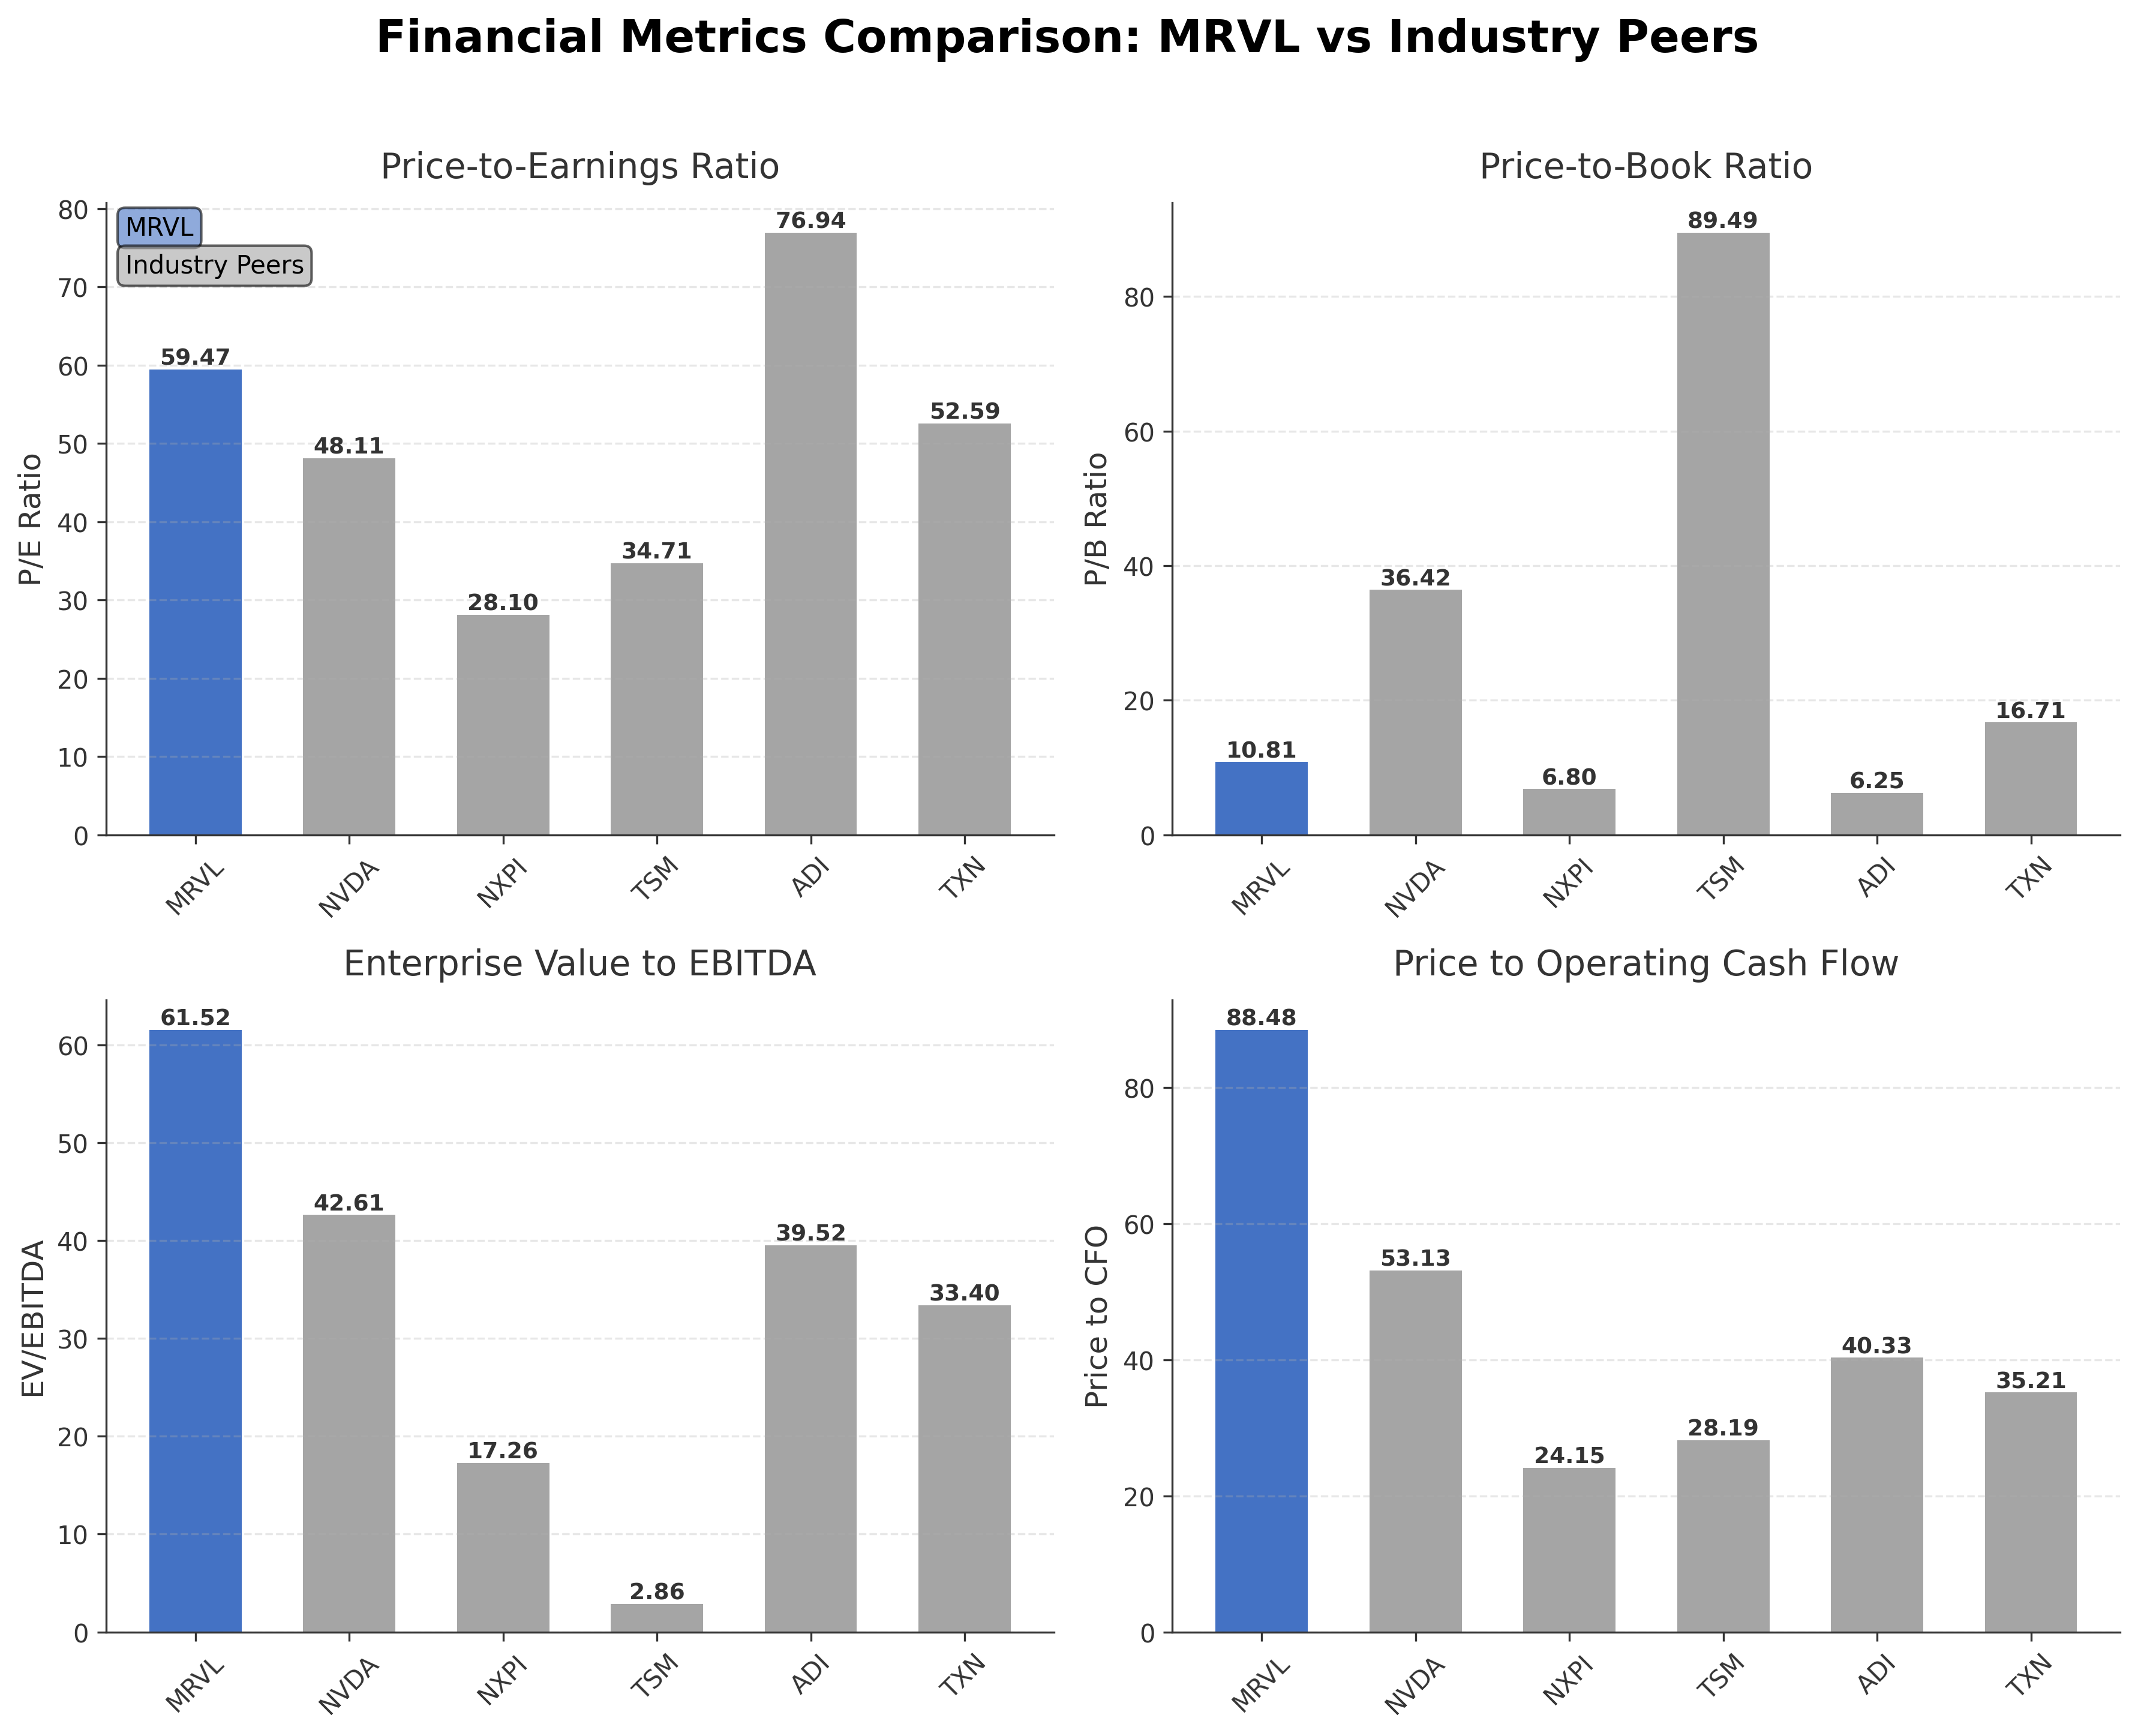
Comparison Analysis: Marvell Technology trades at a premium valuation relative to its semiconductor peers, with a trailing P/E of 59.47 exceeding the industry range, reflecting strong growth expectations. Its price-to-book ratio of 10.81 is moderate compared to peers like NVIDIA and TSM, which have higher P/B ratios. The EV/EBITDA multiple of 61.52 is notably higher than most peers, indicating a rich valuation relative to earnings before interest, taxes, depreciation, and amortization. Marvell’s return on equity of 19.25% is competitive, though lower than NVIDIA’s exceptional 101%, but higher than Analog Devices and Intel. Price to cash flow is elevated at 88.48, suggesting market optimism about future cash generation. Overall, Marvell stands out for its growth potential but at a valuation premium compared to regional industry competitors.
Financial Metrics Comparison with Peers
Financial Statements
Comprehensive financial data including income, balance sheet, and cash flow metrics
Income Statement
| fiscal_date | 2026-01-31 | 2025-01-31 | 2024-01-31 | 2023-01-31 | 2022-01-31 |
|---|---|---|---|---|---|
| Sales | 8.19B | 5.77B | 5.51B | 5.92B | 4.46B |
| Cost Of Goods | 4.01B | 3.39B | 3.21B | 2.93B | 2.40B |
| Gross Profit | 4.18B | 2.38B | 2.29B | 2.99B | 2.06B |
| Operating Expense Research And Development | 2.08B | 1.95B | 1.90B | 1.78B | 1.42B |
| Operating Expense Selling General And Administrative | 767.10M | 798.20M | 834.00M | 843.60M | 955.30M |
| Operating Income | 1.34B | -366.40M | -436.60M | 359.60M | -315.30M |
| Non Operating Interest Income | 1.93B | 15.00M | 8.80M | 5.30M | 800.00K |
| Non Operating Interest Expense | 202.60M | 189.40M | 211.70M | 170.60M | 139.30M |
| Other Income Expense | -15.50M | -353.90M | -119.20M | -109.20M | -29.70M |
| Pretax Income | 3.05B | -894.70M | -758.70M | 85.10M | -483.50M |
| Income Tax | 376.50M | -9.70M | 174.70M | 248.60M | -62.50M |
| Net Income | 2.67B | -885.00M | -933.40M | -163.50M | -421.00M |
| Eps Basic | 3.10 | -1.02 | -1.08 | -0.19 | -0.53 |
| Eps Diluted | 3.07 | -1.02 | -1.08 | -0.19 | -0.53 |
| Basic Shares Outstanding | 861.00M | 865.50M | 861.30M | 851.40M | 796.86M |
| Diluted Shares Outstanding | 861.00M | 865.50M | 861.30M | 851.40M | 796.86M |
| Ebit | 3.25B | -705.30M | -547.00M | 255.70M | -344.20M |
| Ebitda | 4.56B | 1.01B | 981.80M | 1.77B | 933.50M |
| Net Income Continuous Operations | 2.67B | -885.00M | -933.40M | -163.50M | -421.00M |
Source: Financial statements and regulatory filings
Balance Sheet
| fiscal_date | 2026-01-31 | 2025-01-31 | 2024-01-31 | 2023-01-31 | 2022-01-31 |
|---|---|---|---|---|---|
| Cash And Cash Equivalents | 2.64B | 948.30M | 950.80M | 911.00M | 613.50M |
| Accounts Receivable | 2.19B | 1.03B | 1.12B | 1.19B | 1.05B |
| Total Assets | 22.29B | 20.20B | 21.23B | 22.52B | 22.11B |
| Total Liabilities | 7.98B | 6.78B | 6.40B | 6.88B | 6.41B |
| Long Term Debt | 4.23B | 4.17B | 4.25B | 4.11B | 4.63B |
| Shareholders Equity | 14.31B | 13.43B | 14.83B | 15.64B | 15.70B |
Source: Financial statements and regulatory filings
Cash Flow Statement
| fiscal_date | 2026-01-31 | 2025-01-31 | 2024-01-31 | 2023-01-31 | 2022-01-31 |
|---|---|---|---|---|---|
| Operating Activities Net Income | 2.67B | -885.00M | -933.40M | -163.50M | -421.00M |
| Operating Activities Depreciation | 1.29B | 1.36B | 1.40B | 1.39B | 1.25B |
| Operating Activities Deferred Taxes | 42.20M | -111.90M | 150.80M | 50.40M | -93.90M |
| Operating Activities Stock Based Compensation | 590.80M | 597.40M | 609.80M | 552.40M | 460.70M |
| Operating Activities Other Non Cash Items | 95.50M | 65.90M | 54.90M | 101.40M | 284.90M |
| Operating Activities Accounts Receivable | -1.16B | 93.20M | 70.60M | -142.70M | -409.00M |
| Operating Activities Accounts Payable | 299.30M | 181.50M | -149.10M | -87.80M | 93.20M |
| Operating Activities Other Assets Liabilities | -389.80M | -230.00M | 220.20M | -383.40M | -262.30M |
| Operating Activities Operating Cash Flow | 3.44B | 1.07B | 1.42B | 1.32B | 897.90M |
| Investing Activities Capital Expenditures | -326.70M | -284.60M | -336.30M | -206.20M | -169.20M |
| Investing Activities Net Intangibles | -4.50M | -7.00M | -13.90M | -11.10M | -17.70M |
| Investing Activities Net Acquisitions | 2.48B | -10.40M | 0.00 | -112.30M | -3.56B |
| Investing Activities Other Investing Activity | -49.60M | 1.30M | -300.00K | 1.20M | -3.20M |
| Investing Activities Investing Cash Flow | 2.10B | -293.70M | -336.60M | -317.30M | -3.73B |
| Financing Activities Long Term Debt Issuance | 1.20B | 0.00 | 1.30B | 200.00M | 3.90B |
| Financing Activities Long Term Debt Payments | -790.60M | -109.40M | -1.62B | -265.60M | -708.00M |
| Financing Activities Common Stock Repurchase | -2.04B | -725.00M | -150.00M | -115.00M | 0.00 |
| Financing Activities Common Dividends | -205.10M | -207.50M | -206.80M | -204.40M | -191.00M |
| Financing Activities Other Financing Charges | -399.30M | -428.70M | -395.40M | -369.20M | -290.80M |
| Financing Activities Financing Cash Flow | -2.24B | -1.47B | -1.08B | -754.20M | 2.71B |
| End Cash Position | 2.64B | 948.30M | 950.80M | 911.00M | 613.50M |
| Income Tax Paid | 92.10M | 40.10M | 120.60M | 95.90M | 7.90M |
| Interest Paid | 177.70M | 173.40M | 173.70M | 147.90M | 91.20M |
| Free Cash Flow | 1.39B | 1.39B | 1.02B | 1.07B | 632.40M |
| Investing Activities Sale Of Investments | N/A | N/A | N/A | N/A | 0.00 |
| Investing Activities Purchase Of Investments | N/A | N/A | N/A | N/A | N/A |
Source: Financial statements and regulatory filings
Technical Analysis
Key Insights
- The current trend for Marvell Technology is upward, with price action showing higher highs and higher lows, indicating bullish momentum.
- Key support levels are identified near $125 and $90, while resistance is observed around the 52-week high of $192.15.
- The stock price is trading above the 10-day, 50-day ($126.17), and 200-day ($92.75) moving averages, suggesting sustained positive momentum.
- Momentum indicators show RSI in the upper range, indicating strong buying pressure; MACD is positive with a bullish crossover; stochastic oscillator suggests the stock is approaching overbought levels.
- Across daily, weekly, and monthly timeframes, the stock maintains a bullish trend with consistent volume support and positive momentum signals.
- Potential market scenarios include continuation of the uptrend if support holds, with possible volatility around earnings due to elevated implied volatility and market anticipation.
Trending News
1. Headline: Marvell Technology stock may swing 13% on earnings By Investing.com
Summary: Investing.com -- Marvell Technology Inc. (NASDAQ:MRVL) shares could move 13% when the company reports earnings on May 27 after the market close, according to options data compiled by Bloomberg. The chipmaker has exceeded the implied move in five of its past eight earnings announcements. On March 5, the stock ...
Sentiment: positive
2. Headline: Marvell Technology Stock (MRVL) Opinions on Analyst Upgrades and AI Silicon Partnerships | MRVL Stock News
Summary: You can access data on insider stock transactions through the Quiver Quantitative API insider transaction endpoint. ... Get market-moving data, filings, and signals for MRVL in real time. Sign Up · Marvell Technology had revenues of $2.2B in Q4 2026. This is an increase of 22.08% from the ...
Sentiment: positive
3. Headline: Why Marvell Technology Stock Is Moving On Up | The Motley Fool
Summary: Citi's mainly playing catch-up ... stocks long after they've already skyrocketed. Yesterday, Citi nearly doubled its price target on Micron (MU +4.60%). Today, it's Marvell's turn, at the PT rises from $118 to $215 (also nearly a double). As for the others, both Oppy and Wells cite Trainium chip sales to Anthropic, Amazon.com (AMZN +2.14%), and others as a major catalyst for Marvell. Oppenheimer forecasts $2 billion in custom chip sales (including Trainium) ...
Sentiment: positive
4. Headline: Evercore ISI Raises Marvell Technology (MRVL) Price Target on Rising AI Infrastructure Demand
Summary: READ NEXT: 11 Best Dividend Penny Stocks to Buy Right Now and 10 Best “Dogs of the Dow” Stocks to Buy for the Rest of 2026 · Disclosure: None. Follow Insider Monkey on Google News. ... MRVL Marvell Technology, Inc.
Sentiment: positive
5. Headline: Marvell moves as earnings nears, eyes on AI chips
Summary: Marvell Technology, Inc. But the risks are obvious. Options market data shows implied volatility is running in the top 10% for the year, with traders pricing about a 50% shot Marvell swings more than 13.23%, or $22.51, on its results. With the stock up, there isn’t much safety if Nvidia misses ...
Sentiment: positive
Recent Updates
News Summary
As of 2026-05-20. Marvell Technology reported record Q3 FY2026 revenue of $2.07 billion, a 37% increase year-over-year, driven primarily by data center sales which accounted for 73% of total revenue and grew 38% year-over-year. The company achieved a non-GAAP EPS of $0.76, up from $0.43 in the prior year, reflecting strong operational performance. Institutional investor ProShare Advisors LLC increased its holdings by 43.1% in the fourth quarter, indicating growing confidence in Marvell's prospects. Ahead of the May 27 earnings release, options market data suggests a potential 13% stock price swing, highlighting elevated market anticipation. Additionally, Evercore ISI raised its price target on Marvell, citing rising AI infrastructure demand and a shift toward inference-led AI workloads, which is expected to boost demand for custom ASICs. These developments underscore Marvell's strategic positioning in the AI semiconductor market and its robust financial momentum.
News Sentiment
The overall sentiment from recent updates is predominantly positive, driven by strong revenue growth, expanding AI-related partnerships, and increased institutional ownership. The record quarterly revenue and earnings growth reinforce confidence in Marvell's operational execution and market positioning. Analyst upgrades and raised price targets reflect optimism about the company's exposure to AI infrastructure demand. However, the heightened implied volatility ahead of earnings introduces an element of uncertainty, reflecting cautious market expectations. The combination of robust fundamentals and market anticipation results in a balanced but favorable sentiment toward Marvell's near-term outlook.
Source List
- https://www.marketbeat.com/instant-alerts/filing-proshare-advisors-llc-increases-stock-holdings-in-marvell-technology-inc-mrvl-2026-05-20/
Analytical Overview
Analysis Summary
Marvell Technology's valuation metrics, including a trailing P/E of 59.47 and forward P/E of 33.66, are elevated relative to the semiconductor industry average, reflecting significant growth expectations but also limited margin for valuation error. The company demonstrates a strong growth trajectory with 22.1% quarterly revenue growth and robust cash flow generation, evidenced by $1.75 billion in operating cash flow and $1.44 billion in free cash flow TTM. Financial health appears solid with a manageable debt-to-equity ratio of 33.48% and a current ratio of 2.01, indicating good liquidity and balance sheet strength. Sector-specific opportunities include rising demand for AI infrastructure and custom silicon solutions, while challenges encompass intense competition and potential macroeconomic headwinds. Given Marvell operates in the U.S. technology sector, market positioning and competitive advantages in AI chip design are critical factors influencing its outlook.
Overall Business and Market Assessment
Supporting Factors: strong revenue and earnings growth driven by AI infrastructure demand, solid cash flow generation, and increasing institutional ownership signaling market confidence
Risk Factors: high valuation multiples that may limit upside, competitive pressures from larger semiconductor firms, and potential volatility around earnings announcements
SWOT Analysis
Strengths
- Robust revenue growth driven by AI infrastructure demand.
- Strong profitability with a net profit margin of 32.6%.
- High institutional ownership supporting governance and stability.
- Diverse product portfolio serving multiple high-growth markets.
Weaknesses
- Elevated valuation multiples increase sensitivity to market corrections.
- Relatively modest return on assets at 3.94%.
- Limited insider ownership may reduce alignment with shareholder interests.
- High price to cash flow ratio indicating premium market pricing.
Opportunities
- Expanding AI custom silicon design wins across multiple customers.
- Growing demand for data center and network edge semiconductor solutions.
- Strategic partnerships and acquisitions enhancing product capabilities.
- Shift toward inference-led AI workloads increasing ASIC demand.
Threats
- Intense competition from larger semiconductor companies.
- Geopolitical and regulatory risks impacting global supply chains.
- Potential volatility around earnings due to high market expectations.
- Macroeconomic uncertainties affecting capital expenditure in technology.
Company Description
Marvell Technology, Inc. is a leading provider of data infrastructure semiconductor solutions, spanning from the data center core to the network edge. The company designs, develops, and sells advanced integrated circuits, including system-on-a-chip architectures that integrate analog, mixed-signal, and digital signal processing functionalities. Its product portfolio features ethernet solutions such as controllers, network adapters, physical transceivers, PHYs, and switches; interconnect products like pulse amplitude modulation DSPs, coherent DSPs, laser drivers, transimpedance amplifiers, silicon photonics, and co-packaged optics; fibre channel host bus adapters and controllers; storage controllers for hard disk drives and solid-state drives; and custom application-specific integrated circuits (ASICs). Marvell Technology, Inc. also offers security solutions, automotive chips, coherent DSPs, optical modules, data processing units, and government solutions. Serving key sectors including data centers, enterprise networks, carriers, automotive, and consumer markets, it operates across multiple global regions such as the United States, Singapore, Israel, India, and China. Founded in 1995 and headquartered in Wilmington, Delaware, Marvell Technology, Inc. plays a pivotal role in enabling high-performance connectivity and processing for modern digital infrastructures.