
Mangalam Cement Ltd (MANGLMCEM)
Stock Analysis Report
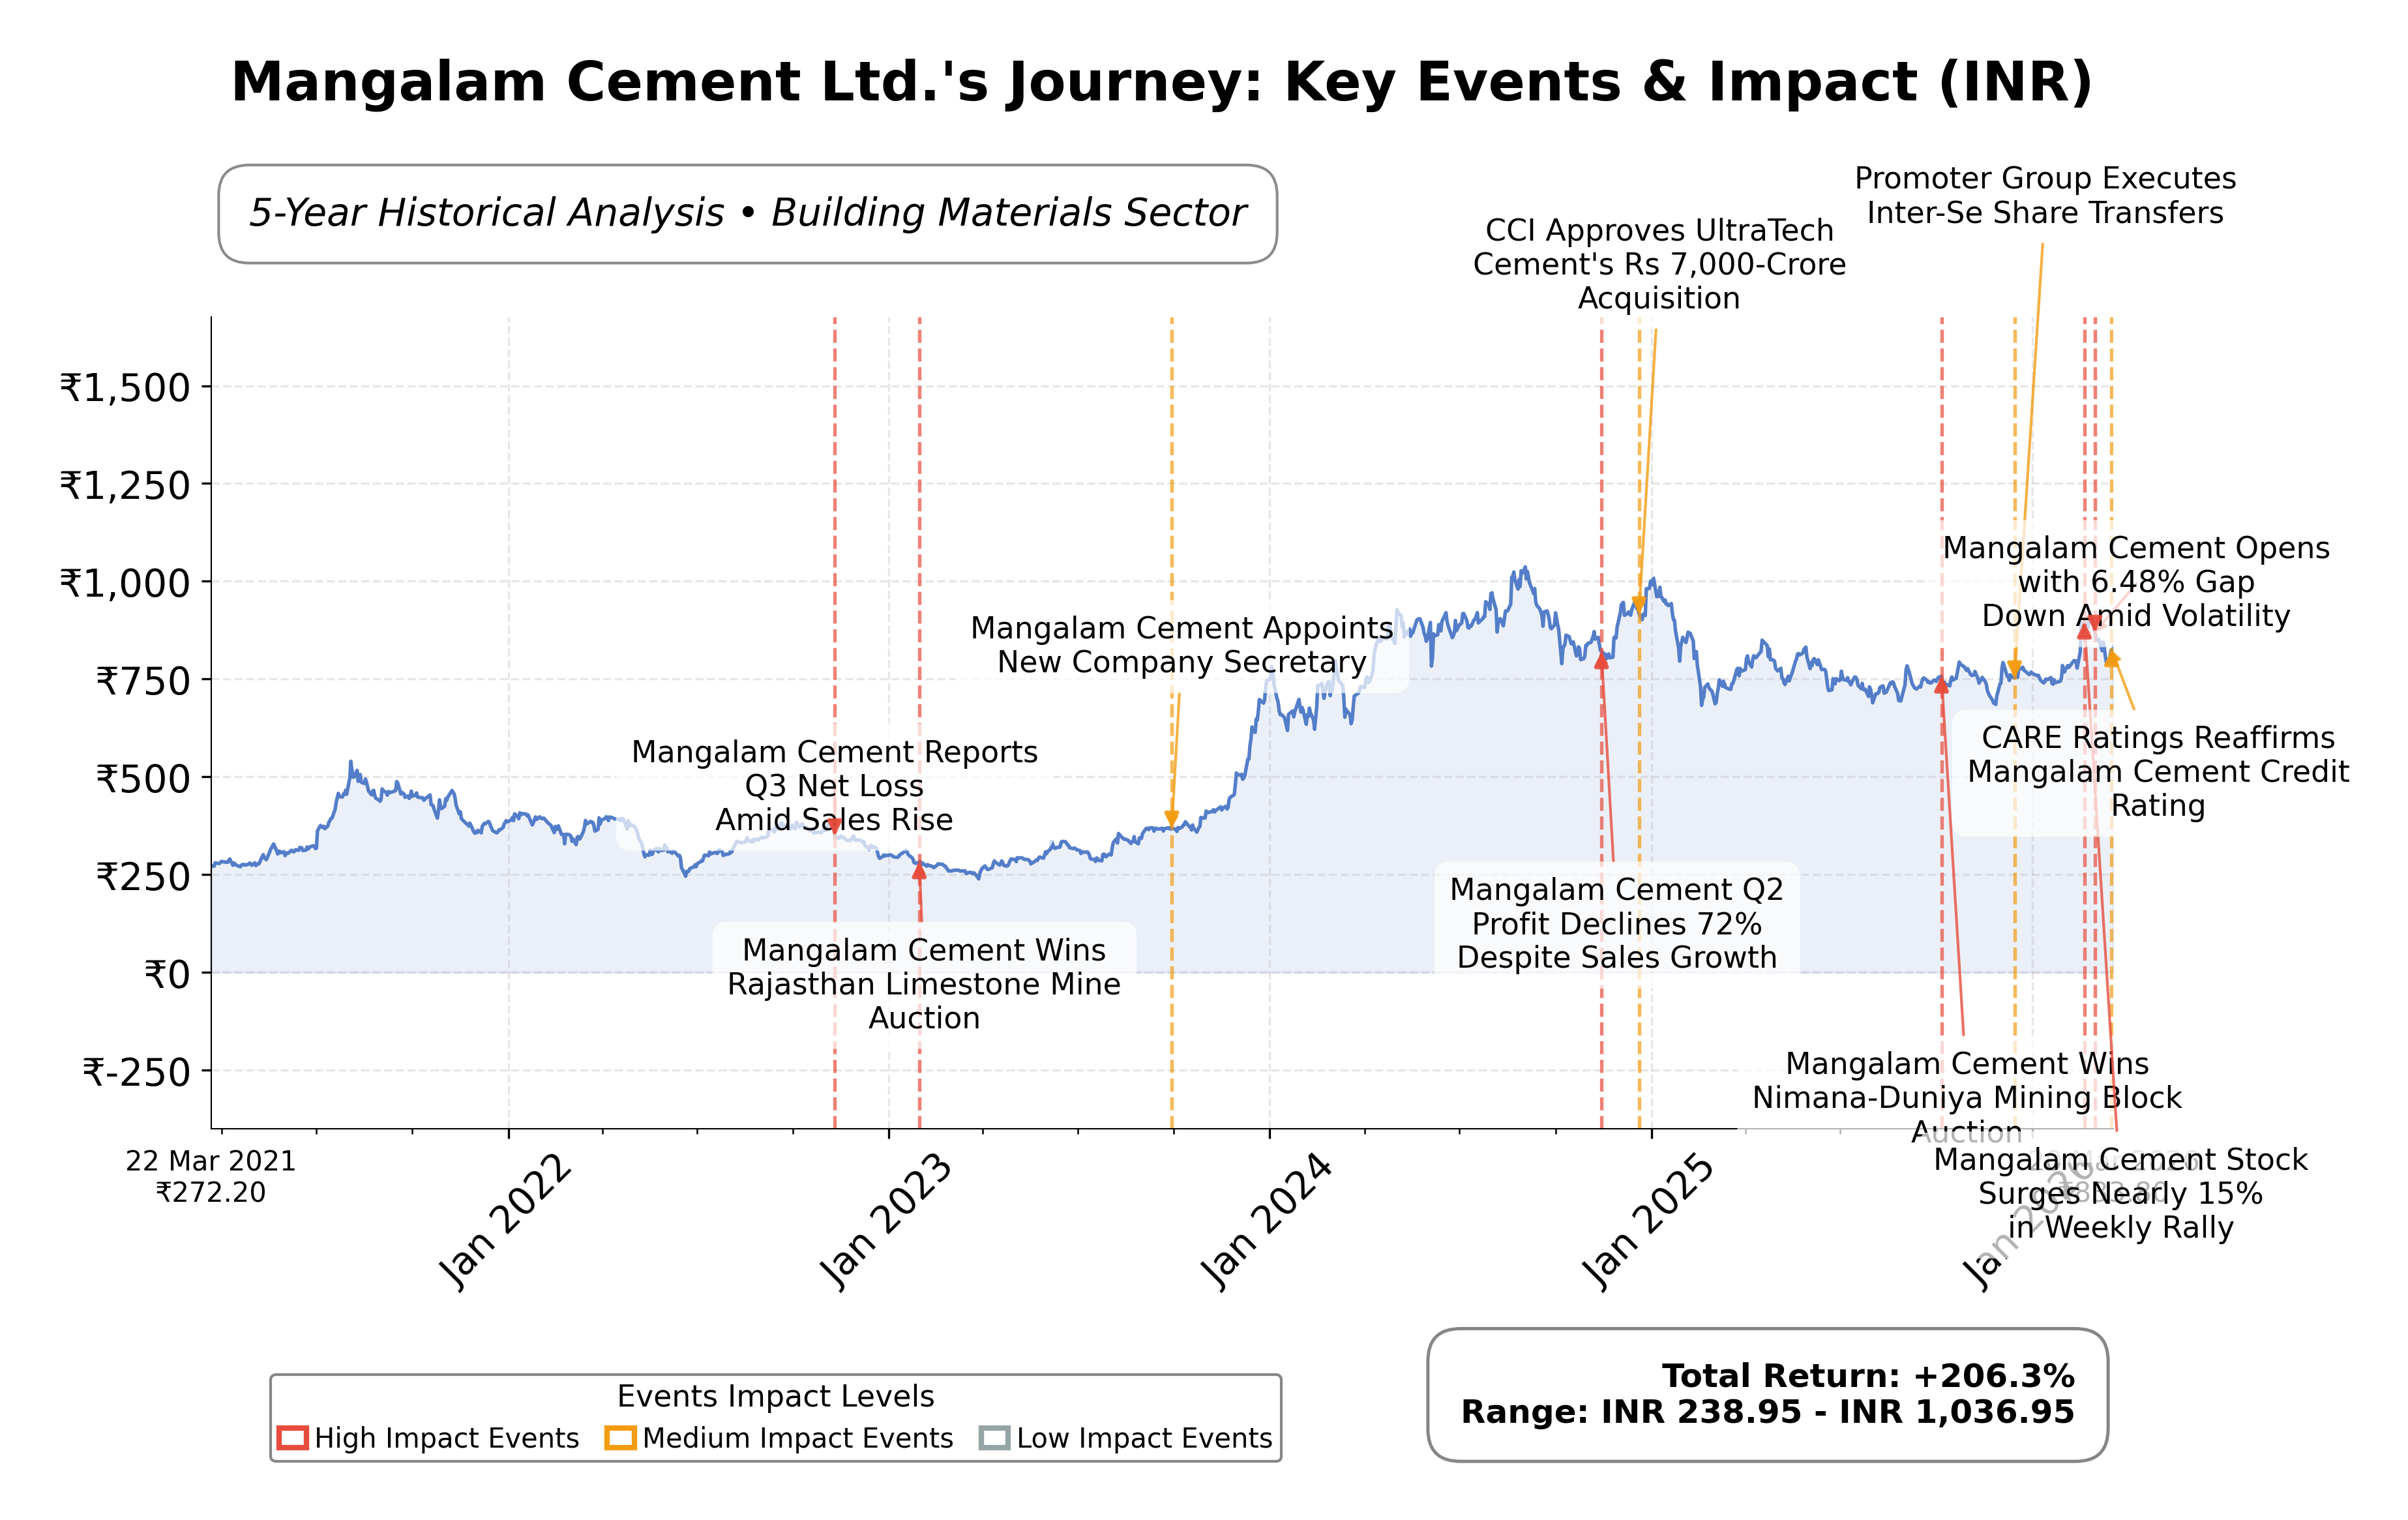
Stock Journey
Key Positives and Key Risks
Pros
- Forward P/E ratio of 19.81 indicates relatively attractive valuation compared to trailing P/E of 28.44, suggesting potential earnings growth.
- Quarterly earnings growth year-over-year is strong at 45.3%, reflecting improving profitability.
- Credit rating reaffirmation by CARE Ratings for bank facilities worth Rs. 1,163.41 crore supports financial stability.
Cons
- Debt-to-equity ratio of 81.54% indicates moderate leverage, which may increase financial risk.
- Current ratio of 0.80 suggests potential liquidity constraints in the short term.
- Return on equity at 5.29% is modest compared to industry peers, indicating room for operational efficiency improvements.
Disclosure: This information is for general awareness and does not constitute investment advice
Report Summary
Mangalam Cement Ltd. is a key player in India's building materials industry, specializing in manufacturing and distributing various types of cement, including Ordinary Portland Cement (OPC) and Portland Pozzolana Cement (PPC). The company leverages advanced technology and stringent quality controls to serve the construction sector, supporting infrastructure development across residential, commercial, and industrial projects. As part of the BK Birla Group, Mangalam Cement benefits from strong brand equity and extensive distribution networks within the Indian market.
Financially, Mangalam Cement exhibits a market capitalization of approximately â¹22.97 billion and trades at a trailing P/E ratio of 28.44 with a forward P/E of 19.81, indicating valuation metrics aligned with industry norms. The company reported trailing twelve months (TTM) revenue of â¹17.71 billion with a modest profit margin of 4.55% and an operating margin of 5.84%. Return on equity (ROE) stands at 5.29%, reflecting moderate profitability. The balance sheet shows total assets of â¹21.66 billion and a debt-to-equity ratio of 81.54%, highlighting a leveraged capital structure with a current ratio below 1.0, suggesting liquidity considerations.
From a strategic perspective, recent developments include promoter group share transfers and credit rating reaffirmations, underscoring stable governance and financial credibility. Technical indicators reveal mixed momentum with price action near key moving averages, while the company navigates competitive pressures within the cement sector. Strengths include technological capabilities and brand affiliation, whereas risks involve sector cyclicality and leverage. These factors provide a nuanced context for evaluating the company's market positioning and operational outlook.
Comparatively, Mangalam Cement operates in a competitive landscape alongside larger peers such as JK Cement Ltd., Ultratech Cement Ltd., and Nuvoco Vistas Corporation Ltd., all based in India. While Mangalam's market cap and valuation multiples are lower than these industry leaders, its price-to-book ratio and EV/EBITDA metrics suggest a relatively balanced valuation. The companyâs return on equity is modest compared to peers, indicating potential areas for operational improvement. This peer context highlights Mangalam Cementâs position as a mid-sized player within the Indian cement industry.
Mangalam Cement stands at a pivotal juncture, balancing steady operational performance with sector challenges such as capacity expansion and market competition. Recent achievements include credit rating stability and promoter restructuring, while ongoing challenges relate to profitability margins and liquidity ratios. The companyâs strategic decisions and market dynamics will significantly influence its trajectory in the building materials sector. Given the current financial and market data, a measured approach reflecting close observation of evolving fundamentals and sector trends may be appropriate for those assessing the stockâs potential.
Company and Industry Overview
Company Basics
Price Performance
Company Size
Shareholding Pattern
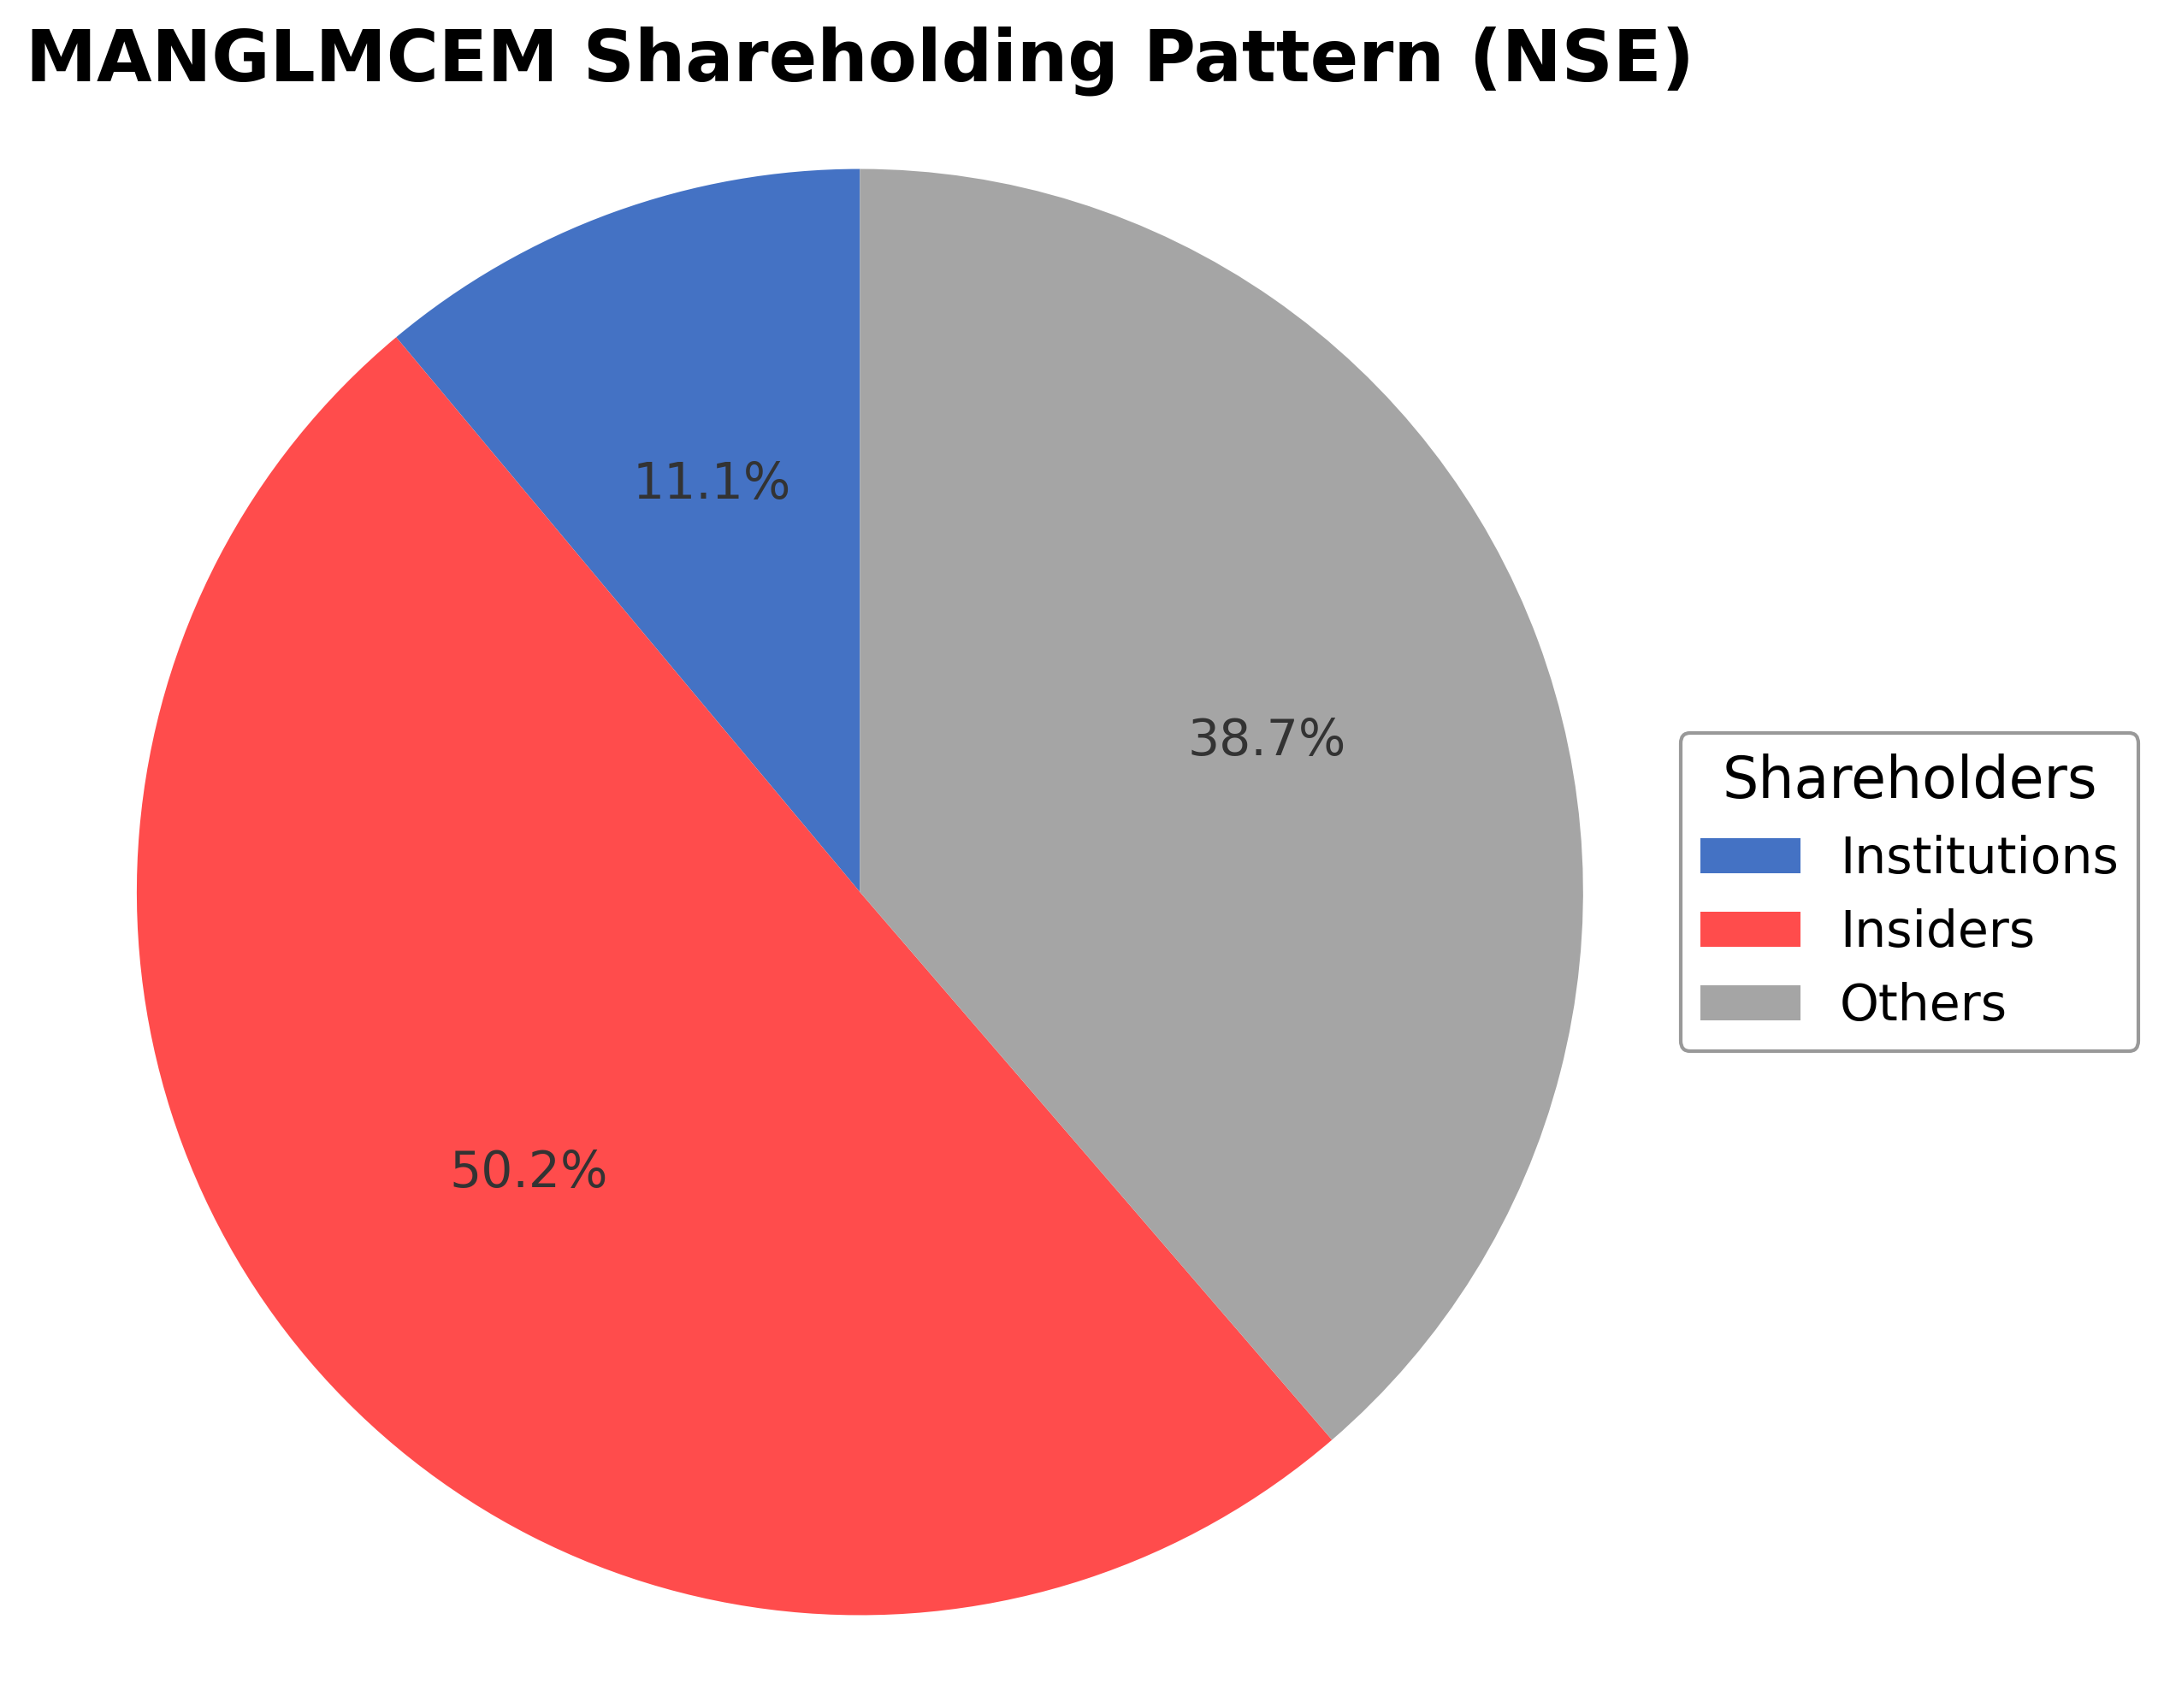
Mangalam Cement Ltd.'s ownership structure comprises approximately 50.24% held by insiders including executives and promoter groups, 11.08% by institutional investors such as mutual funds and asset managers, and the remaining 38.68% by public shareholders and other retail investors. Recent shareholding activity includes an inter-se transfer of 1 million equity shares among promoter entities, reflecting internal restructuring without altering overall promoter control. Institutional holdings remain relatively stable with no significant accumulation or distribution trends reported in the past 12-24 months. These patterns suggest steady market confidence and governance continuity, with the ownership mix supporting strategic decision-making and operational stability within the Indian building materials sector.
Sector and Industry Analysis
Sector and Industry Analysis: Cement Sector – Focus on Mangalam Cement Ltd.
1. Sector Overview: The cement sector is a critical component of the broader construction and infrastructure industry, serving as a foundational material for residential, commercial, and industrial projects. Globally, the cement market is sizable, valued in the hundreds of billions of dollars, with emerging economies driving much of the demand due to urbanization and infrastructure development. In India, where Mangalam Cement Ltd. operates, the sector is among the largest globally, supported by government initiatives such as the National Infrastructure Pipeline and affordable housing schemes. Key players in the Indian cement industry include UltraTech Cement, ACC, Ambuja Cement, and Shree Cement, alongside regional players like Mangalam Cement. The sector has witnessed steady growth, with projections indicating a compound annual growth rate (CAGR) in the mid-single digits over the next five years, driven by infrastructure spending and rural housing demand.
2. Industry Trends: Technological advancements are reshaping the cement industry, with increased adoption of automation, digital supply chain management, and energy-efficient manufacturing processes. The sector is also seeing a gradual shift towards sustainable practices, including the use of alternative fuels, waste heat recovery systems, and low-carbon cement formulations to reduce carbon footprints. Consumer behavior is influenced by rising environmental awareness and government mandates on green building certifications, creating opportunities for companies investing in eco-friendly products. Additionally, the industry is exploring digital platforms for sales and distribution, improving customer engagement and operational efficiency. Emerging opportunities lie in infrastructure development under public-private partnerships (PPP), smart city projects, and export potential to neighboring countries with growing construction needs.
3. Regulatory Landscape: The cement industry operates under stringent environmental regulations due to its energy-intensive nature and emissions profile. Key regulatory frameworks include the Environment Protection Act, Air (Prevention and Control of Pollution) Act, and specific state-level pollution control norms. Compliance with emission standards for particulate matter, nitrogen oxides, and carbon dioxide is mandatory, often requiring significant capital expenditure on pollution control equipment. The government’s push for sustainable development has introduced incentives for green cement production and penalties for non-compliance. Additionally, mining regulations impact the availability and cost of raw materials like limestone. Trade policies and tariffs also influence import-export dynamics, affecting pricing and competitiveness. Companies must navigate these regulations while balancing cost structures and operational efficiency.
4. Competitive Dynamics: The cement industry is characterized by moderate to high entry barriers due to capital intensity, access to raw materials, and regulatory compliance requirements. Established players benefit from economies of scale, extensive distribution networks, and brand recognition. Regional players like Mangalam Cement often compete by focusing on niche markets, cost leadership, or product differentiation through quality and service. The market structure tends toward oligopolistic competition with price sensitivity influenced by raw material costs and transportation expenses. Strategic alliances, mergers, and capacity expansions are common competitive tactics. Innovation in product offerings and sustainability credentials increasingly serve as differentiators. Furthermore, institutional ownership patterns and insider holdings can influence corporate governance and strategic decisions, impacting competitive positioning within the sector.
Note: Analysis synthesized from industry research, market reports, and regulatory filings. Information is subject to change based on market conditions.
Illustrative Scenario Analysis
DCF Assumptions:
Method: Two-Stage EPS-Priority Model
Financials
Peer Analysis
| Company Name | Market Cap | P/E Ratio | P/B Ratio | EV/EBITDA | Price to CFO |
|---|---|---|---|---|---|
| Mangalam Cement Ltd. | ₹22.97B | 28.44 | 2.55 | 13.19 | 22.71 |
| JK Cement Ltd. | ₹386.50B | 37.29 | 5.96 | 18.0 | 29.38 |
| Nuvoco Vistas Corporation Ltd. | ₹104.40B | 26.61 | 1.11 | 9.97 | 14.34 |
| Ultratech Cement Ltd. | ₹3.12T | 40.74 | 4.34 | 22.04 | 35.64 |
| Grasim Industries Ltd. | ₹1.74T | 38.59 | 1.75 | 12.67 | -8.32 |
| Birla Corporation Ltd. | ₹60.29B | 11.61 | 0.84 | 5.74 | 5.72 |
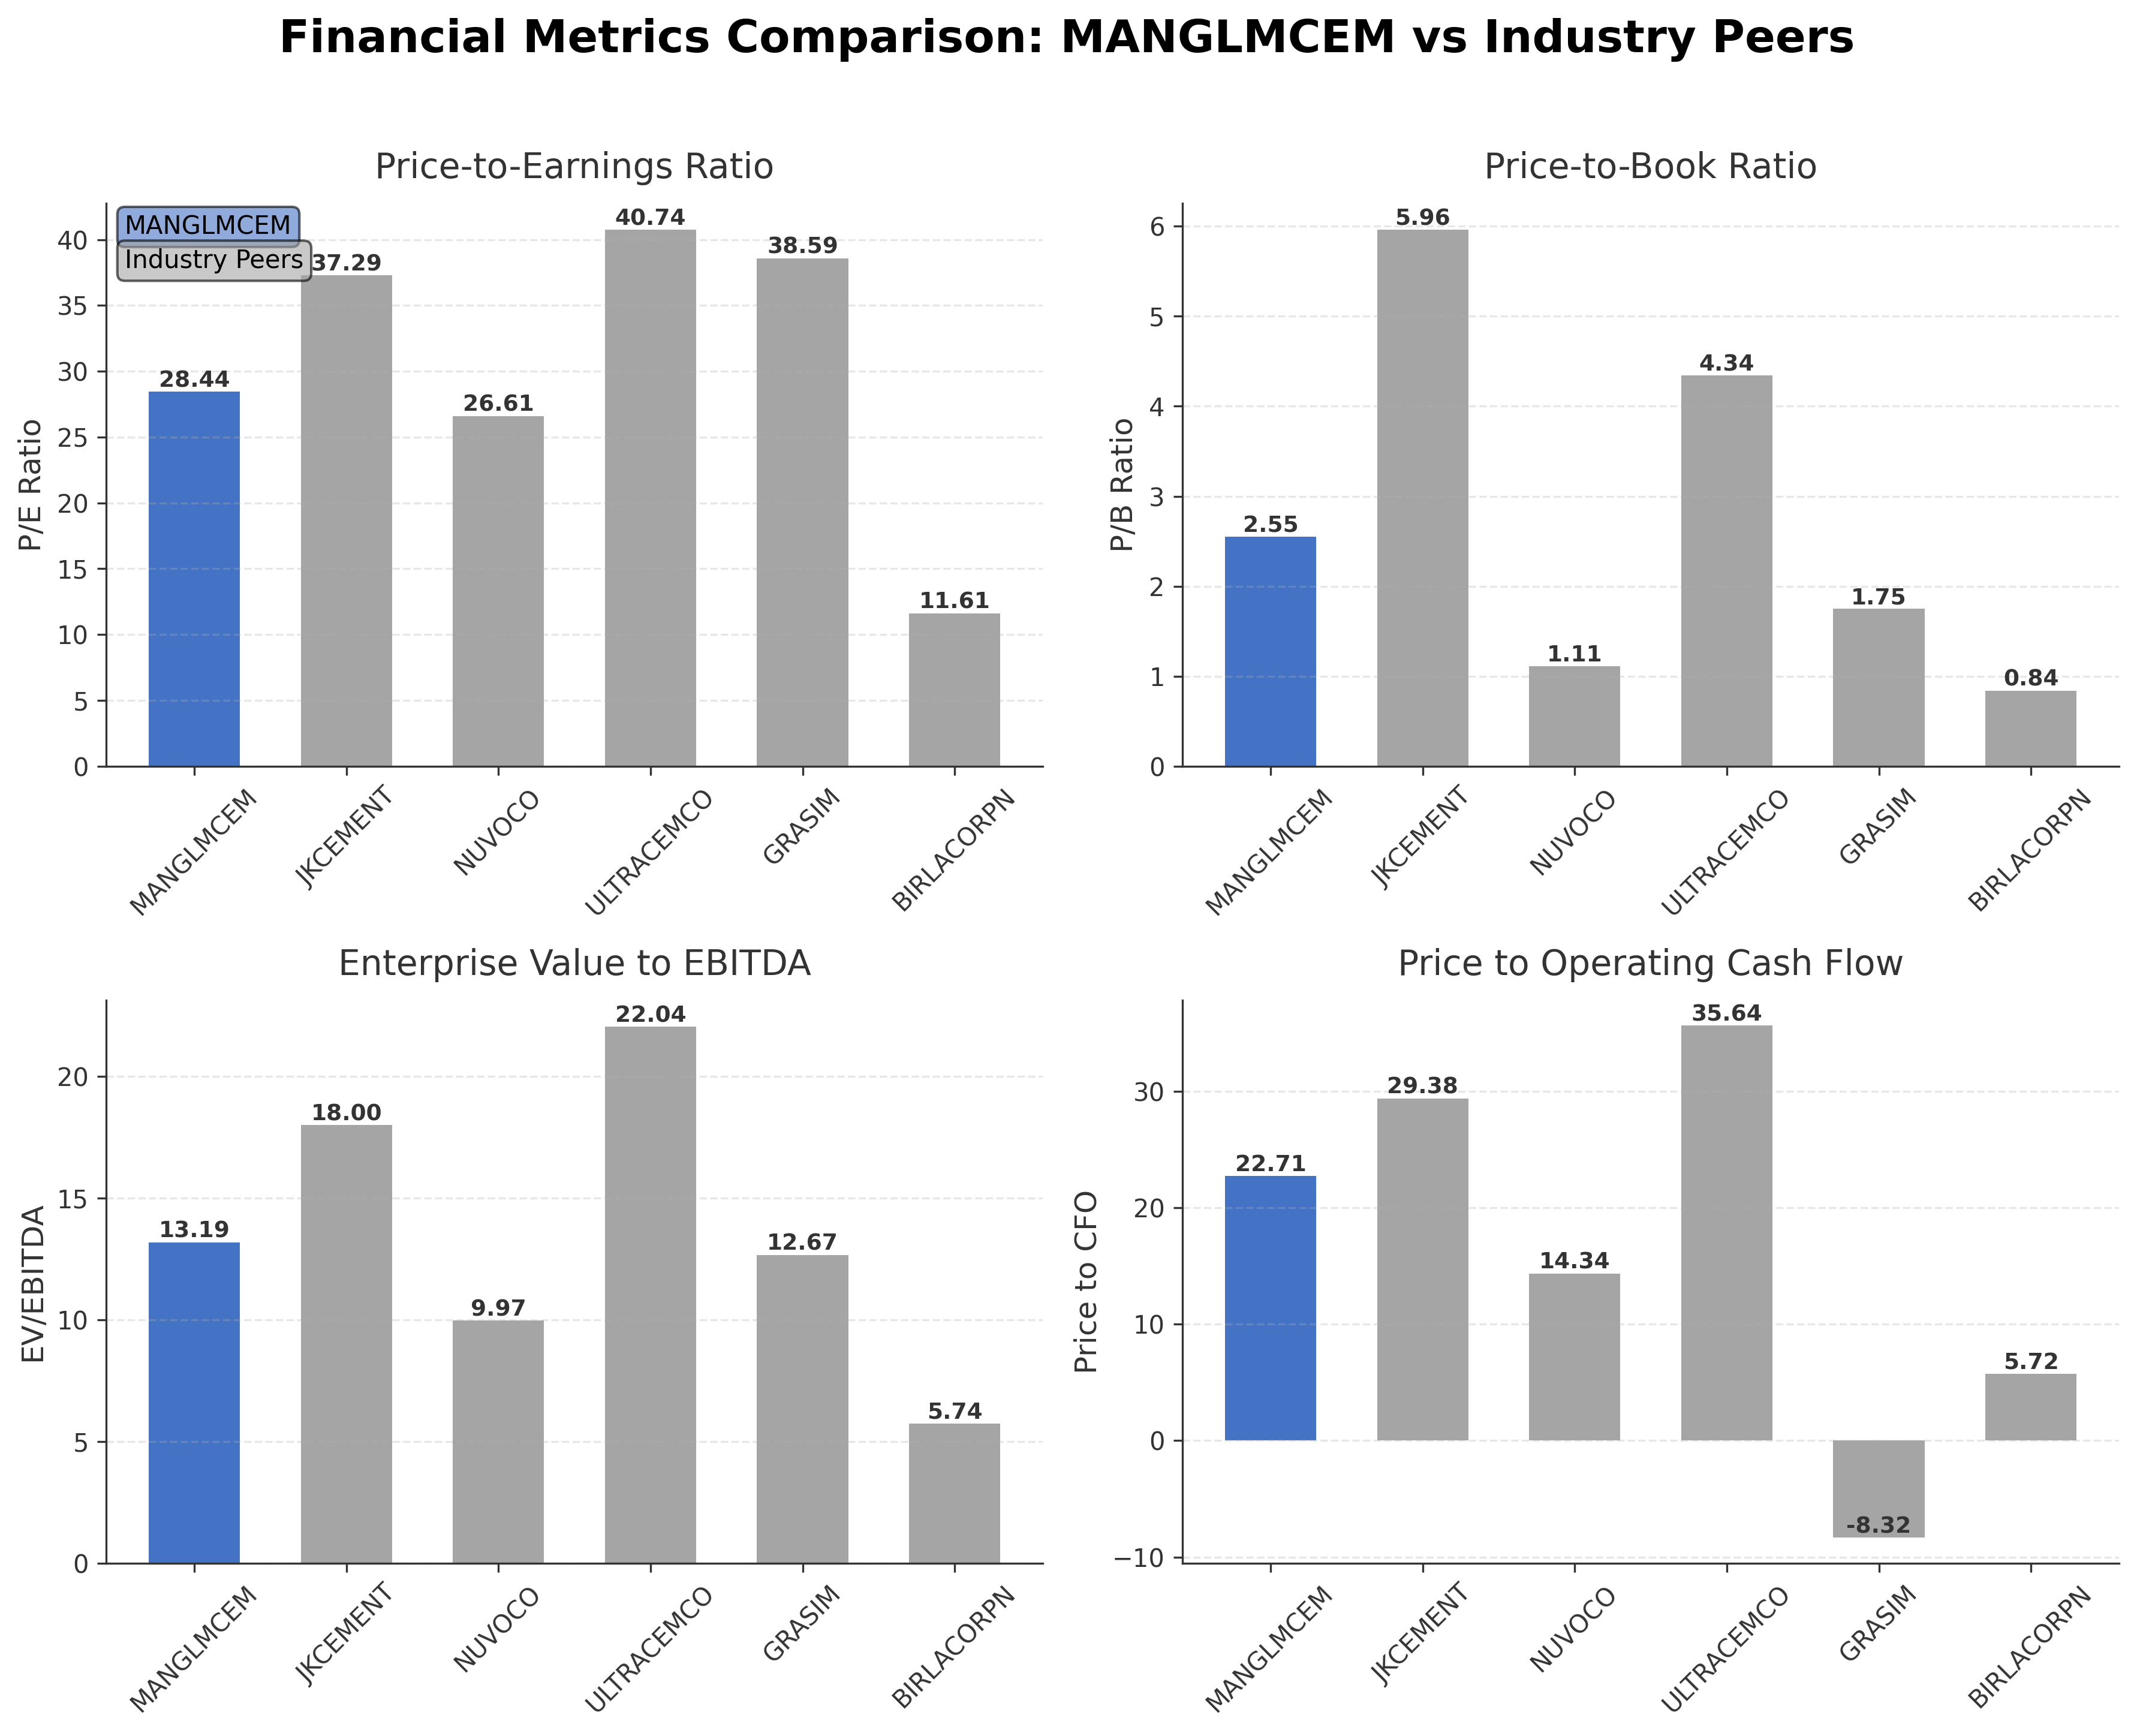
Comparison Analysis: Mangalam Cement Ltd. is positioned as a mid-cap player within the Indian cement industry, with a market capitalization significantly smaller than major peers such as Ultratech Cement Ltd. and Grasim Industries Ltd. Its P/E ratio of 28.44 is moderate compared to higher valuations of Ultratech and JK Cement, while its price-to-book ratio of 2.55 is below some peers but above others like Birla Corporation. The EV/EBITDA multiple of 13.19 suggests a valuation in line with industry norms, though higher than Birla Corporation's more conservative multiple. Mangalam's return on equity at 5.29% is modest relative to peers, indicating room for operational efficiency improvements. Overall, the company demonstrates balanced valuation metrics but faces competitive pressures from larger, more established players in the region.
Financial Metrics Comparison with Peers
Financial Statements
Comprehensive financial data including income, balance sheet, and cash flow metrics
Income Statement
| fiscal_date | 2025-03-31 | 2024-03-31 | 2023-03-31 | 2022-03-31 | 2021-03-31 |
|---|---|---|---|---|---|
| Sales | 16.80B | 17.25B | 17.92B | 15.64B | 12.99B |
| Cost Of Goods | 3.67B | 8.44B | 9.75B | 7.52B | 5.50B |
| Gross Profit | 13.13B | 8.81B | 8.17B | 8.11B | 7.49B |
| Operating Expense Selling General And Administrative | 4.31B | 4.23B | 4.23B | 3.36B | 2.92B |
| Operating Expense Other Operating Expenses | 5.81B | 1.20B | 1.34B | 1.36B | 962.83M |
| Operating Income | 853.79M | 1.30B | 826.12M | 1.57B | 1.83B |
| Non Operating Interest Income | 116.99M | 136.16M | 58.67M | 114.44M | 160.31M |
| Non Operating Interest Expense | 442.99M | 490.76M | 403.80M | 482.48M | 571.69M |
| Pretax Income | 699.89M | 991.11M | 277.21M | 1.19B | 1.38B |
| Income Tax | 249.26M | 393.94M | 105.98M | 413.84M | 444.62M |
| Net Income | 450.63M | 597.17M | 171.23M | 777.05M | 934.66M |
| Eps Basic | 16.39 | 21.72 | 6.23 | 28.26 | 33.99 |
| Eps Diluted | 16.39 | 21.72 | 6.23 | 28.26 | 33.99 |
| Basic Shares Outstanding | 27.50M | 27.50M | 27.50M | 27.50M | 27.50M |
| Diluted Shares Outstanding | 27.50M | 27.50M | 27.50M | 27.50M | 27.50M |
| Ebit | 1.14B | 1.48B | 681.01M | 1.67B | 1.95B |
| Ebitda | 1.85B | 2.12B | 1.48B | 2.26B | 2.58B |
| Net Income Continuous Operations | 699.89M | 991.11M | 277.21M | 1.19B | 1.36B |
| Preferred Stock Dividends | 0.00 | 0.00 | 0.00 | 0.00 | 0.00 |
Data provided by Twelve Data
Balance Sheet
| fiscal_date | 2025-03-31 | 2024-03-31 | 2023-03-31 | 2022-03-31 | 2021-03-31 |
|---|---|---|---|---|---|
| Cash And Cash Equivalents | 285.47M | 355.24M | 507.84M | 651.37M | 833.60M |
| Accounts Receivable | 397.20M | 344.81M | 369.98M | 366.16M | 388.74M |
| Total Assets | 21.66B | 20.68B | 19.90B | 19.28B | 18.58B |
| Total Liabilities | 13.14B | 12.56B | 12.34B | 11.86B | 11.90B |
| Long Term Debt | 2.05B | 2.51B | 2.99B | 3.66B | 4.17B |
| Shareholders Equity | 8.52B | 8.12B | 7.56B | 7.42B | 6.68B |
Data provided by Twelve Data
Cash Flow Statement
| fiscal_date | 2025-03-31 | 2024-03-31 | 2023-03-31 | 2022-03-31 | 2021-03-31 |
|---|---|---|---|---|---|
| Operating Activities Net Income | 699.89M | 991.11M | 277.21M | 1.19B | 1.36B |
| Operating Activities Other Non Cash Items | 535.20M | 542.20M | 604.60M | 531.42M | 529.90M |
| Operating Activities Accounts Receivable | -547.31M | 140.15M | -8.20M | -252.86M | -302.23M |
| Operating Activities Other Assets Liabilities | 323.54M | -507.77M | -534.89M | 209.81M | -405.13M |
| Operating Activities Operating Cash Flow | 1.01B | 1.17B | 338.71M | 1.68B | 1.19B |
| Investing Activities Capital Expenditures | -1.14B | -984.20M | -1.25B | -1.23B | -779.34M |
| Investing Activities Purchase Of Investments | -667.14M | -232.24M | -891.24M | -741.00M | -1.28B |
| Investing Activities Sale Of Investments | 400.58M | 0.00 | 1.24B | 250.48M | 297.70M |
| Investing Activities Investing Cash Flow | -1.41B | -1.22B | -901.52M | -1.72B | -1.76B |
| Financing Activities Long Term Debt Issuance | 528.09M | 706.31M | 700.09M | 2.03B | 2.23B |
| Financing Activities Long Term Debt Payments | -1.22B | -1.10B | -1.45B | -763.51M | -1.69B |
| Financing Activities Short Term Debt Issuance | 816.44M | 298.16M | 652.76M | -1.28B | -236.02M |
| Financing Activities Common Dividends | -41.25M | -41.25M | -41.25M | -40.04M | -26.69M |
| Financing Activities Financing Cash Flow | 86.75M | -136.00M | -143.04M | -53.08M | 280.08M |
| End Cash Position | 285.47M | 355.24M | 507.84M | 651.37M | 833.60M |
| Free Cash Flow | 622.27M | 837.11M | 114.81M | 640.27M | 1.55B |
| Investing Activities Other Investing Activity | N/A | N/A | -271.00K | -100.00K | N/A |
Data provided by Twelve Data
Technical Analysis
Key Insights
- The current trend shows a mildly bullish momentum with price action consolidating near the ₹845 level after recent fluctuations.
- Key support is identified around ₹800, with resistance near the 52-week high of ₹940.35 acting as a significant barrier.
- The stock price is trading above the 200-day moving average (~₹760.70) and near the 50-day moving average (~₹805.15), indicating medium-term support.
- Momentum indicators show RSI in a neutral range, MACD signaling mild bullish crossover, and stochastic oscillators reflecting mixed momentum.
- Daily and weekly timeframes indicate consolidation, while monthly charts suggest a longer-term upward trend with moderate volatility.
- Potential scenarios include a breakout above resistance leading to renewed upward momentum or a pullback toward support levels amid sector volatility.
Trending News
Summary: Mangalam Ind Share Price: Find the latest news on Mangalam Ind Stock Price. Get all the information on Mangalam Ind with historic price charts for NSE / BSE. Experts & Broker view also get the Mangalam Ind Ltd. buy/sell tips detailed news, announcements, Forecasts, Analysts, Valuation, Earning ...
Sentiment: neutral
2. Headline: Mangalam Cement Receives Credit Rating Reaffirmation from CARE Ratings for Bank Facilities Worth Rs. 1,163.41 Crore
Summary: Mangalam Cement Ltd received credit rating reaffirmation from CARE Ratings Limited for bank facilities worth Rs. 1,163.41 crore. CARE maintained CARE A+ Stable ratings for long-term facilities and CARE A1+ for short-term instruments. The reaffirmation included facility amount changes, with ...
Sentiment: positive
3. Headline: Mangalam Cement Shares Rise 1.55% On Promoter Share Transfer
Summary: Mangalam Cement informed exchanges that it had received intimation from promoter group entities regarding an inter-se transfer of 10,00,000 equity shares. The transfer involves Aditya Birla Real Estate Limited (formerly Century Textiles and Industries Ltd.) and Pilani Investment and Industries ...
Sentiment: positive
4. Headline: Mangalam Cement Limited Announces Inter-Se Transfer of 10 Lakh Equity Shares Among Promoter Group
Summary: Additionally, Pilani Investment and Industries Corporation Ltd. is transferring 20,000 shares to Mignonette Creations Private Limited. The proposed acquisition date is scheduled for March 24, 2026, or any day thereafter, following the mandatory four working days disclosure period from the date of intimation. All shares in this inter-se transfer are proposed to be acquired at prevailing market prices. The 60-day volume weighted average market price for Mangalam Cement ...
Sentiment: neutral
5. Headline: Cement capacity race with Birla group may ease as Adani shifts focus to margins | Company Business News
Summary: The rivalry between the Adani Group and the Aditya Birla Group’s UltraTech Cement Ltd has resulted in rapid manufacturing capacity expansion. In the last three-and-a-half years, the two conglomerates have added nearly 120 mtpa of cement manufacturing capacity between them.
Sentiment: positive
6. Headline: Why is Mangalam Cement Ltd falling/rising?
Summary: As of 09-Mar, Mangalam Cement Ltd’s stock price has fallen sharply by 4.35% to ₹815.00, reflecting a broader sector downturn and short-term investor caut...
Sentiment: negative
7. Headline: Mangalam Cement Ltd is Rated Hold by MarketsMOJO
Summary: Mangalam Cement Ltd is rated 'Hold' by MarketsMOJO, with this rating last updated on 02 February 2026. However, the analysis and financial metrics discussed here reflect the stock's current position as of 09 March 2026, providing investors with an up-to-date perspective on the company’s ...
Sentiment: neutral
8. Headline: Mangalam Cement Ltd Technical Momentum Shifts Amid Mixed Signals
Summary: Mangalam Cement Ltd has experienced a nuanced shift in its technical momentum, moving from a bullish to a mildly bullish trend as of early March 2026. Despite a recent decline in daily price, key technical indicators such as MACD and moving averages continue to signal underlying strength, while ...
Sentiment: positive
9. Headline: Mangalam Cement Ltd Valuation Shifts Signal Renewed Price Attractiveness
Summary: Mangalam Cement Ltd has witnessed a notable shift in its valuation parameters, moving from a fair to an attractive rating, reflecting improved price appeal relative to its historical averages and peer group. This change accompanies a recent upgrade in its Mojo Grade from Sell to Hold, signalling ...
Sentiment: positive
10. Headline: Mangalam Cement Ltd Valuation Shifts to Fair Amid Strong Market Performance
Summary: Mangalam Cement Ltd has witnessed a notable shift in its valuation parameters, moving from an attractive to a fair rating as per recent assessments. This change reflects evolving market perceptions amid sector-wide valuation trends and company-specific financial metrics, prompting investors ...
Sentiment: positive
Powered by Brave
Recent Updates
News Summary
Recent news highlights Mangalam Cement Ltd's stable financial and operational position, underscored by a credit rating reaffirmation from CARE Ratings for bank facilities worth Rs. 1,163.41 crore. Promoter group share transfers have been disclosed, reflecting internal restructuring without altering overall control, which contributed to a modest share price increase of 1.55%. Market sentiment remains cautious with a 'Hold' rating from MarketsMOJO, reflecting balanced views on valuation and growth prospects. Sector dynamics include easing capacity competition between major players, potentially benefiting Mangalam Cement's market positioning. Overall, these developments indicate steady governance and creditworthiness amid a competitive industry environment.
News Sentiment
The sentiment across recent updates is predominantly neutral to positive, with credit rating affirmations and promoter restructuring viewed favorably. Technical momentum signals mixed but mildly bullish trends, while cautious market ratings reflect balanced risk-reward perceptions. No significant negative news has emerged recently, suggesting stable investor confidence and operational continuity.
Analytical Overview
Analysis Summary
Mangalam Cement's trailing P/E ratio of 28.44 is aligned with the industry average of 28.44, while the forward P/E of 19.81 suggests a more attractive valuation relative to peers. The PEG ratio of 0.63 indicates potential undervaluation relative to growth expectations.
The company's revenue has declined slightly by 3.9% quarter-over-quarter, but quarterly earnings growth year-over-year is strong at 45.3%, indicating improving profitability trends. Cash flow from operations is positive at ₹1.01 billion, with levered free cash flow of ₹450.6 million, supporting operational sustainability.
Financial health shows moderate leverage with a debt-to-equity ratio of 81.54%, and a current ratio below 1.0 (0.80), suggesting liquidity constraints that warrant monitoring. The company maintains a modest dividend yield of 0.18%, reflecting conservative payout policies.
Sector-specific challenges include competitive pressures from larger cement manufacturers and cyclical demand fluctuations in the Indian construction market. Opportunities exist in capacity expansion and sustainable product offerings.
Considering India-specific factors, regulatory stability and infrastructure development initiatives support demand, while economic outlook and commodity price volatility remain key considerations.
Investment Conclusion
Supporting Factors: Primary supporting factors include stable credit ratings, improving earnings growth, and valuation metrics near industry averages.
Risk Factors: Key risks involve liquidity constraints, moderate leverage, and competitive industry dynamics.
SWOT Analysis
Strengths
- Strong brand affiliation as part of the BK Birla Group.
- Use of advanced technology and stringent quality controls in production.
- Stable credit rating reaffirmed by CARE Ratings.
- Consistent earnings growth with improving profitability margins.
Weaknesses
- Moderate leverage with a debt-to-equity ratio above 80%.
- Current ratio below 1.0 indicating potential liquidity concerns.
- Relatively modest return on equity compared to industry peers.
- Limited market capitalization relative to larger competitors.
Opportunities
- Expansion of production capacity to meet growing domestic demand.
- Increasing focus on sustainable and environmentally responsible products.
- Potential benefits from easing sector capacity competition.
- Supportive infrastructure development policies in India.
Threats
- Intense competition from larger cement manufacturers in India.
- Volatility in raw material and energy prices impacting margins.
- Cyclical nature of the construction and real estate sectors.
- Regulatory changes affecting environmental compliance costs.
Company Description
Mangalam Cement Ltd. operates as a prominent cement manufacturing company in India. Established with a mission to provide durable and high-quality cement solutions, the company primarily focuses on producing and distributing various types of cement including Ordinary Portland Cement (OPC) and Portland Pozzolana Cement (PPC). Mangalam Cement's production process is recognized for utilizing state-of-the-art technology and stringent quality control measures, ensuring products that meet the rigorous demands of the construction sector. This company plays a vital role in supporting infrastructure development, addressing the needs of residential, commercial, and industrial construction projects across India. By being part of the BK Birla Group of Companies, Mangalam Cement gains a strategic advantage through enhanced brand equity, distribution networks, and cross-industry collaborations. In the financial markets, Mangalam Cement Ltd. is significant due to its contribution to the real estate and construction sectors, which are critical indicators of economic growth and stability. The company maintains a robust market presence by expanding its production capacity and striving for sustainable practices, fulfilling both the growing domestic demands and the aspirations for environmentally responsible operations.