


Maharashtra Seamless Ltd (MAHSEAMLES)
Stock Analysis Report
Stock Journey
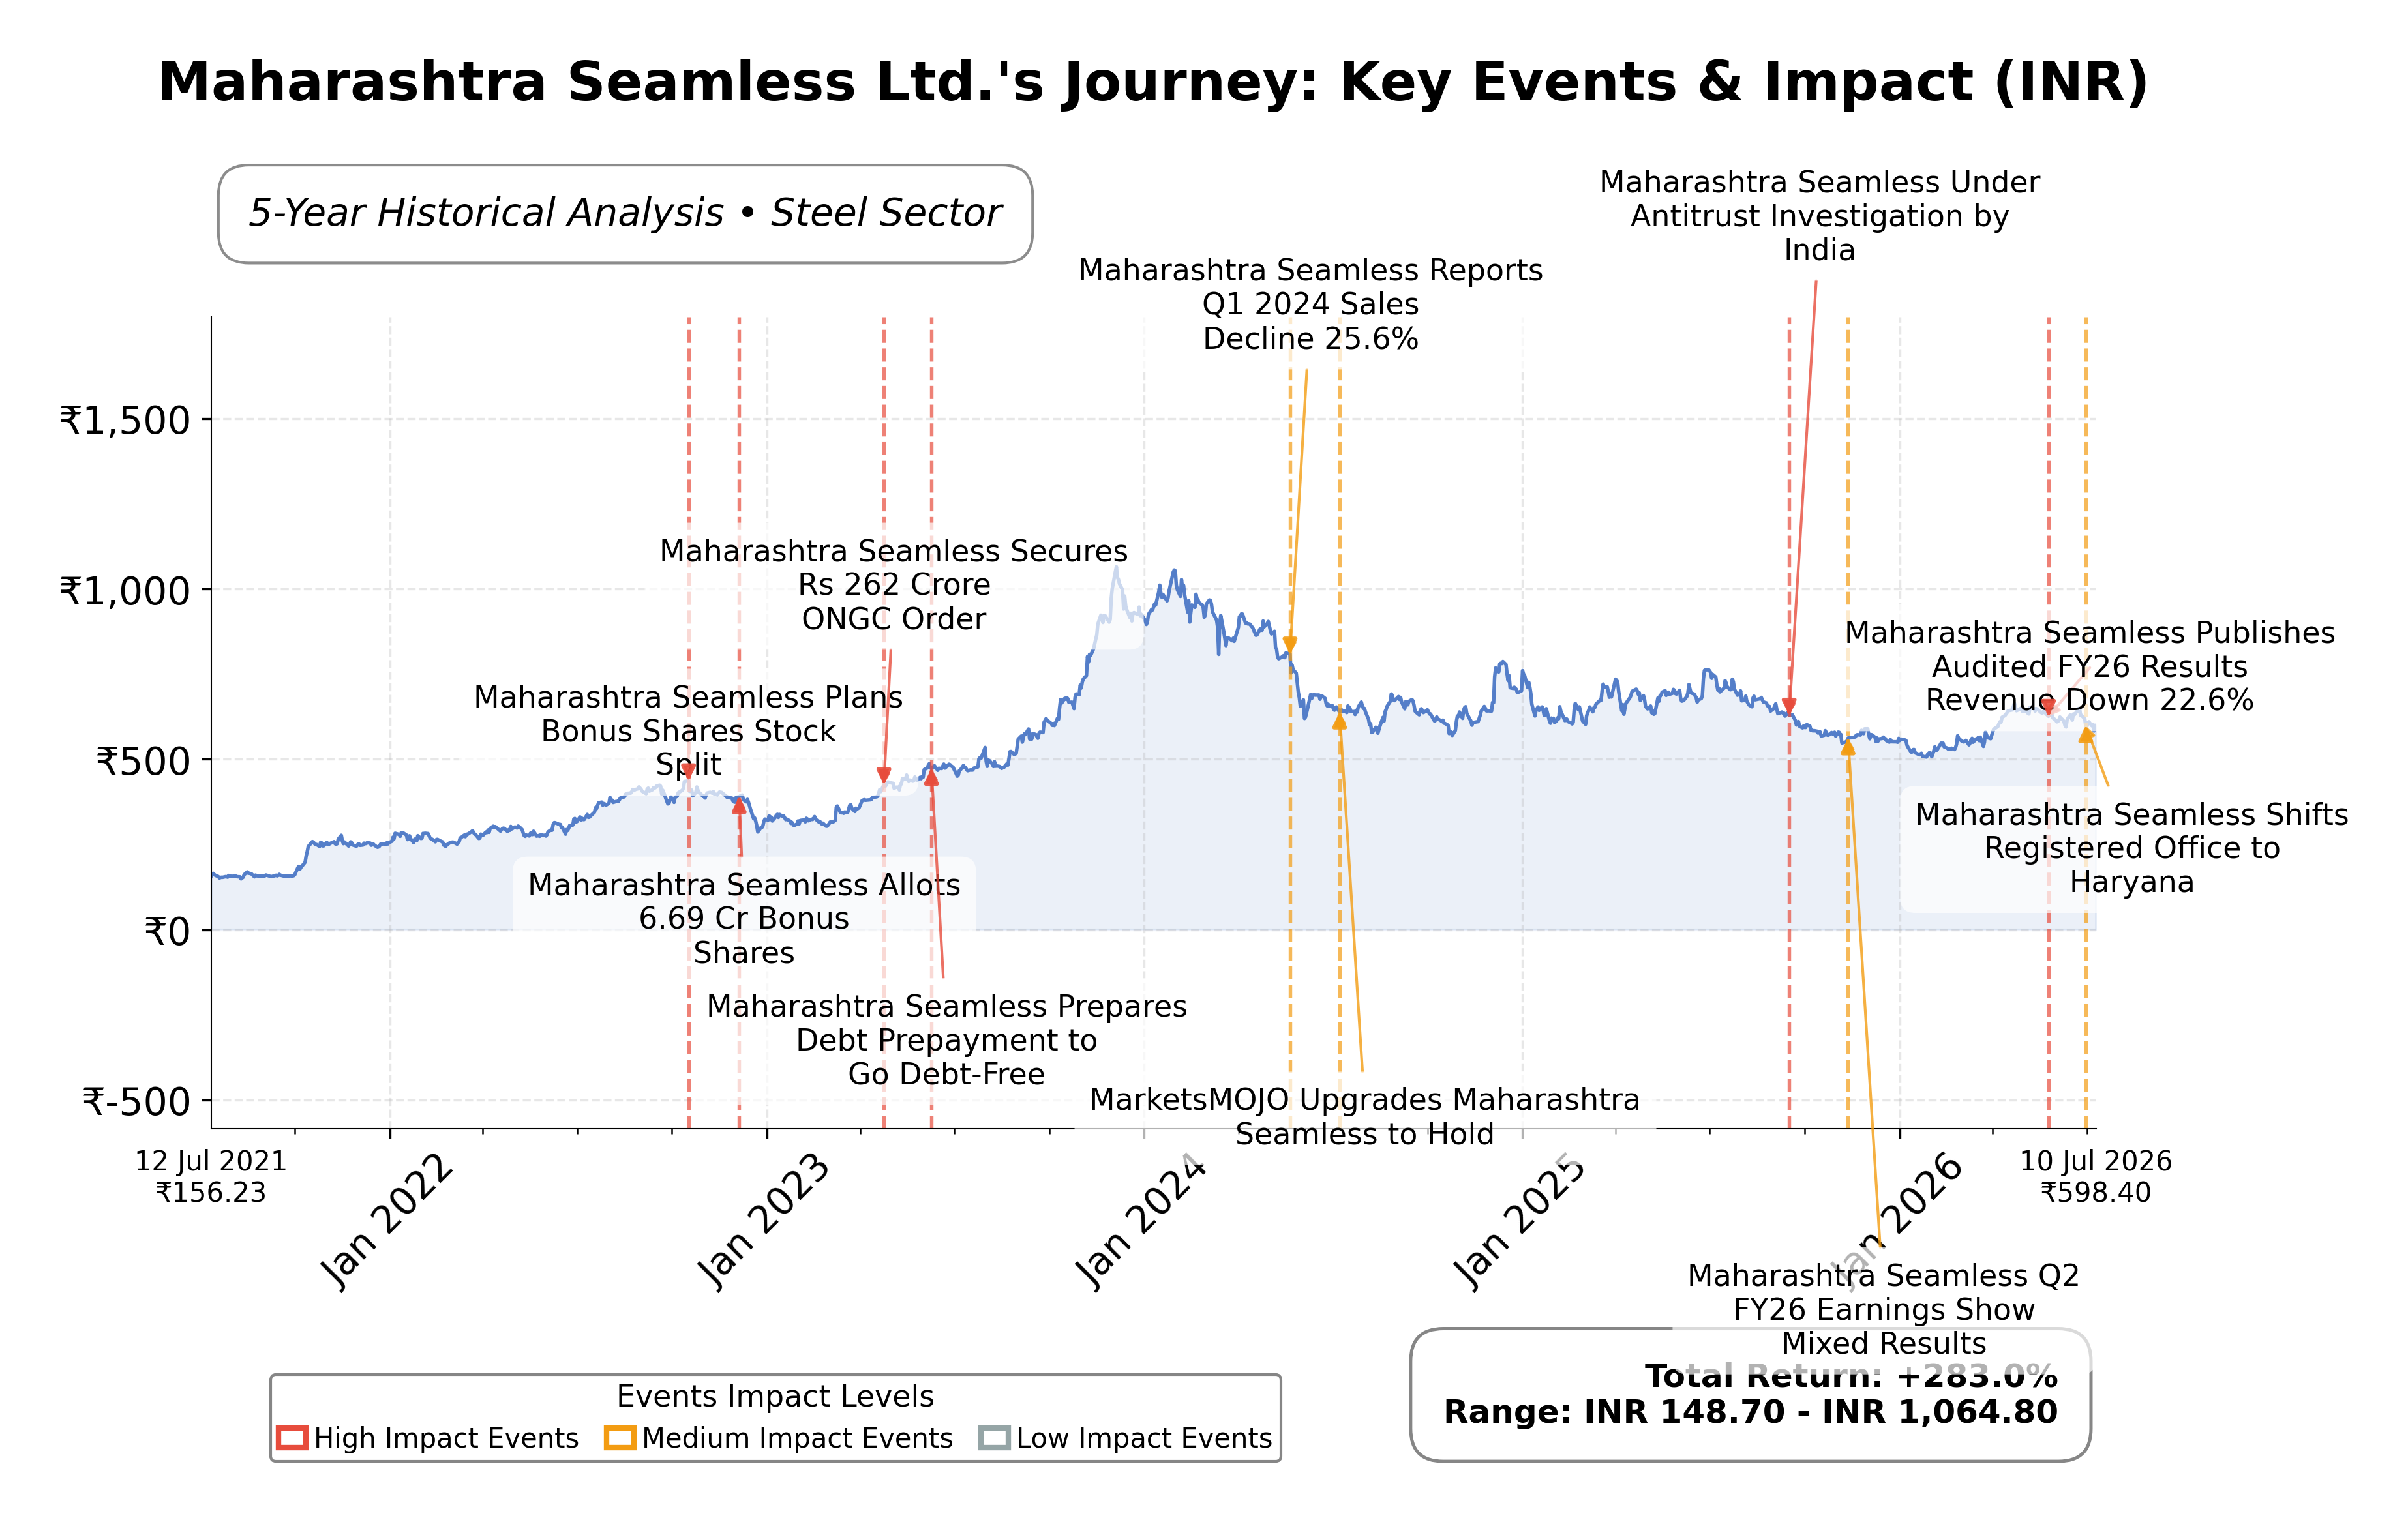
Key Positives and Key Risks
Pros
- Strong liquidity with total cash of INR 36.79 billion supports operational flexibility and financial stability.
- Valuation metrics such as trailing P/E of 11.45 and price-to-book ratio of 1.17 are below industry averages, indicating relative value.
- Low debt-to-equity ratio of 0.194 reflects conservative leverage and reduced financial risk.
Cons
- Quarterly revenue declined by 12.8%, signaling potential near-term demand weakness.
- Quarterly earnings fell by over 50% year-over-year, indicating profitability challenges.
- Technical indicators and recent downgrades suggest weakening momentum and potential stock price pressure.
Disclosure: This information is for general awareness and does not constitute investment advice
Report Summary
Maharashtra Seamless Ltd. operates primarily in the steel manufacturing sector, specializing in the production of seamless pipes and tubes essential for industries such as oil and gas, power, infrastructure, and automotive. Listed on the NSE in India under the symbol MAHSEAMLES, it is part of the Basic Materials sector and benefits from its affiliation with the DP Jindal Group. The company’s product portfolio includes cold drawn seamless pipes and ERW pipes, positioning it as a critical supplier for industrial and infrastructure projects domestically and internationally.
Financially, Maharashtra Seamless reported trailing twelve months revenue of approximately INR 46.74 billion with a gross margin of 39.65%, operating margin of 16.13%, and net profit margin of 15.00%. The return on equity (ROE) stands at 10.61%, and return on assets (ROA) is 4.83%, indicating moderate profitability and efficient asset utilization. The company maintains a strong liquidity position with a current ratio of 14.17 and low debt-to-equity ratio of 0.194, reflecting prudent financial management.
Valuation metrics show a trailing P/E ratio of 11.45 and a forward P/E of 9.15, suggesting the stock is trading at a reasonable valuation relative to earnings expectations. The price-to-book ratio is 1.17, and the EV/EBITDA multiple is 6.25, indicating a modest premium over book value and earnings before interest, taxes, depreciation, and amortization. The stock price currently trades at INR 600.10, within a 52-week range of INR 748.75 to INR 500.70, reflecting a 17.99% decline from its high.
Key strengths include a robust cash position with over INR 36.79 billion in cash and equivalents, minimal debt, and a diversified product offering catering to critical infrastructure sectors. Risks involve a recent decline in quarterly revenue growth by 12.8% and a 50.2% drop in quarterly earnings year-over-year, alongside competitive pressures and sector cyclicality. The company’s promoters have maintained a no-encumbrance policy on shares in FY26, signaling financial stability and governance discipline.
Technically, the stock exhibits mixed signals with a current price above the 200-day moving average but below the 50-day average, and momentum indicators suggest a shift in technical momentum. Recent news reflects a downgrade in investment ratings due to technical and financial concerns, though the company’s fundamentals remain stable. Overall, the data suggests a cautious stance with attention to evolving market conditions and operational performance.
Company and Industry Overview
Company Basics
Price Performance
Company Size
Shareholding Pattern
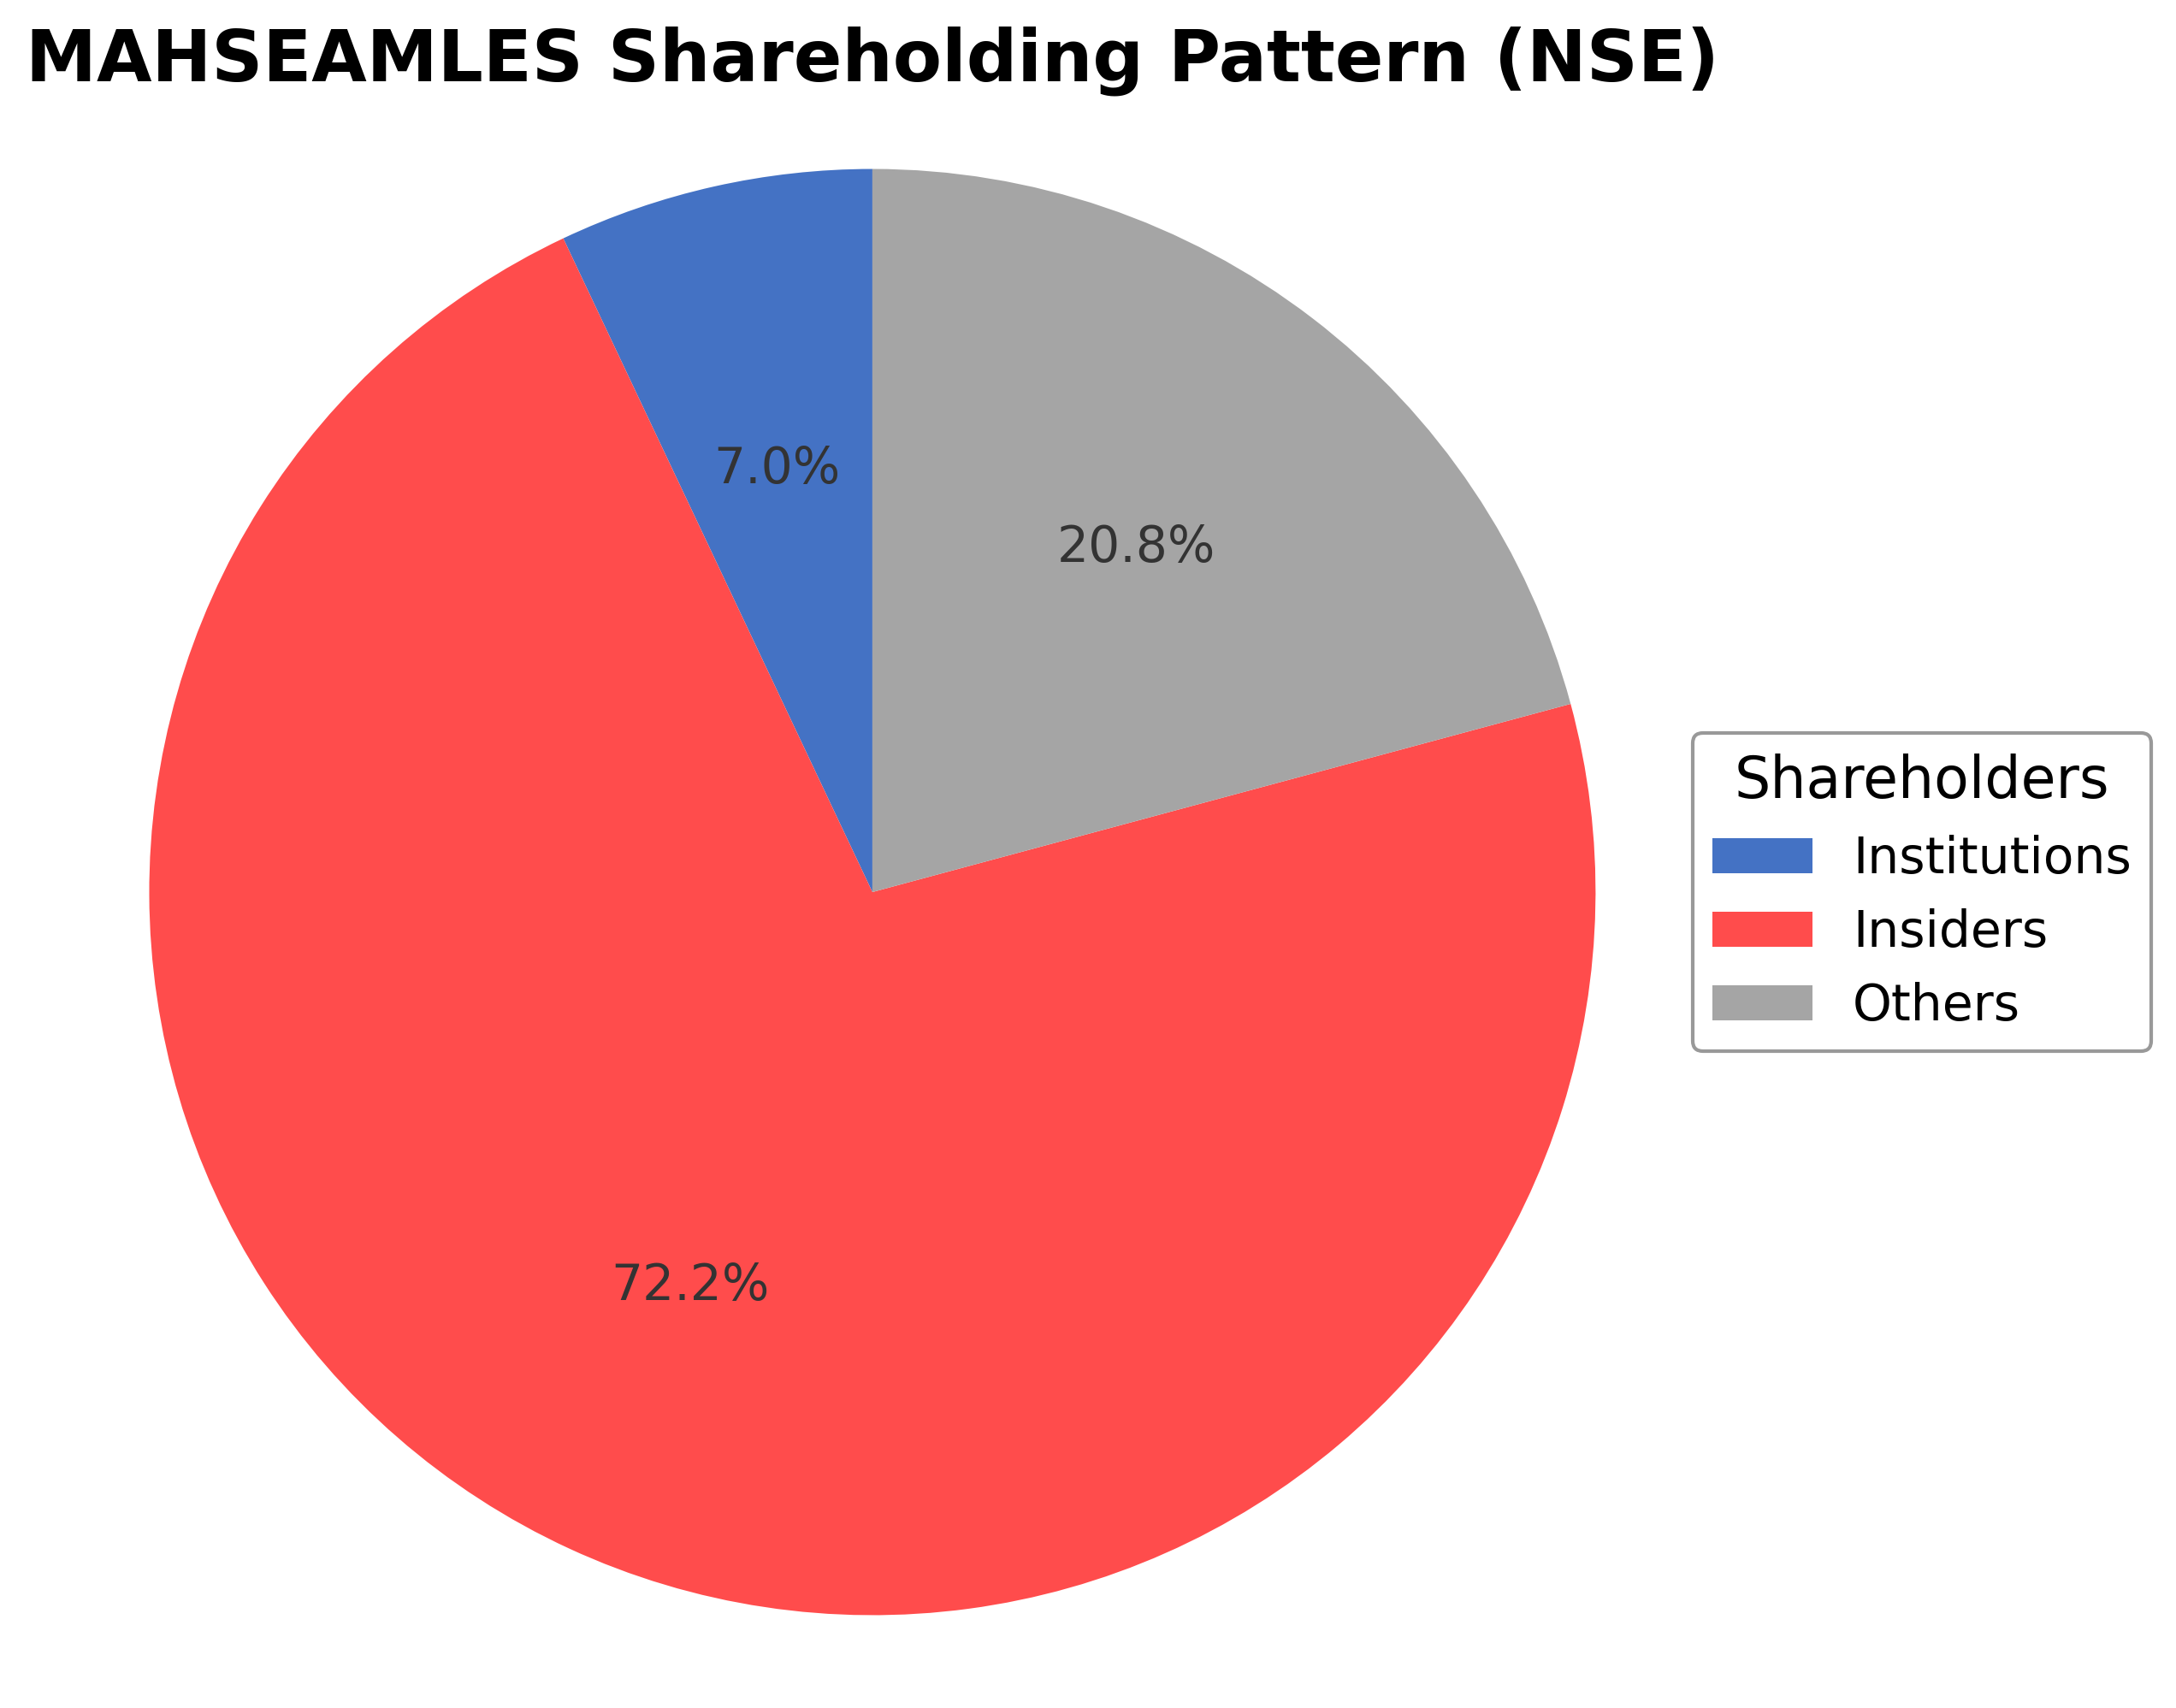
Maharashtra Seamless Ltd.'s shareholding structure is dominated by insiders, primarily promoters holding approximately 72.16% of shares, reflecting strong control by the founding group. Institutional investors hold a modest 7.03%, while public and other shareholders account for around 20.81%. Over the past 12-24 months, promoter share encumbrance has been consistently absent, indicating a stable ownership stance. Institutional accumulation appears limited, with no significant recent changes reported among major funds. This concentrated ownership suggests a governance framework strongly influenced by promoters, which may impact strategic decisions and capital allocation. The current shareholding pattern underscores a market sentiment that values promoter stability and control within the steel manufacturing sector.
Sector and Industry Analysis
The seamless pipe sector is integral to industries such as oil and gas, power generation, and construction, with the global market poised for significant growth driven by rapid industrialization and infrastructure modernization. Asia Pacific leads this expansion, fueled by increased energy activities and government support in countries like India and China. Key players in the market include Maharashtra Seamless Ltd., Kamal Steel, and ArcelorMittal, among others, competing across various geographies and product segments.
Industry trends highlight a rising preference for seamless pipes due to their ability to withstand high pressures and harsh environments, making them cost-effective compared to welded alternatives. The market is also influenced by advancements in manufacturing processes and the growing demand for corrosion-resistant materials. Competitive dynamics are shaped by barriers such as tariffs and trade tensions, notably between the US and China, which may constrain growth and affect supply chains.
Regulatory frameworks emphasize quality standards and environmental compliance, with governments in major markets providing support to boost domestic production and infrastructure development. Tariffs and trade policies remain critical factors that could impact import-export flows and pricing structures. Overall, the regulatory environment is expected to encourage modernization efforts while balancing trade considerations in the seamless pipe industry.
Note: Analysis synthesized from industry research, market reports, and regulatory filings. Information is subject to change based on market conditions.
Financial Ratios Dashboard
Illustrative Scenario Analysis
DCF Assumptions:
Method: Two-Stage EPS-Priority Model
Financials
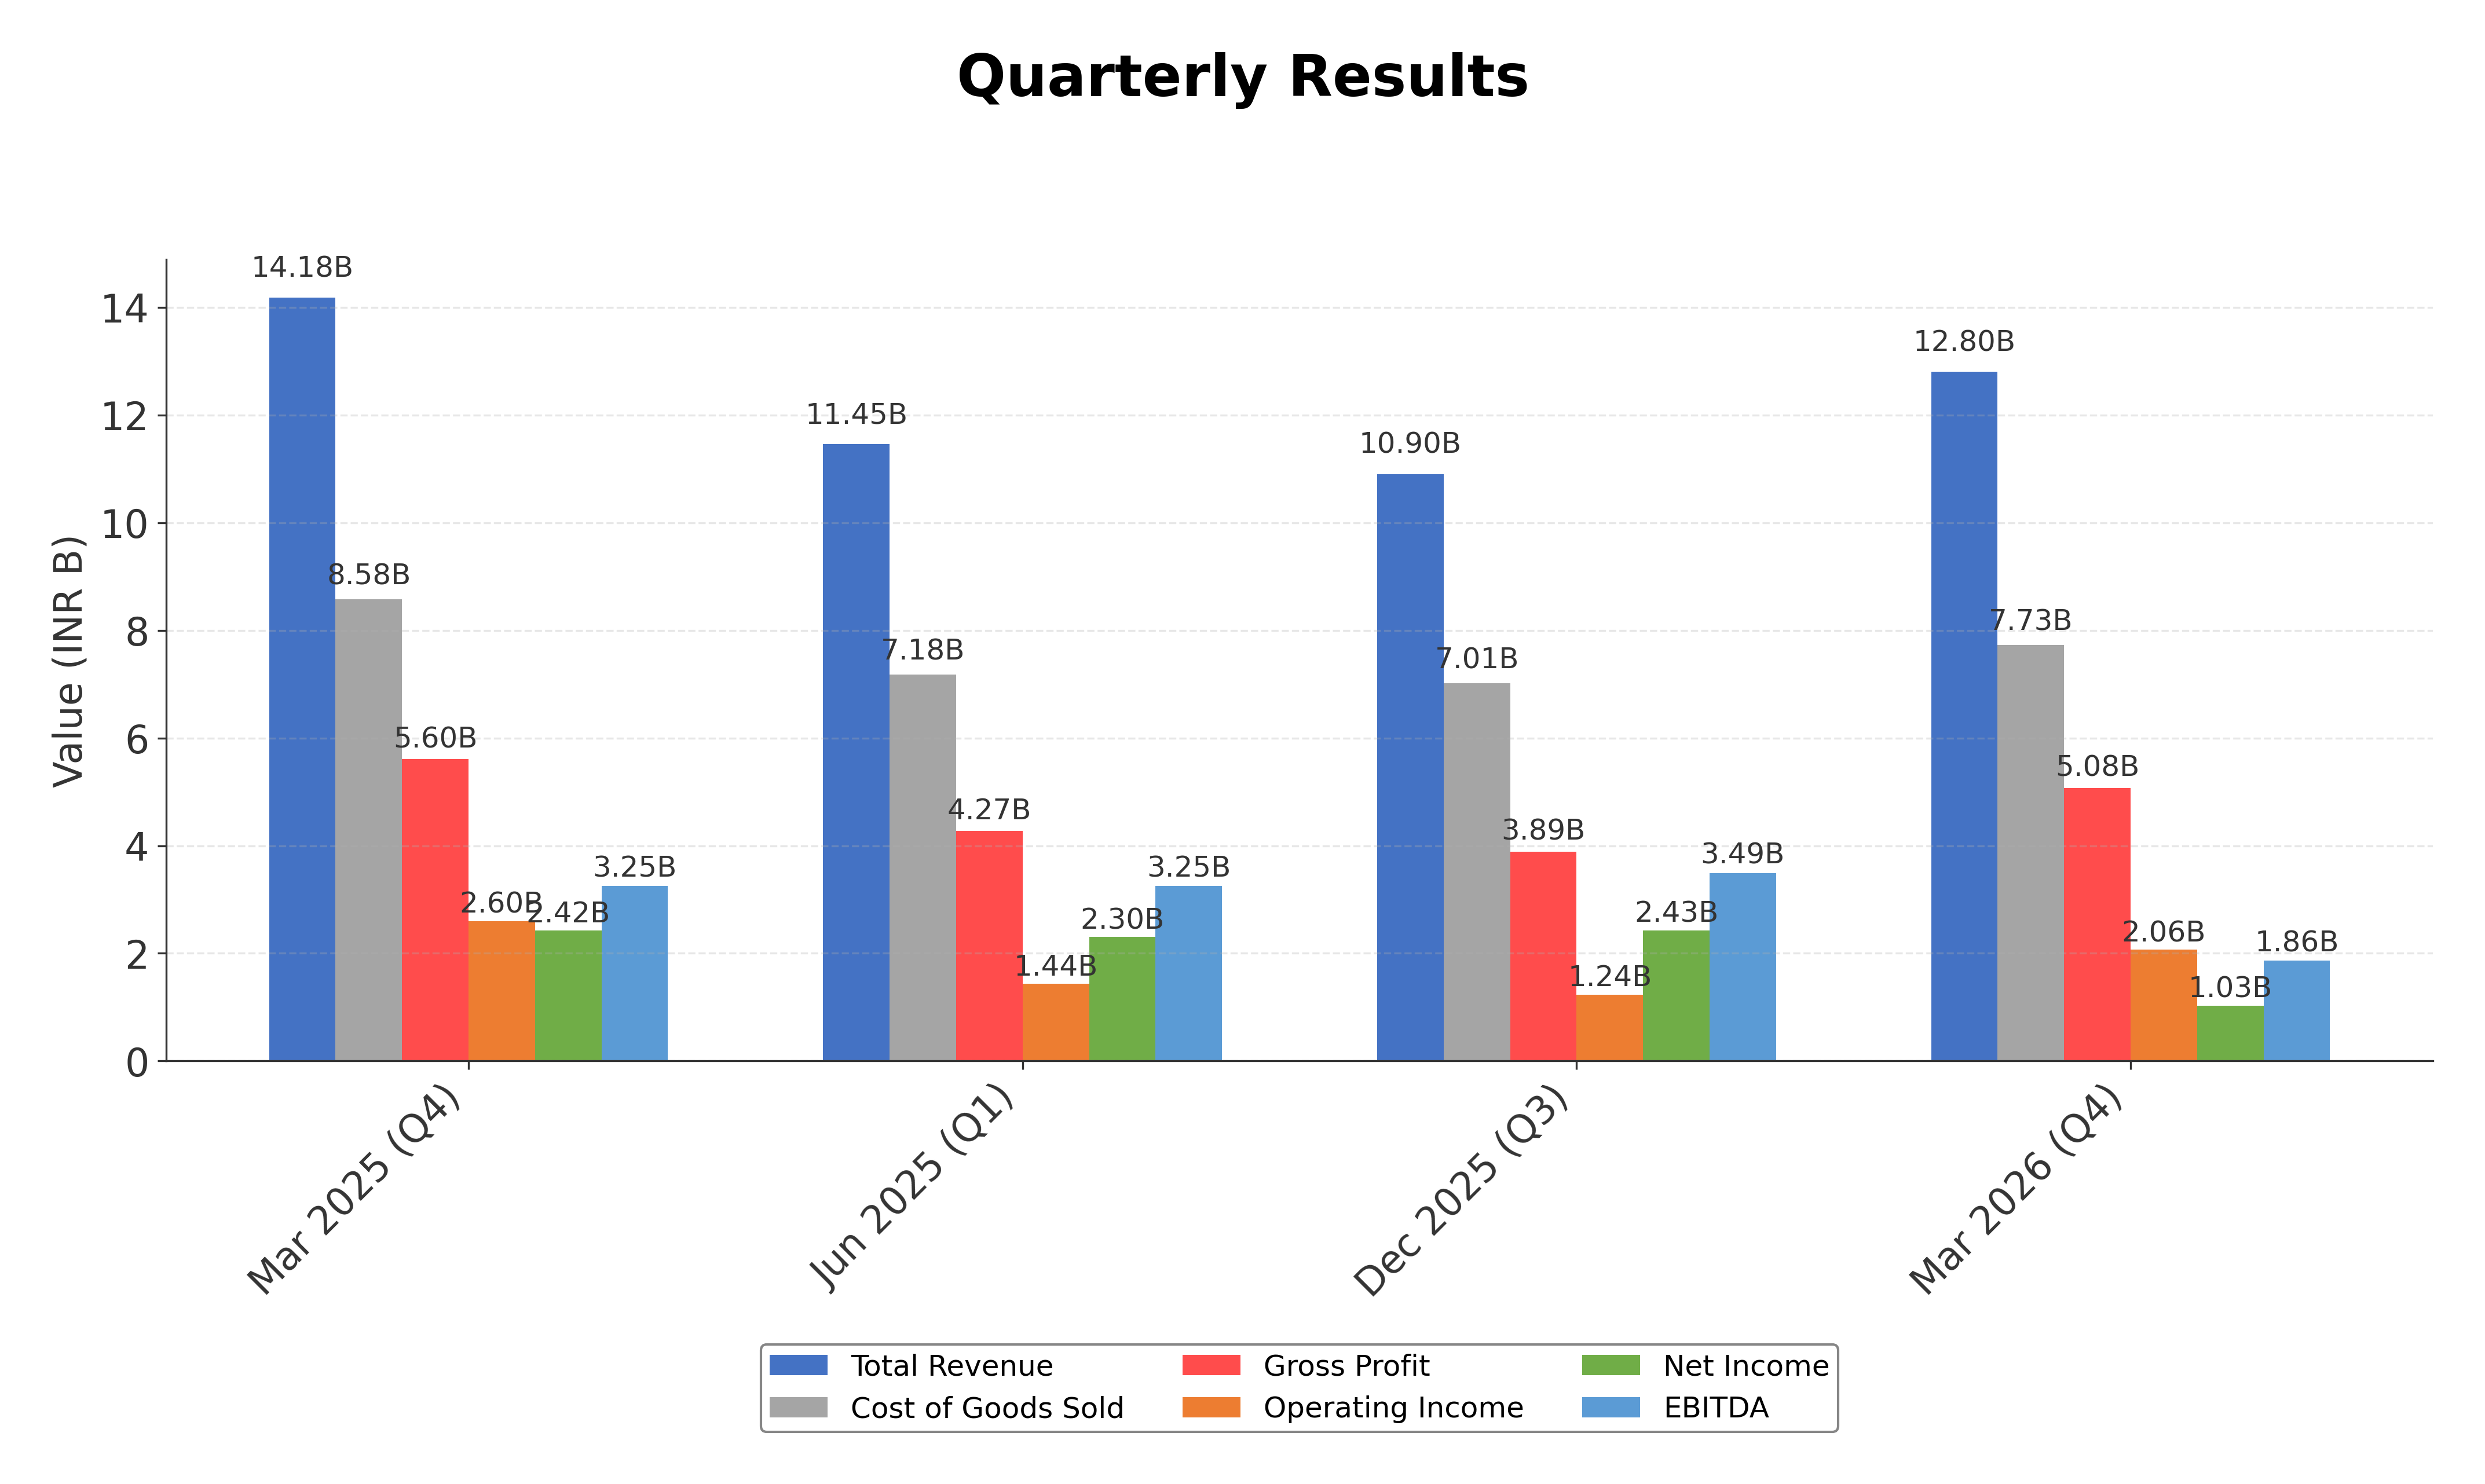
Peer Analysis
| Company Name | Market Cap | P/E Ratio | P/B Ratio | EV/EBITDA | Price to CFO |
|---|---|---|---|---|---|
| Maharashtra Seamless Ltd. | ₹80.19B | 11.45 | 1.17 | 6.25 | 8.59 |
| Ratnamani Metals & Tubes Ltd. | ₹188.81B | 38.22 | 4.49 | 23.95 | 20.17 |
| Usha Martin Ltd. | ₹155.27B | 31.17 | 4.63 | 21.35 | 23.69 |
| Jindal Steel & Power Ltd. | ₹1.07T | 31.11 | 2.06 | 12.64 | 14.85 |
| Jindal Saw Ltd. | ₹175.86B | 18.12 | 1.40 | 9.94 | 9.93 |
| Nmdc Limited | ₹746.60B | 10.03 | 2.19 | 7.51 | 14.94 |
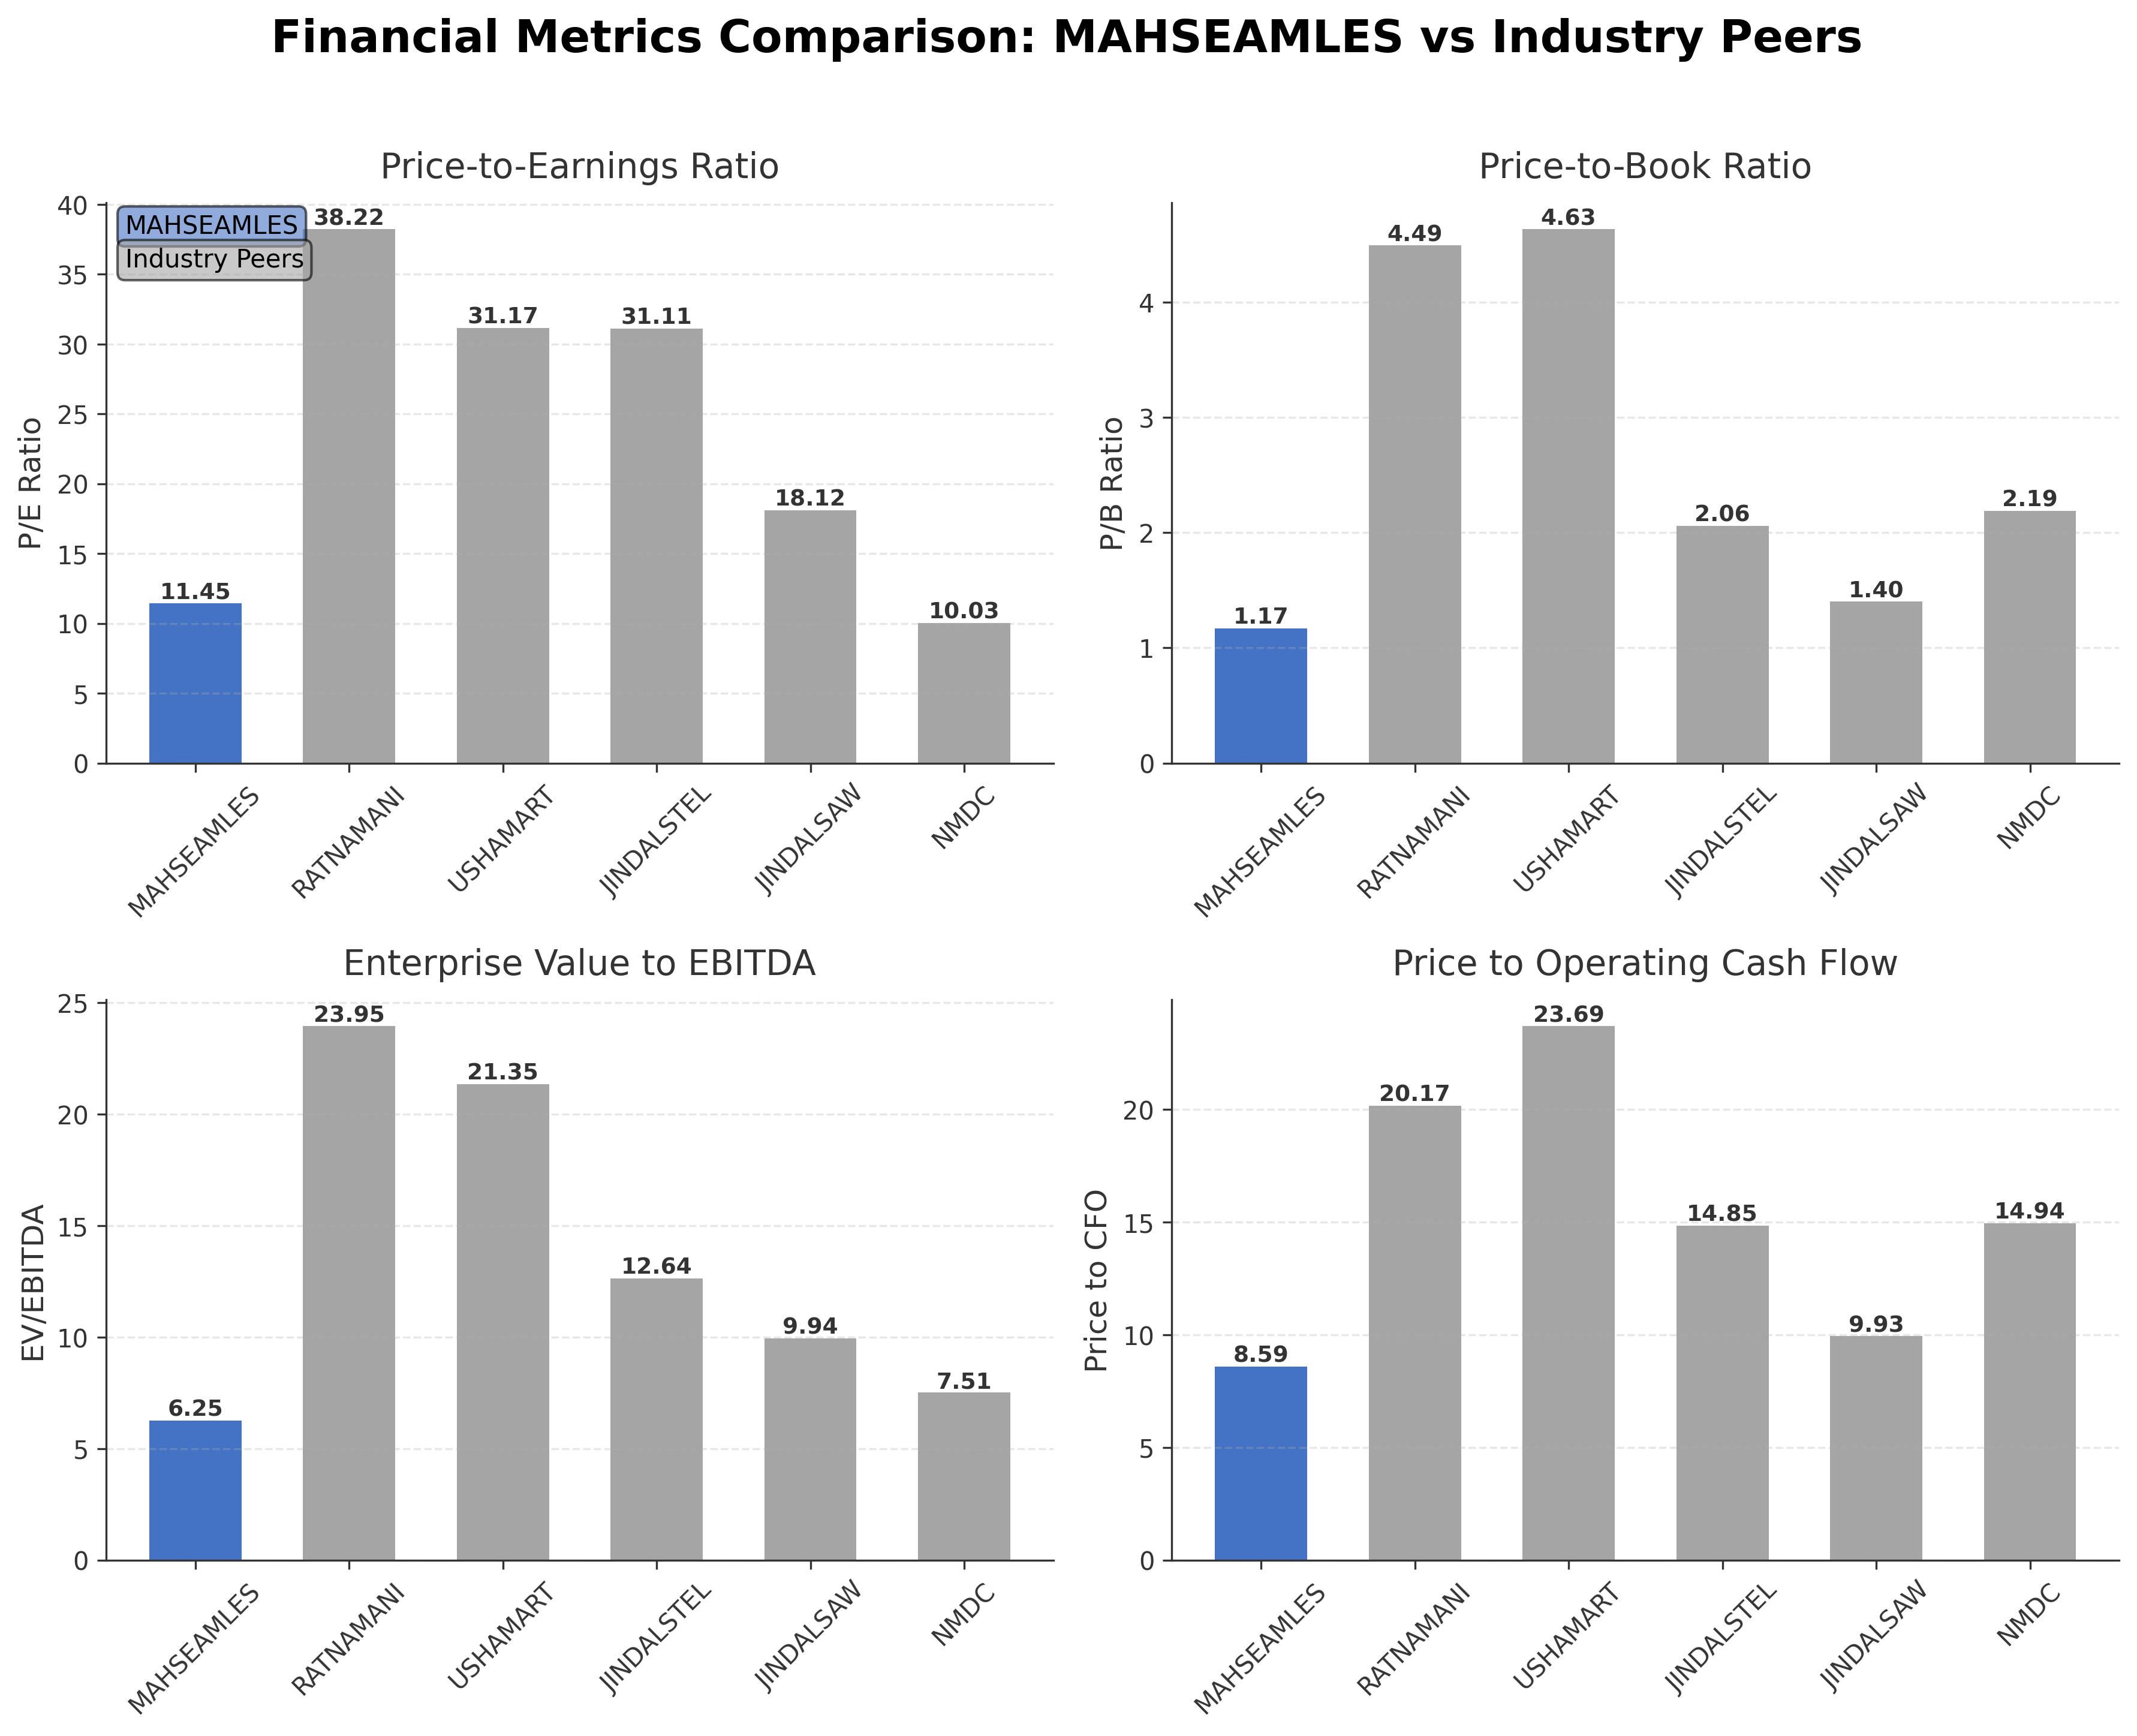
Comparison Analysis: Maharashtra Seamless Ltd. trades at a significantly lower P/E ratio of 11.45 compared to its peers, whose ratios range from 10.03 to 38.22, indicating more conservative valuation. Its price-to-book ratio of 1.17 is also the lowest among the group, suggesting undervaluation relative to book value. The EV/EBITDA multiple of 6.25 is below most peers, reflecting a potentially attractive earnings valuation. However, the company’s return on equity of 10.61% is moderate compared to peers like NMDC at 23.36% and Usha Martin at 16.23%. Overall, Maharashtra Seamless presents a value-oriented profile with solid fundamentals but comparatively lower profitability metrics than some larger industry players.
Financial Metrics Comparison with Peers
Financial Statements
Comprehensive financial data including income, balance sheet, and cash flow metrics
Income Statement
| fiscal_date | 2026-03-31 | 2025-03-31 | 2024-03-31 | 2023-03-31 | 2022-03-31 |
|---|---|---|---|---|---|
| Sales | 46.74B | 52.69B | 52.72B | 55.75B | 41.00B |
| Cost Of Goods | 29.75B | 33.17B | 38.97B | 43.27B | 33.78B |
| Gross Profit | 16.99B | 19.51B | 13.74B | 12.48B | 7.22B |
| Operating Expense Other Operating Expenses | 8.84B | 9.08B | 114.30M | 120.40M | 104.92M |
| Operating Income | 5.71B | 8.19B | 11.13B | 9.21B | 4.74B |
| Non Operating Interest Expense | 25.80M | 27.60M | 36.50M | 321.50M | 395.33M |
| Pretax Income | 9.39B | 10.00B | 12.23B | 9.24B | 5.11B |
| Income Tax | 2.38B | 2.23B | 2.71B | 1.56B | -1.80B |
| Net Income | 7.01B | 7.77B | 9.52B | 7.68B | 6.92B |
| Eps Basic | 52.33 | 58.02 | 70.99 | 57.07 | 51.62 |
| Eps Diluted | 52.33 | 58.02 | 70.99 | 57.07 | 51.62 |
| Basic Shares Outstanding | 134.01M | 134.00M | 134.00M | 134.00M | 67.00M |
| Diluted Shares Outstanding | 134.01M | 134.00M | 134.00M | 134.00M | 67.00M |
| Ebit | 9.42B | 10.03B | 12.26B | 9.56B | 5.51B |
| Ebitda | 10.55B | 11.04B | 12.61B | 10.82B | 6.68B |
| Net Income Continuous Operations | 8.68B | 9.65B | 12.94B | 9.90B | 5.33B |
| Minority Interests | 2.50M | 1.40M | -3.60M | -28.70M | 794.00K |
| Preferred Stock Dividends | 0.00 | 0.00 | 0.00 | 0.00 | 0.00 |
| Operating Expense Selling General And Administrative | N/A | 1.96B | 1.60B | 2.20B | 1.26B |
| Non Operating Interest Income | N/A | 693.70M | 403.10M | 478.30M | 437.46M |
Data provided by Twelve Data
Balance Sheet
| fiscal_date | 2026-03-31 | 2025-03-31 | 2024-03-31 | 2023-03-31 | 2022-03-31 |
|---|---|---|---|---|---|
| Cash And Cash Equivalents | 767.00M | 418.20M | 545.20M | 544.10M | 709.78M |
| Accounts Receivable | 5.65B | 6.53B | 5.18B | 6.42B | 5.57B |
| Total Assets | 77.39B | 70.33B | 65.88B | 58.59B | 53.88B |
| Total Liabilities | 8.63B | 6.93B | 8.57B | 10.85B | 14.04B |
| Long Term Debt | 86.90M | 1.00M | 0.00 | 1.62B | 5.15B |
| Shareholders Equity | 68.76B | 63.40B | 57.31B | 47.74B | 39.84B |
Data provided by Twelve Data
Cash Flow Statement
| fiscal_date | 2026-03-31 | 2025-03-31 | 2024-03-31 | 2023-03-31 | 2022-03-31 |
|---|---|---|---|---|---|
| Operating Activities Net Income | 8.68B | 9.65B | 12.94B | 9.90B | 5.33B |
| Operating Activities Other Non Cash Items | -404.70M | -671.90M | -322.20M | -100.00M | 4.41M |
| Operating Activities Accounts Receivable | 752.50M | -367.80M | 1.13B | 655.90M | -2.33B |
| Operating Activities Other Assets Liabilities | 2.03B | 2.35B | -702.30M | -708.10M | -4.63B |
| Operating Activities Operating Cash Flow | 11.06B | 10.95B | 13.05B | 9.75B | -1.62B |
| Investing Activities Capital Expenditures | 13.10M | 400.00K | 200.00K | 600.00K | 8.48M |
| Investing Activities Purchase Of Investments | -38.92B | -37.77B | -31.49B | -20.78B | -6.69B |
| Investing Activities Sale Of Investments | 32.32B | 30.18B | 23.53B | 16.01B | 7.72B |
| Investing Activities Other Investing Activity | 5.70M | 5.80M | 3.80M | 4.90M | 7.04M |
| Investing Activities Investing Cash Flow | -6.58B | -7.58B | -7.96B | -4.83B | 4.30B |
| Financing Activities Short Term Debt Issuance | 47.30M | -7.30M | -823.60M | -1.18B | -1.14B |
| Financing Activities Common Dividends | -1.34B | -1.34B | -670.00M | -337.30M | -236.49M |
| Financing Activities Financing Cash Flow | -1.29B | -1.35B | -1.49B | -1.52B | -1.37B |
| End Cash Position | 767.00M | 418.20M | 545.20M | 544.10M | 709.78M |
| Free Cash Flow | 7.64B | 5.86B | 10.09B | 8.93B | -2.78B |
| Investing Activities Net Acquisitions | N/A | N/A | 0.00 | -69.60M | 3.25B |
Data provided by Twelve Data
Technical Analysis
Key Insights
- The current trend shows mixed price action with the stock trading above its 200-day moving average (₹580.15) but below the 50-day moving average (₹626.17), indicating potential consolidation.
- Key support levels are identified near the 52-week low of ₹500.70 and the 200-day moving average around ₹580, while resistance is observed near the 50-day moving average at ₹626 and the 52-week high of ₹748.75.
- The stock is positioned between its short-term and long-term moving averages, suggesting indecision among market participants.
- Momentum indicators show a neutral to slightly bearish stance with RSI near mid-levels, MACD indicating weakening momentum, and stochastic oscillators reflecting a recent momentum shift.
- Multi-timeframe analysis reveals that daily charts show consolidation, weekly charts indicate sideways movement, and monthly charts suggest a longer-term uptrend remains intact.
- Potential market scenarios include a range-bound movement with possible testing of support levels, or a breakout above the 50-day moving average that could signal renewed upward momentum.
Trending News
1. Headline: Gold Price Today in Noida – 18K, 22K & 24K Rate | 12 July 2026
Summary: Check the latest gold rate in Noida on 12 July 2026. View today’s 18K, 22K & 24K gold price per gram, daily updates, and live gold market trends.
Sentiment: neutral
2. Headline: Earnings call transcript: Bank of Maharashtra posts strong Q1 2026 growth By Investing.com
Summary: Bank of Maharashtra reported a strong start to fiscal 2027, with net profit rising 27% year on year to INR 2,020 crore and operating profit increasing 21% to INR 3,117 crore in the June quarter. The state-owned lender said performance stayed above internal guidance across key measures, while asset quality remained stable. The stock ...
Sentiment: positive
3. Headline: MAHSEAMLES Share Price | Maharashtra Seamless Ltd Stock Analysis & Recommendation
Summary: Maharashtra Seamless Ltd has seen its valuation grade downgraded from attractive to fair, reflecting a notable shift in price metrics amid evolving market conditions. Despite this, the company’s price-to-earnings (P/E) ratio of 10.36 remains significantly lower than many peers in the iron and steel products sector, suggesting a relative value proposition that merits close investor attention.Read full news article · Apr 20: Stock ...
Sentiment: negative
4. Headline: Maharashtra Seamless Ltd Downgraded to Sell Amid Technical and Financial Concerns
Summary: Maharashtra Seamless Ltd has seen its investment rating downgraded from Hold to Sell, driven primarily by deteriorating technical indicators and disappointing financial trends. Despite a fair valuation and stable quality metrics, the company’s stock performance and technical outlook have ...
Sentiment: negative
5. Headline: Maharashtra Seamless Ltd Faces Technical Momentum Shift Amid Mixed Market Signals
Summary: Maharashtra Seamless Ltd, a small-cap player in the Iron & Steel Products sector, has experienced a notable shift in its technical momentum, prompting a downgrade in its MarketsMOJO Mojo Grade from Hold to Sell as of 29 June 2026. The stock’s recent price action and technical indicators reveal ...
Sentiment: negative
Powered by Brave
Recent Updates
News Summary
As of April 4, 2026. Maharashtra Seamless Limited’s promoters declared no share encumbrance during the financial year 2025-26, confirming that promoter holdings remain unpledged and signaling financial stability. The company reported its audited financial results for the fiscal year ending March 31, 2026, with standalone revenue of INR 4,671.41 crore and net profit of INR 718.16 crore. The Board recommended a final dividend of INR 10 per equity share for FY26, reflecting consistent shareholder returns. Despite a notable decline in quarterly earnings by 57.52% year-over-year in Q4, the overall annual performance remains stable. The company continues to comply with SEBI regulations, maintaining transparency in disclosures and governance.
News Sentiment
The overall sentiment from recent updates is neutral to slightly positive, driven by the promoter group’s commitment to maintaining unencumbered shares and the declaration of a stable dividend. However, the significant quarterly earnings decline tempers enthusiasm, highlighting some operational challenges. Transparency and regulatory compliance reinforce confidence in governance, while the absence of share pledging suggests financial prudence. The sentiment balance reflects steady fundamentals amid short-term earnings volatility.
Source List
- https://scanx.trade/stock-market-news/companies/maharashtra-seamless-promoters-declare-no-share-encumbrance-in-fy26/44305631
- https://www.investywise.com/maharashtra-seamless-limited-q4-earnings-and-dividend-announcement/
- https://www.theglobeandmail.com/investing/markets/markets-news/Tipranks/2113798/maharashtra-seamless-publishes-audited-fy26-results-in-line-with-sebi-norms/
Analytical Overview
Analysis Summary
Maharashtra Seamless Ltd. trades at a trailing P/E of 11.45 and a forward P/E of 9.15, which are below the industry average P/E of 11.45, indicating a relatively attractive valuation compared to peers. The company’s revenue has declined by 12.8% quarter-over-quarter, and quarterly earnings have dropped by over 50%, suggesting near-term growth challenges. Financial health appears strong with a low debt-to-equity ratio of 0.194 and robust operating cash flow of INR 9.33 billion, supporting liquidity and operational stability. Sector-specific challenges include cyclicality in steel demand and competitive pressures, while opportunities arise from infrastructure growth and energy sector expansion in India. The company’s market positioning benefits from promoter stability and strong cash reserves, which may support resilience amid economic fluctuations.
Overall Business and Market Assessment
Supporting Factors: Key supporting factors include reasonable valuation multiples below industry averages, strong liquidity with INR 36.79 billion in cash, and a conservative capital structure with minimal debt. Risks to monitor involve declining revenue and earnings growth, along with technical momentum deterioration reflected in recent downgrades. The appropriate investment timeframe is medium to long-term, considering the company’s stable fundamentals but near-term earnings volatility. Overall, Maharashtra Seamless presents a balanced risk-reward profile with solid financial footing tempered by recent operational headwinds.
Risk Factors: No data
SWOT Analysis
Strengths
- Strong cash position with INR 36.79 billion in cash and equivalents.
- Low debt-to-equity ratio of 0.194 indicating conservative leverage.
- Diverse product portfolio serving critical infrastructure sectors.
- Promoter group holds a majority stake with no share encumbrance.
Weaknesses
- Quarterly revenue declined by 12.8%, indicating near-term sales pressure.
- Quarterly earnings dropped by over 50% year-over-year.
- Moderate return on equity at 10.61% compared to some peers.
- Technical indicators show weakening momentum and recent downgrades.
Opportunities
- Growing demand in oil and gas, power, and infrastructure sectors in India.
- Potential for capacity expansion with committed capex plans.
- Stable dividend policy supporting shareholder returns.
- Increasing infrastructure investments could drive future sales.
Threats
- Cyclicality and volatility in the steel industry impacting demand.
- Competitive pressures from larger and more diversified peers.
- Macroeconomic uncertainties affecting capital expenditure in end markets.
- Regulatory changes impacting operational costs or export dynamics.
Company Description
Maharashtra Seamless Ltd. is a key player in the manufacturing sector, primarily focusing on the production of seamless pipes and tubes, which are essential components in various industries such as oil and gas, power, infrastructure, and automotive. Founded in 1988, the company stands out for its ability to manufacture a diverse range of cold drawn seamless pipes and ERW (Electric Resistance Welded) pipes that meet high industry standards. As part of the DP Jindal Group, Maharashtra Seamless Ltd. benefits from extensive market experience and expertise. The significance of Maharashtra Seamless Ltd. in the market stems from its ability to cater to the growing demands for high-quality structural components, aiding in the robust development of industrial and infrastructure projects. By employing advanced technology in its manufacturing processes, the company ensures dependable supply to both domestic and international markets. As infrastructure and energy sectors continue to expand, Maharashtra Seamless Ltd. plays a crucial role in facilitating the pipeline requirements essential for these industries, underscoring its importance in India's industrial landscape.