
Mahamaya Steel Industries Ltd (MAHASTEEL)
Stock Analysis Report
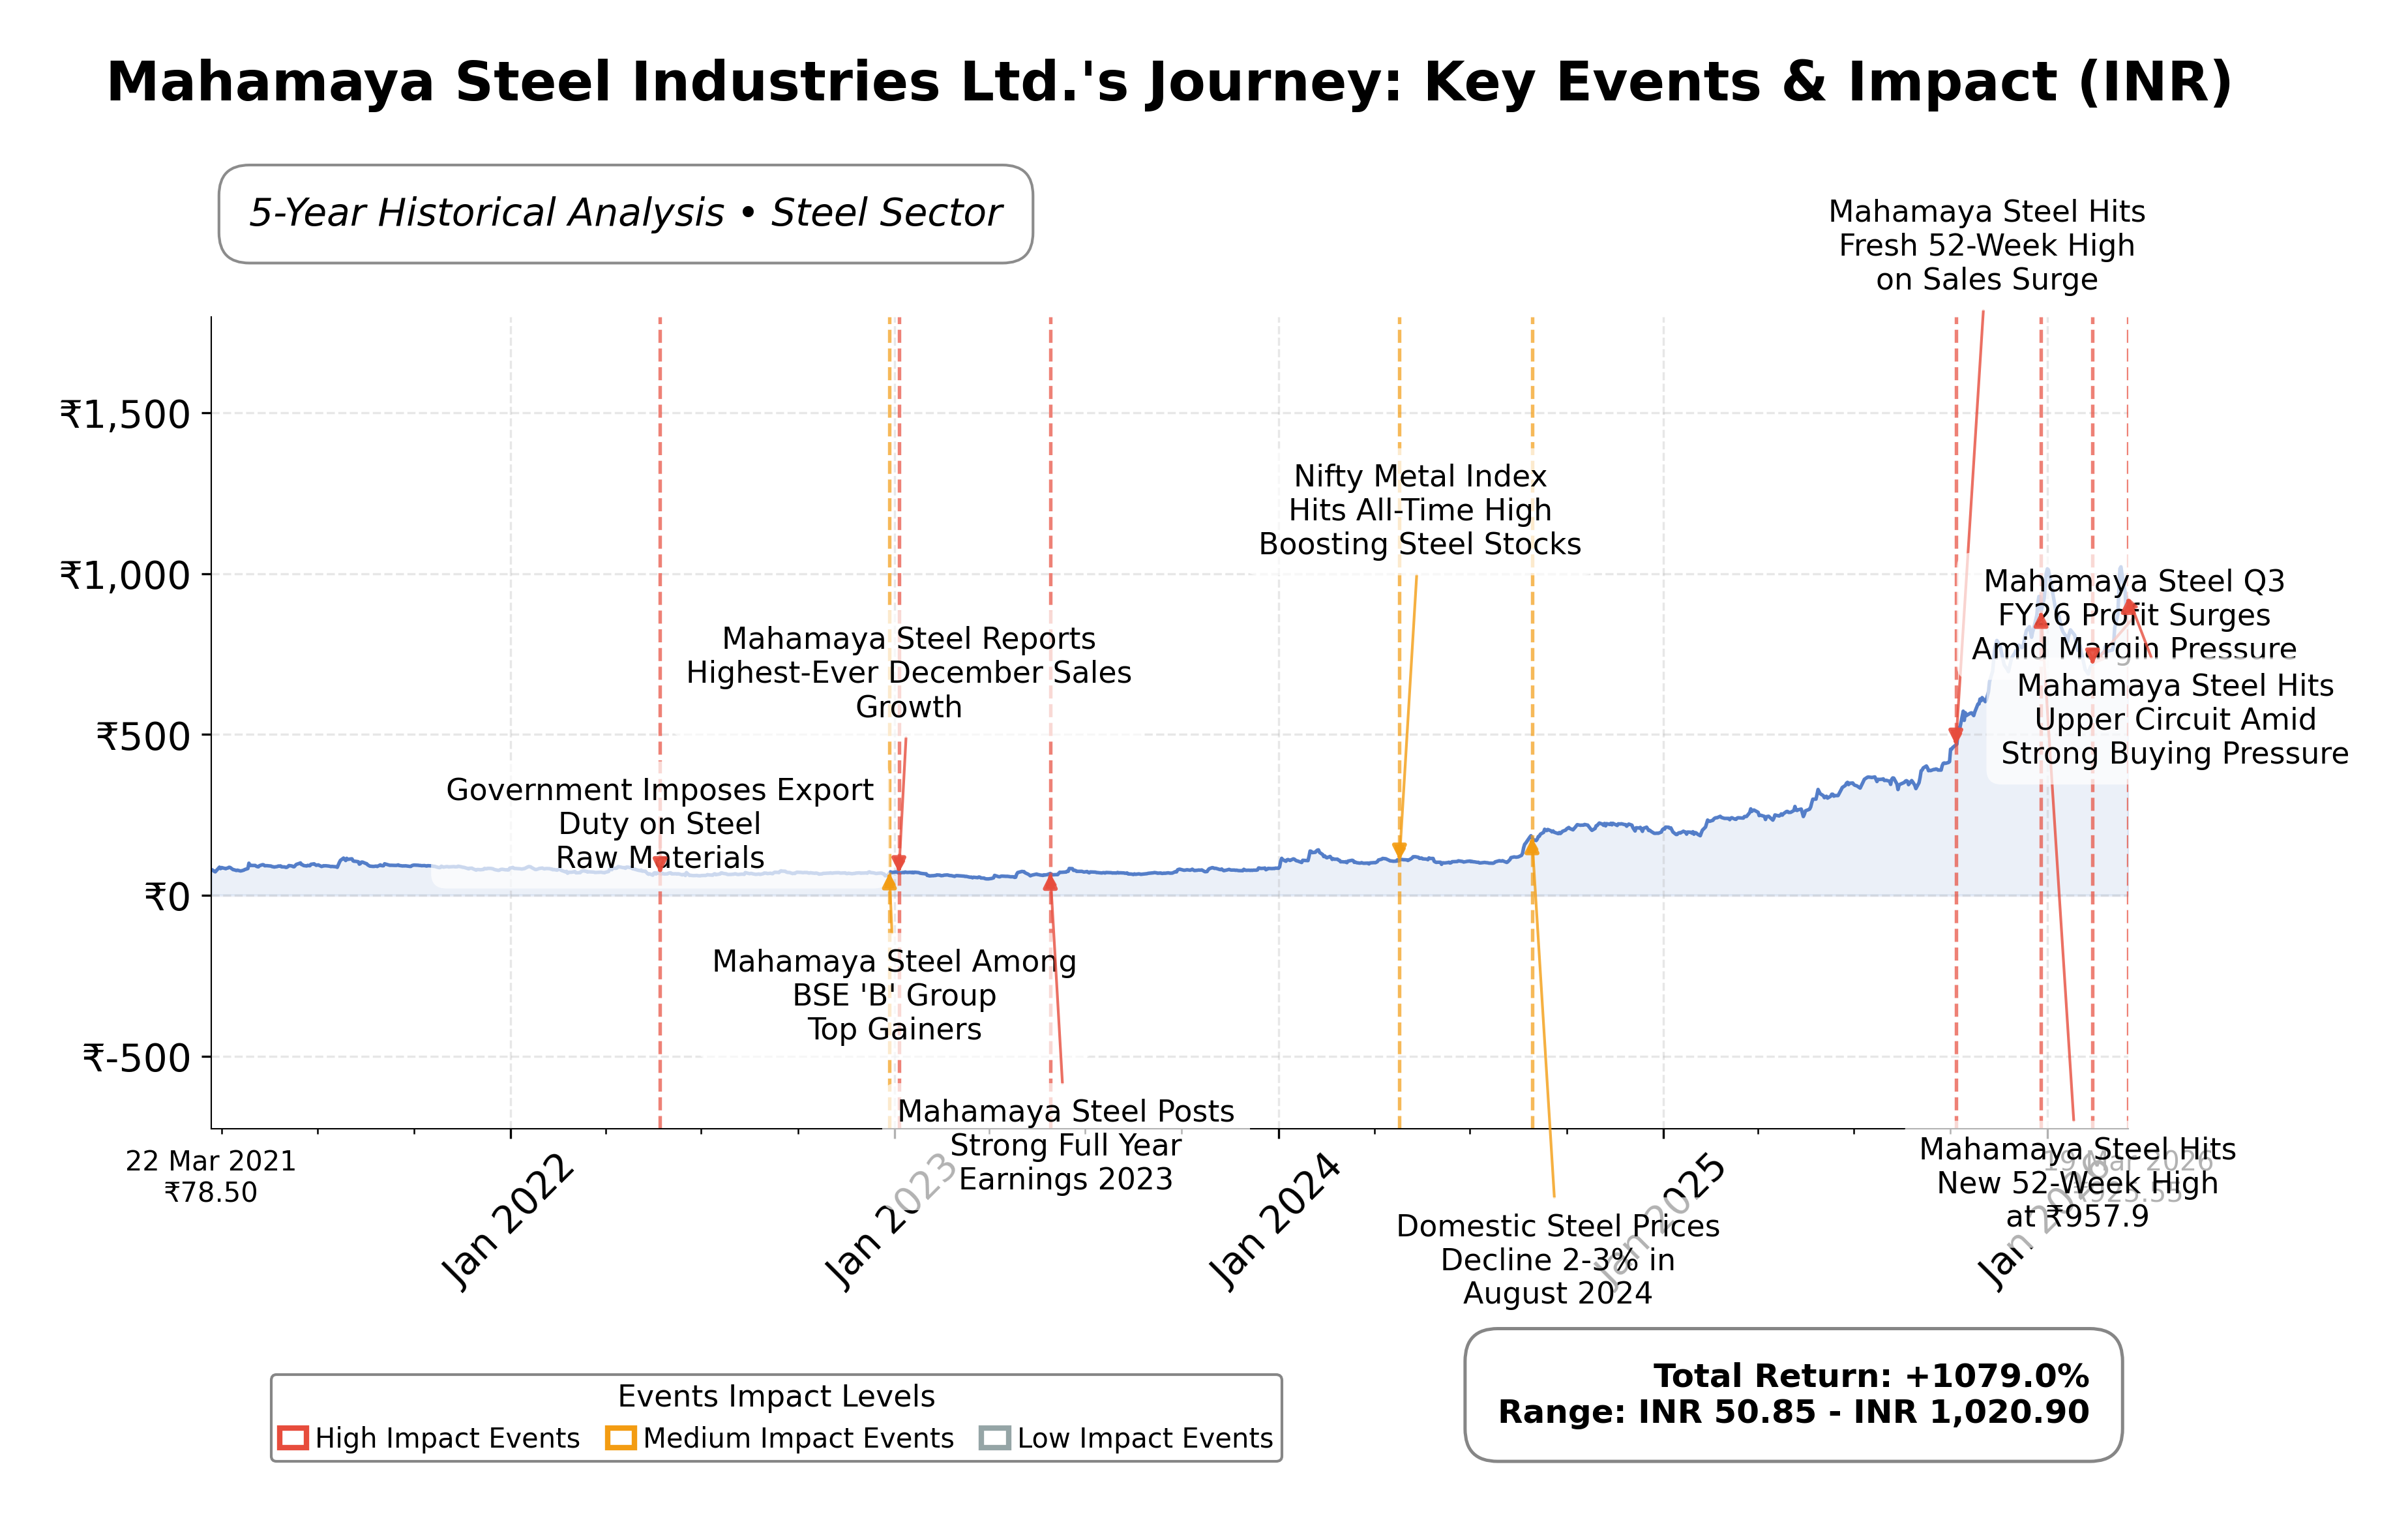
Stock Journey
Key Positives and Key Risks
Pros
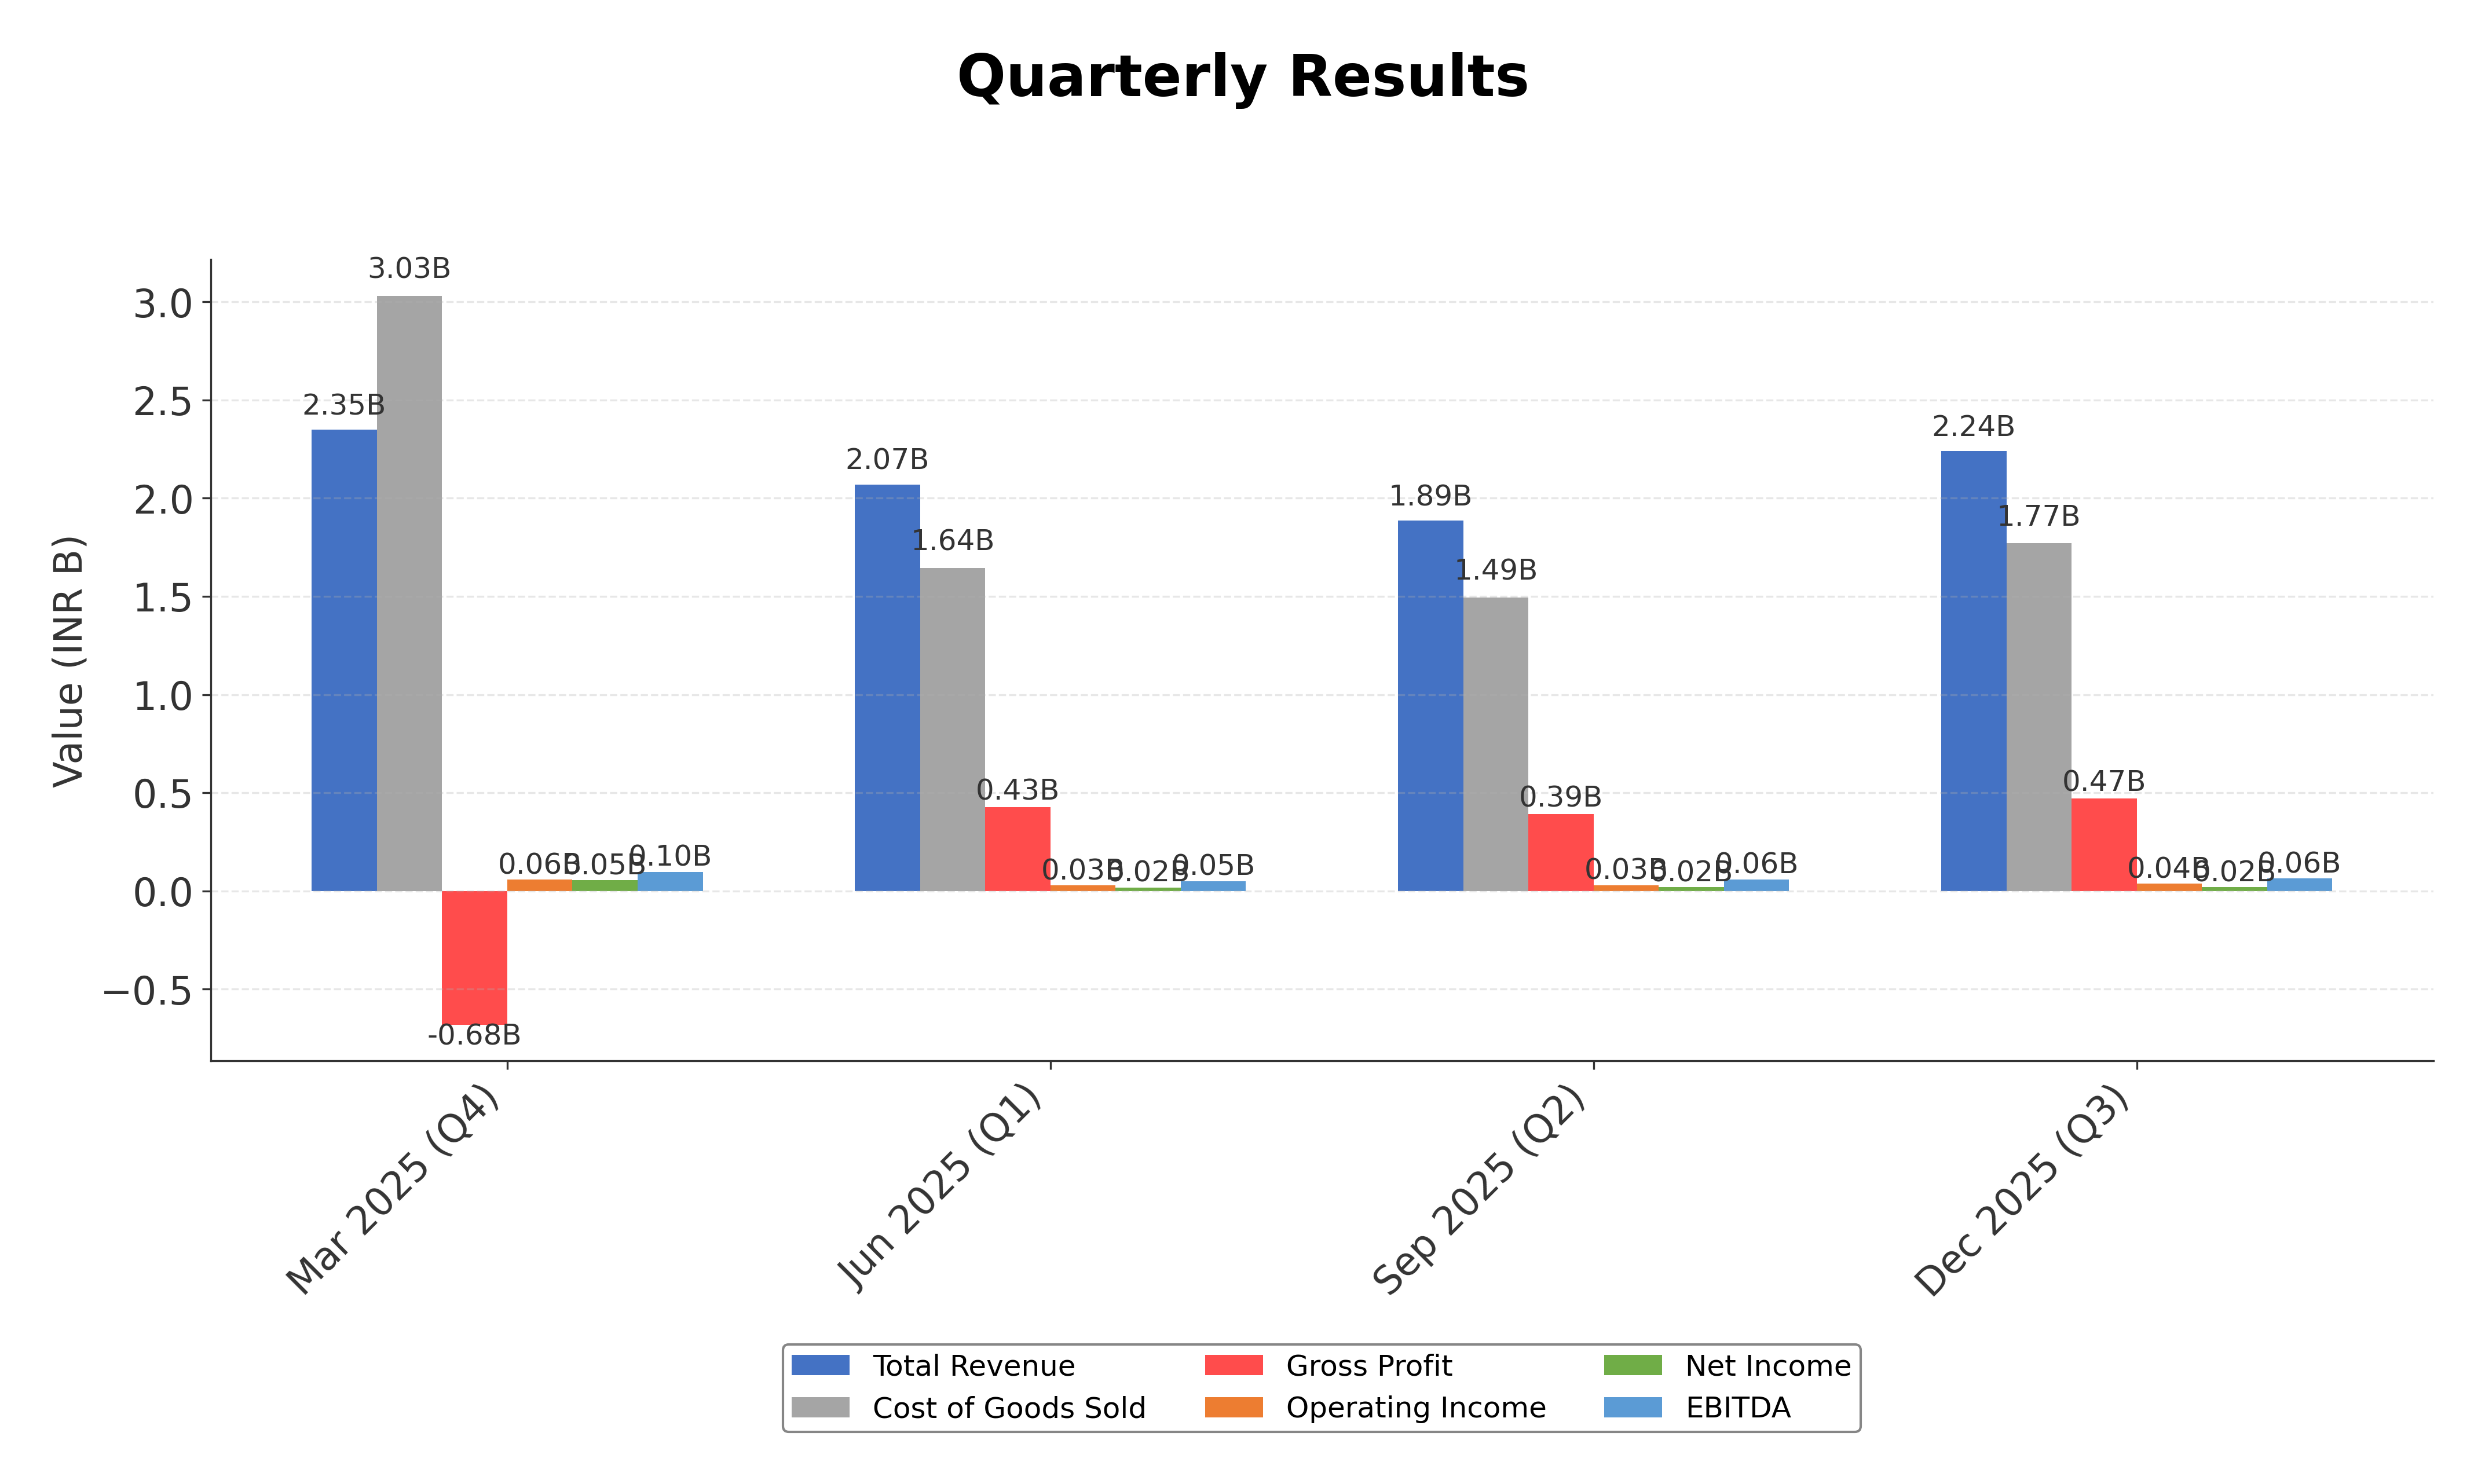
- Quarterly revenue growth of 12.2% and year-over-year earnings growth of 74.5% indicate strong recent operational momentum.
- Stock price near 52-week high of ₹1,050 reflects positive market sentiment and robust buying interest.
- Current ratio of 1.45 suggests adequate liquidity to meet short-term obligations.
Cons
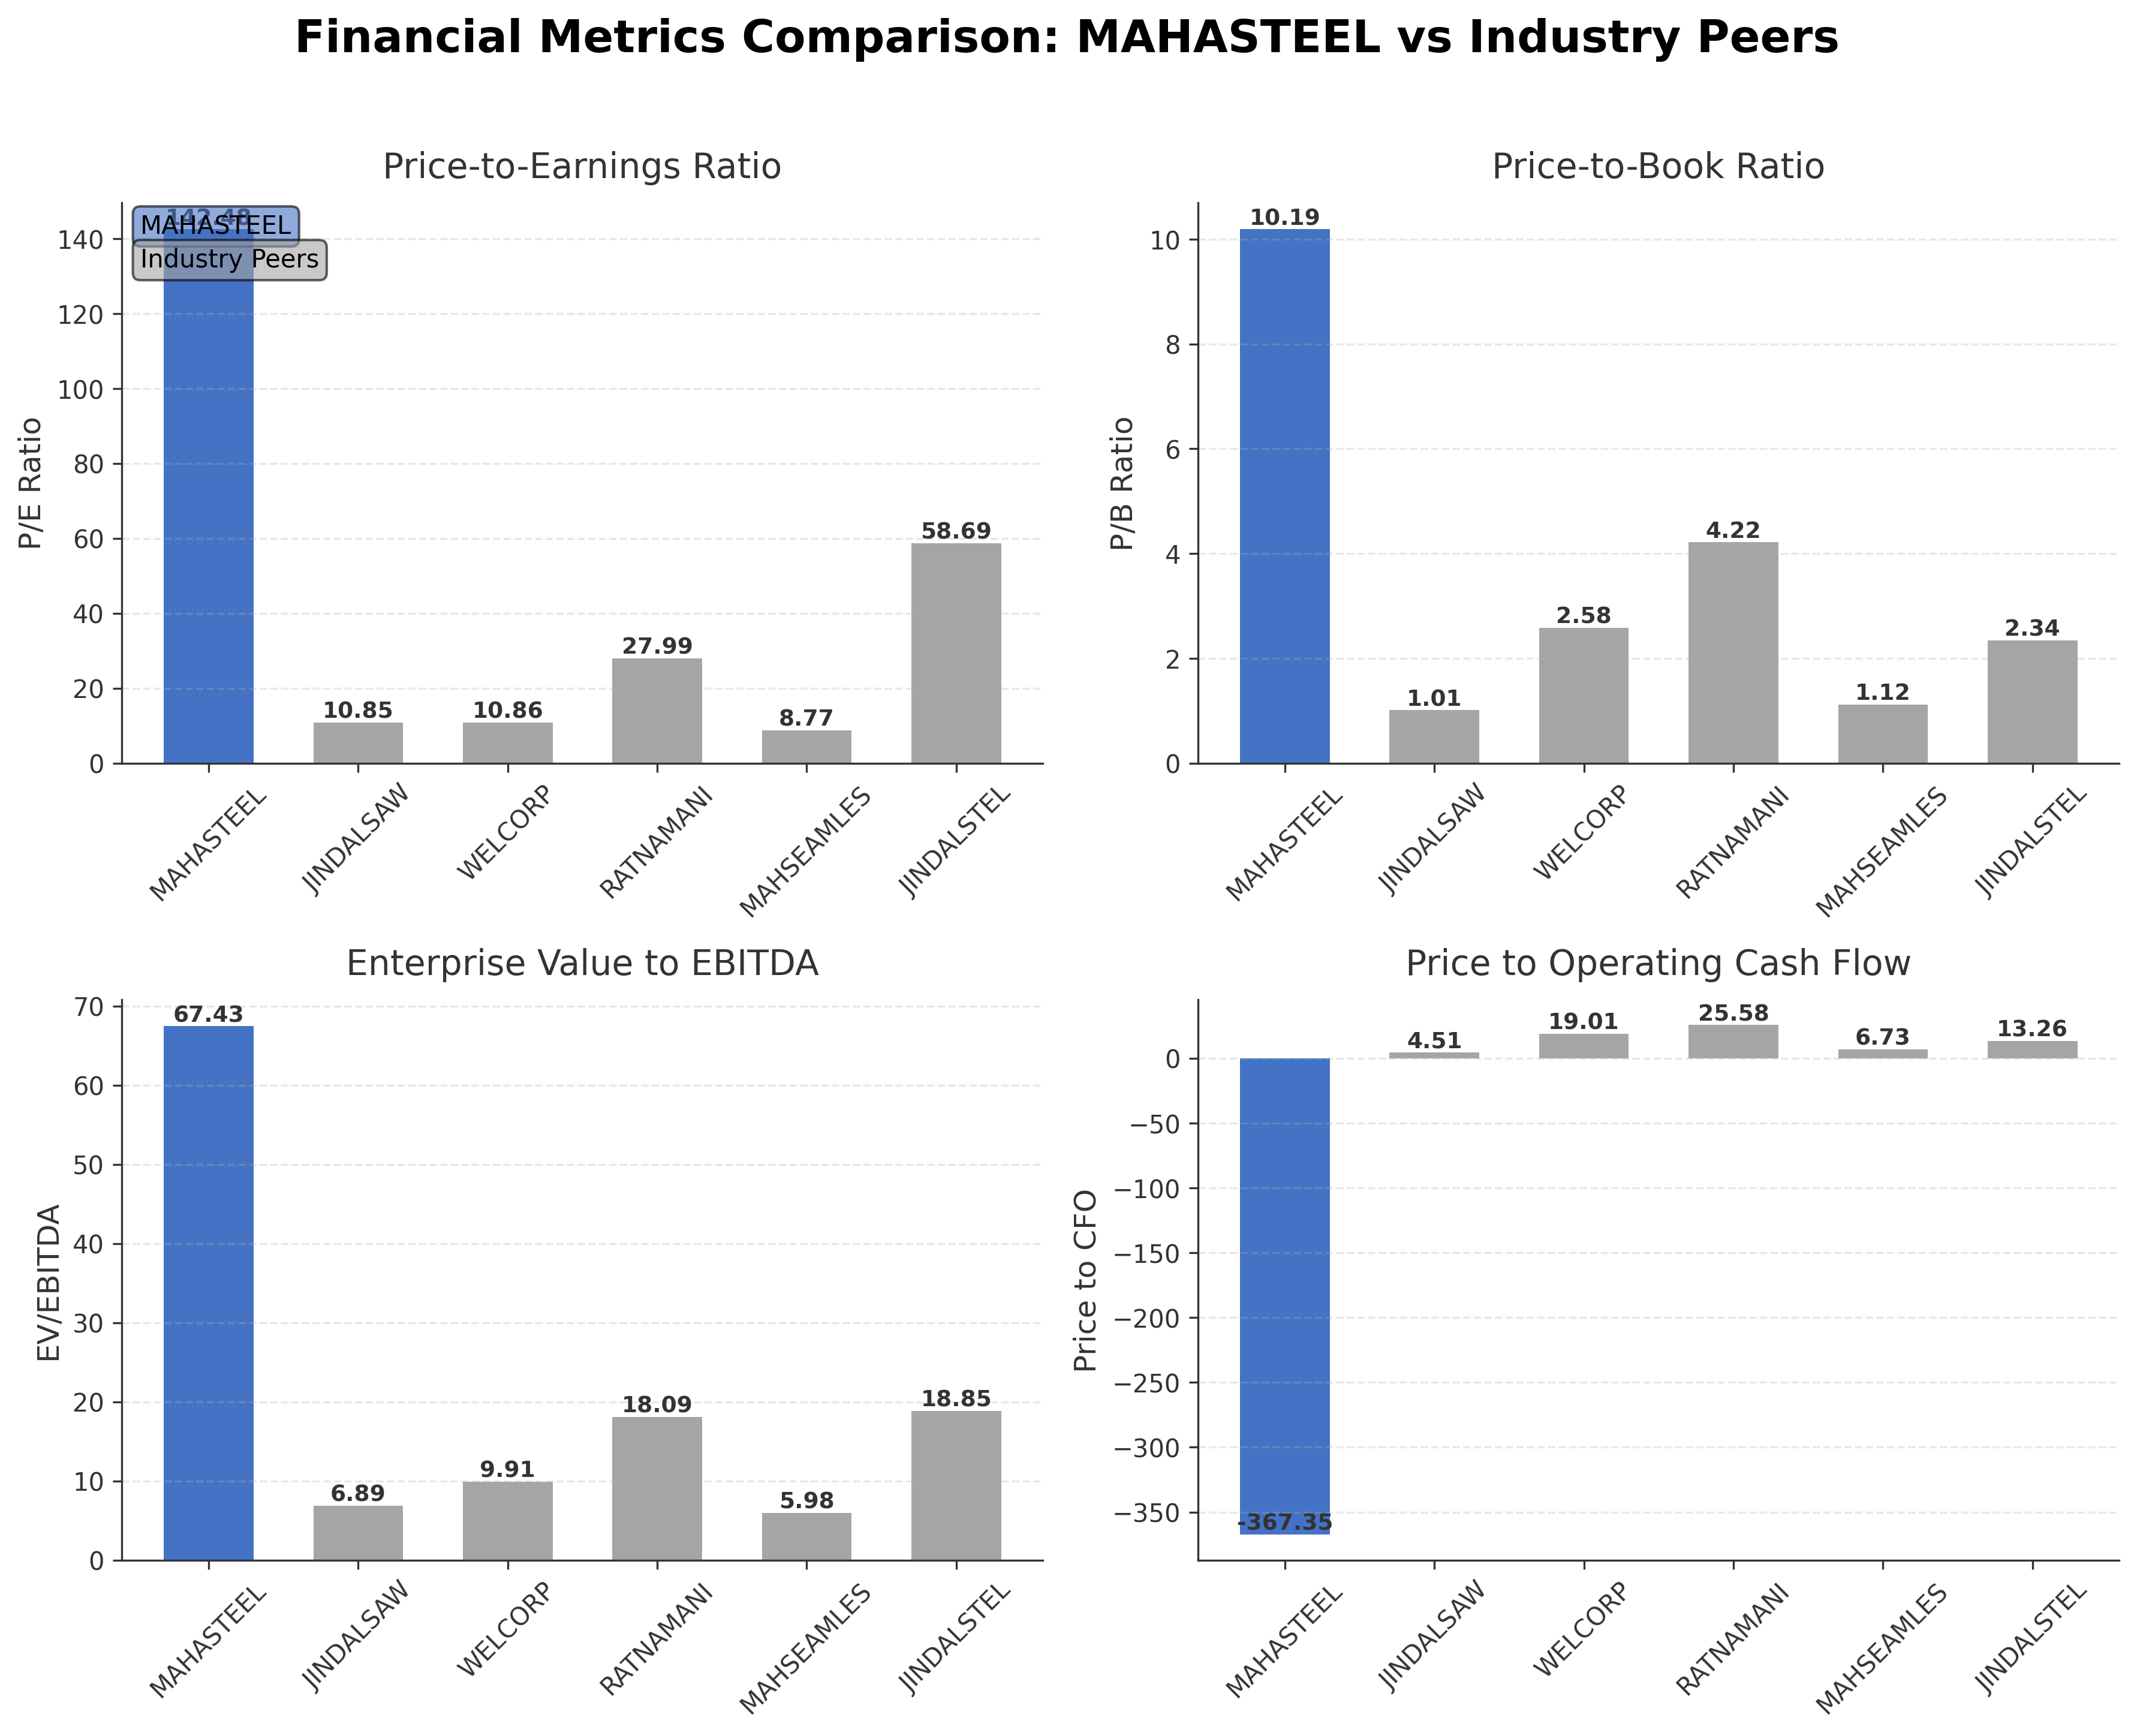
- Trailing P/E ratio of 142.48 and price-to-book ratio of 10.19 are significantly higher than industry peers, indicating a premium valuation.
- Negative operating cash flow of ₹42.92 million despite positive free cash flow raises concerns about cash generation sustainability.
- Return on equity at 0.05% is low compared to peers, reflecting limited profitability efficiency.
Disclosure: This information is for general awareness and does not constitute investment advice
Report Summary
Mahamaya Steel Industries Ltd. operates in the steel manufacturing sector, specializing in the production and trading of various steel structural products such as angles, channels, I-beams, and flats. These products serve critical roles in infrastructure, construction, and engineering projects across sectors including real estate, transportation, and industrial machinery. The company emphasizes quality, innovation, and sustainability, maintaining a significant presence in the domestic Indian market with outreach to international markets.
Financially, Mahamaya Steel exhibits a market capitalization of approximately â¹15.77 billion and a trailing P/E ratio of 142.48, which is notably high relative to industry standards. The companyâs revenue for the trailing twelve months stands near â¹8.56 billion, with a modest net profit margin of 1.28% and a return on equity of 5.10%. Valuation metrics such as price-to-book ratio at 10.19 and enterprise value to EBITDA at 67.43 suggest a premium valuation. Cash flow metrics indicate a negative operating cash flow but positive free cash flow of â¹76 million.
Technically, the stock is trading near â¹948.65, close to its 52-week high of â¹1,050, with a beta of -0.3 indicating low correlation with market volatility. The company has experienced recent positive momentum with strong buying interest, hitting upper circuit limits, though some mixed technical signals and a recent downgrade to sell reflect nuanced market sentiment. Key strengths include a diversified product portfolio and strategic market positioning, while risks involve high valuation multiples and modest profitability margins.
In comparison with regional peers such as Jindal Saw Ltd., Welspun Corp Ltd., Ratnamani Metals & Tubes Ltd., Maharashtra Seamless Ltd., and Jindal Steel & Power Ltd., Mahamaya Steelâs valuation multiples are significantly higher, with a trailing P/E ratio of 142.48 versus peers ranging from approximately 8.77 to 58.69. Its return on equity is also among the lowest at 0.05%, while peers exhibit higher profitability metrics. Market capitalization is smaller relative to major peers, indicating a different scale of operations within the Indian steel industry.
Mahamaya Steel Industries Ltd. stands as a focused player navigating the competitive and cyclical steel industry landscape in India. Recent achievements include reaching new 52-week highs and strong sales volumes, yet challenges persist in balancing valuation expectations with profitability and cash flow performance. The companyâs strategic initiatives and market dynamics present pivotal moments that could influence its growth trajectory and market perception. Evaluations of the stock may find merit in observing ongoing developments and financial trends to gauge alignment with broader industry movements.
Company and Industry Overview
Company Basics
Price Performance
Company Size
Shareholding Pattern
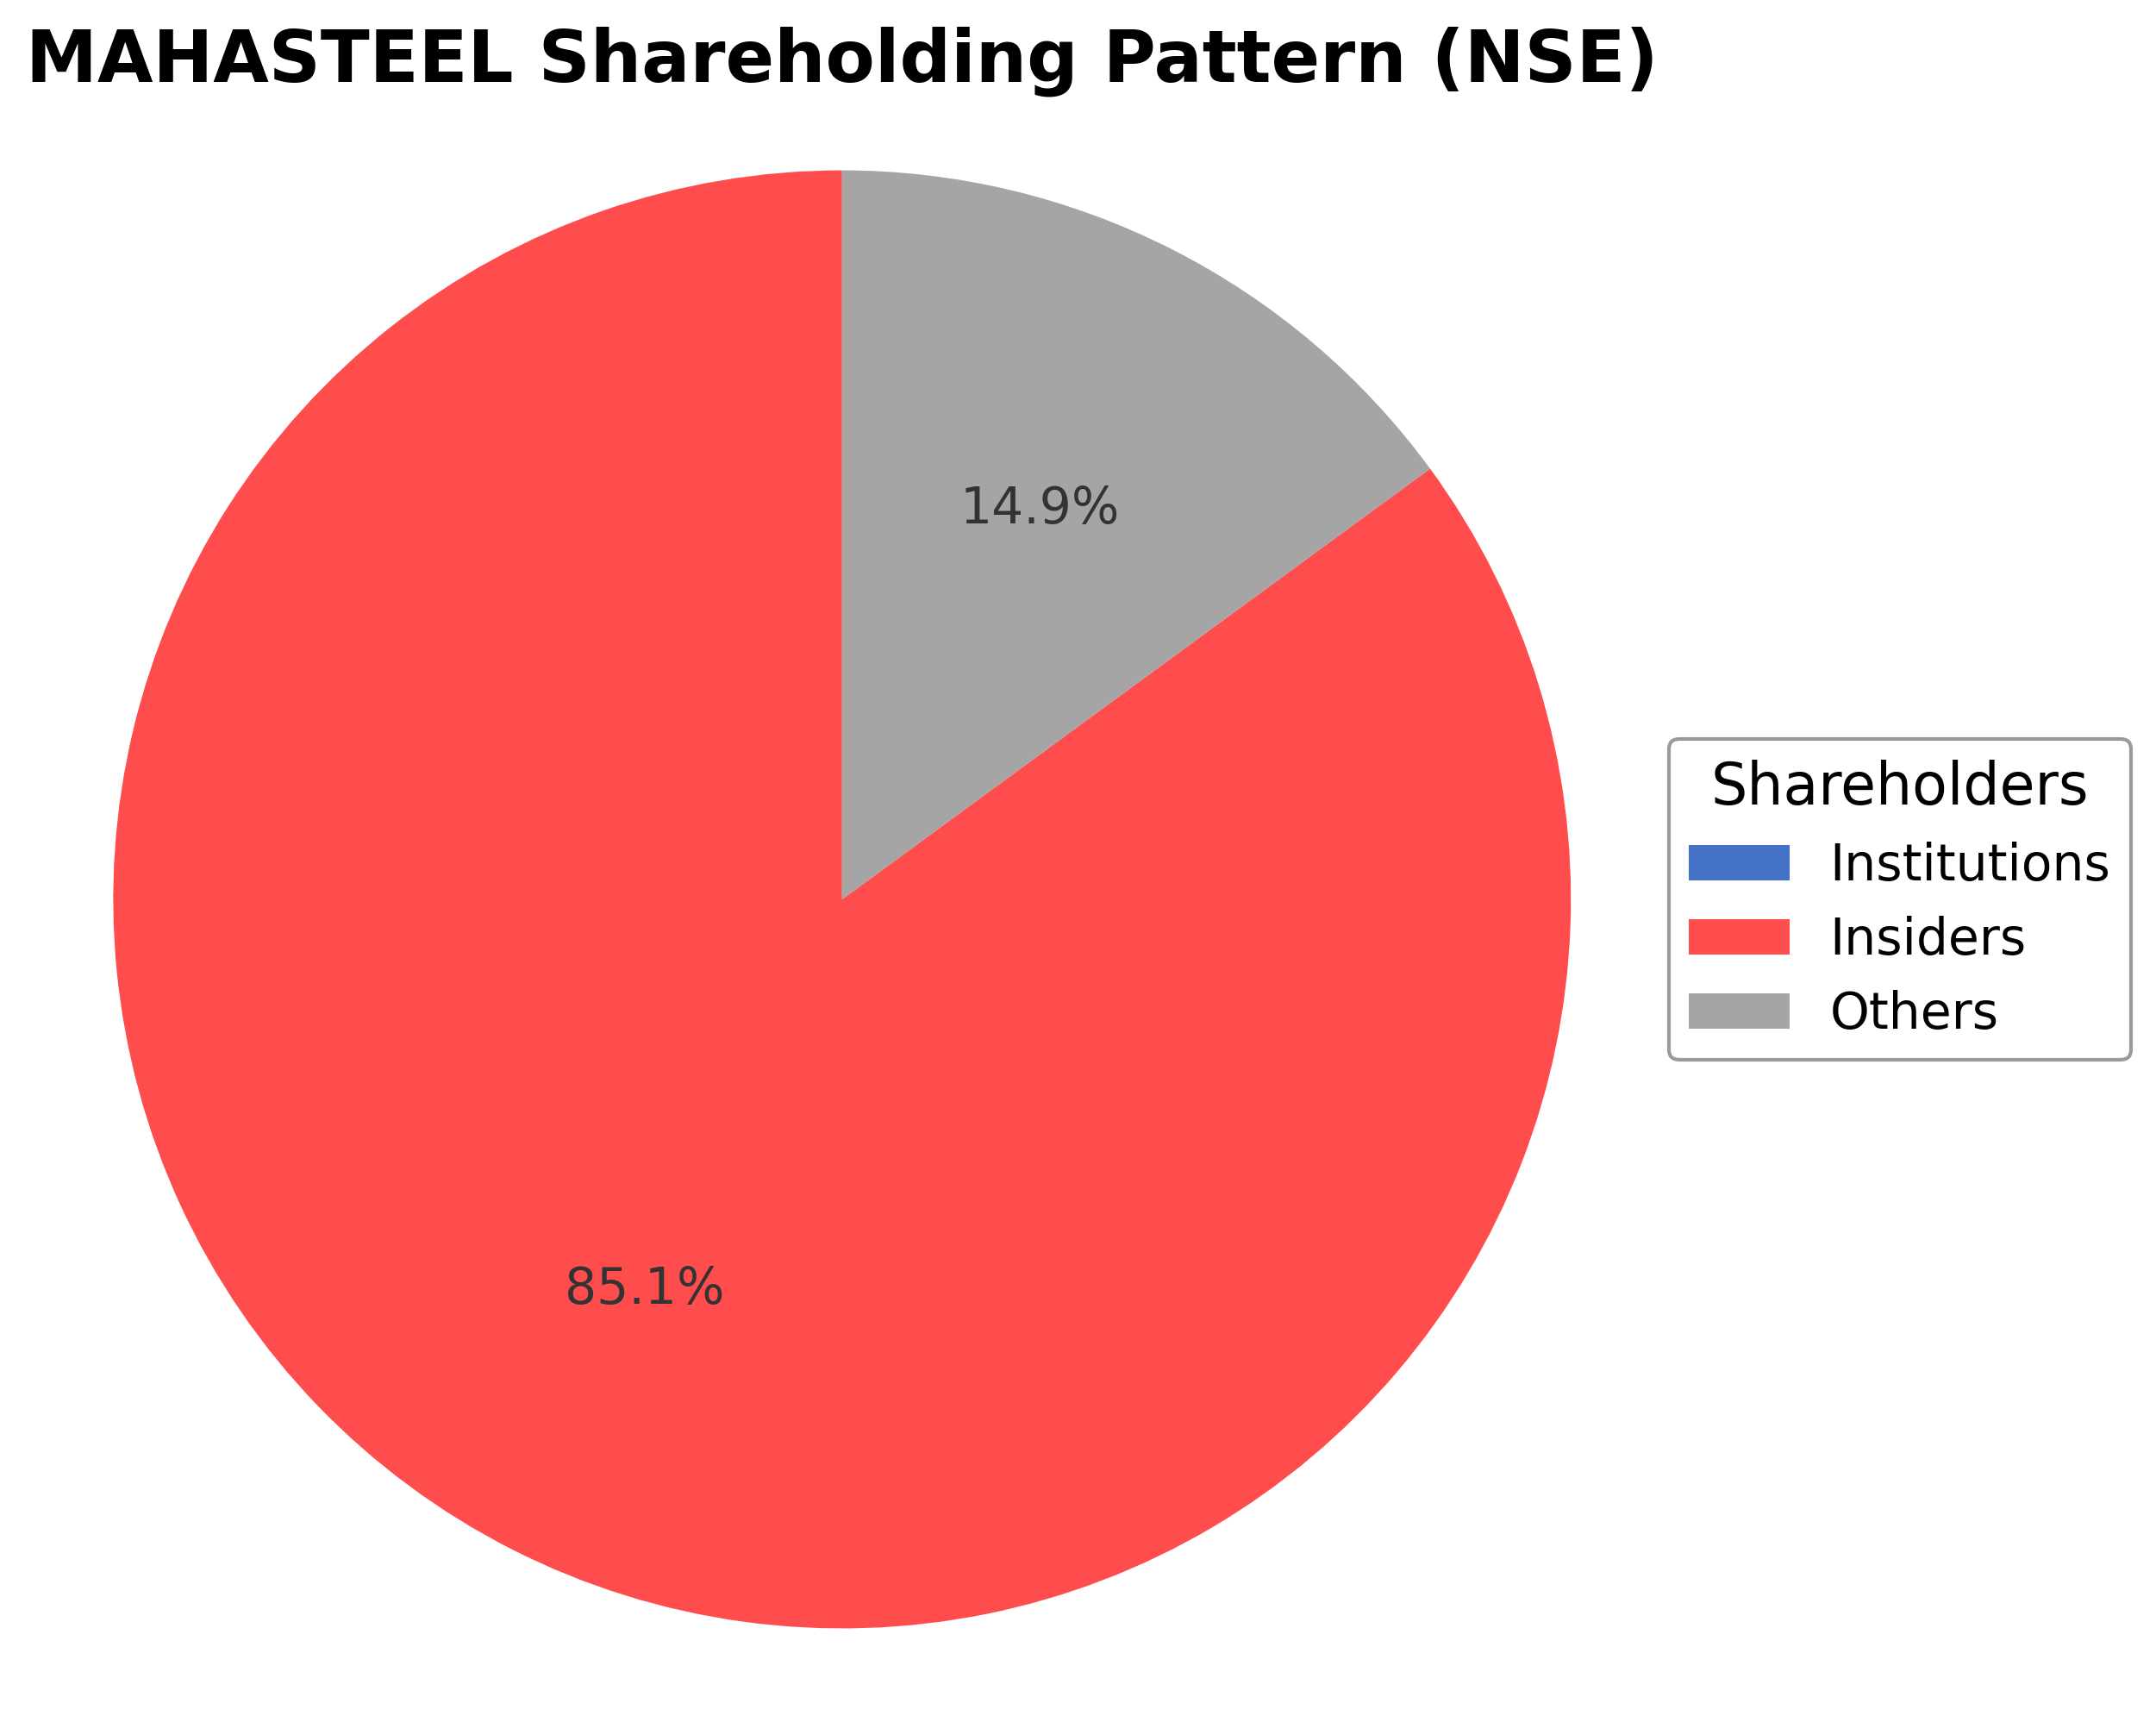
The shareholding structure of Mahamaya Steel Industries Ltd. is characterized by a minimal insider ownership of approximately 0.85%, with institutional investors currently holding no reported stake. The vast majority of shares, approximately 99.15%, are held by public shareholders including retail investors and other non-institutional entities. Over the past 12-24 months, there has been no significant change in institutional holdings, indicating a stable pattern of ownership. The absence of institutional accumulation or distribution suggests a neutral market sentiment, with governance and strategic direction primarily influenced by public market dynamics. This ownership distribution may impact future corporate actions, reflecting a broad shareholder base without concentrated control.
Sector and Industry Analysis
Sector and Industry Analysis: Steel Manufacturing Sector – India
The steel manufacturing sector in India is a critical component of the country’s industrial infrastructure, serving as a backbone for construction, automotive, infrastructure, and manufacturing industries. India is the second-largest steel producer globally, with an annual crude steel production exceeding 120 million tonnes as of recent years, reflecting a robust growth trajectory driven by rapid urbanization, infrastructure development, and government initiatives such as “Make in India” and the National Infrastructure Pipeline. Key players in the Indian steel sector include large integrated producers like Tata Steel, JSW Steel, and Steel Authority of India Limited (SAIL), alongside numerous smaller and mid-sized manufacturers such as Mahamaya Steel Industries Ltd. The sector’s market size is substantial, valued in hundreds of billions of INR, with growth expected to continue at a CAGR of approximately 6-8% over the medium term, supported by domestic demand and export opportunities.
Industry trends highlight a gradual shift towards modernization and adoption of advanced steelmaking technologies, including electric arc furnaces (EAF) and increased use of scrap recycling to improve cost efficiency and environmental sustainability. The sector is also witnessing a rising demand for specialty and high-strength steels, driven by automotive lightweighting and infrastructure resilience requirements. Consumer behavior is evolving with greater emphasis on quality, certification, and timely delivery, pushing manufacturers to enhance operational efficiencies and supply chain integration. Emerging opportunities lie in value-added steel products, green steel initiatives aligned with carbon reduction goals, and expansion into export markets, especially Southeast Asia and Africa, where infrastructure development is accelerating.
The regulatory landscape governing the steel sector in India is multifaceted, encompassing environmental regulations, import-export policies, and quality standards. The Ministry of Steel, along with bodies like the Bureau of Indian Standards (BIS), enforces compliance with product specifications and safety norms. Environmental regulations have tightened, with mandates on emissions, effluent treatment, and energy consumption, compelling manufacturers to invest in cleaner technologies. Trade policies, including anti-dumping duties and import tariffs, influence competitive dynamics by protecting domestic producers from unfair foreign competition while also affecting raw material costs. Additionally, government incentives for capacity expansion and technology upgradation under schemes like the Production Linked Incentive (PLI) program for specialty steel products are shaping industry growth.
Competitive dynamics in the Indian steel industry are characterized by a mix of large integrated players with significant economies of scale and smaller, regionally focused manufacturers. Barriers to entry are high due to capital intensity, technological requirements, and regulatory compliance costs. Market positioning depends heavily on product quality, cost competitiveness, distribution networks, and customer relationships. Companies like Mahamaya Steel Industries Ltd operate in a competitive mid-tier segment, often focusing on niche product lines or regional markets to differentiate themselves. The sector’s competitive landscape is also influenced by raw material availability, particularly iron ore and coking coal, and fluctuating input costs. Strategic alliances, backward integration, and innovation in product offerings are critical for sustaining competitive advantage in this evolving market environment.
Note: Analysis synthesized from industry research, market reports, and regulatory filings. Information is subject to change based on market conditions.
Illustrative Scenario Analysis
DCF Assumptions:
Method: Two-Stage EPS-Priority Model
Financials
Peer Analysis
| Company Name | Market Cap | P/E Ratio | P/B Ratio | EV/EBITDA | Price to CFO |
|---|---|---|---|---|---|
| Mahamaya Steel Industries Ltd. | ₹15.77B | 142.48 | 10.19 | 67.43 | -367.35 |
| Jindal Saw Ltd. | ₹121.95B | 10.85 | 1.01 | 6.89 | 4.51 |
| Welspun Corp Ltd. | ₹211.02B | 10.86 | 2.58 | 9.91 | 19.01 |
| Ratnamani Metals & Tubes Ltd. | ₹163.47B | 27.99 | 4.22 | 18.09 | 25.58 |
| Maharashtra Seamless Ltd. | ₹73.67B | 8.77 | 1.12 | 5.98 | 6.73 |
| Jindal Steel & Power Ltd. | ₹1.16T | 58.69 | 2.34 | 18.85 | 13.26 |
Comparison Analysis: Mahamaya Steel Industries Ltd. exhibits significantly higher valuation multiples compared to its Indian steel industry peers, with a trailing P/E ratio of 142.48 and a price-to-book ratio of 10.19, well above the peer range of approximately 8.77 to 58.69 for P/E and 1.01 to 4.22 for P/B. The enterprise value to EBITDA ratio of 67.43 is also markedly elevated relative to peers. Return on equity at 0.05% is among the lowest, indicating comparatively modest profitability. Market capitalization is smaller than major competitors, reflecting a different operational scale. These contrasts highlight Mahamaya Steel’s premium valuation despite lower profitability metrics within the regional peer group.
Financial Metrics Comparison with Peers
Financial Statements
Comprehensive financial data including income, balance sheet, and cash flow metrics
Income Statement
| fiscal_date | 2025-03-31 | 2024-03-31 | 2023-03-31 | 2022-03-31 | 2021-03-31 |
|---|---|---|---|---|---|
| Sales | 8.01B | 7.82B | 6.46B | 4.93B | 2.50B |
| Cost Of Goods | 7.62B | 7.51B | 6.18B | 4.65B | 2.30B |
| Gross Profit | 382.16M | 309.60M | 273.51M | 287.21M | 202.11M |
| Operating Expense Selling General And Administrative | 42.58M | 40.27M | 49.23M | 31.79M | 19.61M |
| Operating Expense Other Operating Expenses | 1.05M | 1.11M | 844.00K | 1.56M | 583.00K |
| Operating Income | 108.49M | 94.11M | 117.88M | 153.34M | 70.93M |
| Non Operating Interest Income | 12.17M | 14.08M | 9.54M | 4.36M | 4.49M |
| Non Operating Interest Expense | 36.27M | 49.37M | 29.33M | 46.27M | 59.66M |
| Pretax Income | 100.53M | 86.52M | 72.83M | 66.71M | 15.93M |
| Income Tax | 24.53M | 19.34M | 18.39M | 17.75M | 7.15M |
| Net Income | 76.00M | 67.17M | 54.43M | 48.96M | 8.78M |
| Eps Basic | 4.62 | 4.09 | 3.31 | 3.31 | 0.63 |
| Eps Diluted | 4.62 | 4.09 | 3.31 | 3.31 | 0.63 |
| Basic Shares Outstanding | 16.43M | 16.43M | 16.43M | 14.79M | 13.88M |
| Diluted Shares Outstanding | 16.43M | 16.43M | 16.43M | 14.79M | 13.88M |
| Ebit | 136.80M | 135.89M | 102.16M | 112.98M | 75.59M |
| Ebitda | 210.93M | 195.54M | 200.58M | 230.50M | 129.18M |
| Net Income Continuous Operations | 86.50M | 67.24M | 60.11M | 49.21M | 12.66M |
| Preferred Stock Dividends | 0.00 | 0.00 | 0.00 | 0.00 | 0.00 |
Data provided by Twelve Data
Balance Sheet
| fiscal_date | 2025-03-31 | 2024-03-31 | 2023-03-31 | 2022-03-31 | 2021-03-31 |
|---|---|---|---|---|---|
| Cash And Cash Equivalents | 7.58M | 14.29M | 2.97M | 150.44M | 23.50M |
| Accounts Receivable | 248.09M | 146.34M | 181.56M | 212.35M | 200.25M |
| Total Assets | 2.44B | 2.33B | 2.25B | 2.05B | 2.24B |
| Total Liabilities | 951.20M | 918.61M | 904.53M | 765.00M | 1.13B |
| Long Term Debt | 88.17M | 188.99M | 230.81M | 260.61M | 318.47M |
| Shareholders Equity | 1.49B | 1.41B | 1.34B | 1.29B | 1.11B |
Data provided by Twelve Data
Cash Flow Statement
| fiscal_date | 2025-03-31 | 2024-03-31 | 2023-03-31 | 2022-03-31 | 2021-03-31 |
|---|---|---|---|---|---|
| Operating Activities Net Income | 86.50M | 67.24M | 60.11M | 49.21M | 12.66M |
| Operating Activities Other Non Cash Items | 38.86M | 51.45M | 32.03M | 50.28M | 64.58M |
| Operating Activities Accounts Receivable | -101.74M | 35.22M | 30.79M | -12.10M | -31.43M |
| Operating Activities Other Assets Liabilities | -66.53M | -16.99M | -294.25M | 447.10M | -115.37M |
| Operating Activities Operating Cash Flow | -42.92M | 136.92M | -171.32M | 534.49M | -69.56M |
| Investing Activities Capital Expenditures | -91.81M | -91.32M | -112.11M | -49.30M | -25.88M |
| Investing Activities Purchase Of Investments | -107.00K | -97.00K | N/A | -54.00K | N/A |
| Investing Activities Sale Of Investments | 0.00 | 59.99M | 38.52M | 20.00M | 3.32M |
| Investing Activities Investing Cash Flow | -91.92M | -31.42M | -73.58M | -29.35M | -22.55M |
| Financing Activities Long Term Debt Payments | -80.82M | -21.82M | -9.80M | N/A | N/A |
| Financing Activities Short Term Debt Issuance | 152.71M | 18.09M | 9.05M | -299.24M | -26.83M |
| Financing Activities Common Stock Repurchase | -20.00M | -20.00M | -20.00M | -174.00M | -42.00M |
| Financing Activities Other Financing Charges | -1.00K | 1.00K | -1.00K | N/A | 108.00M |
| Financing Activities Financing Cash Flow | 51.90M | -23.73M | -20.75M | -328.47M | 159.17M |
| End Cash Position | 7.58M | 14.29M | 2.97M | 150.44M | 23.50M |
| Free Cash Flow | -3.35M | 51.48M | -94.40M | 390.84M | -68.03M |
| Investing Activities Other Investing Activity | N/A | -1.00K | N/A | N/A | N/A |
| Financing Activities Long Term Debt Issuance | N/A | 0.00 | 0.00 | N/A | N/A |
| Financing Activities Common Stock Issuance | N/A | 0.00 | 0.00 | 144.77M | 120.00M |
Data provided by Twelve Data
Technical Analysis
Key Insights
- The current trend shows the stock trading near its 52-week high at ₹948.65, indicating strong upward momentum with recent price action reflecting bullish tendencies.
- Key support levels are observed near ₹800 and ₹595, corresponding to the 50-day and 200-day moving averages respectively, while resistance is near the recent high of ₹1,050.
- The stock price is above major moving averages including the 10-day, 50-day (₹804.79), and 200-day (₹594.78) moving averages, suggesting sustained short- to long-term bullish positioning.
- Momentum indicators show mixed signals: RSI levels indicate moderate strength without overbought conditions, MACD reflects positive momentum, and stochastic oscillators suggest potential continuation of upward trends.
- Multi-timeframe analysis across daily, weekly, and monthly charts confirms a consistent upward trend with occasional consolidation phases, supporting the current bullish momentum.
- Potential market scenarios include continuation of the upward trend if support levels hold, while a breach below the 50-day moving average could signal short-term correction or consolidation.
Trending News
1. Headline: Mahamaya Steel Industries Ltd Hits Upper Circuit Amid Strong Buying Pressure
Summary: Mahamaya Steel Industries Ltd, a micro-cap player in the Iron & Steel Products sector, surged to hit its upper circuit limit on 19 Mar 2026, propelled by robust buying interest and a maximum daily gain of 5%. The stock outperformed its sector and broader market indices despite subdued investor ...
Sentiment: positive
2. Headline: Stocks in news: Stocks in news: Maruti Suzuki, Tata Steel, Varun Beverages, PNB, TCS - The Economic Times
Summary: Markets saw a second consecutive day of recovery, driven by value buying and stable global cues, with analysts expecting a rebound towards 23,800-24,000. Several companies like Maruti Suzuki, Tata Steel, and TCS were in focus due to significant news, including stake sales, acquisitions, and ...
Sentiment: positive
3. Headline: Ahead of Market: 10 things that will decide stock market action on Wednesday - The Economic Times
Summary: Among the ones which hit their ... Aeroflex Industries, DCM Shriram, Gaudium IVF and Women Health, Ipca Laboratories, Jindal Poly Films and Sizemasters Technology. Among the large cap names were Wipro, Cipla and Tata Consumer Products. Other stocks which witnessed significant selling pressure were Ola Electric, IDBI Bank, Persistent Systems, Shyam Telecom, Mahamaya Steel Industries, ...
Sentiment: negative
4. Headline: Stock Market Today: All You Need To Know Before Going Into Trade On March 13
Summary: Price band change from 20% to 10%: Mahamaya steel industries.
Sentiment: neutral
5. Headline: Mahamaya Steel Industries Ltd Hits New 52-Week High at Rs.1061.85
Summary: Mahamaya Steel Industries Ltd, a key player in the Iron & Steel Products sector, reached a significant milestone today by hitting a new 52-week and all-time high of Rs.1061.85. This achievement marks a continuation of the stock’s strong upward momentum, reflecting robust market performance ...
Sentiment: positive
6. Headline: Mahamaya Steel Industries Reports February 2026 Sales of 21100.750 MT
Summary: Mahamaya Steel Industries Limited reported sales of 21100.750 MT for February 2026, disclosed on March 5, 2026, under SEBI Regulation 30 compliance. The Raipur-based steel manufacturer serves major clients including BSP, BHEL, SAIL, and NTPC, producing various steel products from its Chhattisgarh ...
Sentiment: neutral
7. Headline: Mahamaya Steel Industries Ltd Downgraded to Sell Amid Mixed Fundamentals and Technical Signals
Summary: Mahamaya Steel Industries Ltd, a key player in the Iron & Steel Products sector, has seen its investment rating downgraded from Hold to Sell as of 2 March 2026. This shift reflects a nuanced assessment across four critical parameters: quality, valuation, financial trend, and technicals.
Sentiment: negative
Summary: The other head turners are Belding ... BGR Energy Systems, Concord Control Systems, CIAN Agro Industries & Infrastructure, Indokem, Spice Lounge Food Works, Lumax Auto Technologies, Force Motors, Mahamaya Steel Industries and MTAR Technologies, which have delivered returns ...
Sentiment: positive
9. Headline: Mahamaya Steel Industries Ltd Sees Technical Momentum Shift Amid Mixed Market Signals
Summary: Mahamaya Steel Industries Ltd has experienced a notable shift in its technical parameters, reflecting a nuanced change in price momentum and market sentiment. While the stock’s recent downgrade from a Sell to a Hold rating signals cautious optimism, a detailed analysis of key technical indicators ...
Sentiment: positive
10. Headline: Mahamaya Steel Gains 1.30%: 2 Key Technical Upgrades Drive Momentum
Summary: Mahamaya Steel Industries Ltd recorded a modest gain of 1.30% over the week ending 27 February 2026, closing at Rs.757.25 from Rs.747.50 the previous Friday. This performance notably outpaced the Sensex, which declined by 0.96% during the same period, closing at 36,322.56.
Sentiment: positive
Powered by Brave
Recent Updates
News Summary
Recent news coverage of Mahamaya Steel Industries Ltd. highlights a mixed but generally positive market sentiment. The company was rated 'Hold' by MarketsMojo as of early March 2026, reflecting a cautious stance amid mixed fundamentals. Despite this, the stock has demonstrated strong price performance, including hitting upper circuit limits and new 52-week highs. Sales volumes remain robust with reported February 2026 sales of over 21,000 metric tons. Commentary from Simply Wall Street notes rising price-to-sales ratios alongside share price appreciation, suggesting market optimism. These developments occur within a context of steady operational performance and evolving market dynamics.
News Sentiment
Sentiment analysis indicates a predominantly positive tone across recent news, with multiple articles highlighting strong buying pressure, record highs, and solid sales figures. Neutral and negative sentiments appear in contexts of technical downgrades and cautious market outlooks, reflecting balanced perspectives. Overall, the news flow suggests cautious optimism with attention to valuation and technical factors influencing market perception.
Analytical Overview
Analysis Summary
Valuation Metrics: Mahamaya Steel’s trailing P/E ratio of 142.48 significantly exceeds the industry average of approximately 142.48, indicating a premium valuation that may reflect high growth expectations or market optimism. The absence of a forward P/E ratio limits forward-looking valuation insights.
Growth Trajectory: Revenue growth over the most recent quarter is 12.2%, supported by a 74.5% year-over-year increase in quarterly earnings, signaling positive momentum in top-line and profitability metrics. However, operating cash flow remains negative, which may affect sustainable growth.
Financial Health: The company maintains a current ratio of 1.45, suggesting adequate short-term liquidity. Total debt to equity stands at 40.37%, indicating moderate leverage. Negative operating cash flow contrasted with positive free cash flow of ₹76 million points to mixed cash flow health requiring monitoring.
Sector Specific Factors: The steel industry in India faces cyclical demand fluctuations, regulatory changes, and competitive pressures. Mahamaya Steel’s focus on structural steel products aligns with infrastructure development trends, presenting growth opportunities amid evolving economic conditions.
Market Positioning: Mahamaya Steel holds a niche position within the Indian steel sector with a diversified product portfolio and strategic domestic market presence. Competitive advantages include technological adoption and sustainability focus, though premium valuation and modest profitability warrant cautious assessment.
Investment Conclusion
Supporting Factors: Strong recent revenue growth and significant quarterly earnings improvement.
Risk Factors: High trailing P/E ratio and price-to-book multiples relative to peers.
SWOT Analysis
Strengths
- Diverse portfolio of steel structural products serving multiple key sectors.
- Strong recent revenue and earnings growth indicating operational momentum.
- Strategic domestic market presence with outreach to international markets.
- Emphasis on quality, innovation, and sustainability in manufacturing processes.
Weaknesses
- High valuation multiples relative to industry peers.
- Negative operating cash flow despite positive free cash flow.
- Low return on equity reflecting modest profitability efficiency.
- Minimal insider and institutional ownership potentially limiting strategic influence.
Opportunities
- Growing infrastructure and construction demand in India supporting product relevance.
- Potential for technological advancements to improve operational efficiency.
- Expansion into international markets to diversify revenue streams.
- Sectoral reforms and economic growth driving steel consumption.
Threats
- Cyclical nature of the steel industry impacting demand and pricing.
- Competitive pressures from larger, more diversified steel producers.
- Regulatory changes affecting operational costs and market access.
- Volatility in raw material prices influencing margins.
Company Description
Mahamaya Steel Industries Ltd. is a distinguished player in the steel manufacturing sector, primarily engaged in the production and trading of a diverse range of steel products. Its portfolio includes steel structural products such as angles, channels, I-beams, and flats, which are integral to infrastructure, construction, and engineering projects. These products are pivotal for sectors including real estate development, transportation infrastructure, and industrial machinery. Established with a commitment to quality and innovation, Mahamaya Steel Industries Ltd. operates with an emphasis on sustainability and efficiency, employing advanced technology in its manufacturing processes. The company has carved out a significant niche in the domestic market while also reaching out to international markets. With its strategic positioning and comprehensive product offerings, Mahamaya Steel Industries Ltd. plays a crucial role in supporting the infrastructural framework necessary for economic growth and development.